Fundamentals of Data Analysis
Lecture 8ANOVA
pt.2

Multifactors design
With that issue we are dealing eg. in the case of alloy hardness test, which consists of two metals A and B, and their contents in the alloy determines the hardness.
We therefore divide our observations into r classes due to the characteristics of the value of A and p Classes due to the characteristics of the value of B. All observations are therefore divided into rp groups.
On the example of two factors design

Multifactors designOn the example of two factors design
For this model, we verify the hypothesis :
1. of equality of mean values for all rp populations:
H0: mij = m dla i = 1, ..., r; j = 1, ..., p.
2.of equality of all the average values mi of studied features
treated of A with r variants, excluding the impact of factor B:
H0: m1. =... = mr. dla i = 1, ..., r.
3. of equality of all the average values mi of studied features
treated of B with p variants, excluding the impact of factor A:
H0: m.1 =... = m.p dla j = 1, ..., p.
4. that the deviation of the mean value mij from the total value
of the average m is equal to the sum of effects of factor A and
factor B:
H0: mij - m = (mi. - m) + (m.j - m).

Two factors design
From three different departments of a university were drawn at l = 4 students from each year of study, and calculated the mean ratings obtained by each student in the last semester. The obtained results are shown in Table :
Example
Year Department
A B C
I 3.6, 4.1, 3.1, 2.4 3.1, 2.5, 3.3, 3.8 2.7, 4.2, 2.9, 3.7
II 2.8, 4.3, 3.8, 3.0 3.9, 2.6, 3.2, 3.3 3.0, 4.4, 3.9, 3.1
III 3.2, 4.1, 4.8, 4.0 3.4, 2.9, 4.1, 2.8 4.0, 3.3, 3.4, 3.0
IV 3.2, 3.9, 4.2, 3.6 3.6, 4.4, 2.8, 2.9 3.7, 5.0, 2.6, 3.4
V 4.0, 4.0, 3.5, 3.8 4.0, 3.0, 4.5, 3.7 3.0, 3.8, 4.8, 3.5

Two factors design
Example
Year Department
A B C
I 3.6, 4.1, 3.1, 2.4 3.1, 2.5, 3.3, 3.8 2.7, 4.2, 2.9, 3.7
II 2.8, 4.3, 3.8, 3.0 3.9, 2.6, 3.2, 3.3 3.0, 4.4, 3.9, 3.1
III 3.2, 4.1, 4.8, 4.0 3.4, 2.9, 4.1, 2.8 4.0, 3.3, 3.4, 3.0
IV 3.2, 3.9, 4.2, 3.6 3.6, 4.4, 2.8, 2.9 3.7, 5.0, 2.6, 3.4
V 4.0, 4.0, 3.5, 3.8 4.0, 3.0, 4.5, 3.7 3.0, 3.8, 4.8, 3.5
Assuming that the average grades obtained by the students have a normal distributions with the same variance at the confidence level α= 95% verify the following hypotheses:
a) the average values of average grades for students of different departments are the same;
b) the average value of average grades for differernt years of study are the same;
c) the average value of the average grades for the first two years are the same.

Two factors design
In that case we have r = 3 (Departments) and p = 5 (number of years of study). After calculations we get the results shown in the table :
Example
p r Sum
1 2 3
1 3.300 3.175 3.375 3.283
2 3.475 3.259 3.600 3.342
3 4.025 3.300 3.425 3.583
4 3.725 3.675 3.674 3.692
5 3.825 3.800 3.775 3.800
Sum 3.670 3.440 3.568 3.550

Two factors design
Example
Then compute the sum of squared deviations:
qA = 0.5365, for df = 2, then qA /df = 0.26815 qB = 2.3797 df = 4 qB /df = 0.59492 qAB = 0.06980 df = 8 qAB /df = 0.00872 qR = 18.4050 df = 45 qR /df = 0.4090 q = 21.3908 df = 59
F-statistics calculated on this basis, have the following values: FA = 0.26815 / 0.4090 = 0.6556 FB = 0.59492 / 0.4090 = 1.4546
For the third hipothesis we must calculate new mean value:x = 3.4 and qC = 0.24 (df = 1)qR = 7.95 (df = 22)FC = 0.2400/0.3614 = 0.6641

Two factors design
Example
Critical values:
FAcr = 3.20 > FA
There is no reason to reject the null hypothesis
FBcr = 2.58 > FB
There is no reason to reject the null hypothesis
FCcr = 4.30 > FC
There is no reason to reject the null hypothesis

Two factors design
Exercise
Each of the three varieties of potatoes was cultivated on 12 parcels of the same size and type. Parcels were divided into four groups of three parcels, and for each group a different type of fertilizer was used. Yields for these plots are shown in Table
At the confidence level 95% verify the following hypotheses:A) The values of the average yield for the different
varieties of potatoes are dependent on the applied fertilizer
B) The values of the average yields for the different fertilizers do not differ regardless of potato variety
Potato variety
Type of fertilizer
1 2 3 4
123
5.6, 6.1, 5,95.7, 4.9, 5.16.3, 6.1, 6.3
6.6, 6.7, 6.66.5, 6.7, 6.66.5, 6.4, 6.2
7.7, 7.3, 7.46.9, 7.1, 6.56.6, 6.6, 6.8
6.3, 6.4, 6.36.6, 6.7, 6.76.1, 6.1, 6.0
Latin square design
During Latin sQuare design (LQ) experimental items are classified in terms of the classification of three directions: rows, columns, and objects. Experimental factor A presented at p levels (contains p objects), each of which occurs exactly once in the corresponding row and column.

Latin square design
1. We calculate the correction factor:
2. We calculate the sum of squares for rows
x
rp
ijkijk
2
x
rp
ijkijk
2
rp
x
Cijk
ijk
2
Cp
xSSR i
i
2
..
Latin square design
and the mean square for rows
3. We calculate the sum of squares for columns
rowdf
SSRMSR
Cr
x
SSC jj
2
..

Latin square design
and the mean square for columns
4. calculate the sum of squares for the factors
coldf
SSCMSC
Cr
xSST k
k
2
..

Latin square design
and the mean square for factors
5. calculate the total sum of squares
tdf
SSTMST
CxSSijk
ijk 2

Latin square design
6. and the residual sum of squares
SSE = SS - SSR - SSC - SST
7. mean square residual
errordf
SSEMSE

Latin square design
8. and calculate statistics
FMSR
MSErow
FMSC
MSEcol
FMST
MSEtr

Latin square design
Example In the experiment, on the fertilization of fields used are the following factors (fertilizers): A - (NH4 )2 SO4 , B - NH4NO3, C - CO(NH2)2, D - Ca(NO3)2, E - NaNO3, F - NoN (non-fertilized). Fertilizers are used in equal doses (in g/m2).
In the first stage the draw was performed of suitable Latin square 6x6 (since we have 6 factors) and the result is shown in table:
4 2 5 1 3 6
1 B D E F A C
3 C E A D F B
5 A F C B E D
4 D A F C B E
2 F B D E C A
6 E C B A D F

Latin square design
ExampleThe results of the experiment as planned (achieved yields of sugar beet) are presented in Table
I II III IV V VI xijj
I F
28.2
D
29.1
A
32.1
B
33.1
E
31.1
C
32.4
186.0
II E
31.0
B
29.5
C
29.4
F
24.8
D
33.0
A
30.6
178.3
III D
30.6
E
28.8
F
21.7
C
30.8
A
31.9
B
30.1
173.9
IV C
33.1
A
30.4
B
28.8
D
31.4
F
26.7
E
31.9
182.3
V B
29.9
F
25.8
E
30.3
A
30.3
C
33.5
D
32.3
182.1
VI A
30.8
C
29.7
D
27.4
E
29.1
B
30.7
F
21.4
169.1
xiji
183.6 173.3 169.7 179.5 186.9 178.7 x
ij
1071 7.
Latin square design
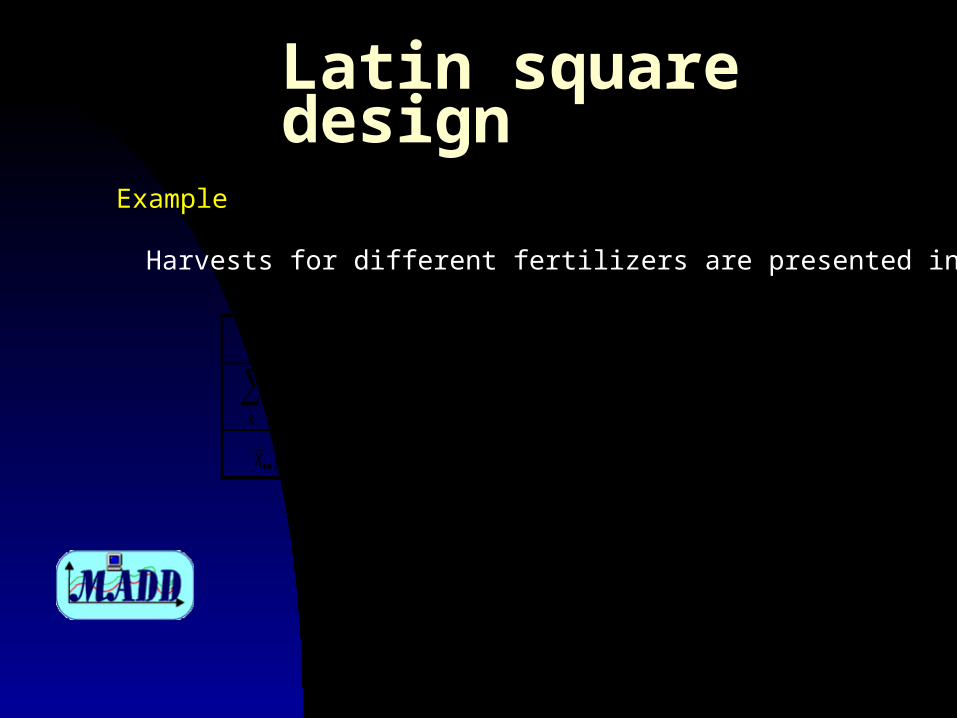
Example
Harvests for different fertilizers are presented in Table.
Factor A B C D E F
x k
k
186.1 182.1 188.9 183.8 182.2 148.6
x k 31.0 30.4 31.5 30.6 30.4 24.8

Latin square design
Example
Degree of freedom:
total dftot = pr - 1 = 35for rows dfrow = r - 1 = 5for columns dfcol = p - 1 = 5for factors dftr = n - 1 = 5for error dferror = (r-1)(p-1) - (n-1) = 35 - 5 - 5 - 5 = 20.

Latin square design
Example
91,31903
2
rp
x
Cijk
ijk
19,32
2..
Cp
x
SSR ii
438,6rowdf
SSRMSR
67,33
2..
Cr
x
SSC jj
734,6coldf
SSCMSC

Latin square design
Example
A further step in the analysis of our data is the separation of variables (averages). Based on the result of our experiment, we can answer a number of questions:
1) Whether fertilization can effect on crop growth (excreted factor F)?2) Is organic fertilizer better than inorganic?3) Is NH4-N better than NO3-N ?4) Is (NH4)2SO4 better than NH4NO3 ?5) Is Ca(NO3) better than NaNO3 ?
Such questions may of course be more, depending on the factors or groups of factors we want to compare.
Latin square design
Example
Factor NoN (NH4)2SO
4
NH4NO3 CO(NH2)2 CA(NO3)2 NaNO3
Comparison x..k 148.6 186.1 182.1 188.9 183.8 182.2
NoN - N +5 -1 -1 -1 -1 -1
Organic-non-organic. 0 -1 -1 +4 -1 -1
NH4-N - NO3N 0 +1 +1 0 -1 -1
(NH4)2SO4 - NH4NO3 0 +1 -1 0 0 0
Ca(NO3)2 - NaNO3 0 0 0 0 +1 -1
The results after the separation of values

Latin square design
ExampleThe results after the separation of values
Źródło odchyleń df SSobs MSobs F Fkr
czynniki 5 185.77 37.15 24.56 2.71
NoN-N 1 180.20 180.20 119.10 4.35
Organ. - Nieorgan. 1 3.816 3.816 2.52 4.35
NH4-N - NO3N 1 0.202 0.202 0.13 4.35
(NH4)2SO4 - NH4NO3 1 1.334 1.334 0.88 4.35
Ca(NO3)2 - NaNO3 1 0.213 0.213 0.14 4.35
reszta 20 30.25 1.513

Latin square design
ExampleOnly when comparing the results for the test "without fertilizer - with fertilizer" calculated value is greater than the critical value, so there is no reason to reject this hypothesis. In other cases, the choice of the source of deviation is negligible.

Thanks for attention!
Books:• W. Wagner, P. Błażczak, Statystyka
matematyczna z elementami doświadczalnictwa, cz. 2, AR, Poznań 1992.
• T. M. Little, F.J. Hills, Agricultural experimentation. Design and analysis, Wiley and Sons, New York, 1987.
Recommended