Fully Using Agilent High EfficiencyColumns with LC/MS
Technical Overview
Abstract
Advancements in liquid chromatography, such as UHPLC and LC/MS, require that
special care is taken when optimizing method parameters. Various applications will
show the effects of different mobile phases using MS detection with respect to ion
suppression, and how particle size and data collection rates affect MS performance,
with consideration to both sensitivity and peak capacity.
Introduction
New columns with smaller particles sizes, including both sub 2-μm and superficiallyporous 2–3 μm columns, improve LC productivity by providing more resolution andmore analysis speed. The same types of columns can be used for LC/MS applica-tions. Many questions arise on the compatibility of these columns with LC/MS andthe options for increasing productivity. The first questions focus on adequate detec-tor speed with the MS, as well as how fast and how many compounds can be ade-quately resolved for the MS. Additional questions focus on obtaining good peakshape with LC/MS compatible mobile phases. Various application examples will beused to compare columns with different particle sizes and demonstrate that ade-quate detector speed is available to take advantage of the high efficiency possiblewith these columns. Additional considerations around mobile phase and peak shapefor optimal LC/MS results will be shown.

Experimental
An Agilent 1200 Rapid Resolution LC (RRLC) System, an Agilent 1290 Infinity LCSystem, and an Agilent G6410A Triple Quadrupole Mass Spectrometer were used inthis experiment. The MS was used in a variety of modes (including Scan, SIM, MRM)to illustrate the detection improvements possible over a range of analytical methodsutilizing MS detection. All connecting capillaries had a small 0.12 mm id in the short-est possible lengths to ensure minimal loss of efficiency through extra column volumeand sample band broadening. Detailed method parameters are shown with theirrespective chromatograms.
Conditional peak capacity will be used to evaluate the different method parameters.Peak capacity is the number of peaks that can be theoretically separated over a gradi-ent time, see Equation 1.
2
Conditional peak capacity = nc = tR,n – tR,1
W
tR,n and tR,1: Retention times of the last and first eluting peaks
W: W1/2 × 4 (Average 4s peak width)2.35
W1/2: is the average peak width at half height.
Equation 1. Conditional Peak Capacity
Results and Discussion
Different particle sizes with MS detection A common misconception regarding LC/MS is that small particle columns lose theiradvantages over slightly larger particle columns because of sample band broadeningdue to increased extra-column volume with the MS detector. Figure 1 shows thatthis is not the case. While it is true that some of the small particle’s advantages aremuted, they still exist. This example shows a separation of 15 analgesic compoundsanalyzed independently with either UV or MS detection. The detectors are not con-nected in series, as this would immediately put the MS at a disadvantage due toband broadening that would occur in the diode array detector's flow cell as thesample travels through to the MS source. It is shown that when upgrading from a3.5 μm column to a 1.8 μm column, with UV detection, a 37% increase in peakcapacity is realized, however, only a 26% increase in peak capacity is seen with MSdetection. Even though the extra volume in the mass spectrometer neutralizes someof the benefits of smaller particles, there is still a noticeable improvement with thehigh efficiency column.

3
Figure 1. Comparison of 3.5 versus 1.8 μm performance with UV and MS scan detection. Refer toAgilent Publication 5990-8428EN for more information regarding this specific application.
Instrument Agilent 1290/6410 LC/MS/MS
A 0.2% formic acid in water
B acetonitrile
Flow rate 1 mL/min
T 0 1.5
%B 15 95
Stop time 2 min Post run time 1.5 min
Sample 20 μL injection of 1 μg/mL standard in water
TCC Ambient, no temperature control(approx 24 °C)
DAD Sig = 260, 4 nm; Ref = Off
Source ESI+, 350 °C, 12 L/min, 50 psi, 3500 VFragmentor 135 V
Scan 100–400, 5 ms scan time 0.2 amu step, 28.36 cycles/s 35.3 ms/cycle
Compounds (in elution order) with identifying mass:
acetaminophen: m/z 109
caffeine: m/z 194
2-acetamidophenol: m/z 109
acetanilide: m/z 135
acetylsalicylic acid: m/z 120
phenacetin: m/z 179
salicylic acid: m/z 120
sulindac: m/z 356
piroxicam: m/z 332
tolmetin: m/z 257
ketoprofen: m/z 254
diflunisal: m/z 332
diclofenac: m/z 295
celecoxib: m/z 381
ibuprofen: m/z 160
UV Detector MS Detector
min0 0.25 0.5 0.75 1 1.25 1.5 1.75
mAU
100
300
500
700
Agilent ZORBAX RRHD Eclipse Plus C183.0 mm × 100 mm 1.8 μm
mAU
100
300
500
700
Agilent ZORBAX Eclipse Plus C183.0 mm × 100 mm, 3.5 μm
7×10
12 3456
7×10
123456 1
Acquisition time (min)0.2 0.4 0.6 0.8 1.0 1.2 1.4 1.6 1.8
Agilent ZORBAX RRHD Eclipse Plus C183.0 mm × 100 mm, 1.8 μm
Agilent ZORBAX Eclipse Plus C183.0 mm × 100 mm, 3.5 μm
Ave W1/2
= 0.012n
c = 54
Ave W1/2
= 0.0084n
c = 74
Ave W1/2
= 0.012n
c = 54
Ave W1/2
= 0.015n
c = 43Co
unts
Co
unts

Knowing that the advantages of smaller particles can be seen with MS detection,four different particle sizes are compared in Figure 2 with a complex, 25 compound
toxicology analysis using LC/MS/MS. The top chromatogram shows a superficially porous 2.7 μm, while the following three chromatograms show tra itional totally porous particles that are 1.8, 3.5, and 5 μm respectively. The three totally porous particles all share the same bonding chemistry, while the superficially porous particles have very similar chemistry; the result is nearly identical selectivity across the four analyses. Immediately, the disadvantages of the 5 μm column with such a complex analysis are evident. With the 5 μm column, all peaks are much more broad than with the three smaller particle sizes, and there is abundant coelution of peaks, particularly with the early eluting compounds. In this toxicology example, the differences among the 2.7, 1.8, and 3.5 μm columns appear more subtle. The 3.5 μm column produces slightly wider peaks across the gradient, while the 2.7 and 1.8 μm columns are more comparable. The larger 2.7 μm superficially porous columns are capable of similar performance to the smaller 1.8 μm totally porous particles due to their narrower particle size distribution and thin porous
shells with a short mass transfer distance.

5
Figure 2. Comparison of superficially porous 2.7 μm and totally porous 5, 3.5, and 1.8 μm performancewith MS/MS detection. Refer to Agilent Publication 5990-6345EN for more informationregarding this specific application.
Instrument Agilent 1200/6410 LC/MS/MS
A 5 mM ammonium formate w/ 0.01% formic acid
B acetonitrile w/ 0.01% formic acidFlow rate 0.5 mL/min
T 0 0.5 3.0 4.0 6.0
%B 10 15 50 95 95
Stop time 6 min
Post run time 2 min
Sample 5 μL injection of Agilent LC/MS Toxicology TestMixture (p/n 5190-0470), diluted 1:10 in water
TCC 60 °C
MS 350 °C, 12 L/min, 30 psi, 2000 V, AP-ESI+, dMRM
Compounds in elution order:
codeine
oxycodone
amphetamine
MDA
hydrocodone
methamphetamine
MDMA
strychnine
phentermine
MDEA
heroin
cocaine
meperidine
trazodone
PCP
oxazepam
nitrazepam
verapamil
lorazepam
methadone
alprazolam
temazepam
proadifen
diazepam
THC
×102
00.20.40.60.8
11.2
0.8 1 1.2 1.4 1.6 1.8 2 2.2 2.4 2.6 2.8 3 3.2 3.4 3.6 3.8 4 4.2 4.4 4.6 4.8 5 5.2 5.4 5.6
×102
00.20.40.60.8
1
0.8 1 1.2 1.4 1.6 1.8 2 2.2 2.4 2.6 2.8 3 3.2 3.4 3.6 3.8 4 4.2 4.4 4.6 4.8 5 5.2 5.4 5.6
×102
00.20.40.60.8
11.2
0.8 1 1.2 1.4 1.6 1.8 2 2.2 2.4 2.6 2.8 3 3.2 3.4 3.6 3.8 4 4.2 4.4 4.6 4.8 5 5.2 5.4 5.6
x102
00.20.6
11.41.8
Acquisition time (min)
Acquisition time (min)
Acquisition time (min)
Acquisition time (min)
0.8 1 1.2 1.4 1.6 1.8 2 2.2 2.4 2.6 2.8 3 3.2 3.4 3.6 3.8 4 4.2 4.4 4.6 4.8 5 5.2 5.4 5.6
W1/2
= 0.044
W1/2
= 0.043
W1/2
= 0.047
W1/2
= 0.082W
1/2 = 0.065
W1/2
= 0.047
W1/2
= 0.041
W1/2
= 0.038W
1/2 = 0.039
W1/2
= 0.038
W1/2
= 0.041
W1/2
= 0.069
W1/2
= 0.049
W1/2
= 0.049
W1/2
= 0.051
W1/2
= 0.099
Agilent Poroshell 120 EC-C18, 2.1 × 100 mm, 2.7 μm
Agilent ZORBAX RRHT Eclipse Plus C18, 2.1 × 100 mm, 1.8 μm
Agilent ZORBAX Eclipse Plus C18, 2.1 × 100 mm, 3.5 μm
Agilent ZORBAX Eclipse Plus C18, 2.1 × 100 mm, 5 μm
W1/2
= 0.038
W1/2
= 0.037
W1/2
= 0.038
W1/2
= 0.062
Coun
tsCo
unts
Coun
tsCo
unts
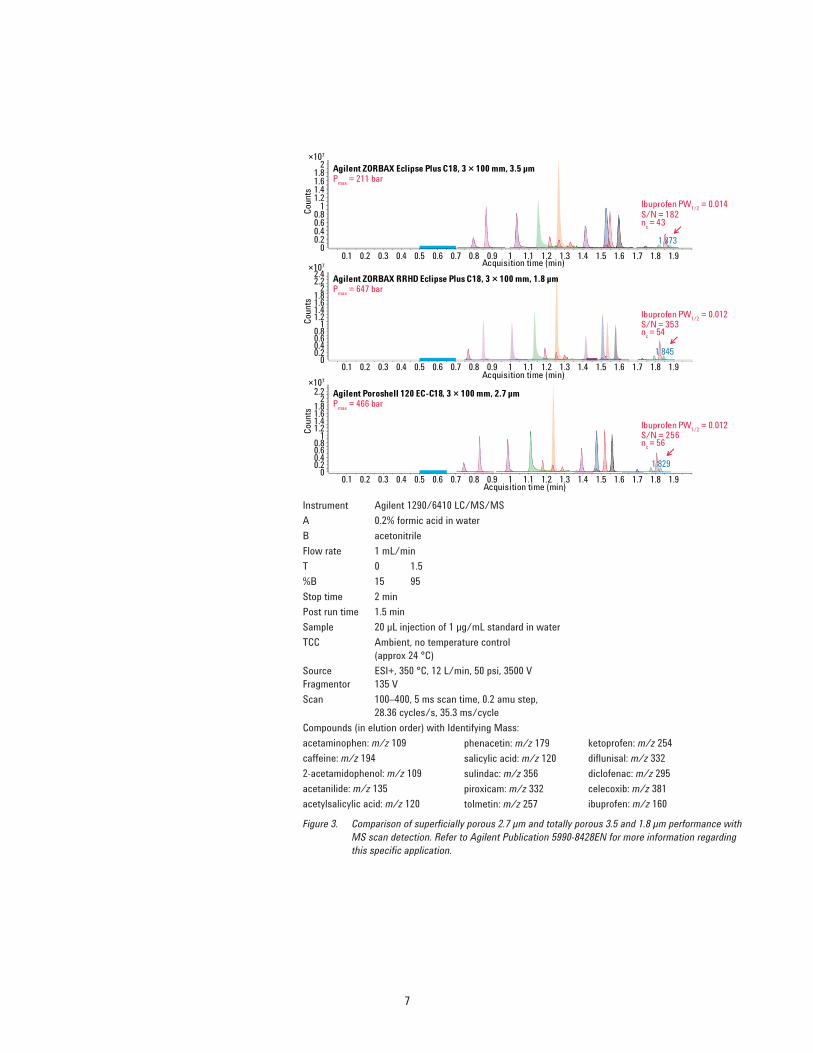
Figure 3 shows a closer comparison of 2.7, 1.8, and 3.5 μm columns, with a moresimplified analysis of 15 common analgesic compounds. Again, the very similarselectivity across the three columns is apparent. This feature of Agilent’s LCcolumn family is advantageous for laboratories that require transferability amongtheir methods. As shown by the pressures on the left side of the chromatograms,the 3.5 μm column would be ideal for performing this analysis on a 400 bar HPLC,while the Agilent Poroshell 120 column would work best on a 600 bar instrument,and the 1.8 μm column is beneficial for a > 600 bar UHPLC. Conditional peak capac-ity on the smaller particle columns is > 20% higher than the 3.5 μm column. Also,sensitivity (signal-to-noise) is greatly improved by more than 40% with the tallersharper peaks on the 1.8 and 2.7 μm columns, as compared to the 3.5 μm.
6
7
Figure 3. Comparison of superficially porous 2.7 μm and totally porous 3.5 and 1.8 μm performance withMS scan detection. Refer to Agilent Publication 5990-8428EN for more information regardingthis specific application.
Instrument Agilent 1290/6410 LC/MS/MS
A 0.2% formic acid in water
B acetonitrile
Flow rate 1 mL/min
T 0 1.5
%B 15 95
Stop time 2 min
Post run time 1.5 min
Sample 20 μL injection of 1 μg/mL standard in water
TCC Ambient, no temperature control (approx 24 °C)
Source ESI+, 350 °C, 12 L/min, 50 psi, 3500 VFragmentor 135 V
Scan 100–400, 5 ms scan time, 0.2 amu step,28.36 cycles/s, 35.3 ms/cycle
Compounds (in elution order) with Identifying Mass:
acetaminophen: m/z 109
caffeine: m/z 194
2-acetamidophenol: m/z 109
acetanilide: m/z 135
acetylsalicylic acid: m/z 120
phenacetin: m/z 179
salicylic acid: m/z 120
sulindac: m/z 356
piroxicam: m/z 332
tolmetin: m/z 257
ketoprofen: m/z 254
diflunisal: m/z 332
diclofenac: m/z 295
celecoxib: m/z 381
ibuprofen: m/z 160
×107
00.20.40.60.8
11.21.41.61.8
2
1.873
0.1 0.2 0.3 0.4 0.5 0.6 0.7 0.8 0.9 1 1.1 1.2 1.3 1.4 1.5 1.6 1.7 1.8 1.9×10⁷
00.20.40.60.8
11.21.41.61.8
22.22.4
1.845
0.1 0.2 0.3 0.4 0.5 0.6 0.7 0.8 0.9 1 1.1 1.2 1.3 1.4 1.5 1.6 1.7 1.8 1.9
×107
00.20.40.60.8
11.21.41.61.8
22.2
1.829
Acquisition time (min)
Acquisition time (min)
Acquisition time (min)
0.1 0.2 0.3 0.4 0.5 0.6 0.7 0.8 0.9 1 1.1 1.2 1.3 1.4 1.5 1.6 1.7 1.8 1.9
Agilent ZORBAX Eclipse Plus C18, 3 × 100 mm, 3.5 μmP
max = 211 bar
Agilent ZORBAX RRHD Eclipse Plus C18, 3 × 100 mm, 1.8 μmP
max = 647 bar
Agilent Poroshell 120 EC-C18, 3 × 100 mm, 2.7 μmP
max = 466 bar
Ibuprofen PW1/2
= 0.014S/N = 182 n
c = 43
Ibuprofen PW1/2
= 0.012S/N = 353n
c = 54
Ibuprofen PW1/2
= 0.012S/N = 256n
c = 56
Coun
tsCo
unts
Coun
ts

Because the highly efficient 1.8 and 2.7 μm columns outperform the 3.5 μm columnby so much, shorter columns may be used, as seen in Figure 4. Comparing 50 mm,1.8 and 2.7 μm columns to a 100 mm, 3.5 μm column at the same flow rate, resultsin half the analysis time for the 1.8 and 2.7 μm columns. The result is similar peakcapacity for all three analyses. Therefore, the 1.8 and 2.7 μm columns can theoreti-cally separate the same number of peaks in half the time of the 3.5 μm column.Pressure is also noteworthy in this example, as the Poroshell 120, 50 mm columngenerates similar pressure to the 100 mm, 3.5 μm column, each well under 400 bar, so these analyses could be run on any LC system. When pressure is not anissue, the Agilent ZORBAX RRHD Eclipse Plus C18 50 mm, 1.8 μm column can bepushed to over 1000 bar, resulting in an 80% reduction in analysis time, as com-pared to the original 100 mm, 3.5 μm analysis. While some peak capacity is lost,and coelution occurs for such a fast analysis, the highly selective MS detector canstill manage ample resolving power for these 15 analgesics in 0.4 min. It should benoted that using this G6410A MS with an ESI source at 2.75 mL/min is not consid-ered a good practice. In this example flow rate was increased to demonstrate amplescan rate by the MS under extreme conditions, however, this is not a practice thatshould be used with this MS. Newer technologies like the Agilent Jet StreamThermal Gradient Focusing Technology with ESI source can be used to extend theflow rate range beyond 2 mL/min without deleterious effects on the analysis. Formore information refer to Agilent Publication 5990-3494EN.
8

9
× 106
0123456
0.997
1
0.1 0.2 0.3 0.4 0.5 0.6 0.7 0.8 0.9 1.0
×107
0
0.5
1
1.5
2 1
0.1 0.2 0.3 0.4 0.5 0.6 0.7 0.8 0.9 1.0 1.1 1.2 1.3 1.4 1.5 1.6 1.7 1.8 1.9 2.0
× 107
0
0.2
0.4
0.6
0.8
1
1.006
1
0.1 0.2 0.3 0.4 0.5 0.6 0.7 0.8 0.9 1.0
Agilent ZORBAX Eclipse Plus C18 3 × 100 mm, 3.5 μm1 mL/min211 bar
Agilent ZORBAX RRHD Eclipse Plus C18 3 × 50 mm, 1.8 μm1 mL/min522 bar
Agilent Poroshell 120 EC-C183 × 50 mm, 2.7 μm1 mL/min261 bar
Average PW1/2
= 0.025n
c = 43
Average PW1/2
= 0.0092n
c = 39
Average PW1/2
= 0.0086n
c = 43
× 106
0
1
2
3
0.369
1
Acquisition time (min)
Acquisition time (min)
Acquisition time (min)
Acquisition time (min)
0.05 0.1 0.15 0.2 0.25 0.3 0.35 0.4
Agilent ZORBAX RRHD Eclipse Plus C18 3 × 50 mm, 1.8 μm2.75 mL/min1072 bar
Average PW1/2
= 0.0051n
c = 26
1.873
Cou
nts
Cou
nts
Cou
nts
Cou
nts
Figure 4. Example of high speed analysis possible with superficially porous 2.7 μm and totally porous 1.8 μm versus 3.5 μm with MS detection. Refer to AgilentPublication 5990-8428EN for more information regarding this specific application.
Instrument Agilent 1290/6410 LC/MS/MS
A 0.2% formic acid in water
B acetonitrile
Sample 20 μL (10 μL for 50 mm column) injection of 1 μg/mL standard
TCC Ambient, no temperature control (approx 24 °C)
Source ESI+, 350 °C, 12 L/min, 50 psi, 3500 V
Fragmentor 135 V
Scan 100–400, 5 ms scan time,0.2 amu step,28.36 cycles/s, 35.3 ms/cycle
3 × 100 mm, 1 mL/min, 15–95% B in 1.5 min
3 × 50 mm, 1 mL/min, 15–95% B in 0.75 min
3 × 50 mm, 2.75 mL/min, 15–95% B in 0.27 min
Compounds (in elution order) with Identifying Mass:
acetaminophen: m/z 109
caffeine: m/z 194
2-acetamidophenol: m/z 109
acetanilide: m/z 135
acetylsalicylic acid: m/z 120
phenacetin: m/z 179
salicylic acid: m/z 120
sulindac: m/z 356
piroxicam: m/z 332
tolmetin: m/z 257
ketoprofen: m/z 254
diflunisal: m/z 332
diclofenac: m/z 295
celecoxib: m/z 381
ibuprofen: m/z 160

A practical example of what better peak capacity can do for an analysis is illus-trated in Figure 5. Here is an overlay of a blank whole blood extract with a spikedwhole blood extract. Because the Agilent Poroshell 120 column produces suchsharp peaks and consequently high peak capacity, it can separate the 10 analytesfrom the background peaks in the sample matrix. Occasionally, coeluting peaks cansuppress the signal of one or both of the compounds, therefore the best protectionagainst this ion suppression is to separate all peaks chromatographically.
10
Figure 5. Separation of analytes from whole blood sample matrix background with a highly efficientsuperficially porous 2.7 μm column and MS scan detection.
Instrument: Agilent 1200/6460 LC/MS/MS
A 5 mM Ammonium acetate, pH 5; 20:80 Methanol: Water
B 5 mM Ammonium Acetate in AcetonitrileFlow rate 0.4 mL/min
T 0 5.5 7.5
%B 20 75 75
Sample 10 μL injection of whole blood extract
Column Agilent Poroshell 120 EC-C18 2.1 × 100 mm, 2.7 μm
Source 400 °C, 12 L/min, 40 psi, 3500 V
Fragmentor 80 V
MS Scan mass range 100–800
Scan time 20 sec
ESI Positive polarity
QuEChERS extraction of whole blood:
A 1-mL aliquot of whole blood was added to a centrifuge tube and spiked with appropriate volume from aconcentrated stock mixture to yield 250 ng/mL of the component mix, added 20 μL of IS stock solution(nortriptyline), two ceramic homogenizers, then vortexed. Then 2 mL of acetonitrile solutions (with orwithout acid) was added and vortexed. A premixed amount of the extraction salts was added and vigor-ously shaken, centrifuged at 5000 rpm for 5 min. One milliliter of the extract was transferred into a d-SPE tube (2 mL centrifuge tube) containing 50 mg of PSA and 100 mg of MgSO4 for matrix cleanup; vor-texed for 1 min and centrifuged at 18,000 rpm for 3 min. A 200 μL aliquot of the extract was transferredinto a LC vial containing 800 μL of water, vortexed and analyzed.
× 107
0.1
0.2
0.3
0.4
0.5
0.6
0.7
0.8
0.9
1
1.1
1.2
1.3
Acquisition time (min)1 2 3 4 5 6 7 8 9 10
BLACK: Whole blood background (blank)
RED: Spiked sample, 10 compounds, 250 ng/mL each
Nal
oxon
e
Dilt
iaza
m, O
xaze
pam
Lora
zepa
m
Coun
ts

Optimizing data collection rates with MS to balance sensitivity andpeak capacity
The tea analysis in Figure 6, shown on an Agilent ZORBAX RRHD SB-C18 columnillustrates the effects of various data collection rates on chromatographic quality,including UV, MS scan, MS SIM, and MS/MS detection modes. Using Equation 1, theconditional peak capacity of this analysis is compared alongside signal-to-noise cal-culations for each chromatogram. In all cases, the same pattern can be seen. Themass spectrometer has more than enough speed for data collection than it needsfor this analysis, to the point where negative effects are shown with faster data col-lection rates when too many data points are collected. The fastest data collectionrates generate the narrowest peaks, resulting in the highest peak capacity; however,the fastest data collection rates also generate the most baseline noise, whichdecreases the signal-to-noise ratio. When sensitivity is the most important factor ofan analysis, a slightly slower data collection rate should be used; though this willdecrease the conditional peak capacity. Additionally regarding sensitivity is the 50Ximprovement in signal-to-noise when comparing MS scan to MS/MS detection.
11
UV Data collection rate MS scan rate
min0 0.25 0.5 0.75 1 1.25 1.5 1.75
mAU
0100200300
0.12 s
min0 0.25 0.5 0.75 1 1.25 1.5 1.75
mAU
0100200300
0.25 s
min0 0.25 0.5 0.75 1 1.25 1.5 1.75
mAU
0100200300
0.5 s
min0 0.25 0.5 0.75 1 1.25 1.5 1.75
mAU
0100200300
1.0 s
mAU
0100200300
2.0 s
PW1/2
= 0.018
PW1/2
=0.018
PW1/2
= 0.019
PW1/2
= 0.025
PW1/2
= 0.042
×106
5
25 ms1
×106
5
50 ms1
×106
5
100 ms1
×106
5
250 ms1
×106
5
500 ms1 1
PW1/2
= 0.024
S/N = 39
PW1/2
= 0.024
S/N = 43
PW1/2
= 0.027
S/N = 86
PW1/2
= 0.035
S/N = 118
PW1/2
= 0.049
S/N = 109
MS SIM dwell time×106
1
1 ms1
×106
1
10 ms
×106
1
25 ms1
×106
1
50 ms1
×106
1
75 ms1
PW1/2
= 0.024
S/N = 113
PW1/2
= 0.027
S/N = 198
PW1/2
= 0.031
S/N = 714
PW1/2
= 0.039
S/N = 744
PW1/2
= 0.050
S/N = 277
MS/MS dMRM Cycle time
×105
0
0.5
1
60 ms1
×105
0
0.5
1
80 ms1
×105
0
0.5
1
100 ms1
×105
0
0.5
1
200 ms1
×105
0
0.5
1
500 ms1
PW1/2
= 0.022
S/N = 2507
PW1/2
= 0.022
S/N = 2578
PW1/2
= 0.023
S/N = 3188
PW1/2
= 0.028
S/N = 5702
PW1/2
= 0.050
S/N = 2389
1
0 0.25 0.5 0.75 1 1.25 1.5 1.75 min 0 .20 .40 .60 .80 1 1.2 1.4 1.6 1.8 0 .20 .40 .60 .80 1 1.2 1.4 1.6 1.8 0 .20 .40 .60 .80 1 1.2 1.4 1.6 1.8
Figure 6. Comparison of detector data collection rates with UV, MS scan, MS SIM and MS/MS with a 1.8 μm column. Refer to Agilent Publication 5990-7824EN for more information regarding this specific pplication.
Instrument Agilent 1290/6410 LC/MS/MS
A 0.2% acetic acid in water
B acetonitrile
Flow rate 1 mL/min
T 0 0.5 2
%B 10 15 27
Stop time 2 min
Post run time 2 min
Sample 1 μL injection of 6 μg/mL standard in water
TCC 40 °C
Column Agilent ZORBAX RRHD SB-C18 2.1 × 100 mm, 1.8 μm
DAD Sig = 210, 4nm; Ref = Off
Source ESI+, 350 °C, 10 L/min, 50 psi, 3500 V
MS, Pos SIM 171, 307, 195, 291, 459, 443
dMRM transitions (Fragmentor = 135 V)
Gallic acid 171 & 109, 127 (CE=5)
(Epi)gallocatechin 307 & 139, 121 (CE=50)
(Epi)catechin 291 & 139,123 (CE=15)
Caffeine 195 & 138, 110 (CE=30)
(Epi)gallocatechin gallate 459 & 139, 289 (CE=5)
(Epi)catechin gallate 443 & 139, 123 (CE=40)

Peak capacity and baseline separation are not always the most important factors tomass spectrometrists. However, in analyses like this, there are four epimer pairsthat are detected by the same mass unit, which must be baseline separated foraccurate, reproducible quantitation; most notably are the last two peaks, epicate-chin gallate (ECG) and catechin gallate (CG) which elute closely and share m/z 443as their mass. Figure 7 shows a rapid analysis with more than adequate MS detec-tor speed of catechins in tea where the epimer pairs are shown in matching colors;the black peak pair eluting around 0.9 min is the critical pair of this analysis. Withthe highly efficient Agilent Poroshell 120 column used for this analysis, all 10 peakscan be baseline separated in 1 min, a feat that would likely not be possible with aslightly larger 3.5 μm column.
12
0.05 0.1 0.15 0.2 0.25 0.3 0.35 0.4 0.45 0.5 0.55 0.6 0.65 0.7 0.75 0.8 0.85 0.9
Pmax
= 585 bar
Figure 7. Example of fast MS scan analysis possible with a highly efficient superficially porous 2.7 μmcolumn. Refer to Agilent Publication 5990-7824EN for more information regarding this specificapplication.
Instrument Agilent 1200/6410 LC/MS/MS
A 0.2% acetic acid in water
B acetonitrile
Flow rate 1.5 mL/min
T 0 0.36 0.71
%B 10 15 27
Stop time 1 min
Post run time 1.5 min
Sample 1.5 μL injection of 3 μg/mL standard in water
TCC 40 °C
Column Agilent Poroshell 120 SB-C18 2.1 × 50 mm, 2.7 μm
DAD Sig = 210, 4 nm; Ref = Off
Source ESI+, 350 °C, 10 L/min, 50 psi, ± 3500 V
Fragmentor 135 V
MS, SIM- (169, 305, 289, 457, 441), SIM+ (195)
Sample:
Gallic acid: m/z 171
(Epi)gallocatechin: m/z 307
(Epi)catechin: m/z 291
Caffeine: m/z 195
(Epi)gallocatechin gallate: m/z 459
(Epi)catechin gallate: m/z 443

Figure 8 shows an ultra fast separation of 15 analgesic compounds in 0.4 minuteson an RRHD Eclipse Plus C18 column. As with Figure 7, the MS is fast enough tocollect enough data points across all peaks, even in cases with coeluting peaks. Thetotal ion chromatogram (TIC) on top shows several partially coeluting peaks, particu-larly around tolmetin, shown with the red arrow. Because each compound is identi-fied by a unique mass, extracted ion chromatograms (EICs) allow the analyst to vieweach component separately, as seen with just the EIC of m/z 257 for tolmetin in thebottom chromatogram. Viewing EICs separately allows for simple integration andquantification of any compound. Again, it should be noted that using thisG6410A MS with an ESI source at 2.75 mL/min is not recommended. The flow ratewas increased to demonstrate sufficient scan rate by the MS under extreme condi-tions. When increased throughput is needed, the new Agilent Jet Stream ThermalGradient Focusing Technology with ESI source can be used to extend the flow raterange beyond 2 mL/min without negatively impacting the analysis. For more infor-mation refer to Agilent Publication 5990-3494EN.
13
× 106
0.2
1
2
3
0.02 0.04 0.06 0.08 0.1 0.12 0.14 0.16 0.18 0.2 0.22 0.24 0.26 0.28 0.3 0.32 0.34 0.36 0.38 0.4
× 106
0
1
2
3
0.313
0.02 0.04 0.06 0.08 0.1 0.12 0.14 0.16 0.18 0.2 0.22 0.24 0.26 0.28 0.3 0.32 0.34 0.36 0.38 0.4
× 106
0.0
0.5
1.0
0.313
Acquisition time (min)
Acquisition time (min)
Acquisition time (min)
0.02 0.04 0.06 0.08 0.1 0.12 0.14 0.16 0.18 0.2 0.22 0.24 0.26 0.28 0.3 0.32 0.34 0.36 0.38 0.4
TIC ScanP
max =1072 bar
EIC overlay of all 15 compounds
Individual EIC of m/z 257 (tolmetin)
Coun
tsCo
unts
Coun
ts
Figure 8. Example of ultra fast MS scan analysis possible with a highly efficient 1.8 μm column. Referto Agilent Publication 5990-8428EN for more information regarding this specific application.
Instrument Agilent 1290/6410 LC/MS/MS
A 0.2% formic acid in water
B acetonitrile
Flow rate 2.75 mL/min
T 0 0.27
%B 15 95
Stop time 0.4 min
Post run time 0.27 min
Sample 10 μL injection of 1 μg/mL standard in water
TCC Ambient, no temperature control (approx 24 °C)
Column Agilent ZORBAX RRHD Eclipse Plus C18 3 × 50 mm, 1.8 μmCompounds (in elution order) with Identifying Mass:
acetaminophen: m/z 109
caffeine: m/z 194
2-acetamidophenol: m/z 109
acetanilide: m/z 135
acetylsalicylic acid: m/z120
phenacetin: m/z 179
salicylic acid: m/z 120
sulindac: m/z 356
piroxicam: m/z 332
tolmetin: m/z 257
ketoprofen: m/z 254
Source ESI+, 350 °C, 12 L/min, 50 psi, 3500 V
Fragmentor 135 V
Scan 100–400, 5 ms scan time, 0.2 amu step, 28.36 cycles/s, 35.3 ms/cycle
diflunisal: m/z 332
diclofenac: m/z 295
celecoxib: m/z 381
ibuprofen: m/z 160

Optimizing sensitivity by selecting the best MS mobile phaseFigure 9 shows several MS-friendly mobile phases that were screened for use witha tea analysis on an Agilent Poroshell 120 SB-C18 column. Selectivity and peakshape remained constant regardless of the mobile phase used, consequently, theoptimal mobile phase was selected based on signal strength of the analytes.Significant ion suppression is present with the ammonium acetate buffer, as well aswith the trifluoroacetic acid mobile phase. The two best contenders were formicand acetic acid, with acetic acid producing a slightly more intense signal.Comparing the most sensitive acetic acid mobile phase to the least sensitive ammo-nium acetate mobile phase shows that the sensitivity of the acetic acid was fivetimes the sensitivity of the ammonium acetate.
14
Figure 9. Comparison of the effect of mobile phase on signal-to-noise (S/N) with a superficially porous2.7 μm column and MS scan detection. Refer to Agilent Publication 5990-7824EN for moreinformation regarding this specific application.
Instrument Agilent 1200/6410 LC/MS/MS
A acidified water
B acetonitrile
Flow rate 0.729 mL/min
T 0 1.43 2.86
%B 10 15 27
Stop time 3.6 min
Post run time 1.7 min
Sample 3 μL injection of 3 μg/mL standard in water
TCC 40 °C
Column Agilent Poroshell 120 SB-C18 2.1 × 100 mm, 2.7 μm
DAD Sig = 210, 4 nm: Ref = Off
Source ESI+, 350 °C, 10 L/min, 50 psi, ± 3500 V
Fragmentor 135 V MS, SIM- (169, 305, 289, 457, 441), SIM+ (195)
Sample:
Gallic acid: m/z 171
(Epi)gallocatechin: m/z 307
(Epi)catechin: m/z 291
Caffeine: m/z 195
(Epi)gallocatechin gallate: m/z 459
(Epi)catechin gallate: m/z 443
× 102
0
0.5
1
× 102
0
0.5
1
× 102
0
0.5
1
× 102
0
0.5
1
Acquisition time (min)0.1 0.3 0.5 0.7 0.9 1.1 1.3 1.5 1.7 1.9 2.1 2.3 2.5 2.7 2.9 3.1 3.3 3.5
0.2% HCOOH
0.2% CH3COOH
0.02% CF3COOH
10 mM CH3COONH
4, pH 3.6
(adjusted to pH with 10 mM CH3 COOH)
S/N = 111
S/N = 155
S/N = 68
S/N = 33
Coun
ts

Conclusions
Small particle size columns, including sub-2 μm and superficially porous 2–3 μm,enhance LC/MS (Scan and SIM) and LC/MS/MS results. Improvements in sensitiv-ity, resolution and peak capacity are observed, as compared to 3.5 and 5 μm columnswith MS detection. High efficiency columns are particularly useful when samplescontain isomers that require baseline resolution for accurate quantitation, or whensamples are in complex matrices and separation from the background is desirable toavoid the possibility of ion suppression with coeluting peaks. Additionally, mobilephase considerations should be taken with MS detection to prevent ion suppressionand optimize for analyte peak shape, selectivity and sensitivity.
15

www.agilent.com/chem
Agilent shall not be liable for errors contained herein orfor incidental or consequential damages in connectionwith the furnishing, performance, or use of this material.
Information, descriptions, and specifications in this publication are subject to change without notice.
© Agilent Technologies, Inc., 2012Printed in the USA
5990-8623EN
For Forensic Use.
Recommended