FUGRO ROADWARE
A division of Fugro Canada Corp.
2505 Meadowvale Blvd Tel: +1 905 567 2870 Mississauga, Ontario Fax: +1 905 567 2871 L5N 5S2 Toll-Free NA: 800-828-ARAN (2726) Canada Web: www.fugroroadware.com
May 17, 2013 Attention: Local Planning Agency Re: Local Pavement and Asset Data Collection
As an amendment to our current contract, commencing 2013, Fugro will be collecting and delivering to the
Louisiana Department of Transportation and Development (LADOTD) Right-of-Way (ROW) videolog, asset
inventory and Global Positioning System (GPS) for all local roads within the State of Louisiana over the next three
years. This effort is being funded by LADOTD and the data will be available to your agency from LADOTD at no
cost.
However, as a full service asset management company, Fugro can also offer local agencies additional data and
services including pavement condition (distress and profile) data, geometric data, additional roadway assets not
part of the LADOTD data set, Pavement Management System Implementation, Ground Penetrating Radar (GPR)
data providing layer type and thickness information, coring, structural testing using Falling Weight Deflectometer
(FWD) and Surface Friction Testing. Such data and services offer tremendous value to the local agencies as this
information will enhance and maximize each agency‟s ability to make confident roadway management decisions,
leading to improved network condition through early invention and efficient maintenance to extend the performance
life of all roads, and a better understanding of how to best allocate maintenance funding.
The following sections provide an overview of the additional data and services that Fugro can provide to the local
agencies and the applicable rates.
Pavement Management System Implementation
Fugro‟s pavement management expertise encompasses over 25-years of experience in data collection of both
surface and sub-surface pavement data, pavement management, pavement design, evaluation and materials
testing.
Large and small agencies alike, Fugro is committed and dedicated to provide tailored solutions for each and every
client‟s unique needs. By carefully planning each project to address the unique needs of each agency, Fugro
provides tailored pavement management solutions to cities and counties. Our experience with municipal agencies
of various sizes and needs keeps Fugro on the forefront of understanding municipal pavement and asset
management needs, which has allowed Fugro to be an industry leader. Fugro has provided pavement
management services for all different sized agencies with a wide variety of needs:
Paved roadway inspections
Unpaved roadway inspections
Data migration of Pavement Management Data
Pavement Management Implementation
Pavement Management Update
Roadside Asset Inventory and Inspection (e.g., sidewalks, ramps, signs, guardrails, etc.)
Geographic Information System services
Web-viewing software
FUGRO ROADWARE
A division of Fugro Canada Corp. Page 2 of 13
Presentations to City Councils and Commissioners Courts
Structural Evaluations: Ground Penetrating Radar and Falling Weight Deflectometer
Work plans, budget analysis, and network condition reporting.
Fugro is experienced with a variety of pavement management software packages such as Cartegraph,
StreetSaver, Agile Assets, dTIMS and MicroPAVER. Our experience with these software packages includes
developing condition listings, condition maps, work plans, budget optimization, and maintenance and rehabilitation
alternatives for agencies.
Fugro provides implementations and updates on these systems on a continuous basis as well as guides agencies
through the software selection process for initial implementations. This helps to ensure that a cost effective
solutions for each agency we work with.
Fugro can offer each agency consulting services to complete a full pavement management system implementation
excluding software for $25,000.00.
Pavement Condition Data
Pavement condition data available to each local agency includes the collection, processing, and delivery of
pavement surface distress according to LADOTD‟s protocols, International Roughness Index (IRI), rutting, roadway
geometry, and faulting. The price per mile is $60.00 per mile (driven or lane mile). We would be pleased to offer
a 10% discount for the price per mile, or $54.00 per mile (driven or lane mile), if the total number of miles to be
collected is greater than 2,000 miles.
If pavement surface distress is to be rated to a different protocol than that used by LADOTD, the price would be
$7,500.00 for each time that our rating software, Vision, will need to be calibrated. For example, if an agency
requests that surface distress be rated according to a different protocol other than that used by LADOTD, the price
to perform such setup and calibration would be $7,500.00. This would be an additional cost and not included in
the rates provided above to collect, process and delivery the pavement condition data.
Asset Inventory/Extraction
As part of this contract, LADOTD will be funding the asset extraction of the following Highway Performance
Monitoring System (HPMS) asset types and make them available upon request:
Number of travel lanes Type of HOV operations
Number of HOV lanes in both directions Presence of right turn lanes
Posted speed limits Presence of left turn lanes
Sections with toll charge Type of toll
Count of signalized at-grade intersections Count of at-grade intersections with stop signs
Count of intersections without stop sign or signals Begin bridge location
Measure of existing lane width End bridge location
Type of median Measure of existing median width
Type of shaller material Measure of existing right shaller width
On route parking locations Measure of existing left shaller width
Presence of curb Presence of rail road crossing
FUGRO ROADWARE
A division of Fugro Canada Corp. Page 3 of 13
Start location of sidewalk right End location of sidewalk left
Identify ADA ramps
In addition, the following LADOTD point feature locations for mapping include:
Cemetery Church
Church & school Church with cemetery
Courthouse Fire station
Hospital Police station
Post office School
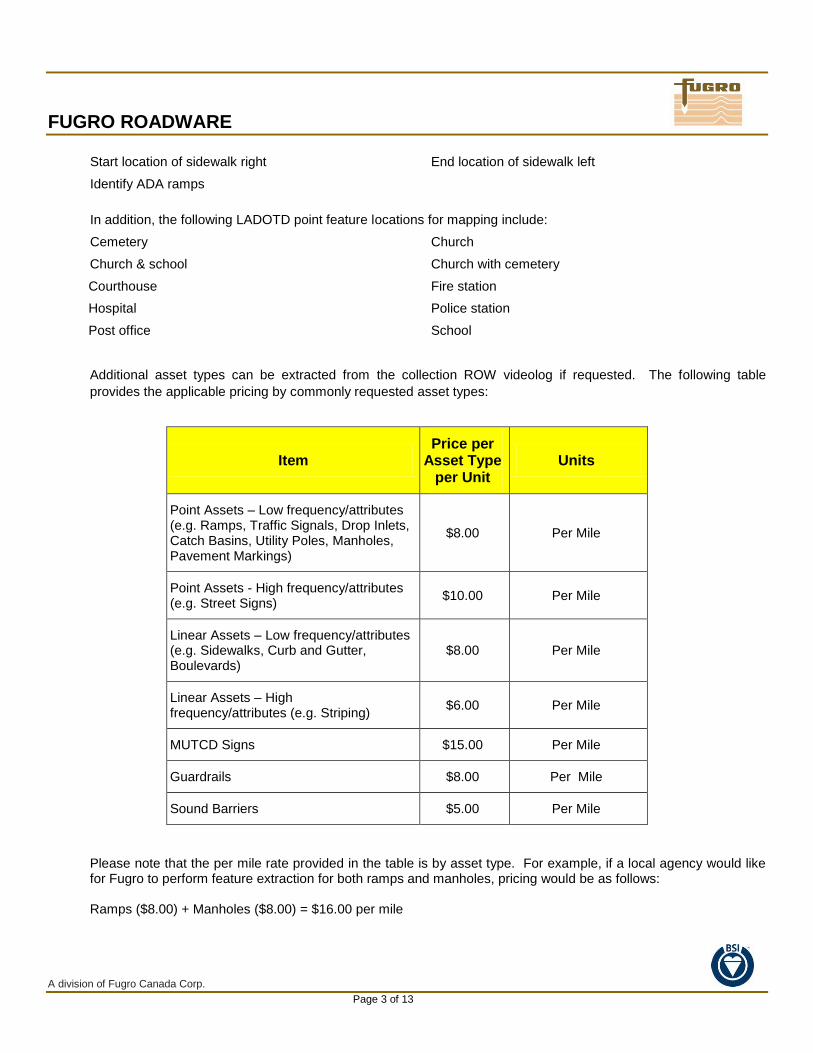
Additional asset types can be extracted from the collection ROW videolog if requested. The following table
provides the applicable pricing by commonly requested asset types:
Item Price per
Asset Type per Unit
Units
Point Assets – Low frequency/attributes (e.g. Ramps, Traffic Signals, Drop Inlets, Catch Basins, Utility Poles, Manholes, Pavement Markings)
$8.00 Per Mile
Point Assets - High frequency/attributes (e.g. Street Signs)
$10.00 Per Mile
Linear Assets – Low frequency/attributes (e.g. Sidewalks, Curb and Gutter, Boulevards)
$8.00 Per Mile
Linear Assets – High frequency/attributes (e.g. Striping)
$6.00 Per Mile
MUTCD Signs $15.00 Per Mile
Guardrails $8.00 Per Mile
Sound Barriers $5.00 Per Mile
Please note that the per mile rate provided in the table is by asset type. For example, if a local agency would like for Fugro to perform feature extraction for both ramps and manholes, pricing would be as follows: Ramps ($8.00) + Manholes ($8.00) = $16.00 per mile
FUGRO ROADWARE
A division of Fugro Canada Corp. Page 4 of 13
Ground Penetrating Radar (GPR)
As the age of road stock increases, the effects of maintenance and repairs can lead to a level of structural
complexity that is seldom well recorded and cannot easily be determined by coring alone. Designing remediation
works, planning longer term asset management and interpreting other test data such as condition or deflection
measurements are all made more challenging by the mismatch between poorly recorded and actual structure.
Investment in ground penetrating radar (GPR) surveys, supported by targeted coring, provides the engineer or
asset manager with a cost-effective and comprehensive overview of the actual pavement structure with minimal
disruption to road users.
We have been building pavement structure inventories based on GPR and coring for over 15 years and have
undertaken some of the largest surveys of this type including:
• California Department of Transportation: 51,250 miles
• Louisiana Department of Transportation and Development: 20,000 miles
• Virginia Department of Transportation: 1,800 miles
Use of the data set varies widely but can include some or all of the following:
• Fiscal valuation of roadstock / auditing
• Calibration of deflection measurements
• Basis for fixed segmentation of the road network based on homogenous pavement sections
• Identification of defects
• QA/QC of new build / reconstruction
Over the past five years, we have been integrating GPR systems into our world-leading ARAN collection vehicle.
Our clients gain the option to collect GPR information at the same time as surface condition data, reducing cost,
environmental impact and risk.
Within your area GPR data would be collected using the latest generation of multi-channel, digital radar recording
equipment connected to two dipole (ground coupled) antennae operating at center frequencies of 900 MHz and 1.6
GHz. This means that pavement layers greater than 4 inches thick can be resolved to a depth of approximately 3
feet below the pavement surface. Ground coupled antenna will be used as the equipment can operate
simultaneously without obscuring either the right of way or pavement video survey equipment such as an air
coupled antenna would.
The integrated GPR system will be connected to the data ARAN‟s DMI and inertial corrected GPS systems,
meaning that the position of all ARAN collected datasets will be coincident. The GPR equipment will be set up to
collect one scan (consisting of both frequencies) every ~1½ feet (~0.5m) along the pavement.
Minimal targeted coring is required to calibrate the GPR data so the data interpretation can accurately determine
the layer thickness. It is difficult to accurately determine the number of cores required prior to the GPR data
collection as the number will vary depending on the complexity of the pavement structure (complex situations
require more cores). However, as a guide we estimate in most situation 3 cores per subdivision or 1 core every 5
miles should be sufficient.
Processing and interpretation of GPR data would be undertaken by a highly experienced and well-trained team at
Fugro‟s central pavement GPR processing center. The team handle data from tens of thousands of miles of
highway around the world each year so have the knowledge and skill to ensure reliable and accurate results.
Because the GPR data would undergo full interpretation there would be no need for your team to invest in training
or software to undertake interpretation in-house.
Following data processing and interpretation, as standard, derived pavement construction information (layer
thickness and type) for each section would be reported as an MS Access data table at the following locations:
FUGRO ROADWARE
A division of Fugro Canada Corp. Page 5 of 13
The beginning of the section
10th mile (~161 m) increments
The position of major step changes in layer thickness (greater than 4 inches)
Where anomalies occur in the GPR data
The end of each section
Information on material type would be in the generic major engineering categories such as: asphaltic concrete,
Portland cement concrete, granular sub-base and cement bound sub-base.
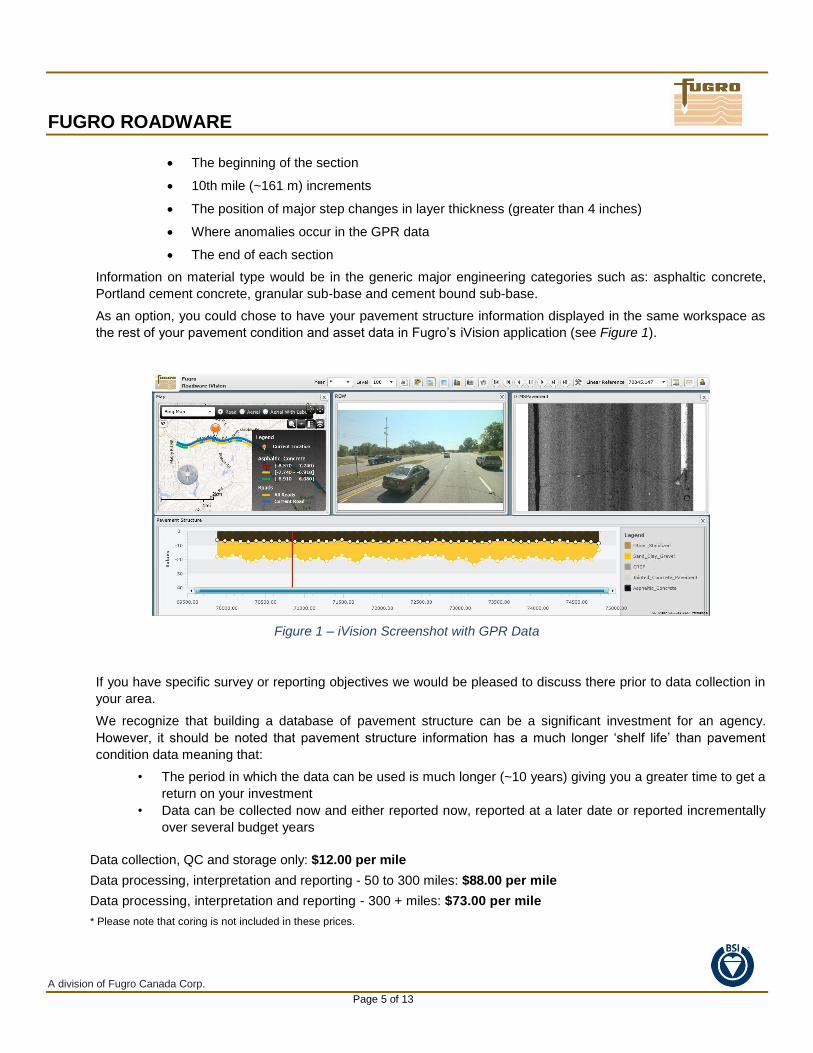
As an option, you could chose to have your pavement structure information displayed in the same workspace as
the rest of your pavement condition and asset data in Fugro‟s iVision application (see Figure 1).
Figure 1 – iVision Screenshot with GPR Data
If you have specific survey or reporting objectives we would be pleased to discuss there prior to data collection in
your area.
We recognize that building a database of pavement structure can be a significant investment for an agency.
However, it should be noted that pavement structure information has a much longer „shelf life‟ than pavement
condition data meaning that:
• The period in which the data can be used is much longer (~10 years) giving you a greater time to get a
return on your investment
• Data can be collected now and either reported now, reported at a later date or reported incrementally
over several budget years
Data collection, QC and storage only: $12.00 per mile
Data processing, interpretation and reporting - 50 to 300 miles: $88.00 per mile
Data processing, interpretation and reporting - 300 + miles: $73.00 per mile
* Please note that coring is not included in these prices.
FUGRO ROADWARE
A division of Fugro Canada Corp. Page 6 of 13
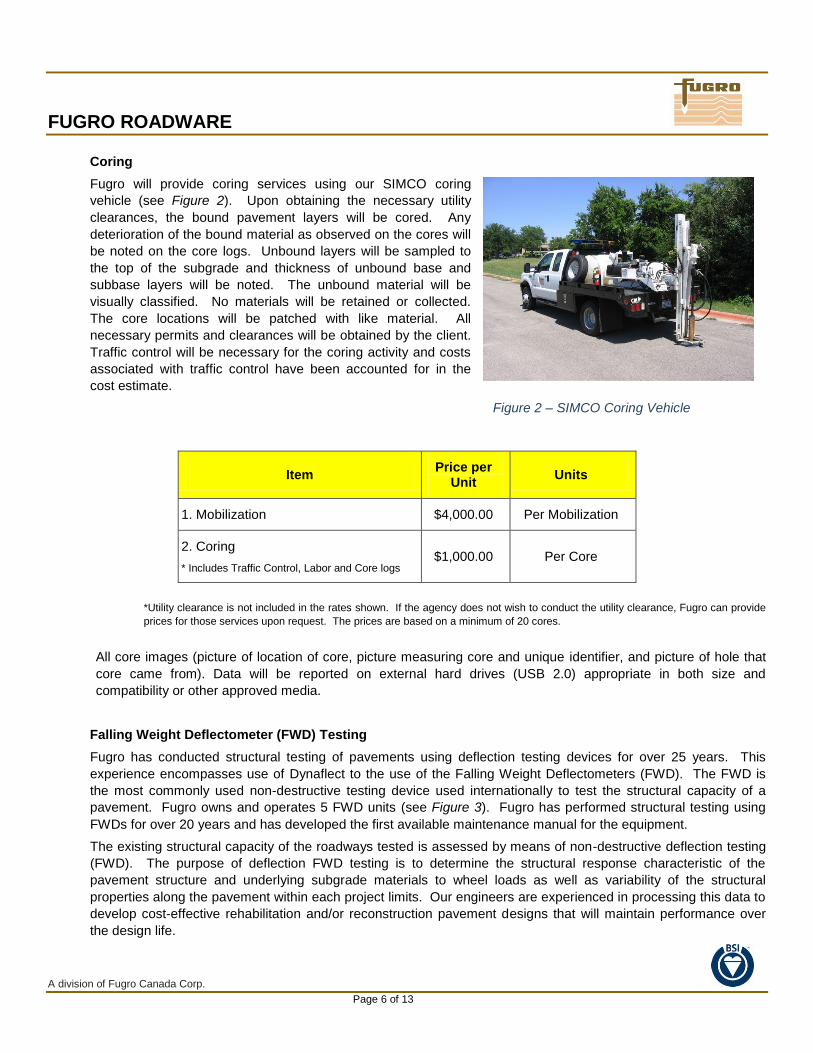
Coring
Fugro will provide coring services using our SIMCO coring
vehicle (see Figure 2). Upon obtaining the necessary utility
clearances, the bound pavement layers will be cored. Any
deterioration of the bound material as observed on the cores will
be noted on the core logs. Unbound layers will be sampled to
the top of the subgrade and thickness of unbound base and
subbase layers will be noted. The unbound material will be
visually classified. No materials will be retained or collected.
The core locations will be patched with like material. All
necessary permits and clearances will be obtained by the client.
Traffic control will be necessary for the coring activity and costs
associated with traffic control have been accounted for in the
cost estimate.
Figure 2 – SIMCO Coring Vehicle
Item Price per
Unit Units
1. Mobilization $4,000.00 Per Mobilization
2. Coring
* Includes Traffic Control, Labor and Core logs $1,000.00 Per Core
*Utility clearance is not included in the rates shown. If the agency does not wish to conduct the utility clearance, Fugro can provide
prices for those services upon request. The prices are based on a minimum of 20 cores.
All core images (picture of location of core, picture measuring core and unique identifier, and picture of hole that
core came from). Data will be reported on external hard drives (USB 2.0) appropriate in both size and
compatibility or other approved media.
Falling Weight Deflectometer (FWD) Testing
Fugro has conducted structural testing of pavements using deflection testing devices for over 25 years. This
experience encompasses use of Dynaflect to the use of the Falling Weight Deflectometers (FWD). The FWD is
the most commonly used non-destructive testing device used internationally to test the structural capacity of a
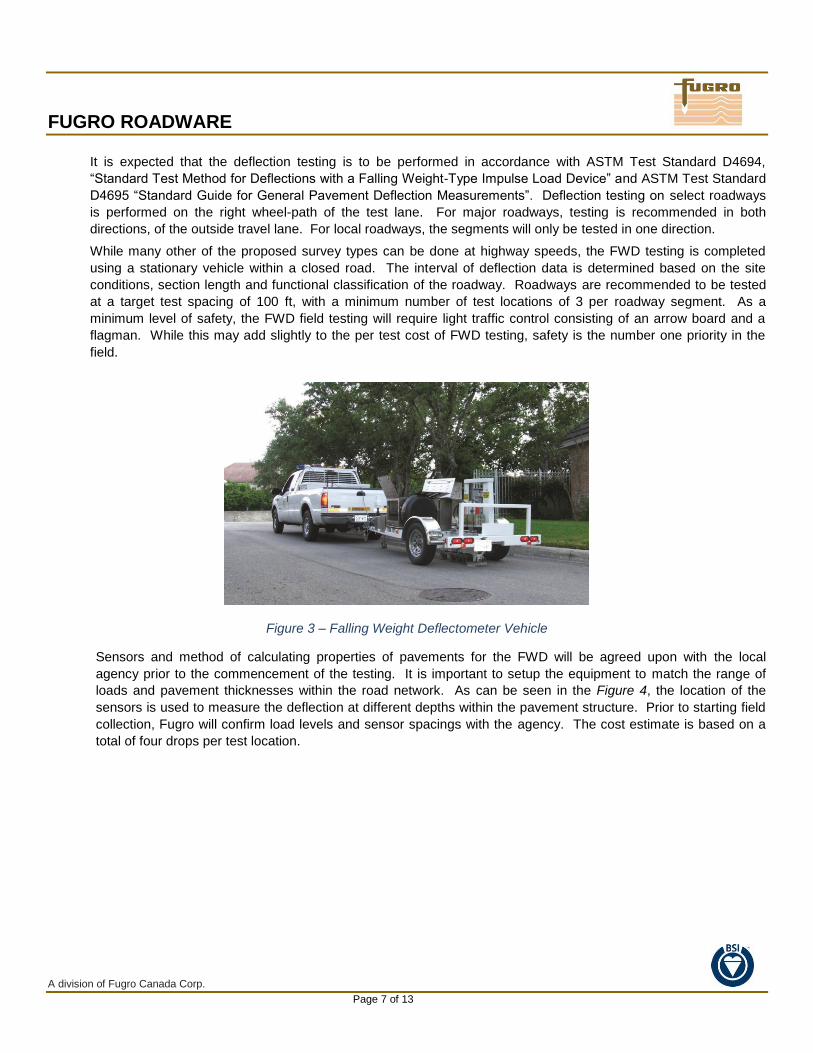
pavement. Fugro owns and operates 5 FWD units (see Figure 3). Fugro has performed structural testing using
FWDs for over 20 years and has developed the first available maintenance manual for the equipment.
The existing structural capacity of the roadways tested is assessed by means of non-destructive deflection testing
(FWD). The purpose of deflection FWD testing is to determine the structural response characteristic of the
pavement structure and underlying subgrade materials to wheel loads as well as variability of the structural
properties along the pavement within each project limits. Our engineers are experienced in processing this data to
develop cost-effective rehabilitation and/or reconstruction pavement designs that will maintain performance over
the design life.
FUGRO ROADWARE
A division of Fugro Canada Corp. Page 7 of 13
It is expected that the deflection testing is to be performed in accordance with ASTM Test Standard D4694,
“Standard Test Method for Deflections with a Falling Weight-Type Impulse Load Device” and ASTM Test Standard
D4695 “Standard Guide for General Pavement Deflection Measurements”. Deflection testing on select roadways
is performed on the right wheel-path of the test lane. For major roadways, testing is recommended in both
directions, of the outside travel lane. For local roadways, the segments will only be tested in one direction.
While many other of the proposed survey types can be done at highway speeds, the FWD testing is completed
using a stationary vehicle within a closed road. The interval of deflection data is determined based on the site
conditions, section length and functional classification of the roadway. Roadways are recommended to be tested
at a target test spacing of 100 ft, with a minimum number of test locations of 3 per roadway segment. As a
minimum level of safety, the FWD field testing will require light traffic control consisting of an arrow board and a
flagman. While this may add slightly to the per test cost of FWD testing, safety is the number one priority in the
field.
Figure 3 – Falling Weight Deflectometer Vehicle
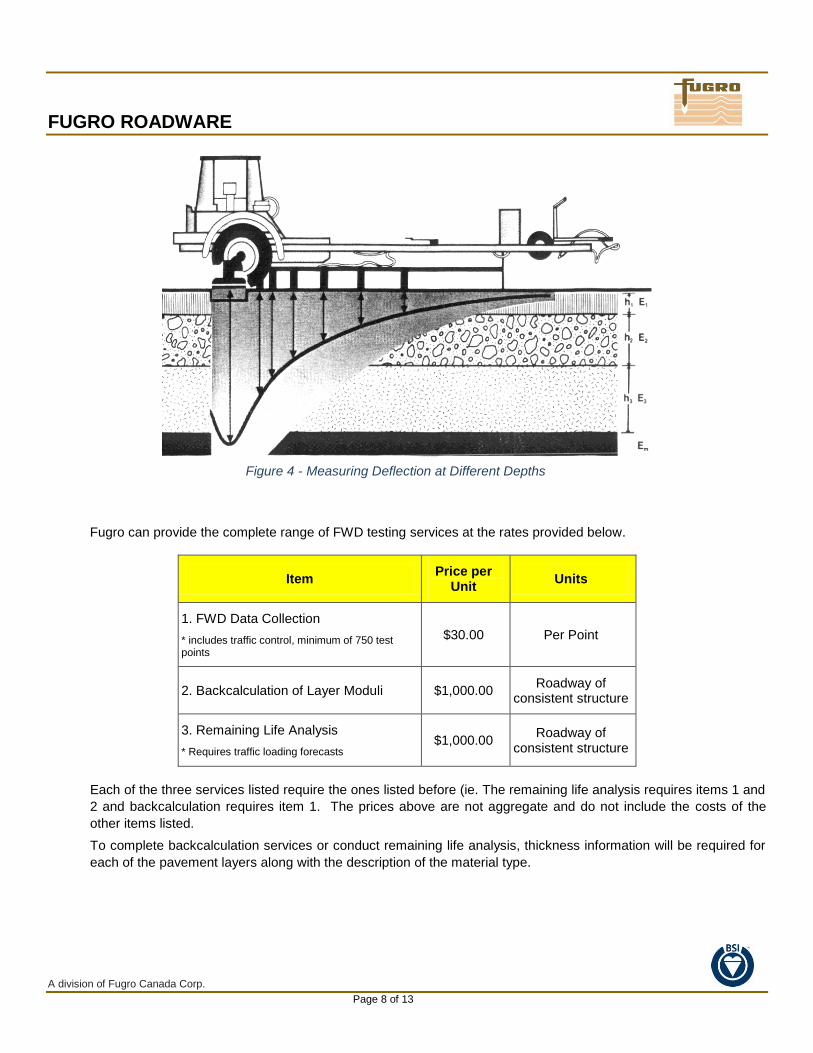
Sensors and method of calculating properties of pavements for the FWD will be agreed upon with the local
agency prior to the commencement of the testing. It is important to setup the equipment to match the range of
loads and pavement thicknesses within the road network. As can be seen in the Figure 4, the location of the
sensors is used to measure the deflection at different depths within the pavement structure. Prior to starting field
collection, Fugro will confirm load levels and sensor spacings with the agency. The cost estimate is based on a
total of four drops per test location.
FUGRO ROADWARE
A division of Fugro Canada Corp. Page 8 of 13
Fugro can provide the complete range of FWD testing services at the rates provided below.
Item Price per
Unit Units
1. FWD Data Collection
* includes traffic control, minimum of 750 test points
$30.00 Per Point
2. Backcalculation of Layer Moduli $1,000.00 Roadway of
consistent structure
3. Remaining Life Analysis
* Requires traffic loading forecasts $1,000.00
Roadway of consistent structure
Each of the three services listed require the ones listed before (ie. The remaining life analysis requires items 1 and
2 and backcalculation requires item 1. The prices above are not aggregate and do not include the costs of the
other items listed.
To complete backcalculation services or conduct remaining life analysis, thickness information will be required for
each of the pavement layers along with the description of the material type.
Figure 4 - Measuring Deflection at Different Depths
FUGRO ROADWARE
A division of Fugro Canada Corp. Page 9 of 13
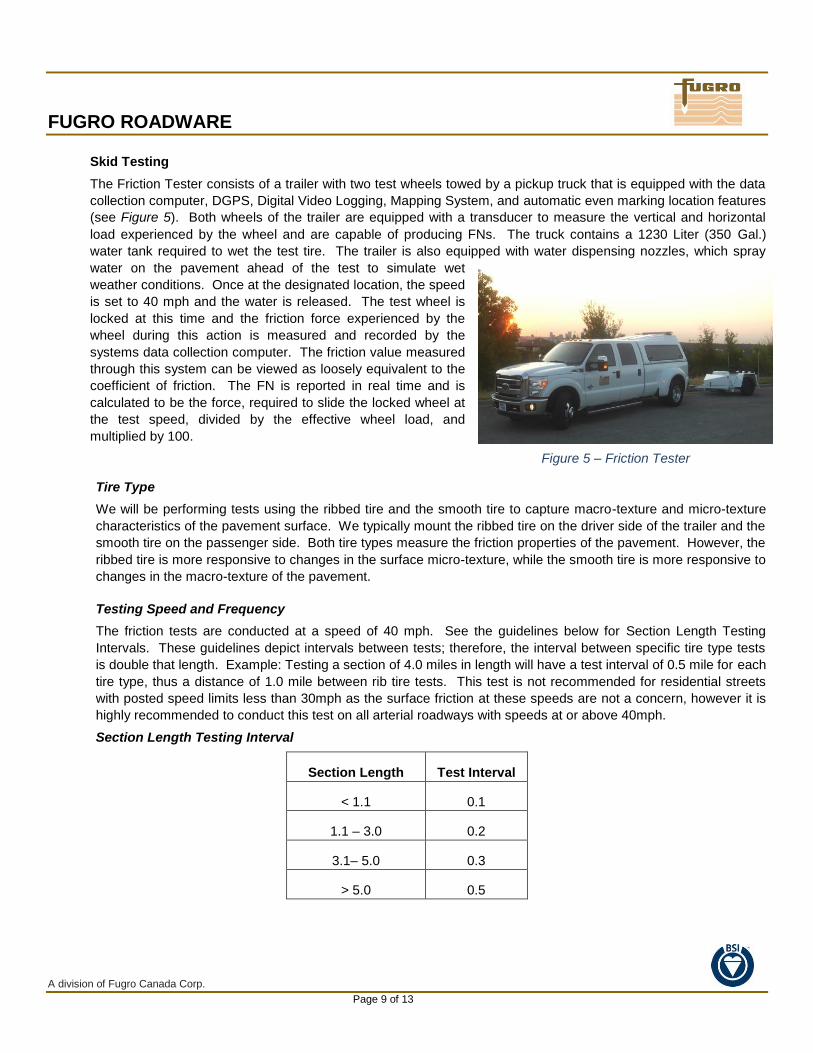
Skid Testing
The Friction Tester consists of a trailer with two test wheels towed by a pickup truck that is equipped with the data
collection computer, DGPS, Digital Video Logging, Mapping System, and automatic even marking location features
(see Figure 5). Both wheels of the trailer are equipped with a transducer to measure the vertical and horizontal
load experienced by the wheel and are capable of producing FNs. The truck contains a 1230 Liter (350 Gal.)
water tank required to wet the test tire. The trailer is also equipped with water dispensing nozzles, which spray
water on the pavement ahead of the test to simulate wet
weather conditions. Once at the designated location, the speed
is set to 40 mph and the water is released. The test wheel is
locked at this time and the friction force experienced by the
wheel during this action is measured and recorded by the
systems data collection computer. The friction value measured
through this system can be viewed as loosely equivalent to the
coefficient of friction. The FN is reported in real time and is
calculated to be the force, required to slide the locked wheel at
the test speed, divided by the effective wheel load, and
multiplied by 100.
Figure 5 – Friction Tester
Tire Type
We will be performing tests using the ribbed tire and the smooth tire to capture macro-texture and micro-texture
characteristics of the pavement surface. We typically mount the ribbed tire on the driver side of the trailer and the
smooth tire on the passenger side. Both tire types measure the friction properties of the pavement. However, the
ribbed tire is more responsive to changes in the surface micro-texture, while the smooth tire is more responsive to
changes in the macro-texture of the pavement.
Testing Speed and Frequency
The friction tests are conducted at a speed of 40 mph. See the guidelines below for Section Length Testing
Intervals. These guidelines depict intervals between tests; therefore, the interval between specific tire type tests
is double that length. Example: Testing a section of 4.0 miles in length will have a test interval of 0.5 mile for each
tire type, thus a distance of 1.0 mile between rib tire tests. This test is not recommended for residential streets
with posted speed limits less than 30mph as the surface friction at these speeds are not a concern, however it is
highly recommended to conduct this test on all arterial roadways with speeds at or above 40mph.
Section Length Testing Interval
Section Length Test Interval
< 1.1 0.1
1.1 – 3.0 0.2
3.1– 5.0 0.3
> 5.0 0.5
FUGRO ROADWARE
A division of Fugro Canada Corp. Page 10 of 13
Calibration
The Fugro Friction Tester is calibrated yearly at the Texas Transportation Calibration on Facility per ASTM
E2793-10 standards. The most recent calibration was in June 2012.
Quality Assurance
Fugro establishes calibration verification sections in various districts in Georgia and runs them on a weekly basis
to ensure quality friction numbers are being collected.
Safety
Our technicians are certified DOT drivers that are held to a higher standard of safety and responsibility. The
friction truck tests at near highway speeds so on many highways interrupting the normal flow of traffic will be
minimal. Our truck is equipped with overhead lights to alert traffic in the area.
Deliverables
Typically, data is delivered in an Access database and a bound report summarizing the friction data. We can
produce GIS maps of the friction data if desired. FNs < 25 will be reported by location, time, and date of tests.
The system plots friction curves including brake application, peak incipient friction, wheel lock up and release,
water start and stop and other relevant data. Data includes calibration values, time of calibration, time of test,
weather conditions, and other details concerning the settings used while testing.
Fugro can provide the complete range of Friction testing services at the rates provided below.
Item (for less than 400 miles) Price per Unit Units
1. Basic Service - Collection and delivery of excel spread sheet $141.00 Per Mile
2. Basic + Added Service – Item 1 plus a final report $171.00 Per Mile
Item (for more than 400 miles) Price per Unit Units
1. Basic Service - Collection and delivery of excel spread sheet $70.00 Per Mile
2. Basic + Added Service – Item 1 plus a final report $75.00 Per Mile
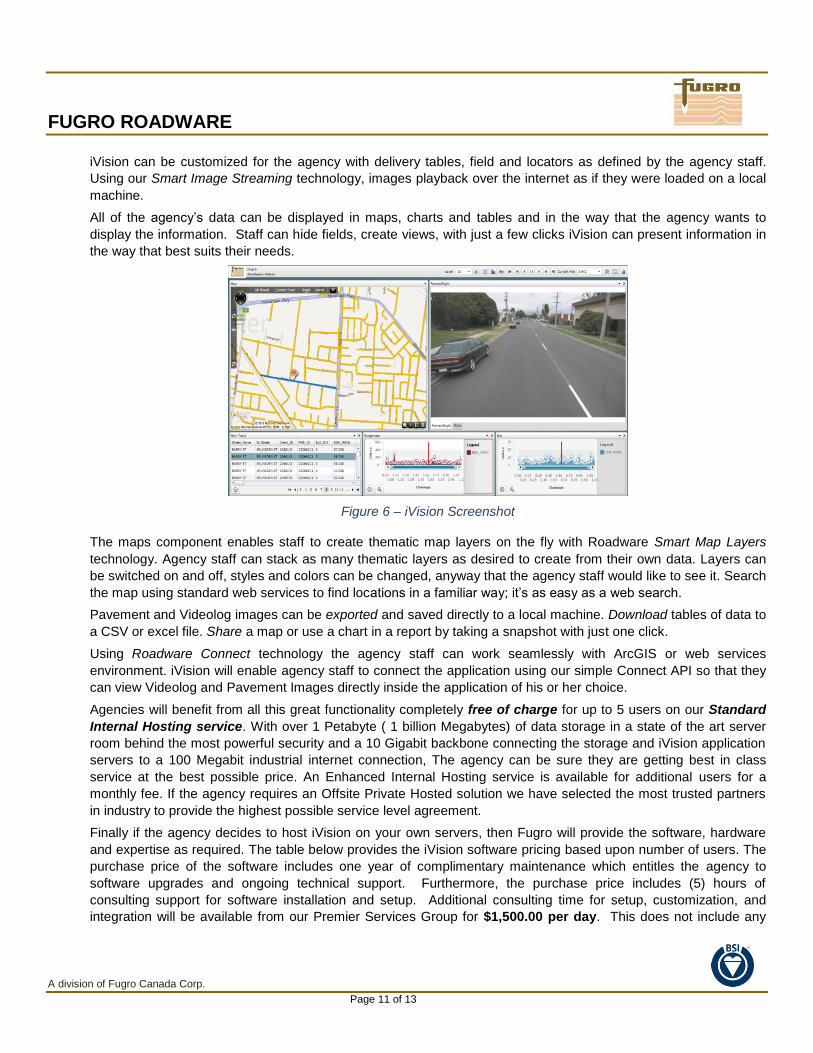
Web viewing Software – iVision
For data review and quality control, Fugro can offer the agencies our iVision software (see Figure 6). iVision is
Fugro‟s next generation web-based software that is ideal for inter-office and remote location deployment of images
and analyzed road data. Users can access the images and data anywhere they have a web browser and internet
connection. Processed data can be viewed in a user-customizable workspace and all views remain synchronized
with each other. iVision allows staff to view right-of-way videolog, pavement images, and his or her choice of
collected pavement management and condition data over the internet.
FUGRO ROADWARE
A division of Fugro Canada Corp. Page 11 of 13
iVision can be customized for the agency with delivery tables, field and locators as defined by the agency staff.
Using our Smart Image Streaming technology, images playback over the internet as if they were loaded on a local
machine.
All of the agency‟s data can be displayed in maps, charts and tables and in the way that the agency wants to
display the information. Staff can hide fields, create views, with just a few clicks iVision can present information in
the way that best suits their needs.
Figure 6 – iVision Screenshot The maps component enables staff to create thematic map layers on the fly with Roadware Smart Map Layers
technology. Agency staff can stack as many thematic layers as desired to create from their own data. Layers can
be switched on and off, styles and colors can be changed, anyway that the agency staff would like to see it. Search
the map using standard web services to find locations in a familiar way; it‟s as easy as a web search.
Pavement and Videolog images can be exported and saved directly to a local machine. Download tables of data to
a CSV or excel file. Share a map or use a chart in a report by taking a snapshot with just one click.
Using Roadware Connect technology the agency staff can work seamlessly with ArcGIS or web services
environment. iVision will enable agency staff to connect the application using our simple Connect API so that they
can view Videolog and Pavement Images directly inside the application of his or her choice.
Agencies will benefit from all this great functionality completely free of charge for up to 5 users on our Standard
Internal Hosting service. With over 1 Petabyte ( 1 billion Megabytes) of data storage in a state of the art server
room behind the most powerful security and a 10 Gigabit backbone connecting the storage and iVision application
servers to a 100 Megabit industrial internet connection, The agency can be sure they are getting best in class
service at the best possible price. An Enhanced Internal Hosting service is available for additional users for a
monthly fee. If the agency requires an Offsite Private Hosted solution we have selected the most trusted partners
in industry to provide the highest possible service level agreement.
Finally if the agency decides to host iVision on your own servers, then Fugro will provide the software, hardware
and expertise as required. The table below provides the iVision software pricing based upon number of users. The
purchase price of the software includes one year of complimentary maintenance which entitles the agency to
software upgrades and ongoing technical support. Furthermore, the purchase price includes (5) hours of
consulting support for software installation and setup. Additional consulting time for setup, customization, and
integration will be available from our Premier Services Group for $1,500.00 per day. This does not include any
FUGRO ROADWARE
A division of Fugro Canada Corp. Page 12 of 13
associated fees associated with providing on-site services including travel, accommodations and meals. We also
offer iVision training and recommend a minimum of one day with software purchase. iVision software training is
also $1,500.00 per day.
Upon the completion of the first year, annual maintenance can be purchased that entitles the agency ongoing
technical support and software upgrades. The annual maintenance fee has been included in the table for your
reference.
Item Purchase Price Annual Maintenance Fee
Up to 20 users $5,000.00 $1,250.00
Up to 50 users $10,000.00 $2,500.00
Up to 100 users $15,000.00 $3,750.00
100+ users $25,000.00 $6,250.00
Pricing is valid for 60 days and has been quoted in USD, not including applicable taxes. Payment terms are net 30
days.
If you have any questions or require clarification, please do not hesitate to contact me at (905) 567-2870 ext. 2780
or via e-mail at [email protected].
Yours sincerely,
On Behalf of Fugro
Kelly Hall Account Manager
FUGRO ROADWARE
A division of Fugro Canada Corp. Page 13 of 13
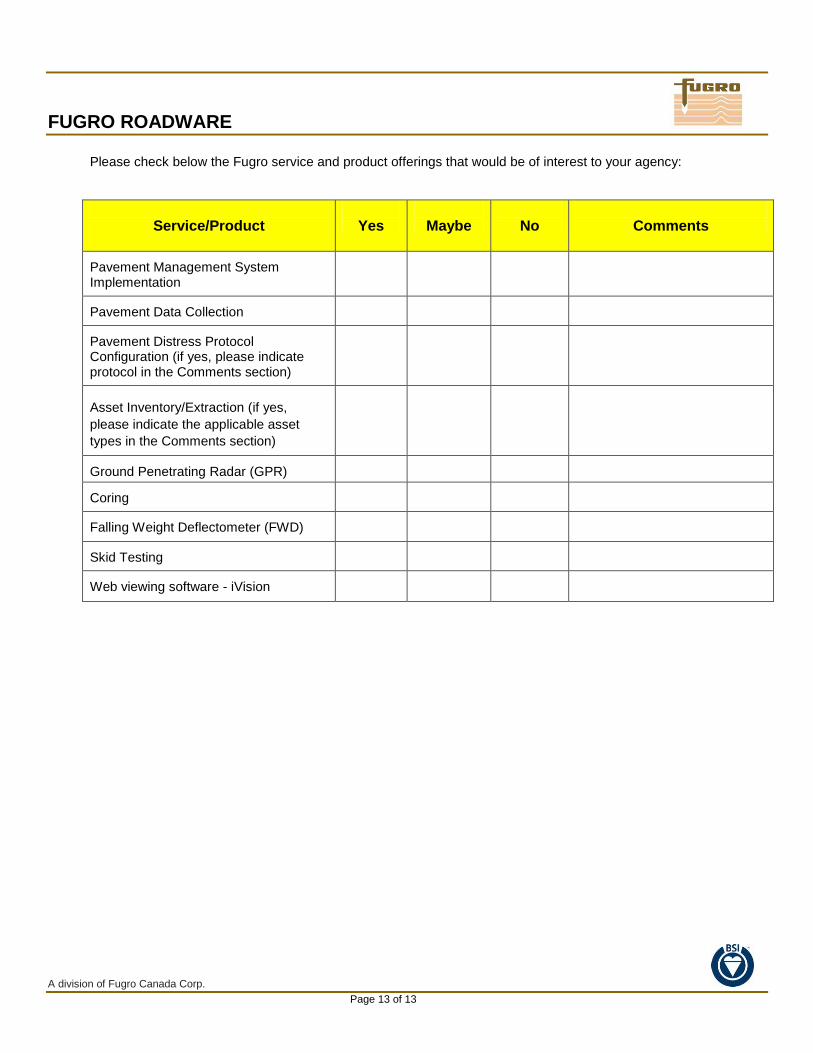
Please check below the Fugro service and product offerings that would be of interest to your agency:
Service/Product
Yes
Maybe
No
Comments
Pavement Management System Implementation
Pavement Data Collection
Pavement Distress Protocol Configuration (if yes, please indicate protocol in the Comments section)
Asset Inventory/Extraction (if yes,
please indicate the applicable asset
types in the Comments section)
Ground Penetrating Radar (GPR)
Coring
Falling Weight Deflectometer (FWD)
Skid Testing
Web viewing software - iVision
Recommended