www.eia.gov U.S. Energy Information Administration Independent Statistics & Analysis
Fuels Used in Electricity Generation
For U.S. Nuclear Infrastructure Council June 05, 2013 | Washington, DC By Adam Sieminski, Administrator

Over time the electricity mix gradually shifts to lower-carbon options, led by growth in natural gas and renewable generation
2
0
1
2
3
4
5
6
1990 1995 2000 2005 2010 2015 2020 2025 2030 2035 2040
U.S. electricity net generation trillion kilowatthours
25%
19%
42%
13%
1%
Nuclear
Oil and other liquids
Natural gas
Coal
Renewables
2011 Projections History
17%
16%
35%
30%
1%
1993
53%
13%
19% 11%
4%
Source: EIA, Annual Energy Outlook 2013
Adam Sieminski, USNIC June 05, 2013

Key results from the AEO2013 reference case relating to the electric power sector
Adam Sieminski, USNIC June 05, 2013 3
• While coal still remains the largest single source of U.S. electricity generation, it’s role declines as natural gas and renewables pick up increasing market share
• Natural gas production is higher throughout the reference case projection than it was in AEO2012, serving the industrial and power sectors and an expanding export market
• Role of nuclear power in the U.S. generation mix stays relatively steady
• The U.S. becomes a larger exporter of natural gas and coal than was projected in the AEO2012 reference case
• U.S. energy-related carbon dioxide emissions remain more than five percent below their 2005 level through 2040, reflecting increased efficiency and the shift to a less carbon-intensive fuel mix

Why we might could will be wrong?
Adam Sieminski, USNIC June 05, 2013 4
• Changing policies and regulations
• Changing consumer preferences
• Faster / slower economic growth
• Faster / slower technological progress
• Different relative fuel prices
• Technological breakthroughs

Electricity demand: growth in electricity use slows, but still increases by 28% from 2012 to 2040
Adam Sieminski, USNIC June 05, 2013 5
-2%
0%
2%
4%
6%
8%
10%
12%
14%
1950 1960 1970 1980 1990 2000 2010 2020 2030 2040
percent growth (3-year compounded annual growth rate)
Source: EIA, Annual Energy Outlook 2013
History Projections
2011
Electricity Use
GDP 2.4%
0.9%
2011 – 2040 average

Natural gas and coal prices: coal regains competitive advantage relative to natural gas over time on a national average basis
6
0
2
4
6
8
1990 1995 2000 2005 2010 2015 2020 2025 2030 2035 2040
ratio of natural gas price to steam coal price
Source: EIA, Annual Energy Outlook 2013
0
2
4
6
8
10
1990 2000 2010 2020 2030 2040
History Projections
2011 2011 dollars per Btu
History Projections 2011
Competitive parity
Energy prices to the electric power sector
Coal
Natural gas
Adam Sieminski, USNIC June 05, 2013
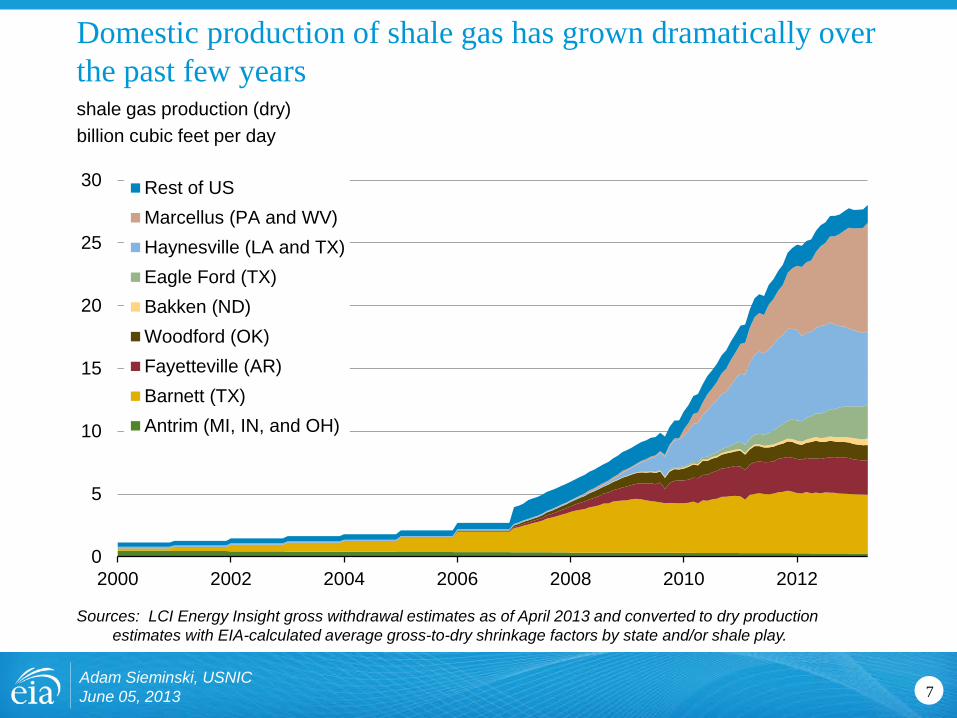
Domestic production of shale gas has grown dramatically over the past few years
Adam Sieminski, USNIC June 05, 2013 7
shale gas production (dry) billion cubic feet per day
Sources: LCI Energy Insight gross withdrawal estimates as of April 2013 and converted to dry production estimates with EIA-calculated average gross-to-dry shrinkage factors by state and/or shale play.
0
5
10
15
20
25
30
2000 2002 2004 2006 2008 2010 2012
Rest of USMarcellus (PA and WV)Haynesville (LA and TX)Eagle Ford (TX)Bakken (ND)Woodford (OK)Fayetteville (AR)Barnett (TX)Antrim (MI, IN, and OH)

New power plant costs: levelized cost of electricity
Adam Sieminski, USNIC June 05, 2013 8
costs for new U.S. electricity power plants in 2018 2011 dollars per megawatthour
Source: EIA, Annual Energy Outlook 2013
0 50 100 150 200 250
Offshore Wind
Solar PV
Pulverized Coal with CCS
IGCC Coal
Biomass
Nuclear
Pulverized Coal
Natural Gas Combined…
Onshore Wind
Natural Gas Combined…Levelized Capital CostFixed O&M CostVariable O&M Cost Including FuelTransmission Costs
Adam Sieminski, USNIC June 05, 2013 9
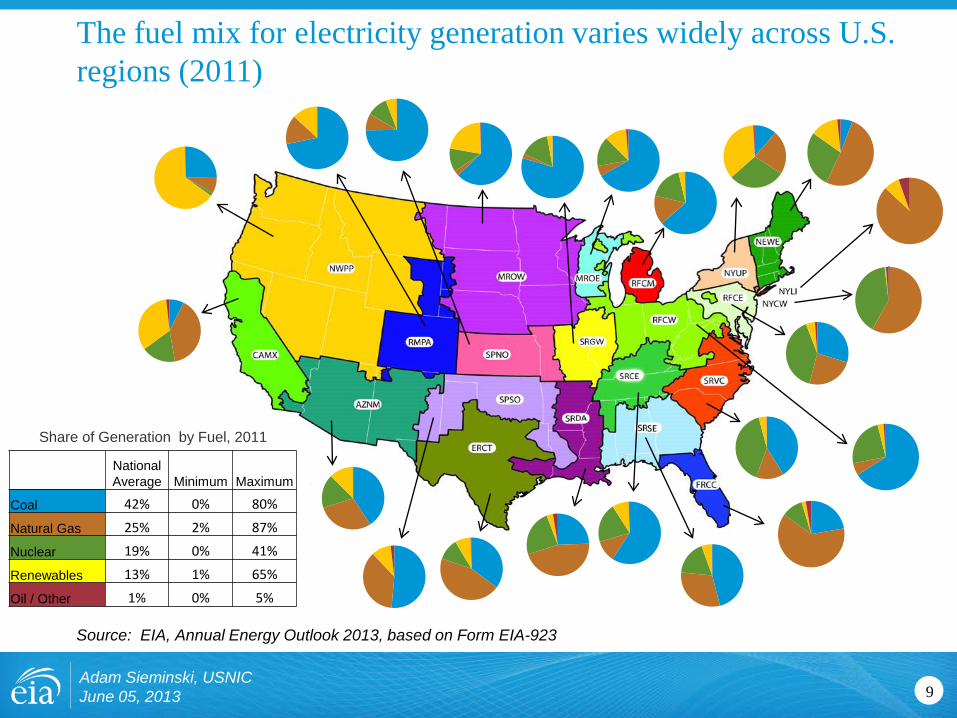
The fuel mix for electricity generation varies widely across U.S. regions (2011)
Source: EIA, Annual Energy Outlook 2013, based on Form EIA-923
National Average Minimum Maximum
Coal 42% 0% 80%
Natural Gas 25% 2% 87%
Nuclear 19% 0% 41%
Renewables 13% 1% 65%
Oil / Other 1% 0% 5%
Share of Generation by Fuel, 2011

Adam Sieminski, USNIC June 05, 2013 10
The projected fuel mix for electricity generation by region (2040)
Source: EIA, Annual Energy Outlook 2013
National Average Minimum Maximum
Coal 35% 0% 69%
Natural Gas 30% 2% 81%
Nuclear 17% 0% 36%
Renewables 16% 1% 53%
Oil / Other 1% 0% 2%
Share of Generation by Fuel, 2040

Additions to electricity generation capacity, 1985-2040
Adam Sieminski, USNIC June 05, 2013 11
U.S. electricity generation capacity additions gigawatts
Source: EIA Form 860 & EIA, Annual Energy Outlook 2013
0
10
20
30
40
50
60
1985 1990 1995 2000 2005 2010 2015 2020 2025 2030 2035 2040
CoalHydroNatural GasNuclearWindSolar
Projection History

Changes in nuclear capacity for the AEO2013 reference case
Adam Sieminski, USNIC June 05, 2013 12
gigawatts
Source: EIA, Annual Energy Outlook 2013
101.1 8.0
5.5 5.5 7.1 113.1
0
20
40
60
80
100
120
140
2011 Capacity Uprates PlannedAdditions
UnplannedAdditons
Retirements 2040 Capacity

Nuclear relevant side cases in AEO2013
Adam Sieminski, USNIC June 05, 2013 13
• High/low nuclear
• High/low oil and gas resource
• Small modular reactors (SMRs) ???
• CO2 fee cases

Adam Sieminski, USNIC June 05, 2013 14
0 5 10 15 20 25 30 35
High Oil and Gas Resource(low natural gas prices)
Low Oil and Gas Resource(high natural gas prices)
Low Nuclear
High Nuclear
Reference
capacity additions gigawatts
Source: EIA, Annual Energy Outlook 2013
Planned Unplanned
Nuclear capacity additions in AEO2013 vary under different assumptions
0
500
1,000
1,500
2,000
2,500
2000 2005 2010 2015 2020 2025 2030 2035 2040
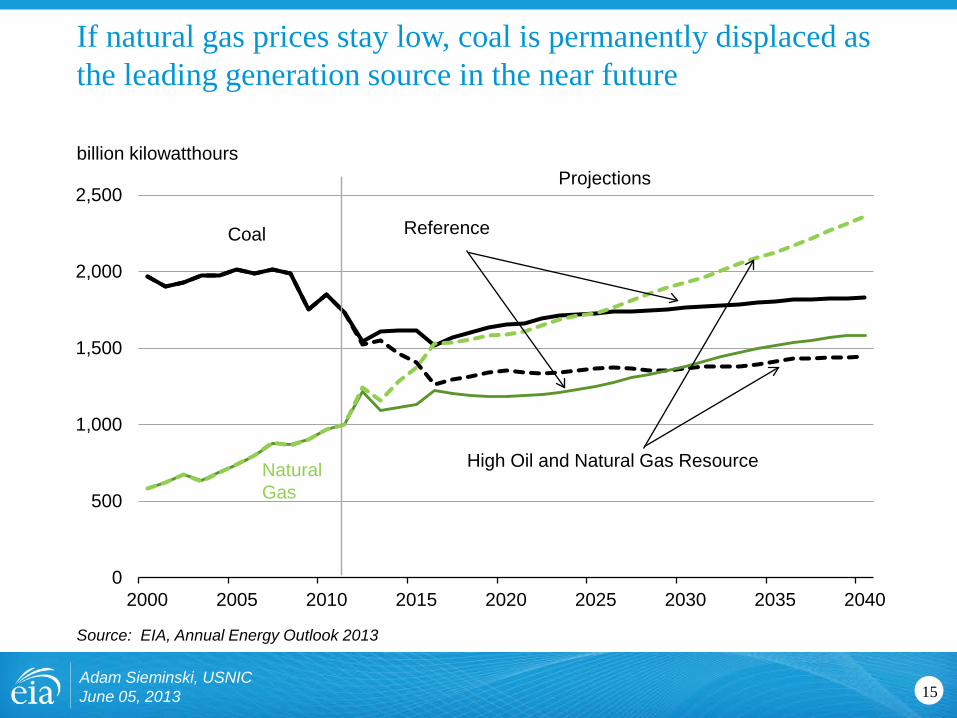
If natural gas prices stay low, coal is permanently displaced as the leading generation source in the near future
Adam Sieminski, USNIC June 05, 2013 15
billion kilowatthours
Source: EIA, Annual Energy Outlook 2013
Coal
Natural Gas
Reference
High Oil and Natural Gas Resource
Projections

Adam Sieminski, USNIC June 05, 2013 16
0 250 500 750 1,000 1,250
2011
Reference
Low Oil andGas Resource
High Oil andGas Resource
Low Coal Cost
High Coal Cost
capacity gigawatts
Source: EIA, Annual Energy Outlook 2013
Coal
Oil/gas steam Natural gas combined cycle
Nuclear Natural gas combustion turbine
Renewable/other
2040
Power sector electricity generation capacity by fuel in five cases, 2011 and 2040
Small Modular Reactors (SMR)
Adam Sieminski, USNIC June 05, 2013 17
• SMR technology differs from traditional, large-scale light-water reactor technology in both reactor size and plant scalability
• EIA conducted a side case to evaluate the effect of a shorter construction period on future nuclear capacity expansion
• The case showed that there are potential cost saving from the shorter construction periods but uncertainty about potential future operations costs remains.

Adam Sieminski, USNIC June 05, 2013 18
Changing electricity generation mix in AEO2013 reference case and carbon fee allowance side cases U.S. electricity net generation trillion kilowatthours
Source: EIA, Annual Energy Outlook 2013
0
1
2
3
4
5
1995 2010 2025 20400
1
2
3
4
5
1995 2010 2025 20400
1
2
3
4
5
1995 2010 2025 2040
2013 Reference Case
Natural gas
Renewables
Nuclear
Coal
2011
24%
13%
19%
42%
30%
16%
17%
35%
Natural gas
$15 Carbon Fee
Renewables
Nuclear
Coal
34%
22%
27%
16%
$25 Carbon Fee
Natural gas
Renewables
Nuclear
Coal
34%
23%
38%
4%

U.S. dependence on imported liquids depends on both supply and demand
19
U.S. liquid fuel supply million barrels per day
Source: EIA, Annual Energy Outlook 2013 and Short-Term Energy Outlook, April 2013
0
5
10
15
20
25
1970 1975 1980 1985 1990 1995 2000 2005 2010 2015 2020 2025 2030 2035 2040
Consumption
Domestic supply
Net imports 37%
Projections History
Petroleum Exports
-8%
32% STEO forecast for 2014
2014
40%
2012
Adam Sieminski, USNIC June 05, 2013

Adam Sieminski, USNIC June 05, 2013 20
Keynote Speakers
Dr. Ernest J. Moniz U.S. Secretary of Energy
Lisa Murkowski United States Senator
Alaska
Thomas Fanning Chairman, President and CEO
Southern Company
Aldo Flores-Quiroga Secretary General International Energy Forum
Hans Rosling Chairman Gapminder
EIA.gov

For more information
Adam Sieminski, USNIC June 05, 2013 21
U.S. Energy Information Administration home page | www.eia.gov
Annual Energy Outlook | www.eia.gov/forecasts/aeo
Short-Term Energy Outlook | www.eia.gov/forecasts/steo
International Energy Outlook | www.eia.gov/forecasts/ieo
Today In Energy | www.eia.gov/todayinenergy
Monthly Energy Review | www.eia.gov/totalenergy/data/monthly
Annual Energy Review | www.eia.gov/totalenergy/data/annual
Recommended