Fueling Growth and Competitiveness in Poland
Through employment, skills and innovation
World Bank EU2020 TeamNina Arnhold, Natasha Kapil, Marcin Piatkowski, Jan Rutkowski
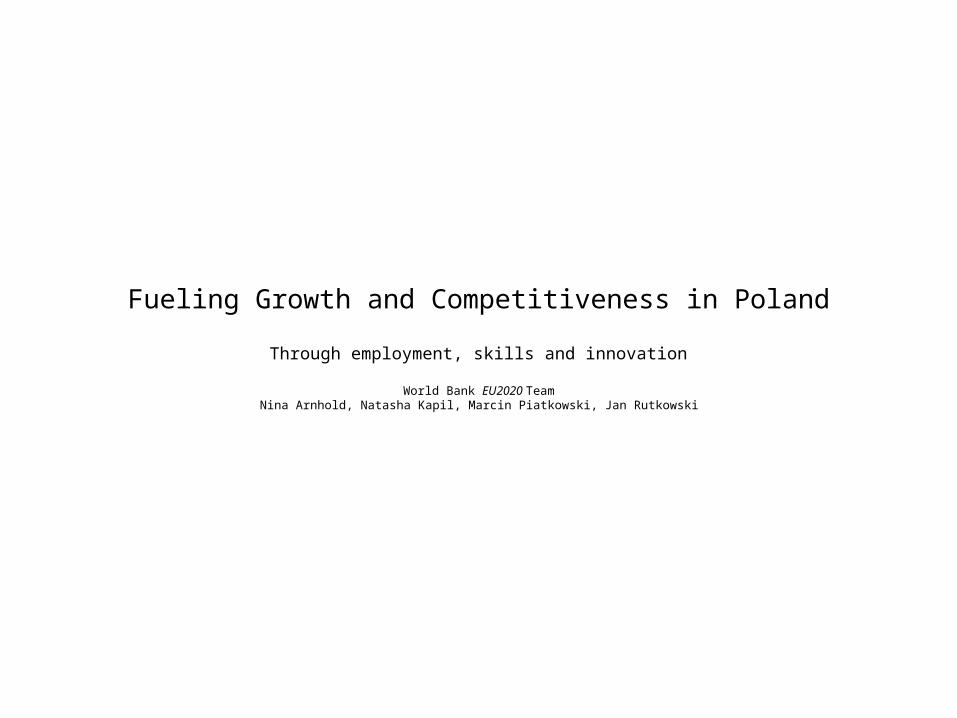
Poland has gone through the crisis in flying colors
-8
-4
0
4
8
12
WorldEurope & Central AsiaDevelopingPoland
Real GDP growth rates in percent
Source: DataStream, World Bank, Global Economic Prospects 2010: Crisis, finance, and growth
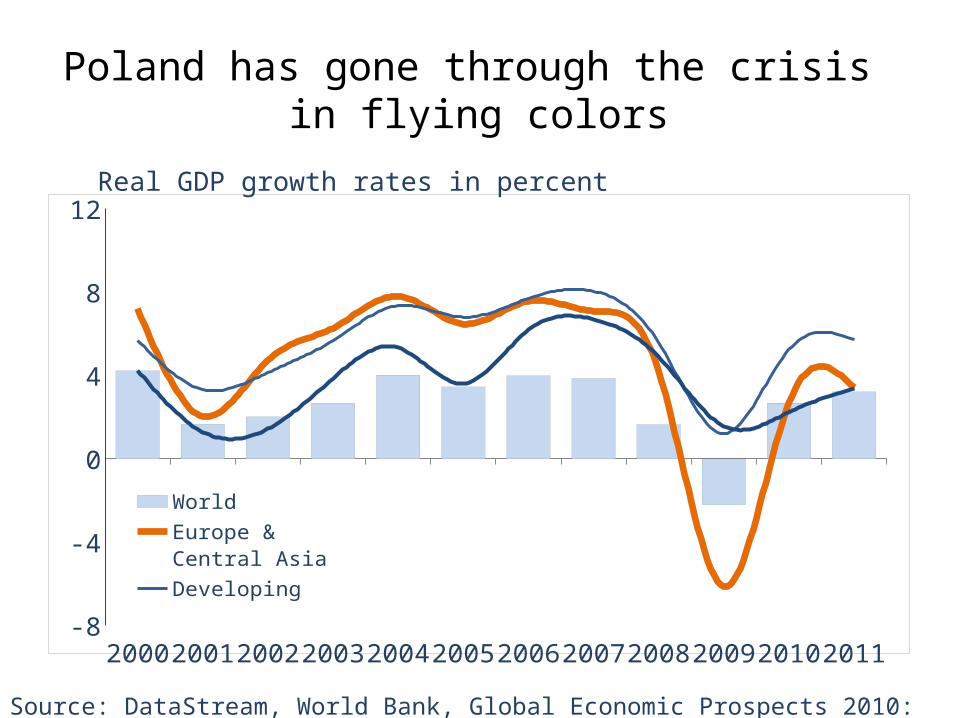
EC sees potential growth still significant but lower

Capital was driver in the past – and is likely to be in future
In meantime revisit employment and labor productivity
Source: Epstein and Macciarelli (2010)
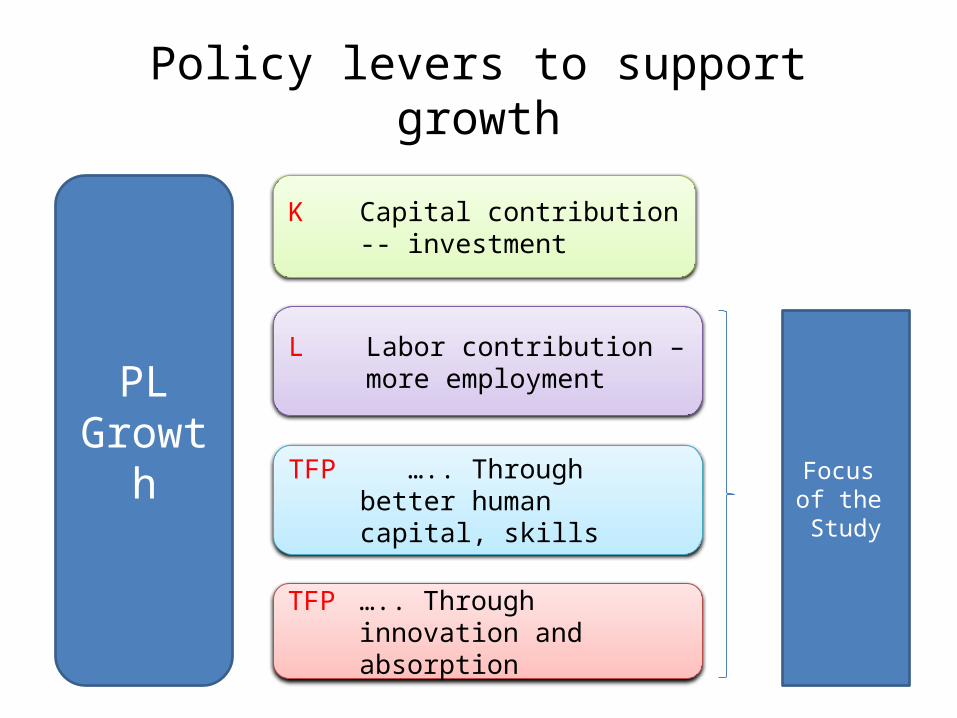
PLGrowth
K Capital contribution -- investment
L Labor contribution – more employment
TFP ….. Through better human capital, skills
TFP ….. Through innovation and absorption
Policy levers to support growth
Focus of the Study

Employment can still drive growth
• EU 2020 headline target: 75 % of the population aged 20-64 should be employed
• Poland: 65% employed substantial gap• Why is the employment rate so low in Poland?– 50+– Women – Youth
• Focus on education and skills as one key factor affecting employment outcomes

Changing skills demand side – does the education system keep up?
From low level to high level skills
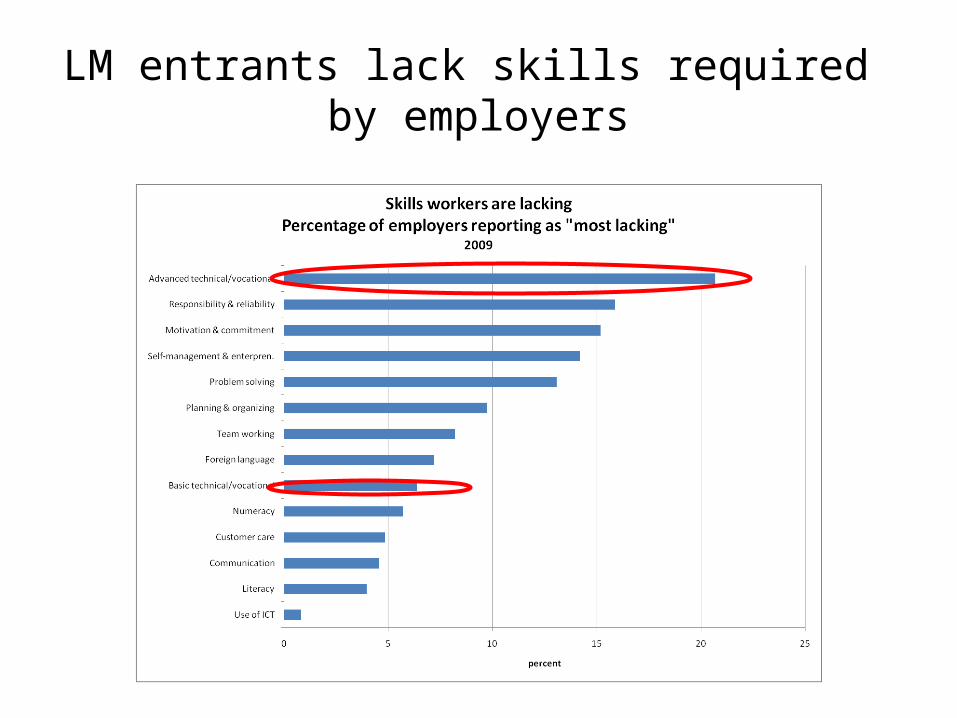
LM entrants lack skills required by employers
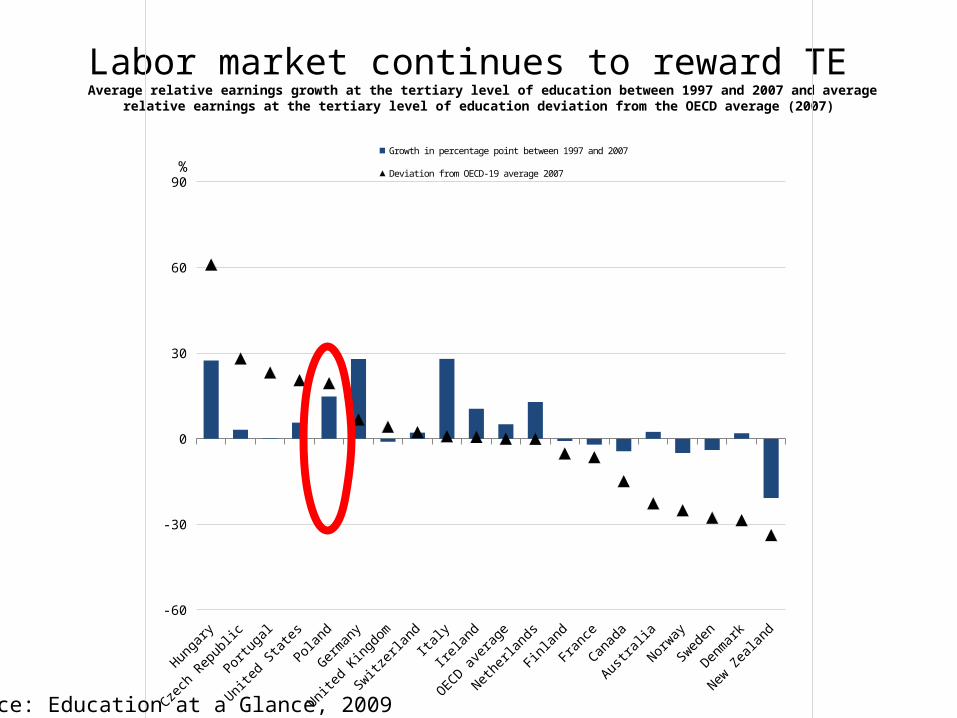
Labor market continues to reward TE Average relative earnings growth at the tertiary level of education between 1997 and 2007 and average
relative earnings at the tertiary level of education deviation from the OECD average (2007)
Hungary
Czech Rep
ublic
Portuga
l
United St
ates
Poland
German
y
United Kingd
om
Switz
erlan
dIta
ly
Irelan
d
OECD av
erage
Netherl
ands
Finlan
dFra
nce
Canad
a
Australi
a
Norway
Swed
en
Denmark
New Ze
aland
-60
-30
0
30
60
90
Growth in percentage point between 1997 and 2007 Deviation from OECD-19 average 2007%
Source: Education at a Glance, 2009
HE Degree Basic VET Primary or lower
0
10
20
30
40
50
60
70
80
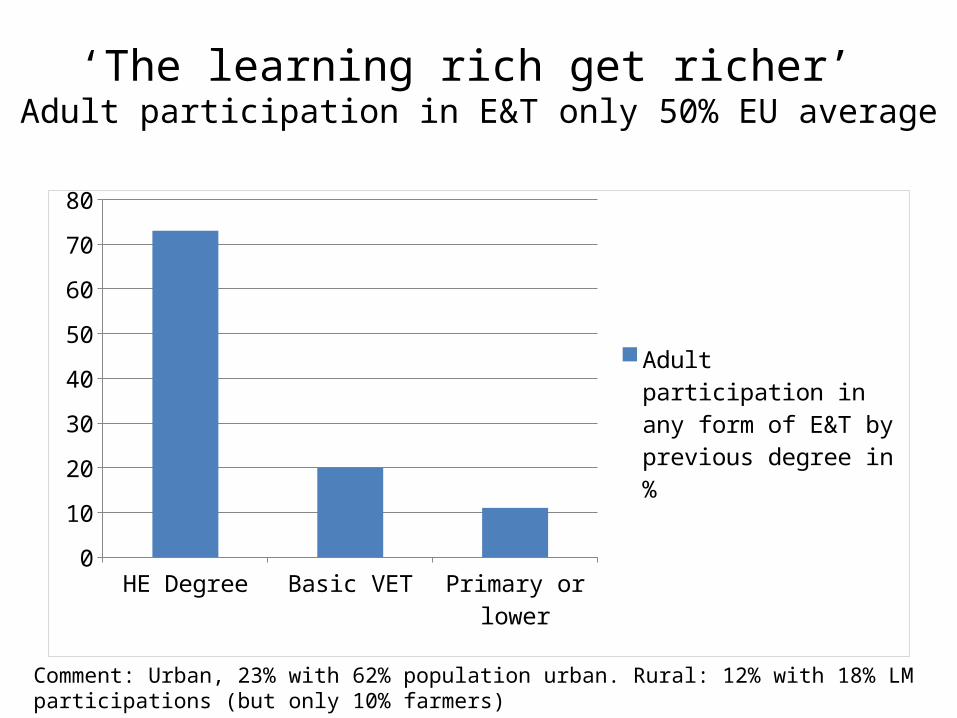
Adult participation in any form of E&T by previous degree in %
‘The learning rich get richer’ Adult participation in E&T only 50% EU average
Comment: Urban, 23% with 62% population urban. Rural: 12% with 18% LM participations (but only 10% farmers)
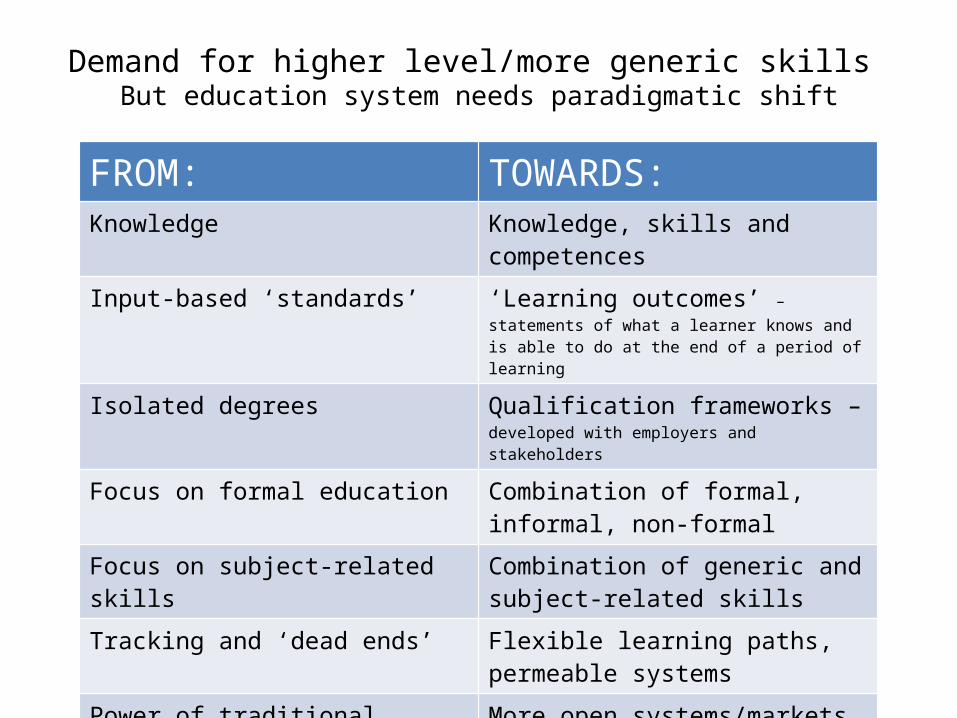
Demand for higher level/more generic skills But education system needs paradigmatic shift
FROM: TOWARDS:Knowledge Knowledge, skills and competences
Input-based ‘standards’ ‘Learning outcomes’ – statements of what a learner knows and is able to do at the end of a period of learning
Isolated degrees Qualification frameworks – developed with employers and stakeholders
Focus on formal education Combination of formal, informal, non-formal
Focus on subject-related skills Combination of generic and subject-related skills
Tracking and ‘dead ends’ Flexible learning paths, permeable systems
Power of traditional providers More open systems/markets
Education is a defined phase in life Lifelong Learning
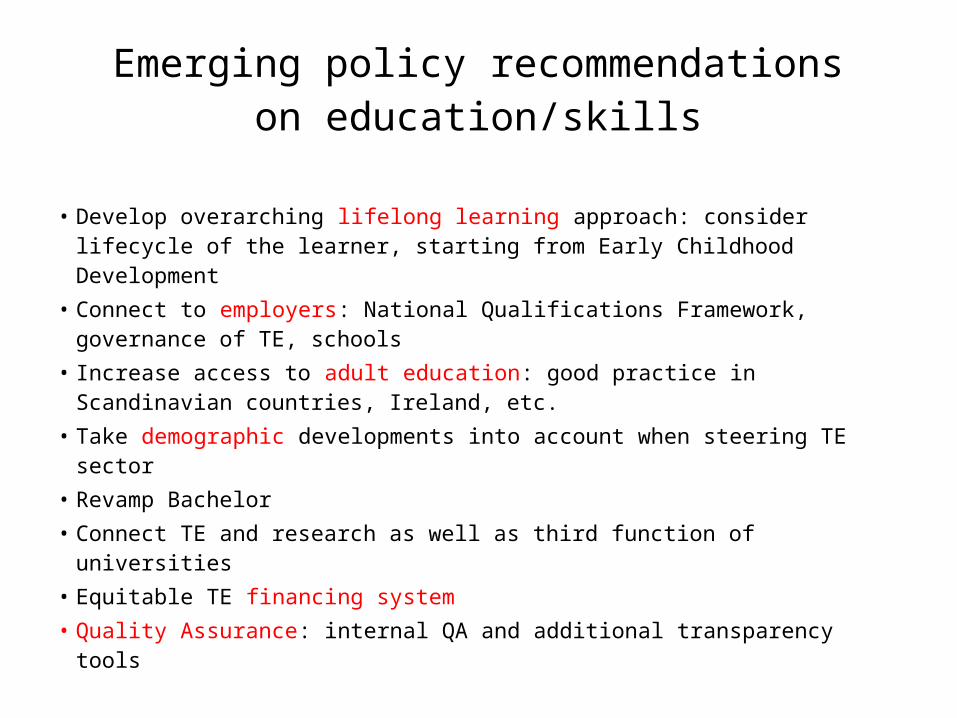
Emerging policy recommendationson education/skills
• Develop overarching lifelong learning approach: consider lifecycle of the learner, starting from Early Childhood Development
• Connect to employers: National Qualifications Framework, governance of TE, schools
• Increase access to adult education: good practice in Scandinavian countries, Ireland, etc.
• Take demographic developments into account when steering TE sector
• Revamp Bachelor • Connect TE and research as well as third function of universities• Equitable TE financing system• Quality Assurance: internal QA and additional transparency tools
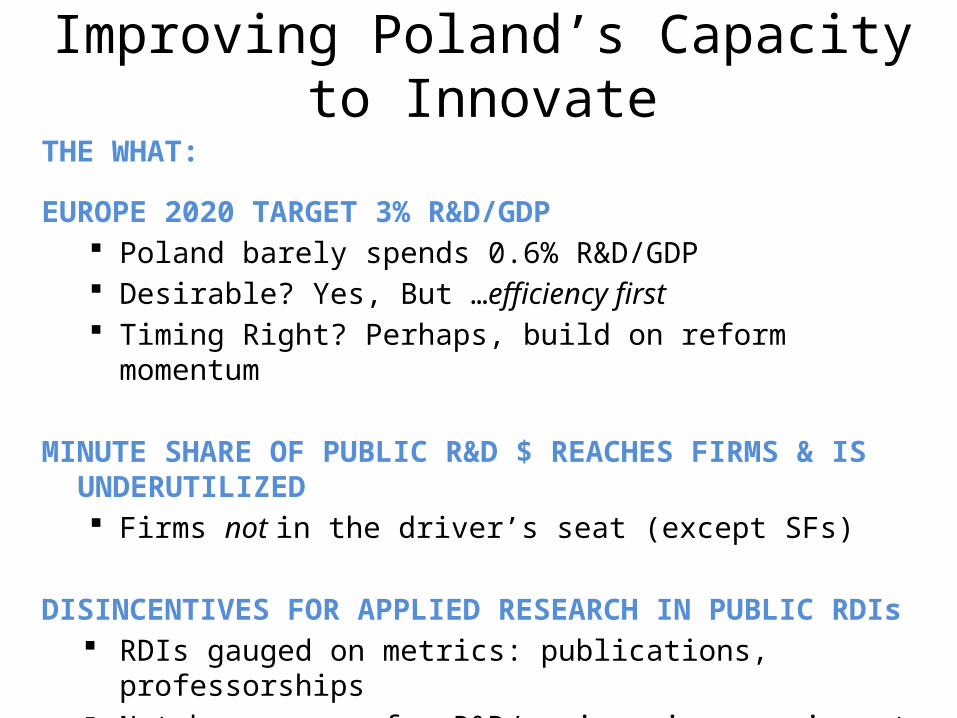
Improving Poland’s Capacity to InnovateTHE WHAT:
EUROPE 2020 TARGET 3% R&D/GDP Poland barely spends 0.6% R&D/GDP Desirable? Yes, But …efficiency first Timing Right? Perhaps, build on reform momentum
MINUTE SHARE OF PUBLIC R&D $ REACHES FIRMS & IS UNDERUTILIZED Firms not in the driver’s seat (except SFs)
DISINCENTIVES FOR APPLIED RESEARCH IN PUBLIC RDIs RDIs gauged on metrics: publications, professorships Not by revenue for R&D/engineering services to firms
14
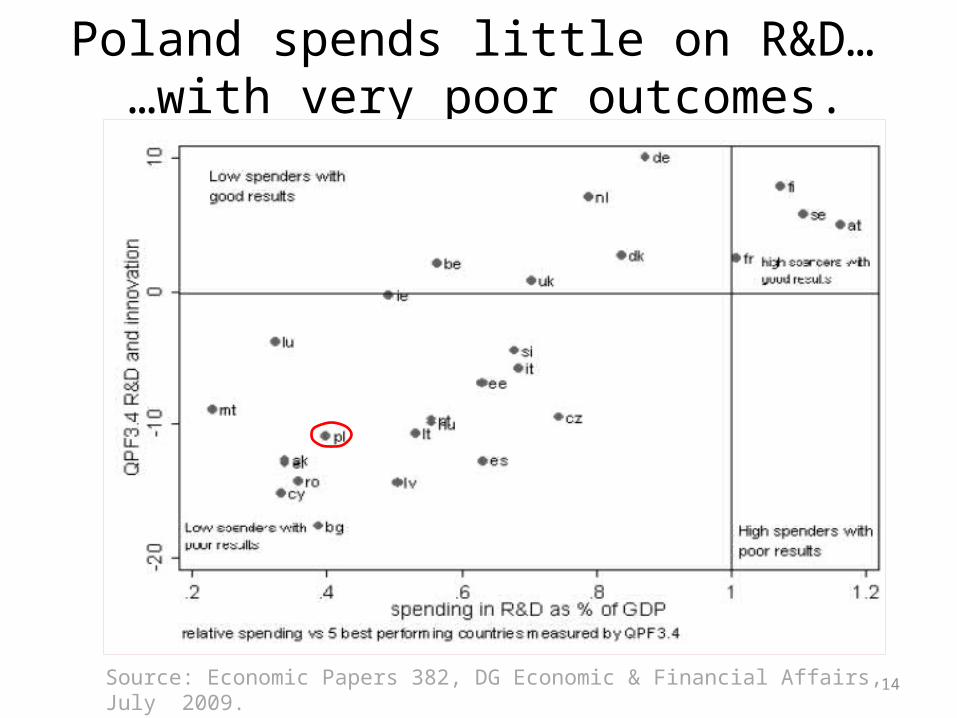
Poland spends little on R&D… …with very poor outcomes.
Source: Economic Papers 382, DG Economic & Financial Affairs, July 2009.
15
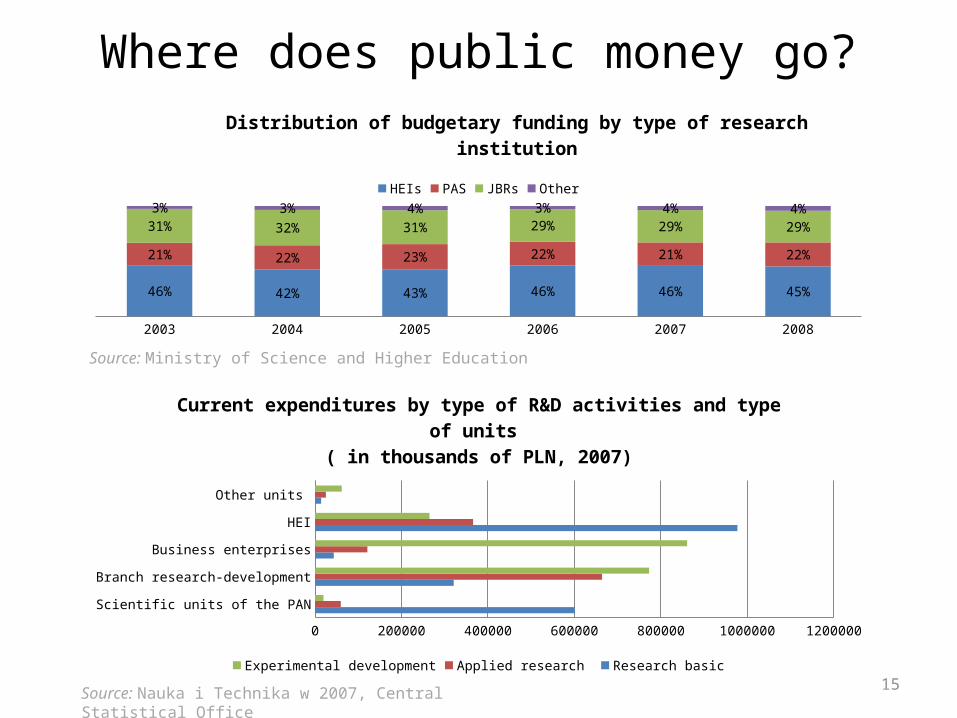
Where does public money go?
2003 2004 2005 2006 2007 2008
46% 42% 43% 46% 46% 45%
21% 22% 23% 22% 21% 22%
31% 32% 31% 29% 29% 29%
3% 3% 4% 3% 4% 4%
Distribution of budgetary funding by type of research institution
HEIs PAS JBRs Other
Scientific units of the PAN
Branch research-development
Business enterprises
HEI
Other units
0 200000 400000 600000 800000 1000000 1200000
Current expenditures by type of R&D activities and type of units ( in thousands of PLN, 2007)
Experimental development Applied research Research basic
Source: Ministry of Science and Higher Education
Source: Nauka i Technika w 2007, Central Statistical Office

16
R&D personnel employed by entity
Source: Central Statistical Office, 2008
PAS6%
Branch research-de-velopment
17%
Business enterprises11%
HEI66%
Other units 1%
R&D Personnel
17
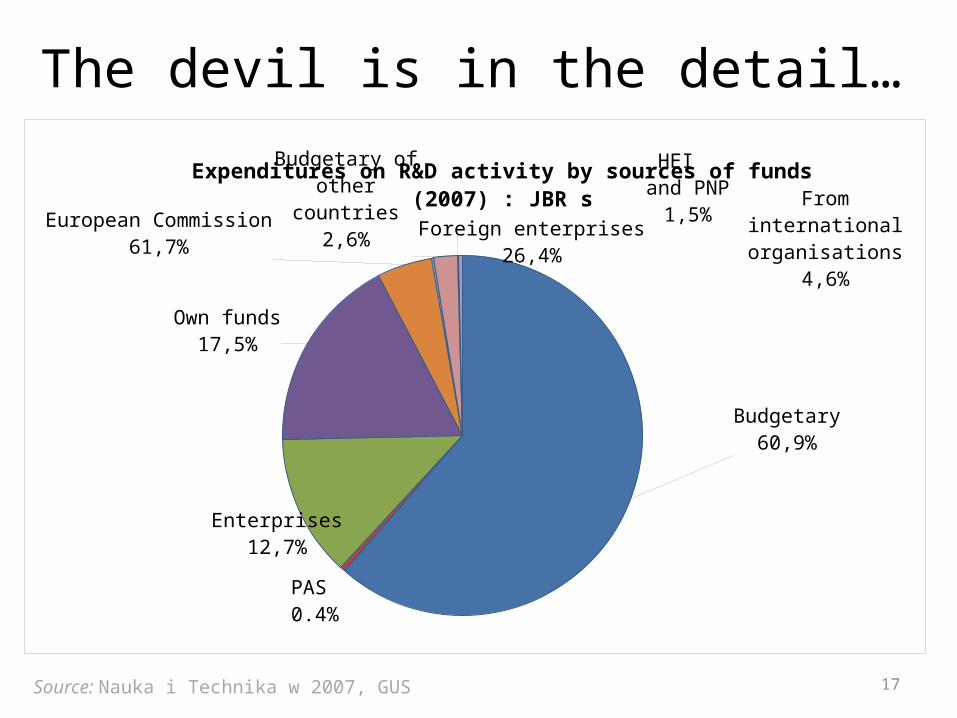
Budgetary60,9%
PAS 0.4%
Enterprises12,7%
Own funds17,5%
European Commission61,7%
Budgetary ofother
countries2,6% Foreign enterprises
26,4%
HEI and PNP
1,5% Frominternationalorganisations
4,6%
Expenditures on R&D activity by sources of funds (2007) : JBR s
Source: Nauka i Technika w 2007, GUS
The devil is in the detail…
18
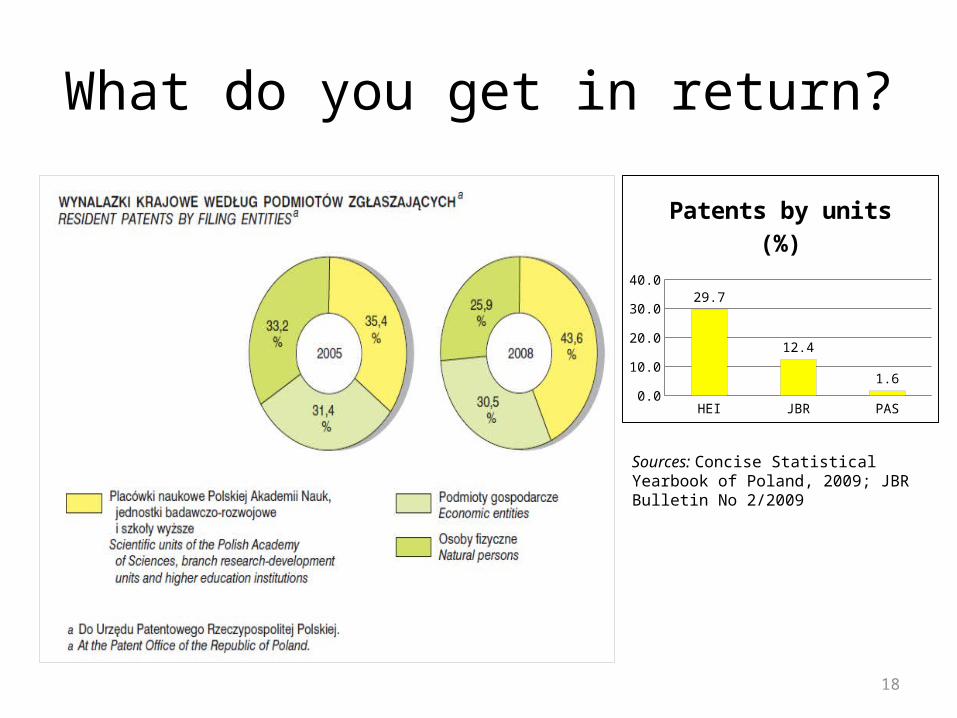
What do you get in return?
HEI JBR PAS0.0
5.0
10.0
15.0
20.0
25.0
30.0
35.029.7
12.4
1.6
Patents by units (%)
Sources: Concise Statistical Yearbook of Poland, 2009; JBR Bulletin No 2/2009
19
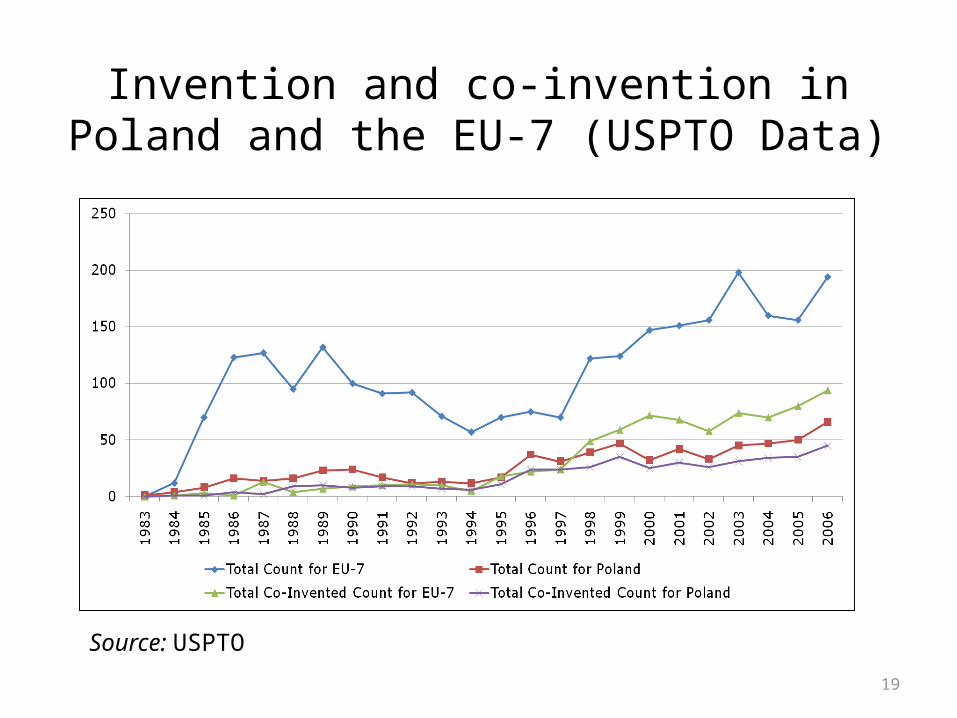
Invention and co-invention in Poland and the EU-7 (USPTO Data)
Source: USPTO
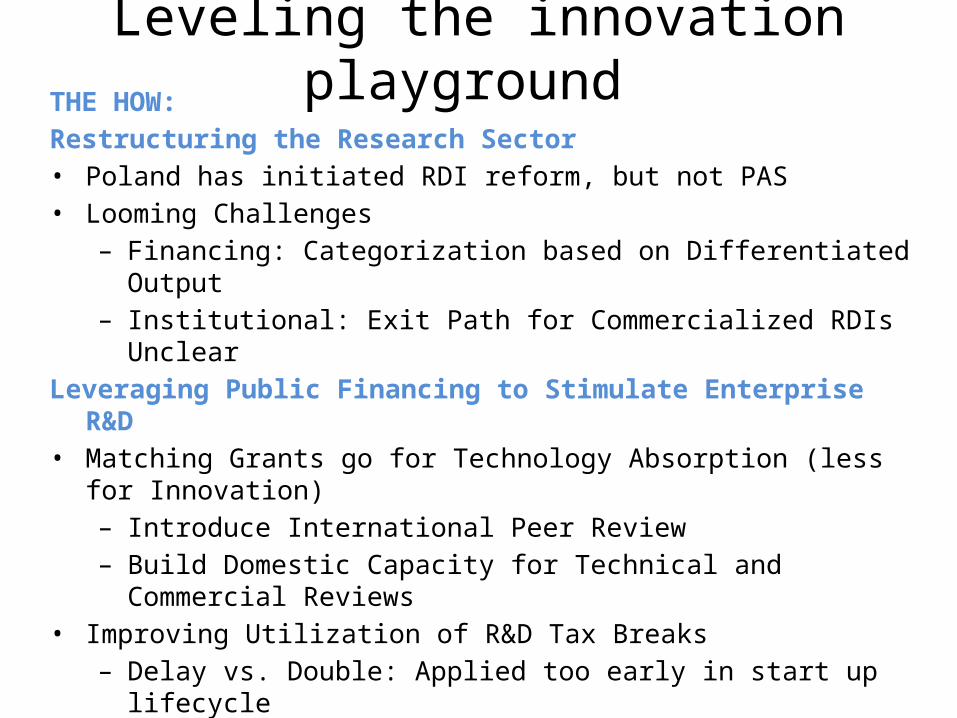
Leveling the innovation playground THE HOW:Restructuring the Research Sector• Poland has initiated RDI reform, but not PAS• Looming Challenges
– Financing: Categorization based on Differentiated Output– Institutional: Exit Path for Commercialized RDIs Unclear
Leveraging Public Financing to Stimulate Enterprise R&D• Matching Grants go for Technology Absorption (less for Innovation)
– Introduce International Peer Review – Build Domestic Capacity for Technical and Commercial Reviews
• Improving Utilization of R&D Tax Breaks– Delay vs. Double: Applied too early in start up lifecycle – Firms wary of tax inspections
• KEF IX lessons: Innovation Assistant Program Promoting International Knowledge Flows via Co-patenting
– Revamping MOSHE “Patent Plus” Program to promote co-inventions
Messages EU 2020
• Countries need to be ambitious (e.g. employment)
• Connect smart and inclusive growth (e.g. equity in education)
• Guidance and peer learning on common issues (e.g. Math Science Technology)
• R&D target: Feasible? Desirable? • How to support countries, how to keep
countries on track?
Recommended