©2016
From VDC to the Digitalization of Construction
Martin Fischer Professor, Civil + Environmental Engineeringand (by courtesy) Computer Science
http://www.stanford.edu/[email protected]
§ Director, CIFE (Center for Integrated Facility Engineering)
§ Foreign Member, Royal Swedish Academy of Engineering Sciences

• 100%fundedbyindustry– Buildingowners– Designandconstructioncompanies– Softwareandhardwarevendors
• 1988-2000– BuildingInformationModeling
(BIM)
• 2000-2010– VirtualDesignandConstruction
(VDC)
• 2010+– OptimizeFacilityPerformance
2

VDCCertificateProgramGraduatesAwardCeremonyonSept.6,2016inSola,Norway

Last Modified 8/15/2016 5:47 P
M P
acific Standard Tim
eP
rinted 8/12/2016 9:10 AM
Central S
tandard Time
4McKinsey & Company
Construction labour productivity has not kept pace with overall economic productivityLabor productivity (gross value added per hour worked, constant prices1)
SOURCE: OECD Industry Stats (http://stats.oecd.org)
1 Based on 2010 prices
$57 trillion of infrastructure investments required by 2030 (McKinsey Global Institute)
Data from Roberto Charron, McKinsey and Paul Teicholz, CIFE

Last Modified 8/15/2016 5:47 P
M P
acific Standard Tim
eP
rinted 8/12/2016 9:10 AM
Central S
tandard Time
5McKinsey & Company
Challenges affecting the construction sector
Internal challenges
▪Shortfalls in accountability▪Talent management▪Reinventing the wheel▪Failure to adapt to new technology▪Coping with complexity
External challenges
▪Fragmented value chains▪Extensive subcontracting▪Complex portfolios▪Competitive pressure
Data from Roberto Charron, McKinsey

©2016
We still produce too much rework …
©2016
… and work too inefficiently

©2016
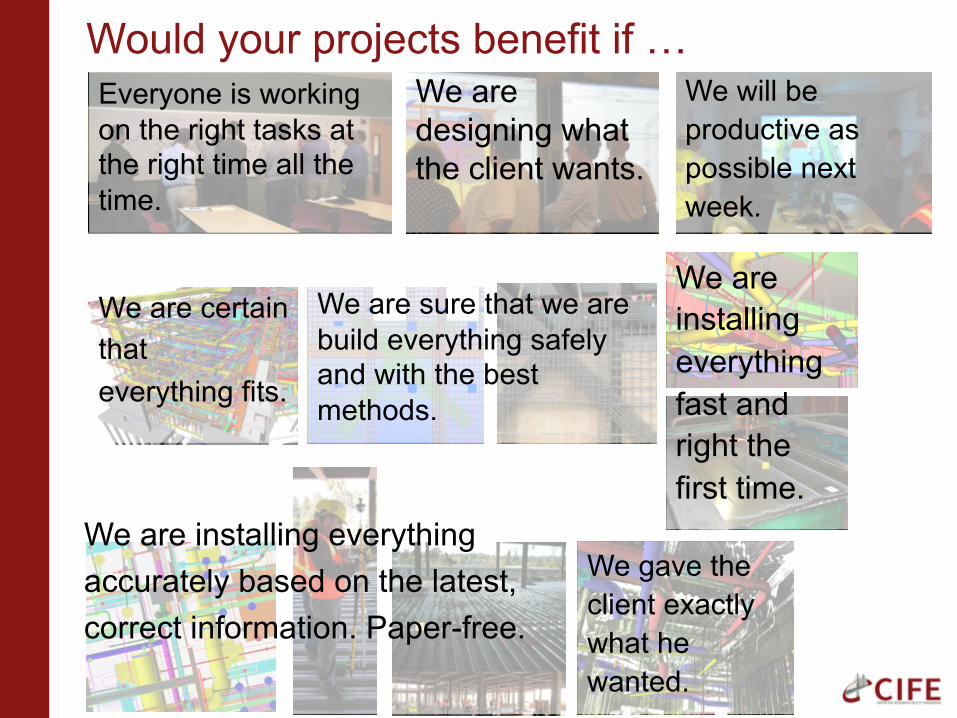
Would your projects benefit if …Everyone is working on the right tasks at the right time all the time.
We are designing what the client wants.
We will be productive as possible next week.
We are certain that everything fits.
We are sure that we are building everything safely and with the best methods.
We are installing everything fast and right the first time.
We are installing everything accurately based on the latest, correct information. Paper-free.
We gave the client exactly what he wanted.
©2016
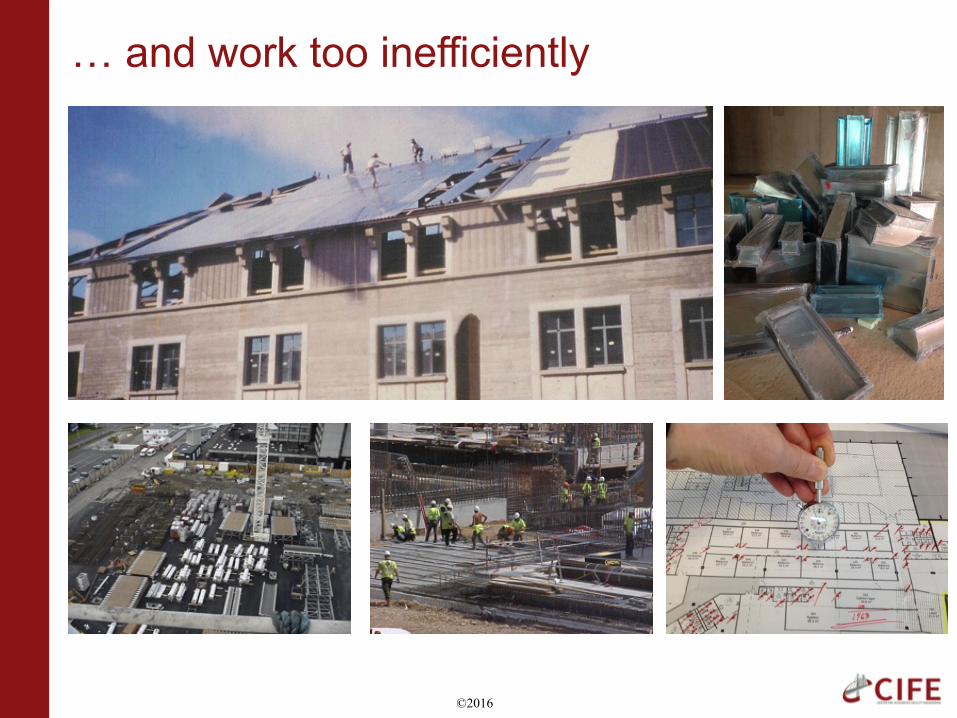
What capabilities have really changed in the last decade?
Digital modeling
Amount of data we can handle
Communication
Pictures courtesy SPS, Beck, and DPR
©2016
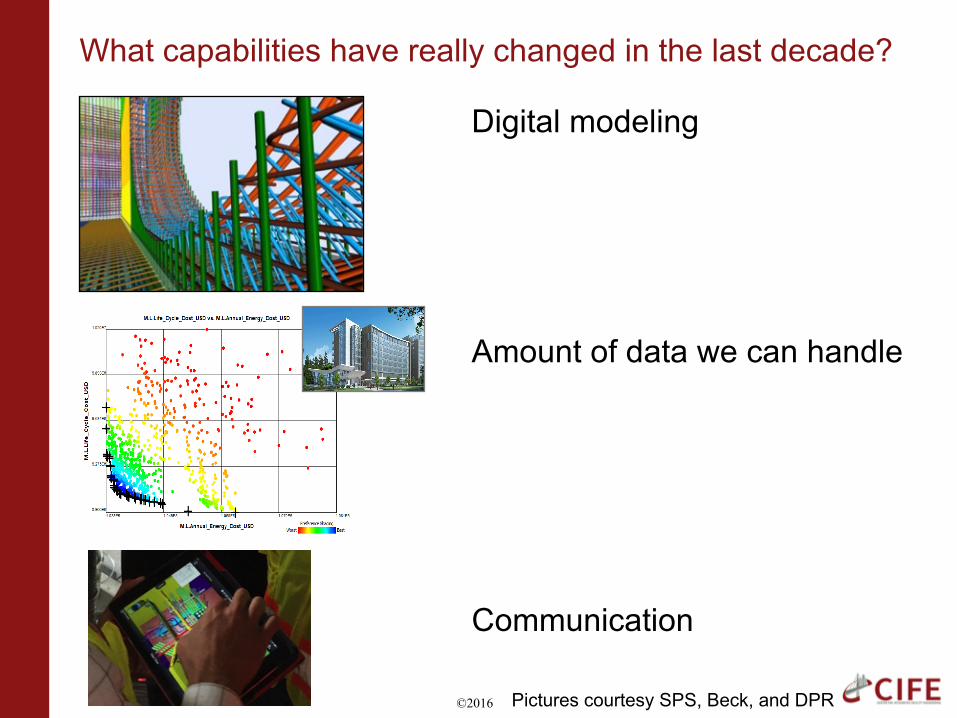
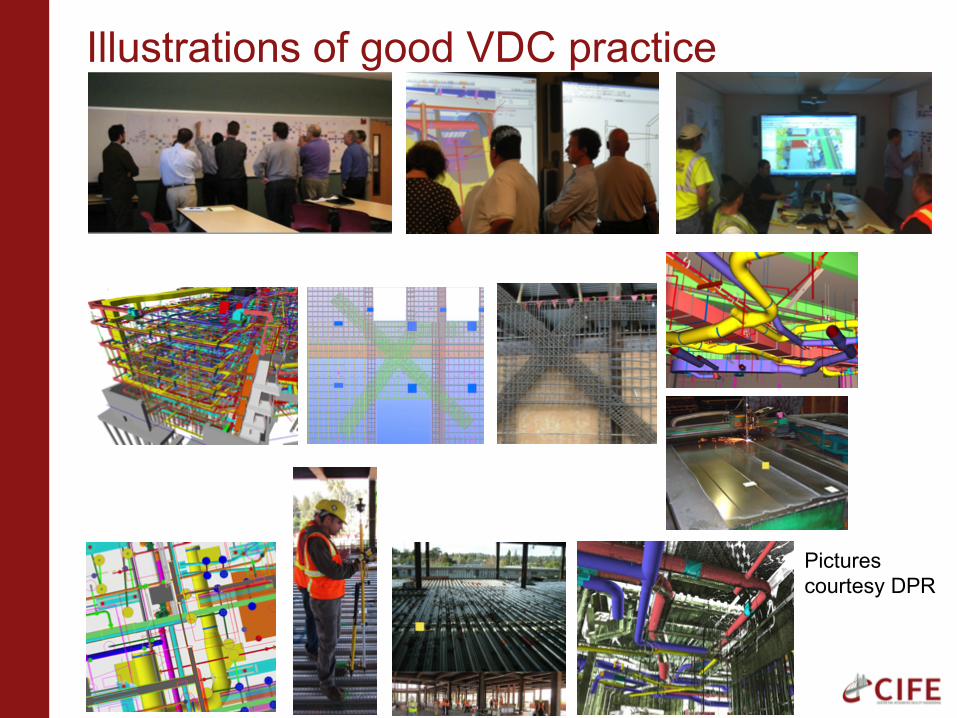
Illustrations of good VDC practice
Pictures courtesy DPR
©2016
Would your projects benefit if …Everyone is working on the right tasks at the right time all the time.
We are designing what the client wants.
We will be productive as possible next week.
We are certain that everything fits.
We are sure that we are build everything safely and with the best methods.
We are installing everything fast and right the first time.
We are installing everything accurately based on the latest, correct information. Paper-free.
We gave the client exactly what he wanted.
©2016
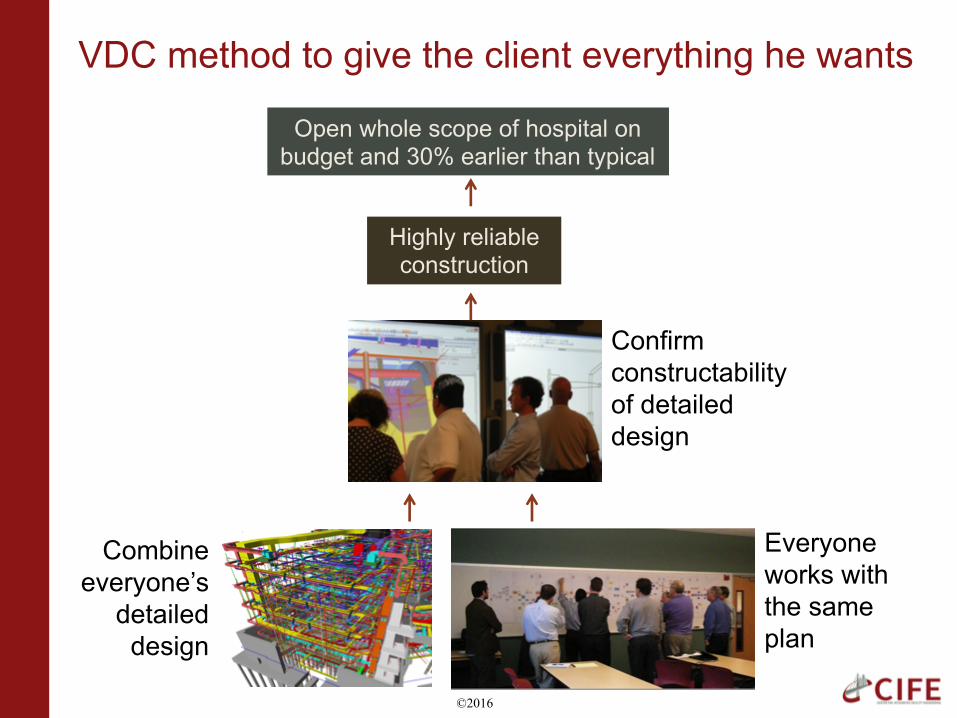
VDC method to give the client everything he wants
Open whole scope of hospital on budget and 30% earlier than typical
Highly reliable construction
Combine everyone’s
detailed design
Everyone works with the same plan
Confirm constructability of detailed design
©2016
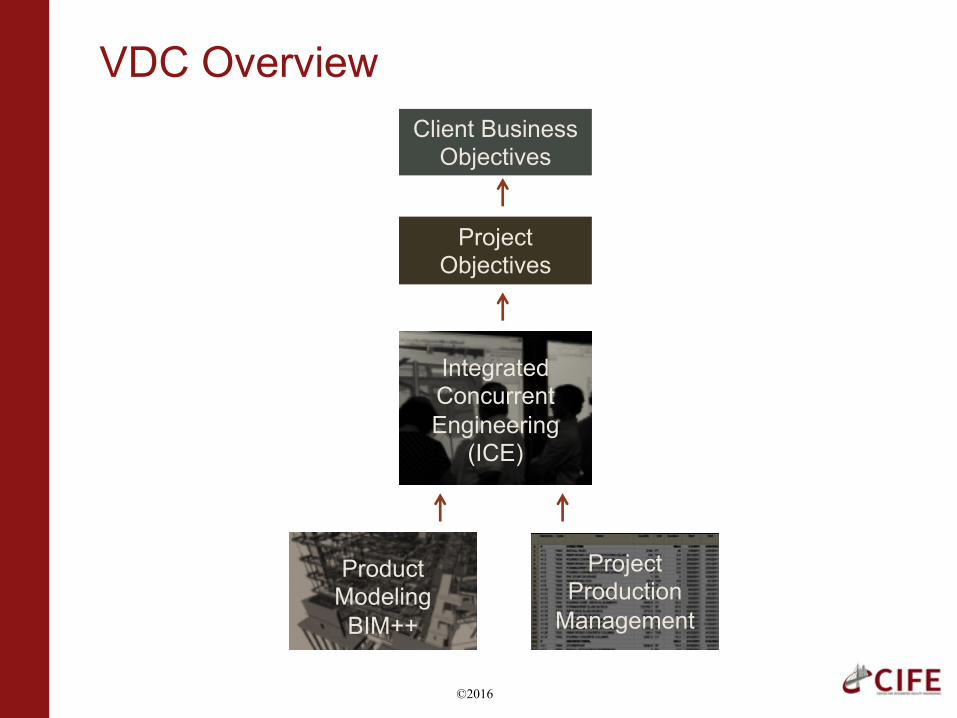
VDC Overview Client Business
Objectives
ProjectObjectives
IntegratedConcurrent Engineering
(ICE)
Product ModelingBIM++
ProjectProduction
Management

©2016
Client/Business Objectives
ProjectObjectives
IntegratedConcurrent Engineering
(ICE)
Product ModelingBIM++
Process ModelingProduction
Management
WHY is the client doing the project?
WHAT does the project team need to achieve?
HOW is the project team accomplishing the project objectives?
BUILDING PERFORMANCE• Usable • Operable• Sustainable
PROJECT PERFORMANCE• Buildable
Safety, Budget, Schedule, Quality
PROCESS PERFORMANCE• Production metrics
• Controllable factors of production

©2015
Vivienda Multifamiliar “Residencial Varela”
Javier OtinianoProject ManagerPROYEC Contratistas Generales S.A.
Monthly Report N° 6Date: 3 May. 2016
Example of Application of VDC on a Multi-Family Housing Project in Lima, Perufrom the CIFE-SPS VDC Certificate Program Implementation Phase

©2015
USING THE BIM FOR INSTALLATION OF PRECAST SLABS IN BASEMENT CEILING (FLOOR PARKING)
PRECASTSLABMODULESACCORDINGTOTHESECTORIZATION“7SECTORS”
- INSTALLATIONTIMEOFPRECASTSLABS:8-10minc/u
- INSTALLATIONTEAM:3People

©2015
$.1,742.00
$.373.00
$.8,430.00
$.5,411.00
0100020003000400050006000700080009000
ConcreteSavings Steel1/4"Savings JoistandFlooringBlocksSavings
SavingsinPlastering,painting,ceiling
(basementceiling)
$.8,873.00
$.2,159.00
0
2000
4000
6000
8000
10000
LightenedPrecastSlabs SolidPrecastSlabs
ECONOMICBENEFIT/ITEMSFORUSEOFPRECASTSLABS
$. 15,956.00
$. 11,032
( - )
E C O N O M I C B E N E F I T F O R U S E O F P R E C A S T S L A B S
$. 4,924.00
D I R EC T CO S T FOR U S E O F P R ECA S T S L A B S
31%savingsinstructurecost

©2015
18WORKINGMEETINGSWITHTECHNICALTEAM
EVALUATINGTHE4DPLANNINGMEETING,WITHTECHNICALEQUIPMENTONTHECONSTRUCTIONSITE
PROPOSALFORIMPROVEMENTMEETING,WITHTHEDESIGNEROFTHEGASSYSTEMANDTECHNICALTEAM

©2015
R E S I D E N C I A L
VARELA
CU S TOMER
CREATEVALUE
IMPLEMENTATIONVDCM A N A G E M E N T , P L A N N I N G , A N D P R O D U C T I O N P R O C E S S E S T O A C H I V E T H E T A R G E T
REDUCECONSTRUCTIONTIMEBY5%- TARGETGOAL
DESIGNERSConfirm
attendanceCheckqueries
Contributionstoimprovements
Identifydeficienciesin
design
ConveneMeeting
PresentSchedule
Contributionstoimprovements
PROJECTMANAGER
YES Makingofimprovement
metrics
BIMSUPPORT ModelPresentation
DevelopModeling
Plan
MakequeriesoftheModel
Contributionstoimprovements
NO
BIMMANAGERIdentify
deficienciesindesign
Contributionstoimprovements
Specifycontributions
Reviewbylevelsandspecialities
DecisionMaking
ICE SESSIONS
MAPPINGPROCESSES
COLLABORATIVEMEETINGS
IMPROVEMENTPROJECT
OPTIMIZEDSCHEDULED
SECTORIZATION/WORKTRAINS4DMODEL

©2016
Key technology and management developmentsMobile• from just-in-case to just-the-right informationCloud• anytime (push and pull, bi-directional, ”unlimited”)Parallelization• fastLocation / dimensional measurement• accuracy, dimensional control, off-site / on-siteMachine learning• experience and dataRobotics, additive manufacturing• virtual ßà real, safety, environmental impactInternet of Things (IoT)• virtual ßà realVirtual Environments• test!Collaboration• concurrent knowledgeLean• lower uncertainty, lower risk, customer, pull, purpose à value

©2016
Wake-up CallsThe following slides show several innovations that show dramatic improvement opportunities.

Daily Process & Feedback Loop
einsite
• Create Material Requests for planned work on SiteMan App
• Write Requests on Smart Card
• Collect Material at Plant
• Data captured by Cabin Controller and Vehicle Unit
• Verify at Weigh-Station• Data captured by
Cabin Controller and Vehicle Unit
• Drop material at work-site, and perform work using relevant machinery
• Acknowledgement made by supervisor ID card on device • Enter Daily Progress
Reports• Entries cross checked
with device Data
u All data and activities verified by Device based Locational and Transactional Data, in the context of the project plan and operations
u Reduced data-entry (only once at start and end of day)u Minimal Training required
• Whole day’s activity visualized and analyzed on Software portal
• Work plan for next day created based on recommendations by Einsite
START OF DAY
END OF DAY
Anirudh Reddy
©2016
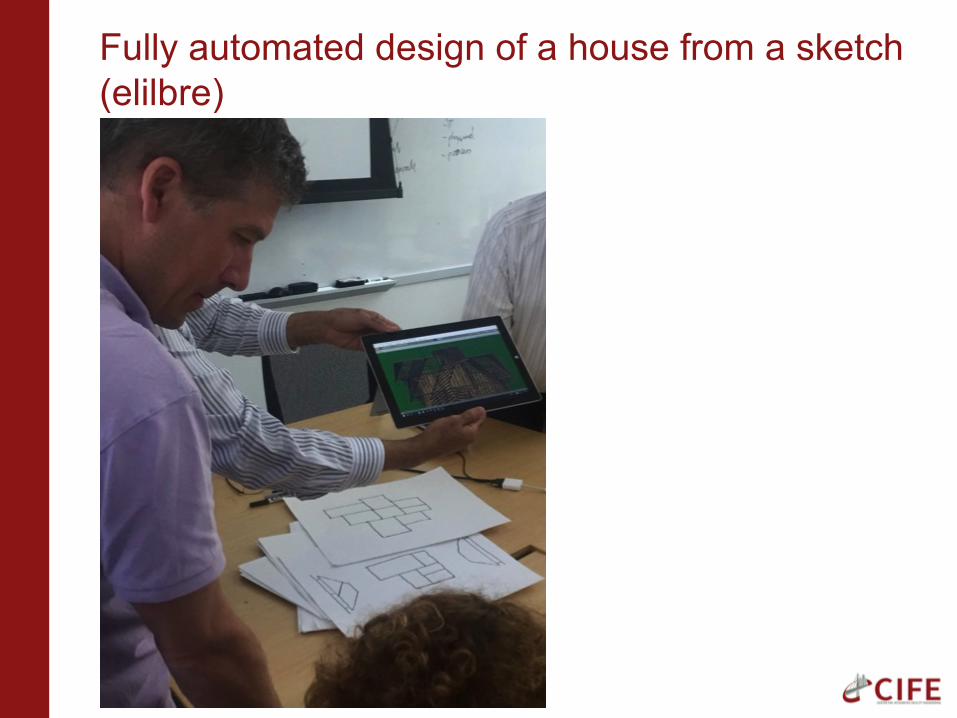
Fully automated design of a house from a sketch (elilbre)

©2015
R E D U C I N G T H E C O S T O F S T E E L S T R U C T U R E S U S I N G C OMPU TAT I O N A L D E S I G N O P T IM I Z AT I O N
Wo r k b y F o r e s t F l a g e r i n C o l l a b o r a t i o n w i t h A r u p a n d J o h n H a ym a k e r
conventionaldesign method
FCD (128 cpu)
design method
PROCESS
Design cycle time 4 hrs 3 secAlternatives evaluated 39 12,800
Total design time 216 hrs 151 hrs
PRODUCT
Total steel weight2,728 met t 2,292 met t
Est. cost saving (USD)
- $4 M (-19%)
CASE STUDY RESULTS
GEOMETRIC MODEL
GEOMETRICMODEL
OPTIMIZESHAPE
ANALYTICMODEL
OPTIMIZESIZING
1
BiOPT METHODhttp://cife.stanford.edu/sites/default/files/TR202.pdf
DESIGN PROBLEM
2
3
4
FCDSizingAlgorithmhttp://cife.stanford.edu/sites/default/files/TR201_0.pdf
SEQOPTAlgorithm(Booker,etal.1999)
• Ordersofmagnitudereductionindesigncycletime
• Evaluationofagreaternumberofdesignalternatives
• Improvedproductquality
Objective:Minimizesteelweight
Constraints:Safetyandserviceability
Possibledesignalternatives:~102435Variables:1955sizeandshapevariables
Copyright Ó 2016CIFE 2016
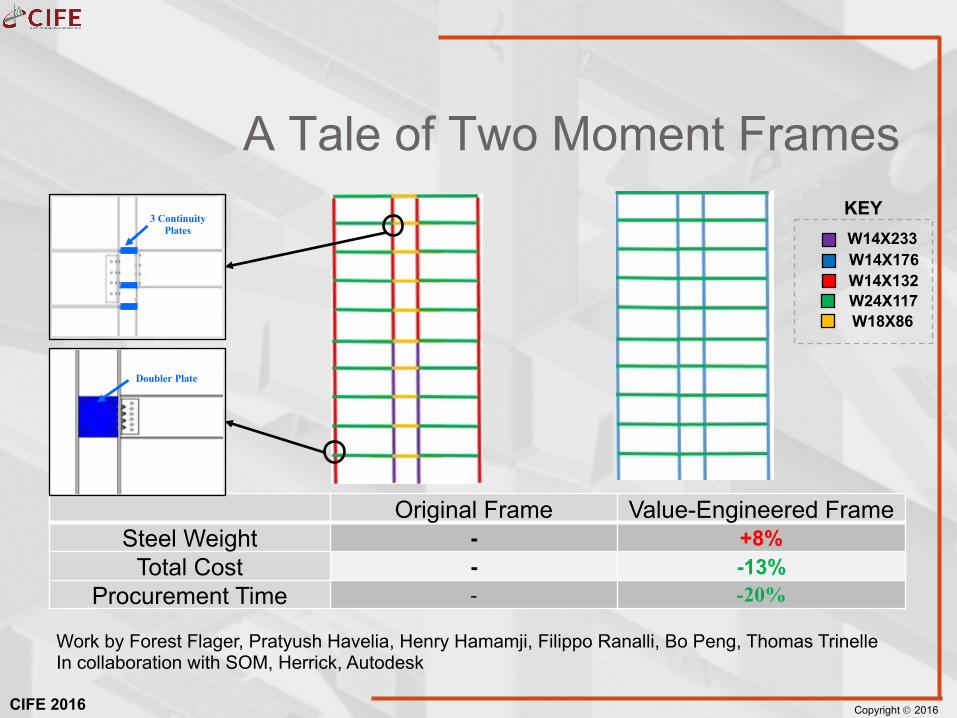
Original Frame Value-Engineered FrameSteel Weight - +8%
Total Cost - -13%Procurement Time - -20%
A Tale of Two Moment Frames
W14X176
W24X117W18X86
W14X132
W14X233
Doubler Plate
3 Continuity Plates
KEY
Work by Forest Flager, Pratyush Havelia, Henry Hamamji, Filippo Ranalli, Bo Peng, Thomas TrinelleIn collaboration with SOM, Herrick, Autodesk

Copyright Ó 2016CIFE 2016
Steel Frame Cost Components
Material 27%
Fabrication
Erection
Other
DESIGN DECISION BASIS
SUPPLY CHAIN EXPERTISE
Design Cycle: 8-24 weeks

©2016
Automatic as-built BIM from laser scans
In collaboration with Iro Armeni, Silvio Savarese, Amir Zamir, and Ozan Sener

©2016
“Theautomatedexecutionofprocesseschangeseverything.”(AlanPerlis,1961)

Flow-based Construction Site Management
September 2016
N E L LY G A R C I A - L O P E Z
I N C O L L A B O R AT I O N W I T H G R A Ñ A Y M O N T E R O

Case study: Applying the flow-based site management method
Project info:• Graña y Montero jobsite in Peru• 11 basements + 21 floors• 18-week period (8 weeks on site)• Structural phase
Objectives:1. Can the flow-based model
represent the look-ahead plan?
2. Does the method help field managers make decisions during look-ahead and daily planning?

Case study project adopted best practices for production planning
Master plan• Processes• Gross
constraints
Takt plan• Sector
definition• Quantities• Trade
sequence• Crew
balancing
Look-ahead plan• Constraints
analysis• Productivity• PPC +
reasons
Daily plan• Quantities• Productivity• Daily PPC• Visual
planning
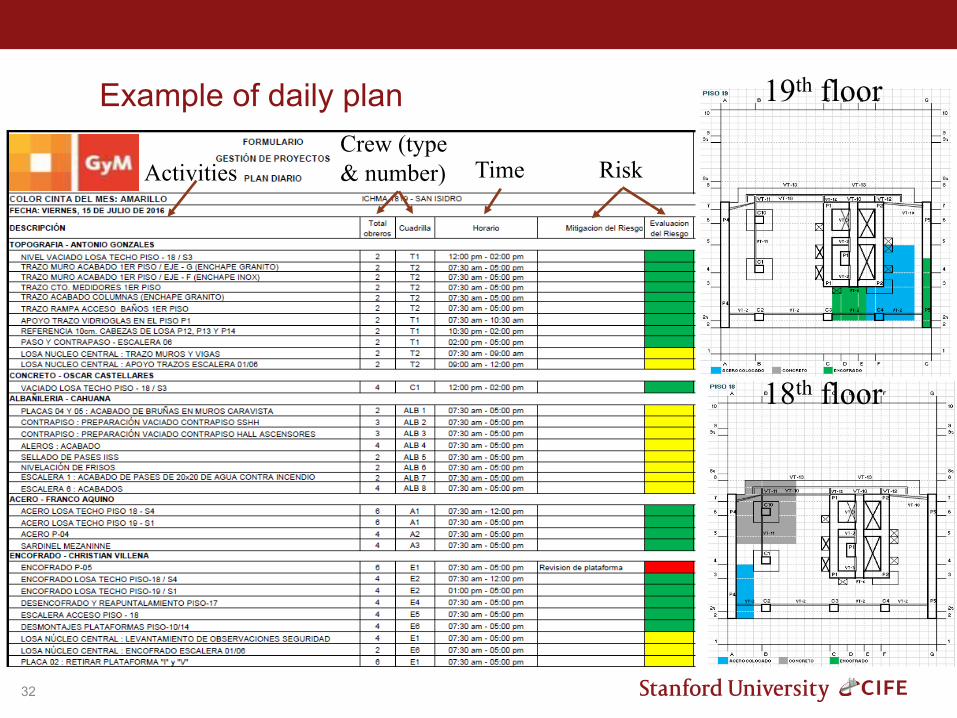
Example of daily plan
32
19th floor
18th floor
RiskTimeCrew (type & number)Activities

So, why was it so difficult for the project team to stick to the plan?
Video link: https://youtu.be/sT6kkvE2WXU
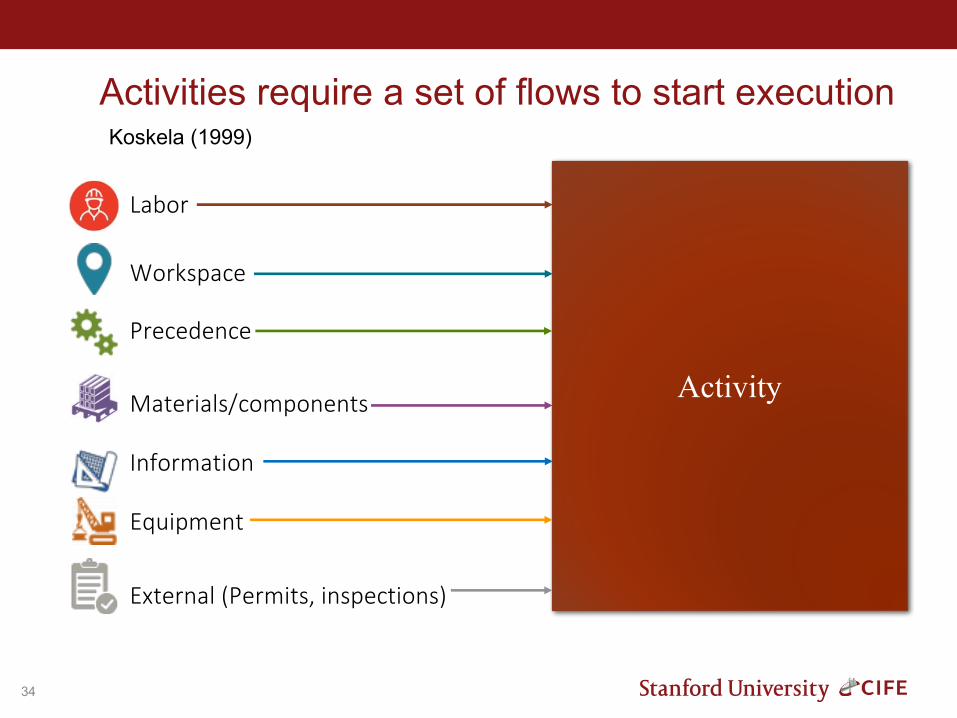
Activities require a set of flows to start execution
34
Activity
Koskela (1999)
Labor
Workspace
Precedence
Materials/components
Information
Equipment
External(Permits,inspections)
FlowKey:

Existing construction models do not formally represent, track, or quantify the activity flowsExisting transformation view
Build deck
form A1
Install slab
rebar A1
Pour slab A1
Build deck
form A2
Install slab
rebar A2
Pour slab A2
What flow?
What caused delay?
Did one of these flows fail?By how much?
Was it something else? Are we representing all the flows?
How are these flows affected?
∆

Existing construction models do not formally represent, track, or quantify the activity flows
36
Proposed flow view
Build deck
form A1
Install slab rebar
A1
Pour slab A1
Build deck
form A2
Install slab rebar
A2
Pour slab A2
What flow?What caused the delay?
Did one of these flows fail?By how much?
How are these flows affected?
∆
Labor
Workspace
Precedence
Materials/components
Information
Equipment
External(Permits,ispections)
FlowKey:
Concrete crew idle
Steel crew availability
Are we representing all the flows?

Weekly data collected by the app
Aggregate metrics
WIP
Aggregate activity statuses
10 variables
Activity metrics
Activity info
Activity execution variability
17 variables
Flow metrics
Flow info
Flow execution variability
24 variables
High level of detail data about the plan, its execution, and reasons for variability
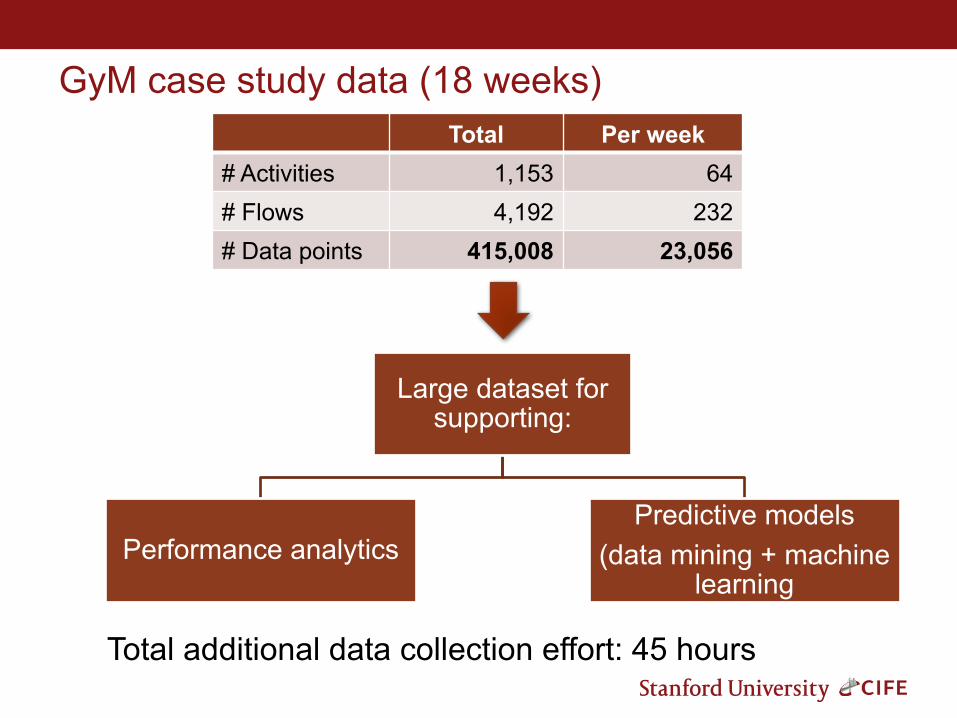
GyM case study data (18 weeks)Total Per week
# Activities 1,153 64# Flows 4,192 232# Data points 415,008 23,056
Large dataset for supporting:
Performance analyticsPredictive models
(data mining + machine learning
Total additional data collection effort: 45 hours
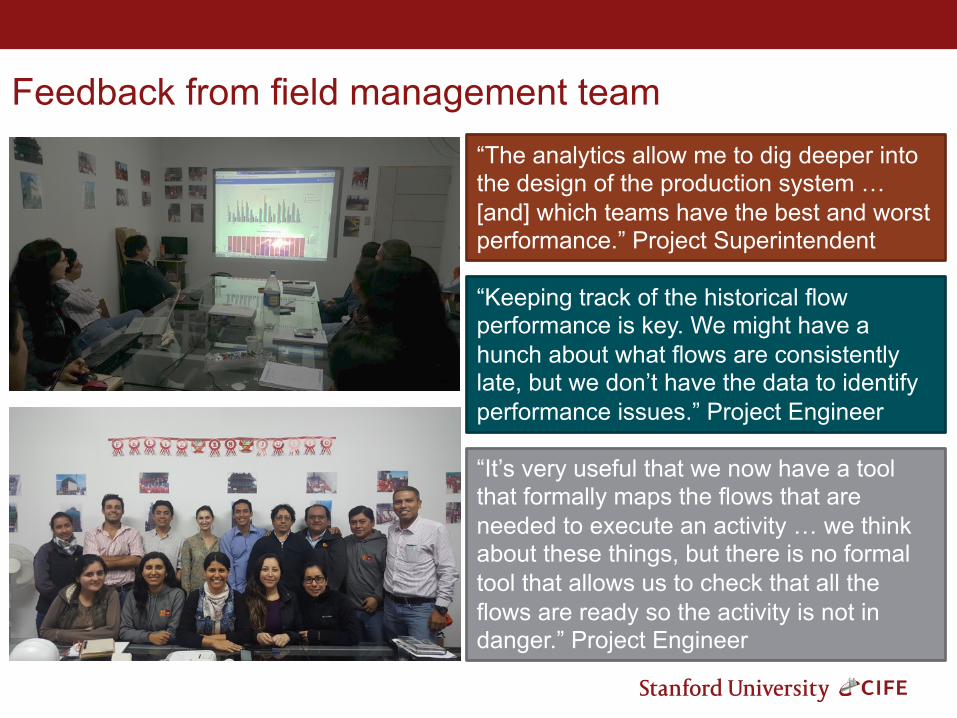
Feedback from field management team“The analytics allow me to dig deeper into the design of the production system … [and] which teams have the best and worst performance.” Project Superintendent
“Keeping track of the historical flow performance is key. We might have a hunch about what flows are consistently late, but we don’t have the data to identify performance issues.” Project Engineer
“It’s very useful that we now have a tool that formally maps the flows that are needed to execute an activity … we think about these things, but there is no formal tool that allows us to check that all the flows are ready so the activity is not in danger.” Project Engineer

©2016
It’snotexperienceOR data
it’sExperienceAND data

©2016
I have made all my generals out of mud. Napoleon

©2016
• Rapidly understand target, team, roles, progress, obstacles, challenges
• Frequent communication, feedback
Interact in a virtual
environment
Screenshots courtesy Brandon Fischer

©2016
Tor
Steinar
Gunnar
Scaffolding
82%/100% 1,640kg / 2,000kg
200kg/150kg
70kg/100kg
54 #8, 5m

©2016
The future looks different, but the future is now
Strategic Implications
Ø Projects vs. Corporate
Ø Staff Development
Ø Partners
44

©2016
Do you want to continue to be a player or become a spectator?
Recommended