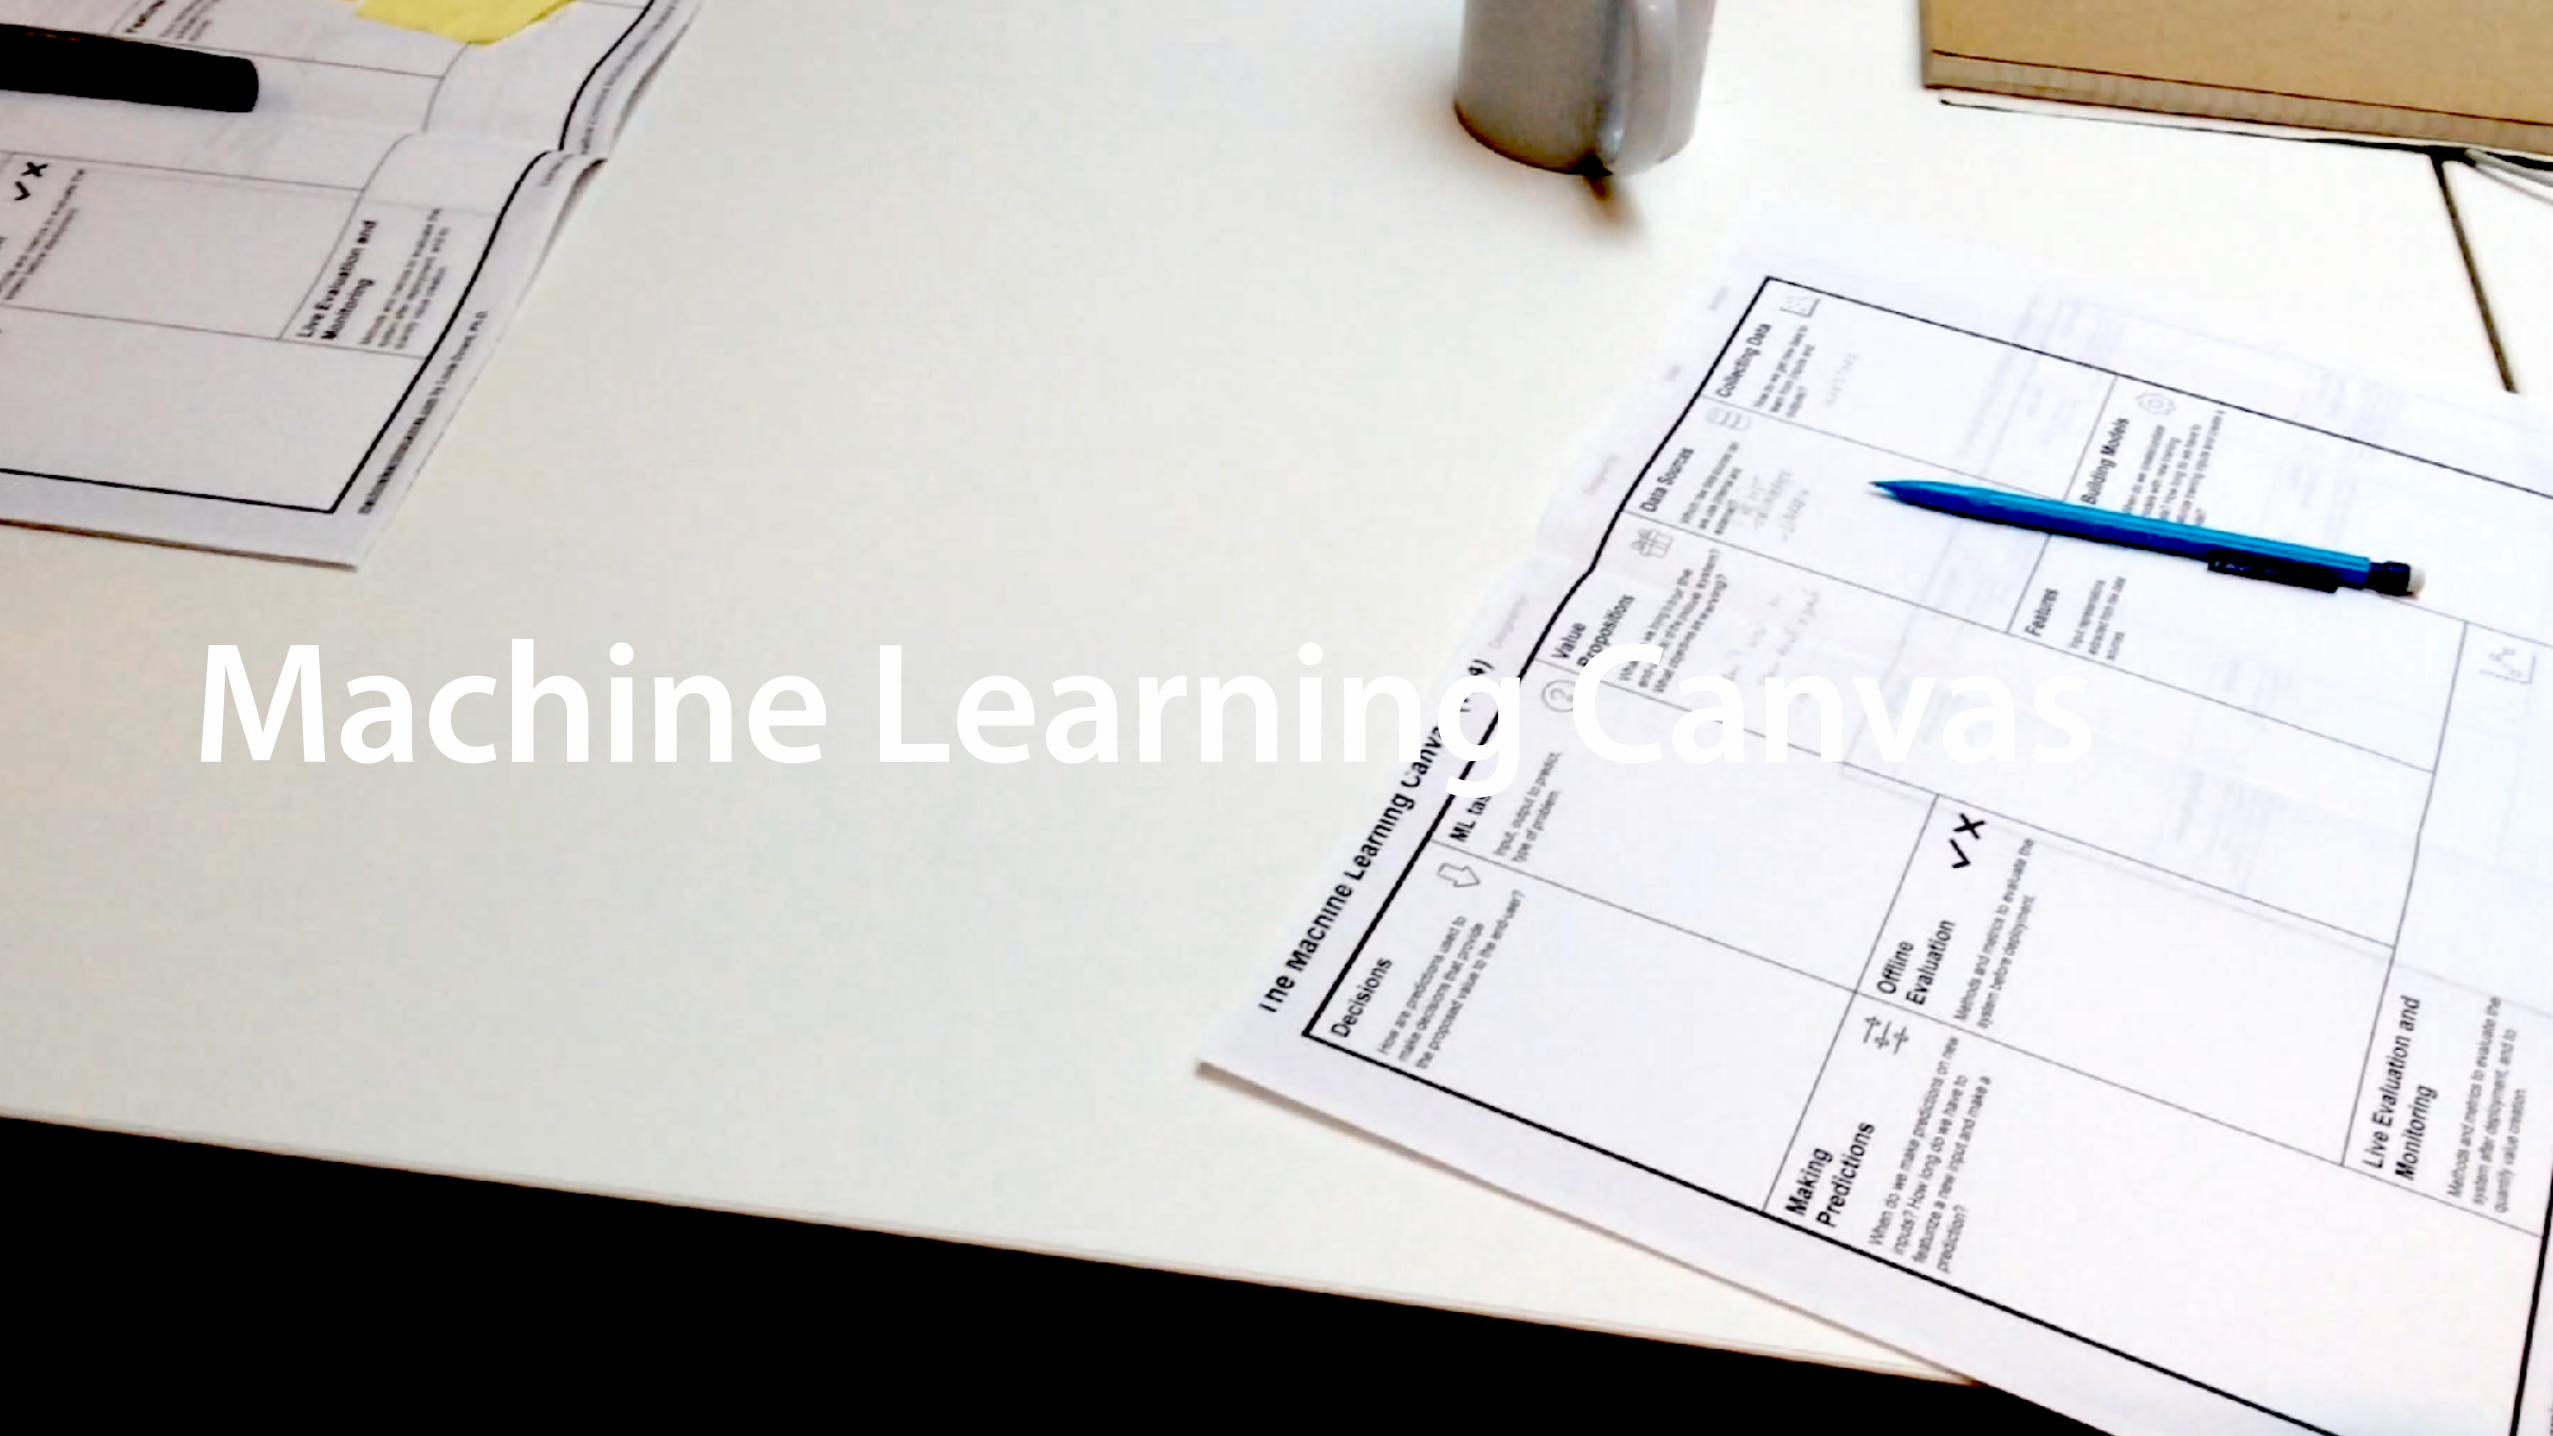
From Data to AI with the
MACHINE LEARNING CANVAS
@louisdorard #BDS16
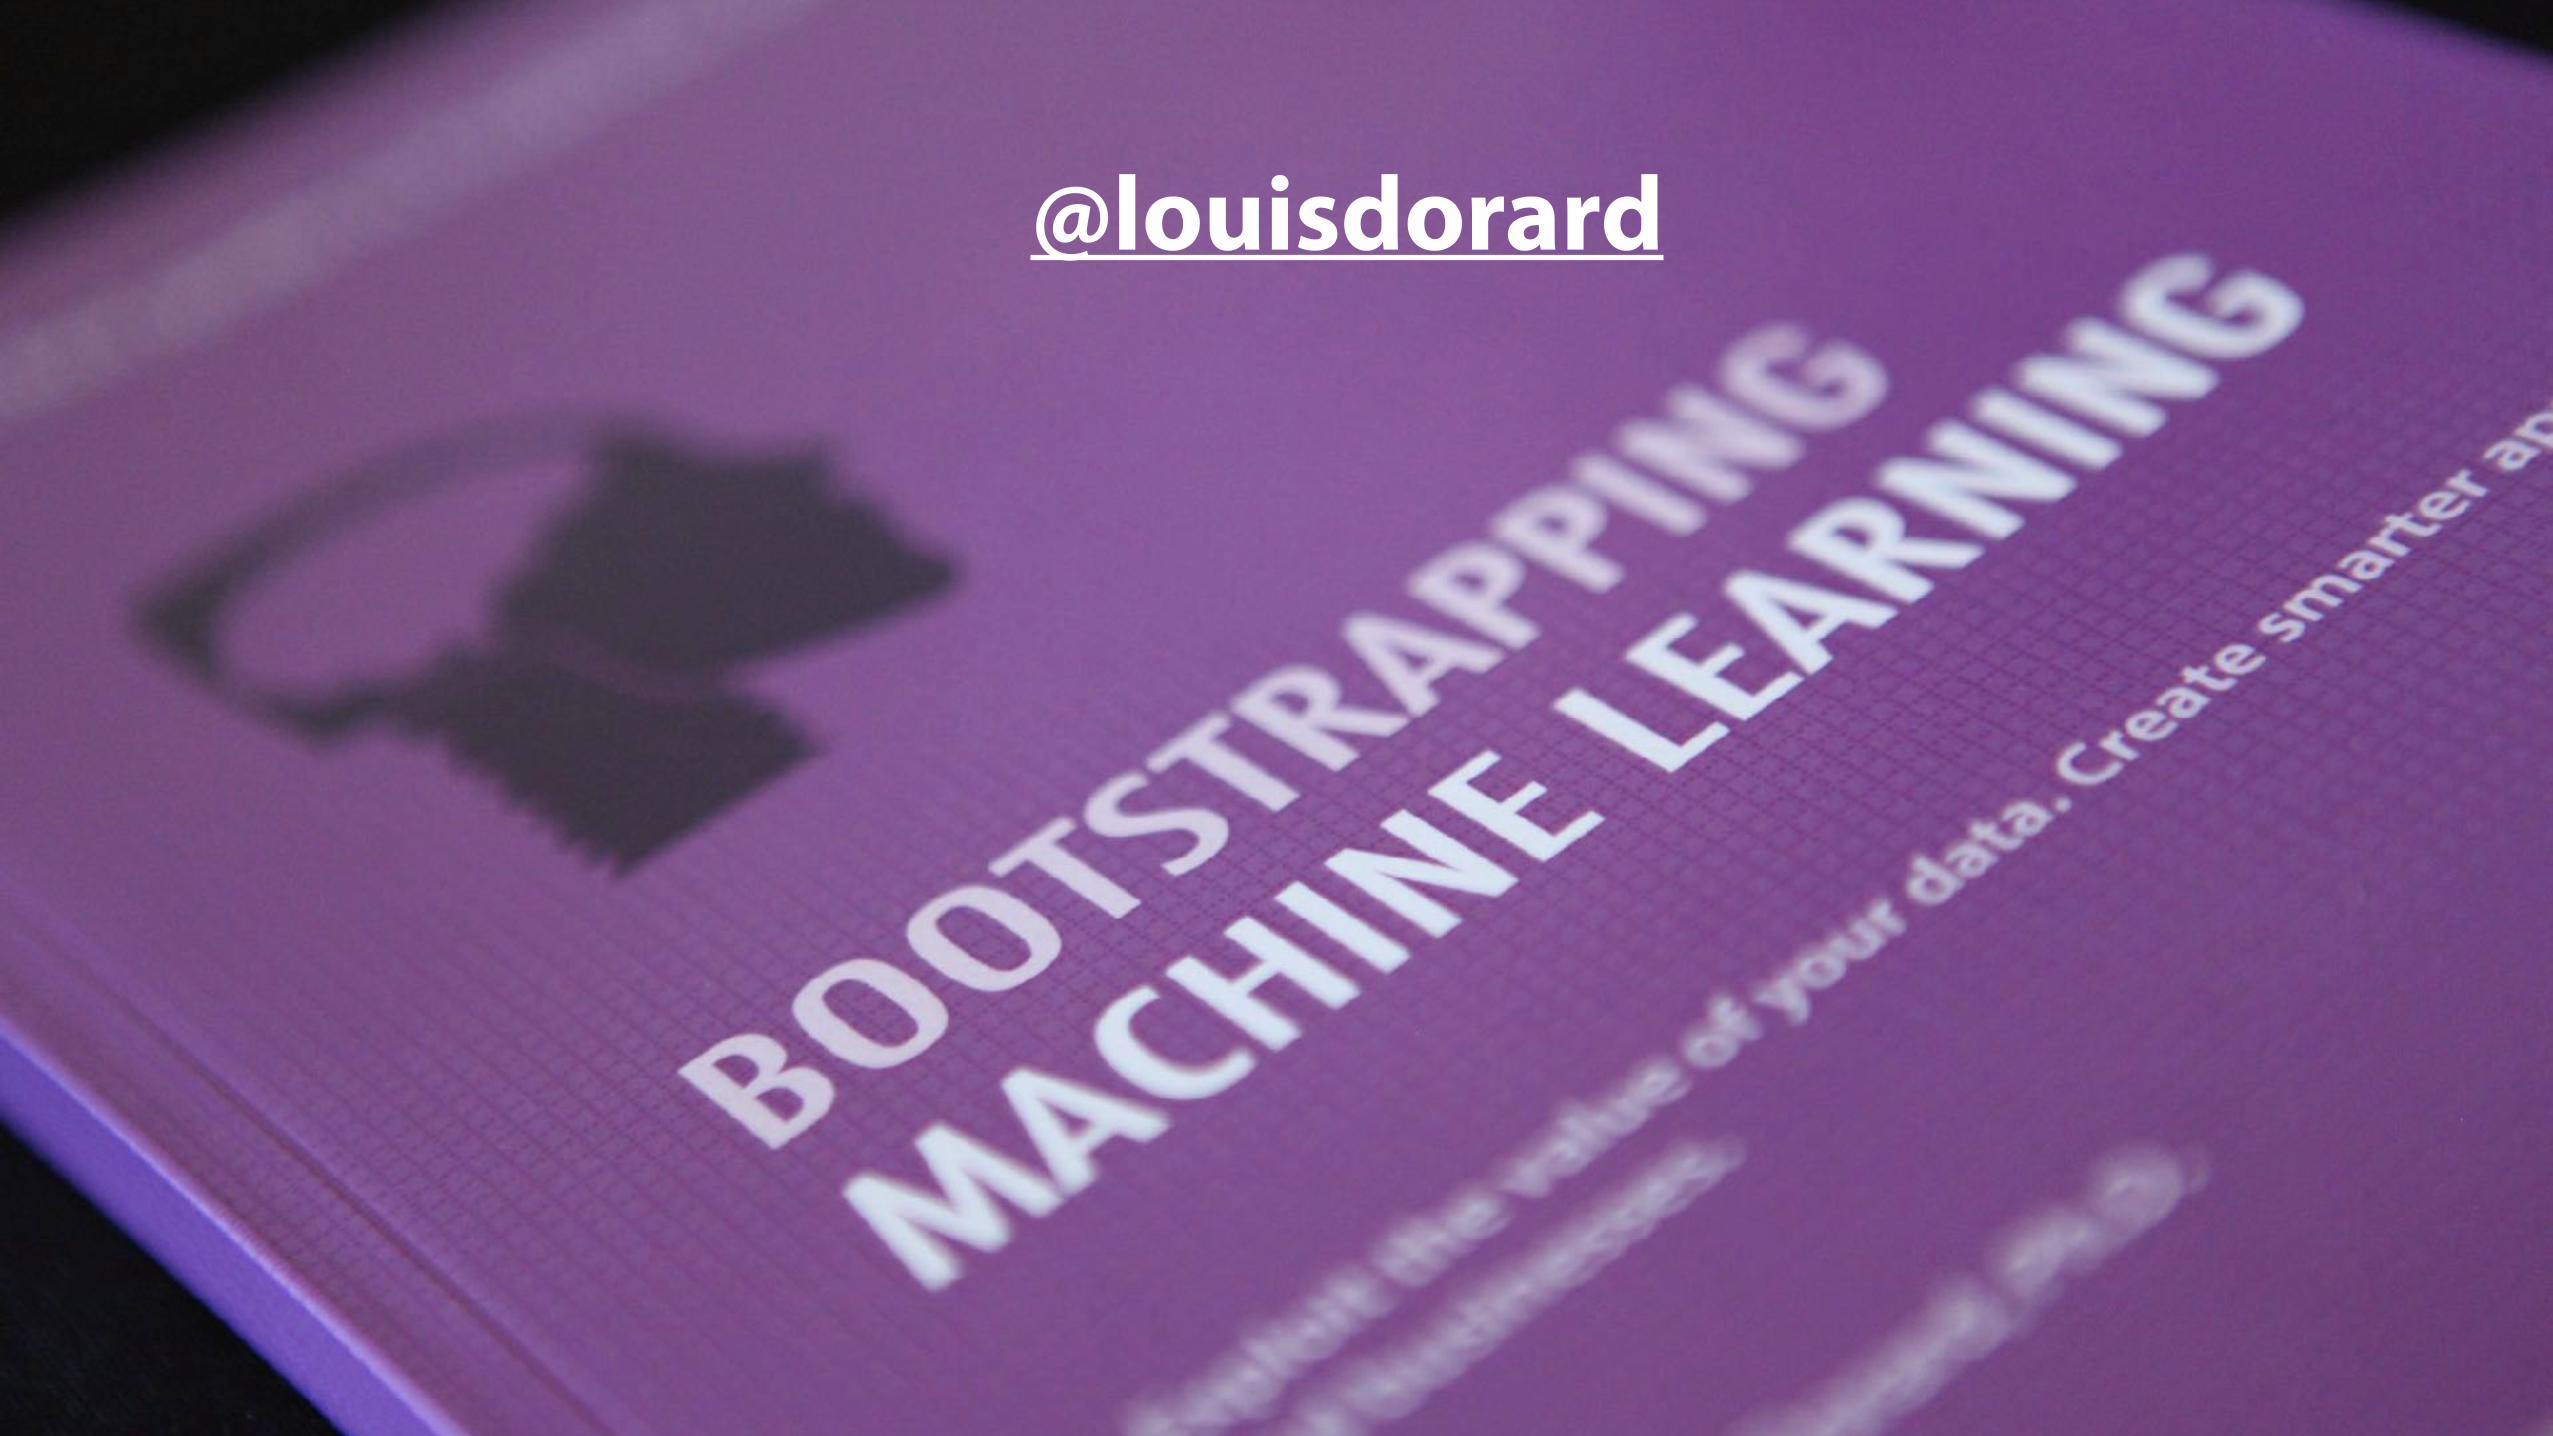
“A breakthrough in machine learning would be worth ten Microsofts” –Bill Gates

“In the next 20 years, machine learning will have more impact
than mobile has.” –Vinod Khosla

4
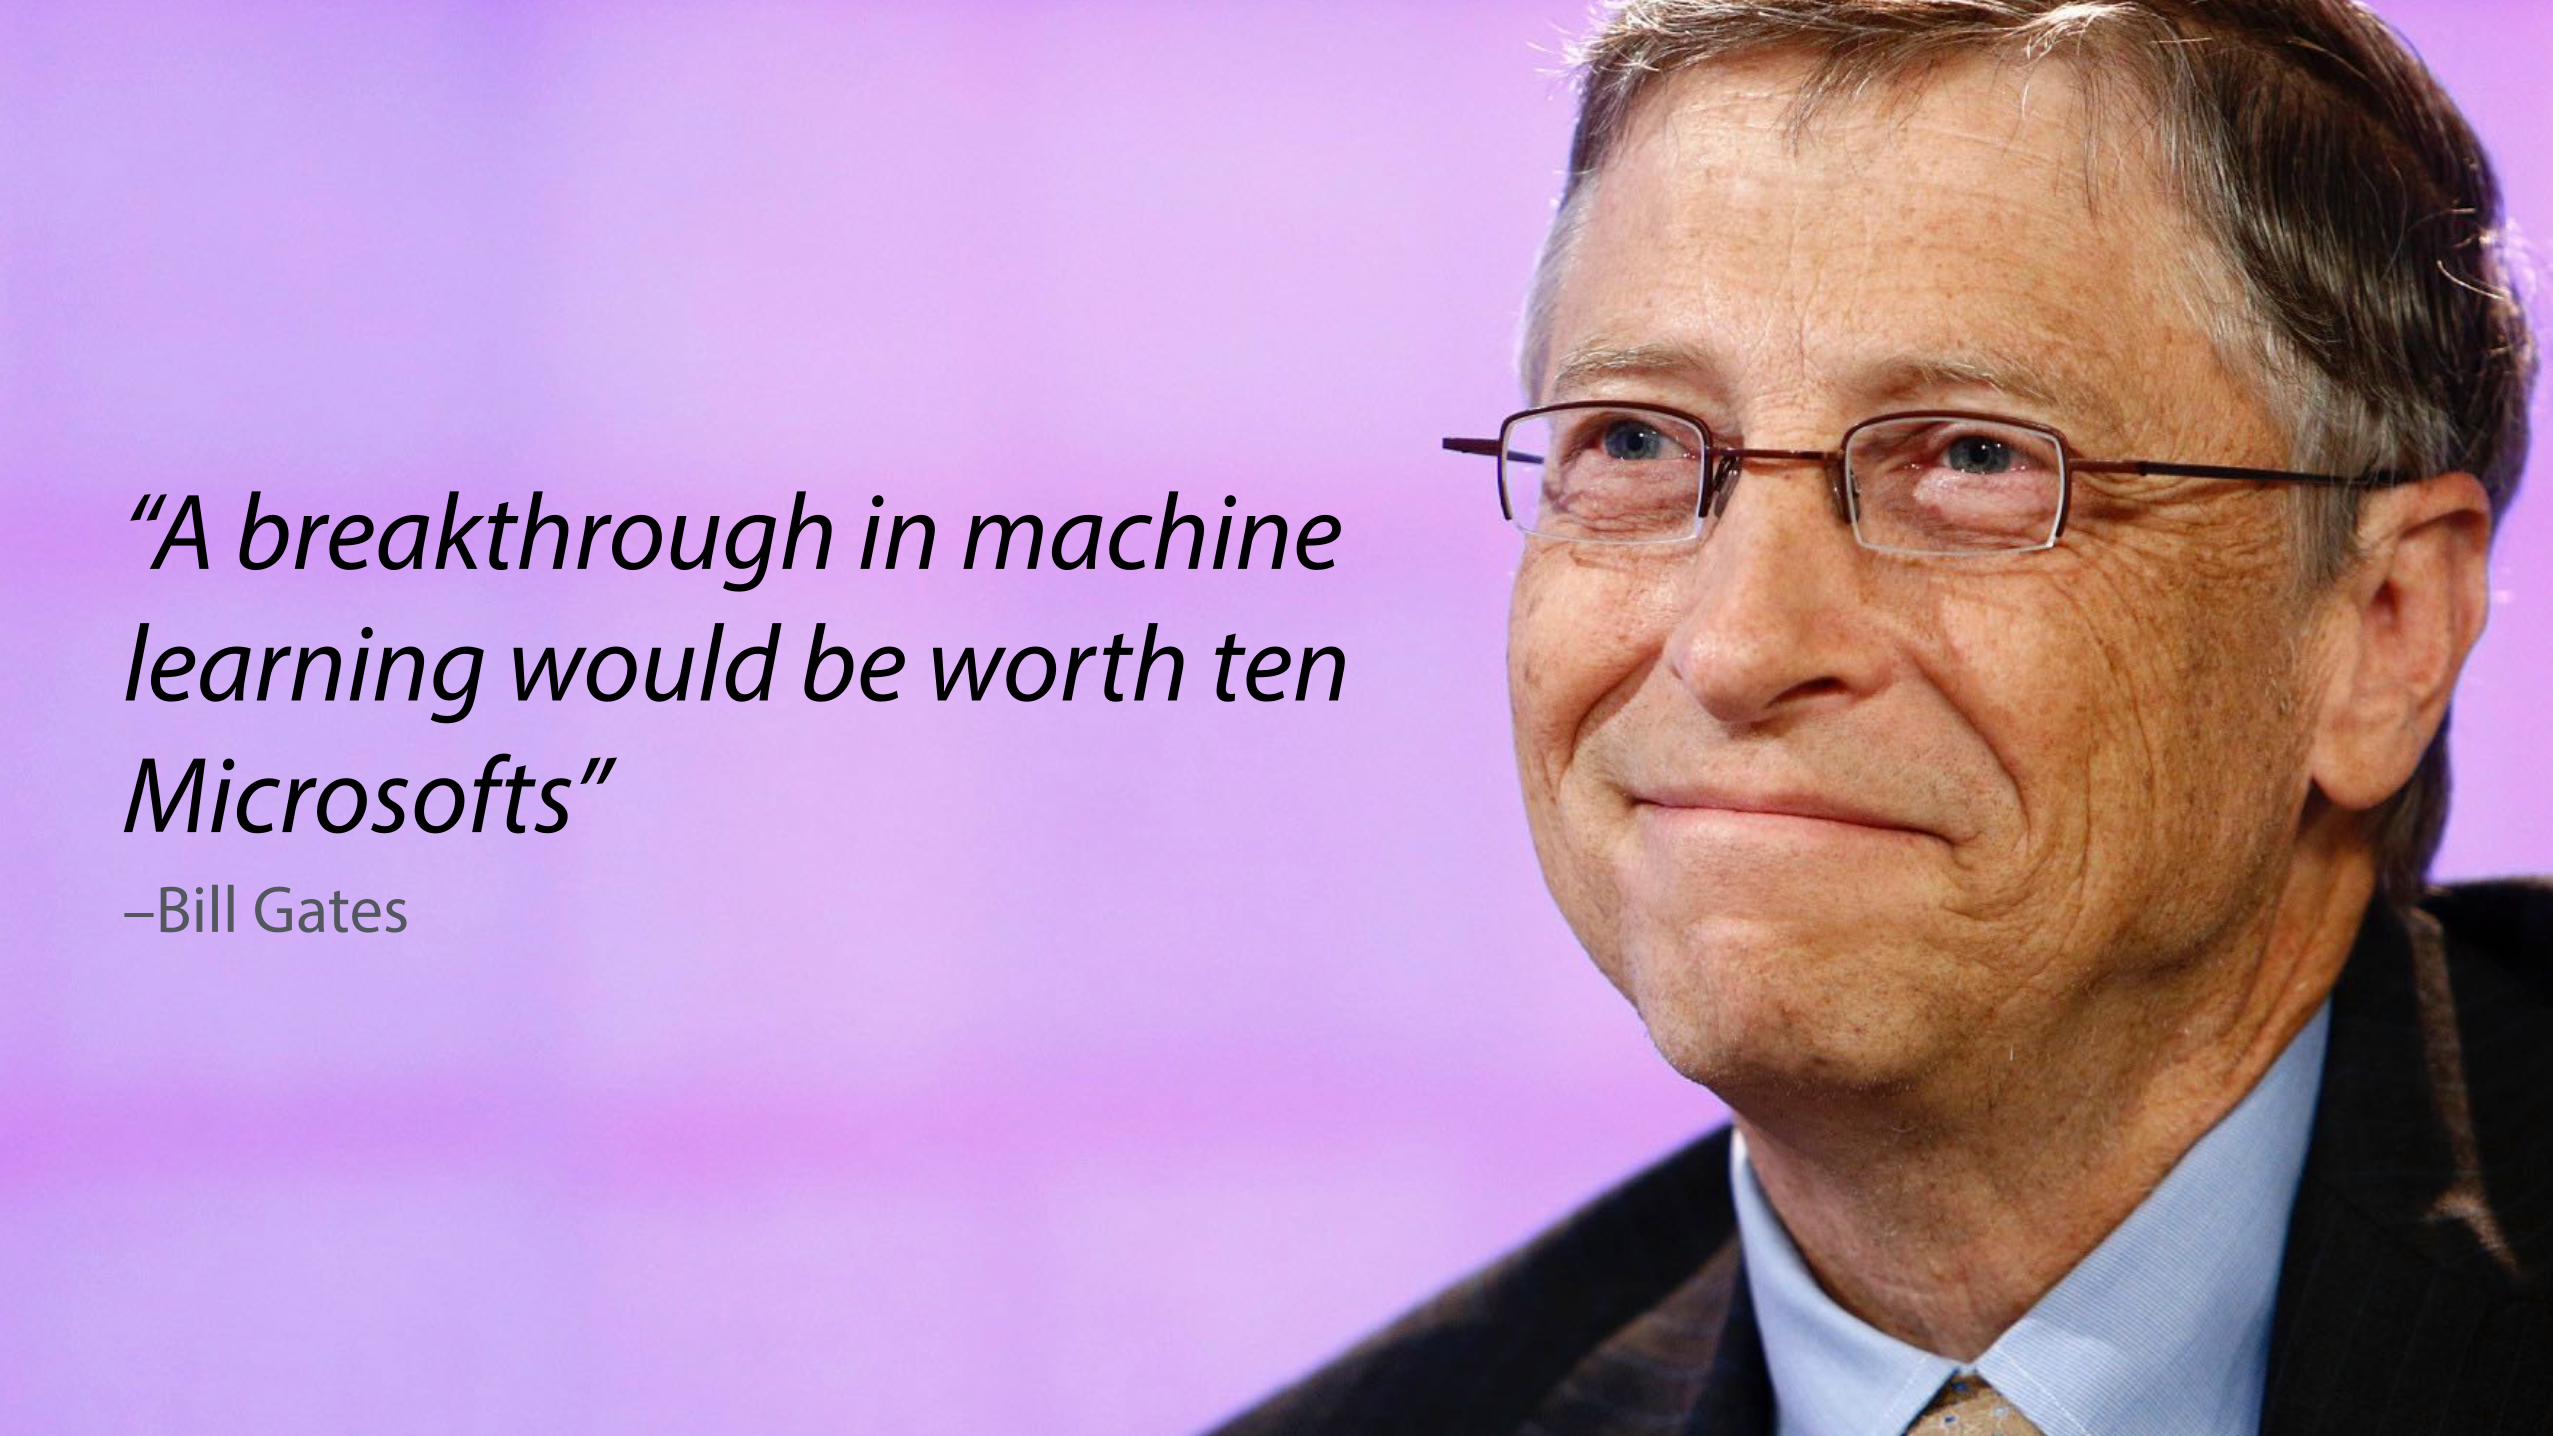
Skiing down the Gartner hype cycle with Waldo & the Machine Learning Canvas

WHOS
YOUR
P A P I
REDICTIVEPPLICATIONROGRAMMINGNTERFACE?

What is ML?


Bedrooms Bathrooms Surface (foot²) Year built Type Price ($)
3 1 860 1950 house 565,0003 1 1012 1951 house2 1.5 968 1976 townhouse 447,0004 1315 1950 house 648,0003 2 1599 1964 house3 2 987 1951 townhouse 790,0001 1 530 2007 condo 122,0004 2 1574 1964 house 835,0004 2001 house 855,0003 2.5 1472 2005 house4 3.5 1714 2005 townhouse2 2 1113 1999 condo1 769 1999 condo 315,000
last column = output (by convention)


16
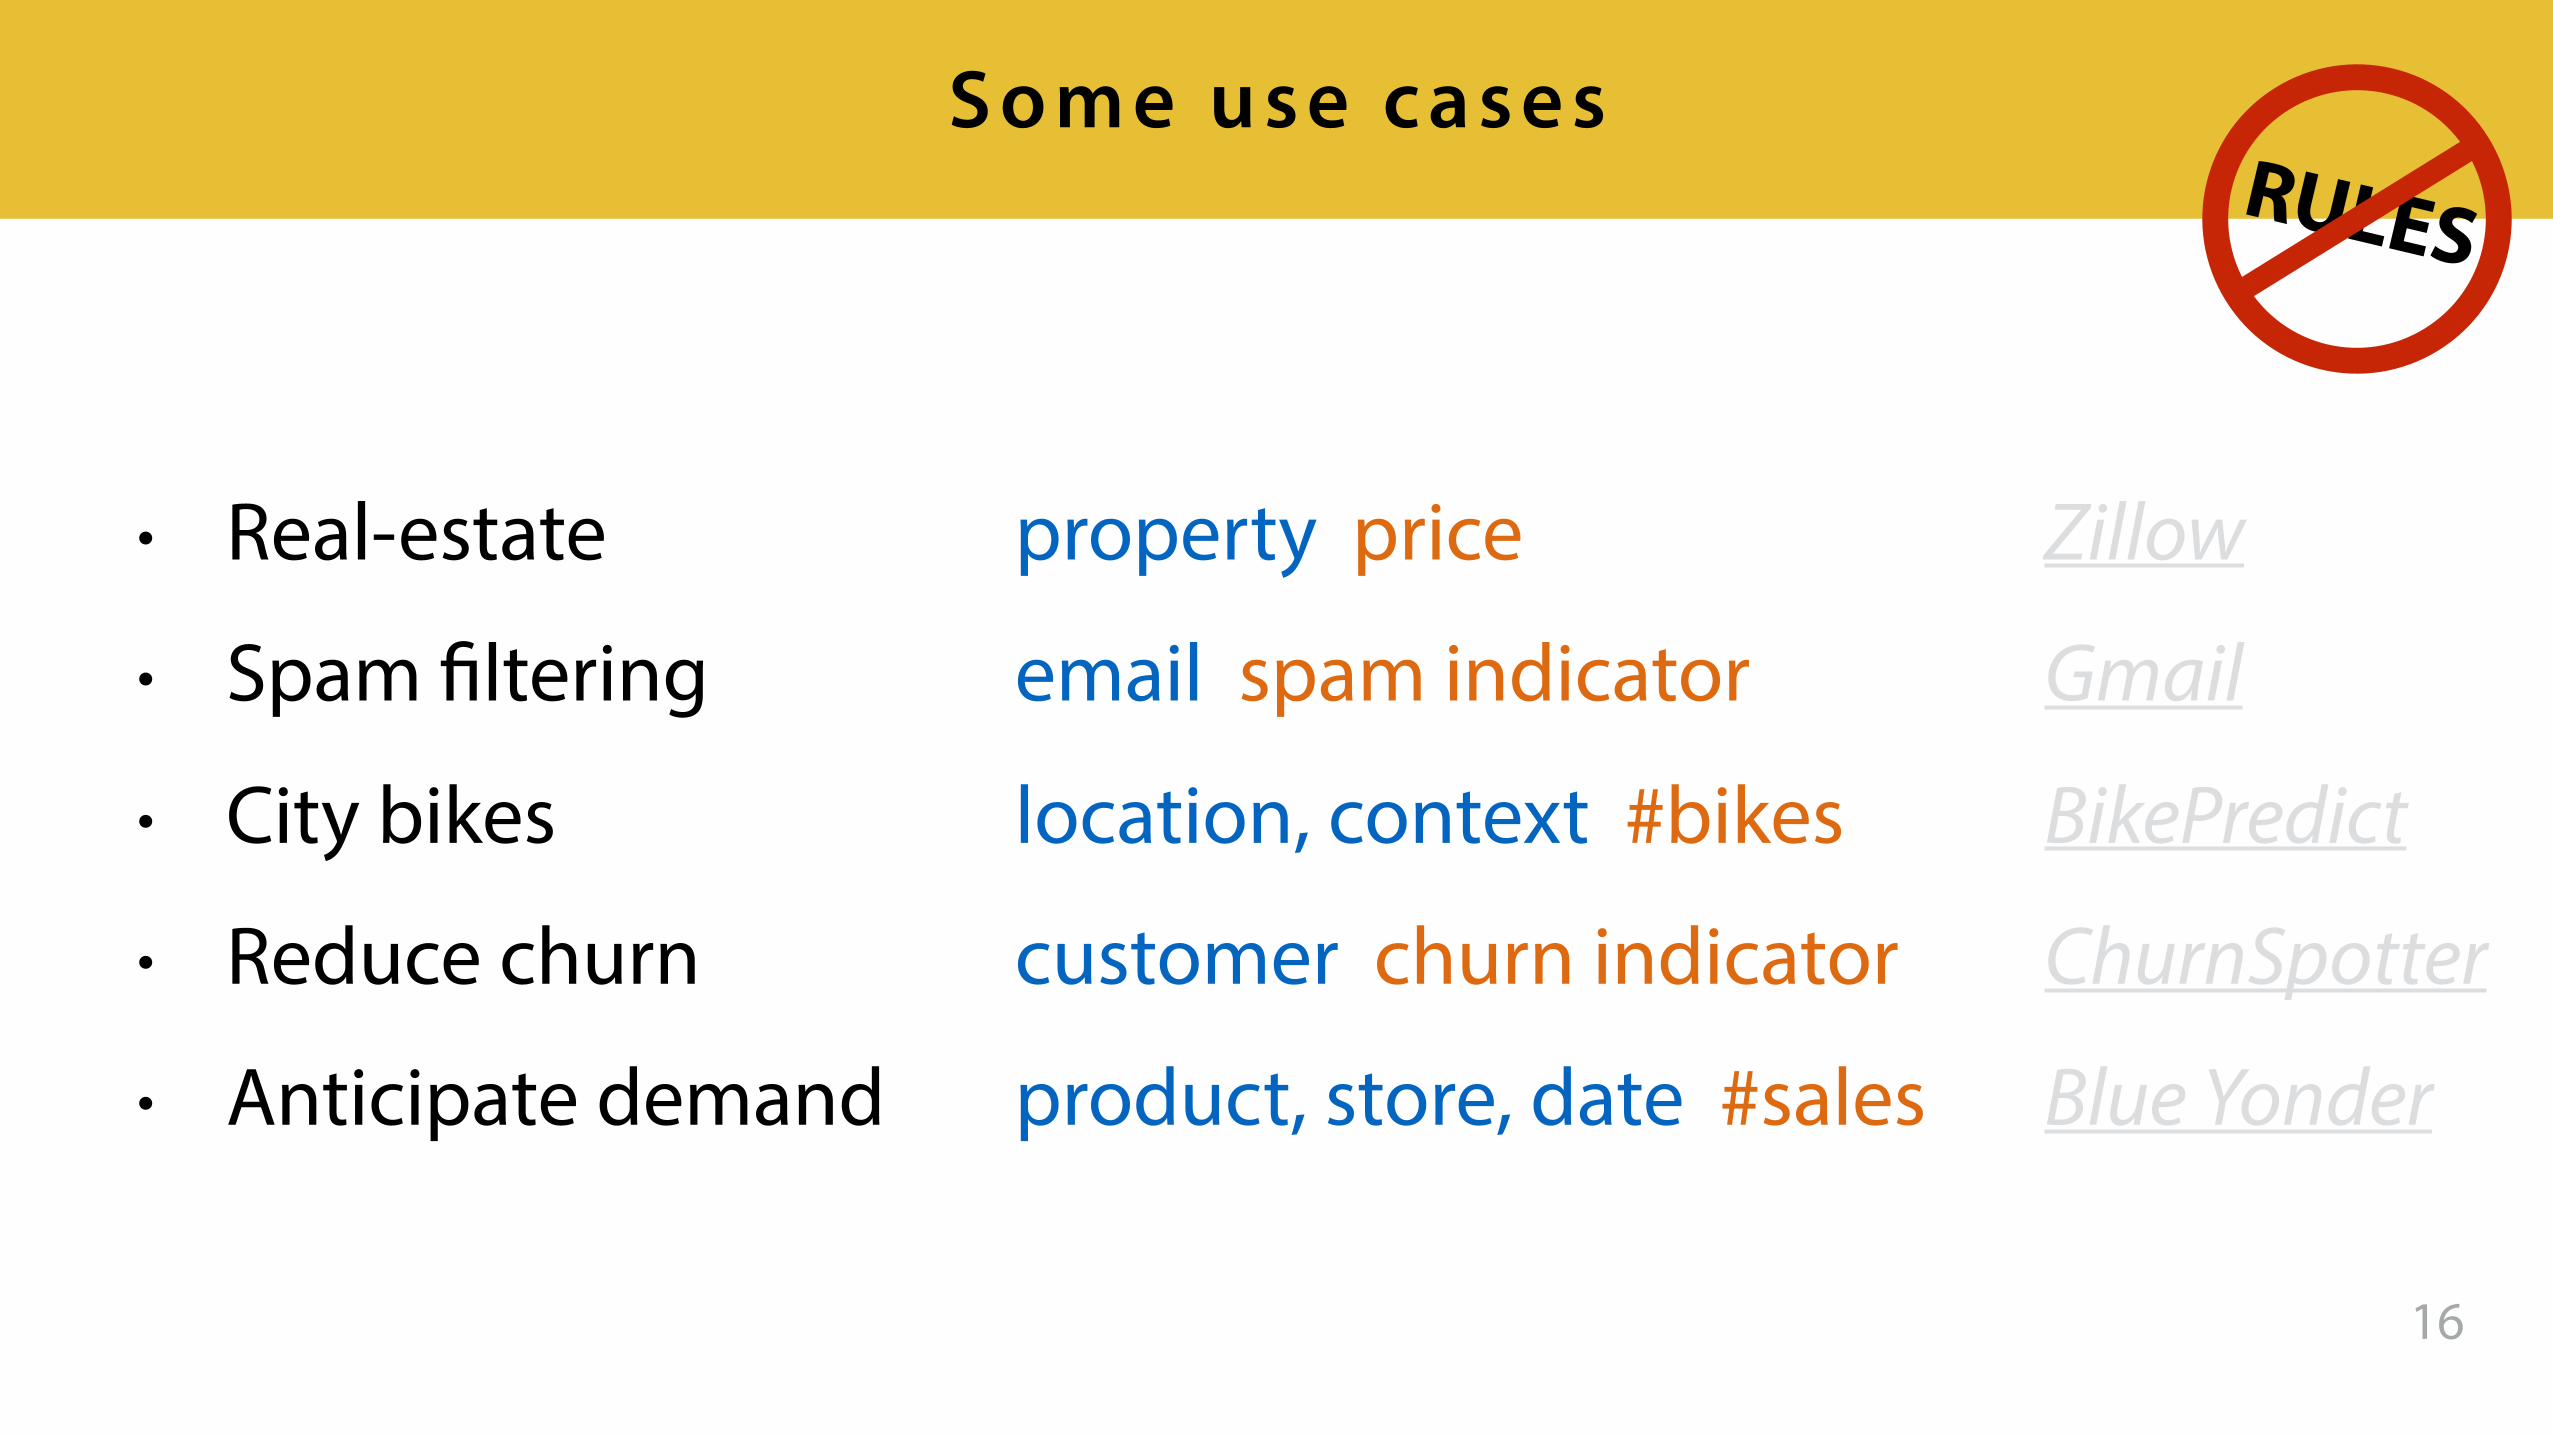
S ome use cases
• Real-estate
• Spam filtering
• City bikes
• Reduce churn
• Anticipate demand
property price
email spam indicator
location, context #bikes
customer churn indicator
product, store, date #sales
Zillow
Gmail
BikePredict
ChurnSpotter
Blue Yonder
RULES

1. Descriptive analysis
2. Predictive analysis
3. Prescriptive analysis
4. Automated decisions
18
(Big?) Data analysis
reporting & old-school BI…
now we’re talking!

Decisions from predictions

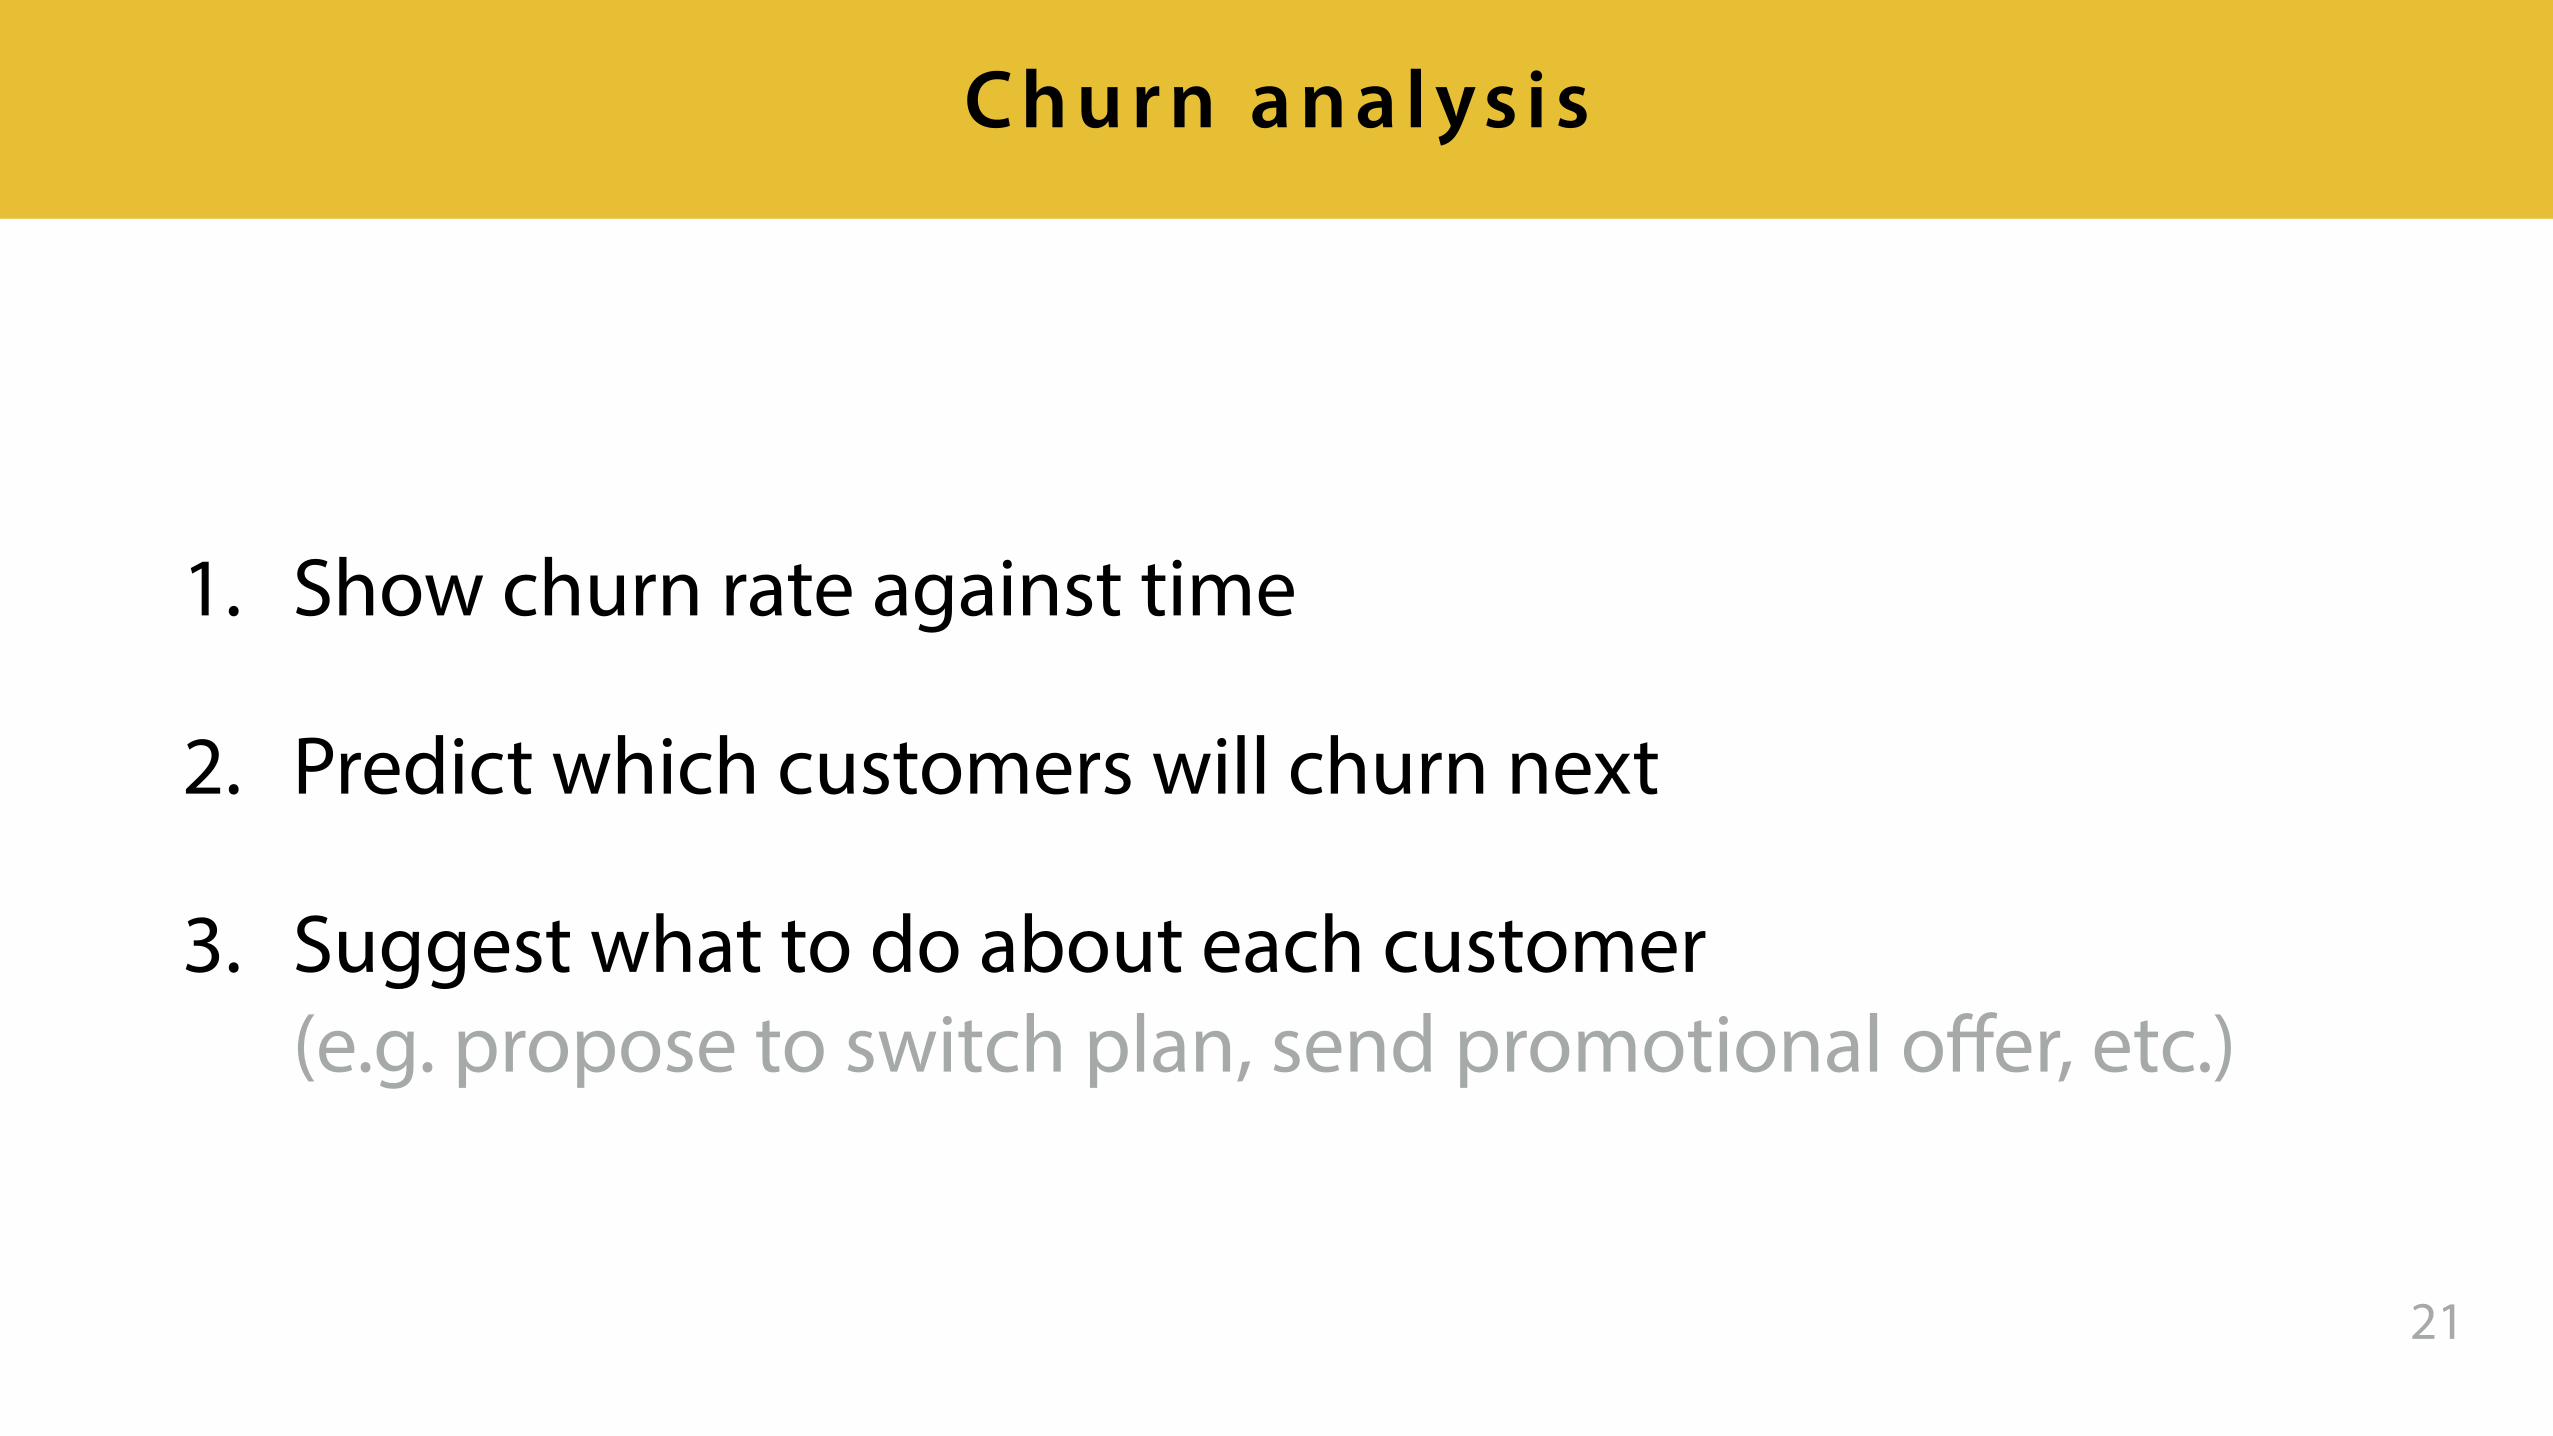
1. Show churn rate against time
2. Predict which customers will churn next
3. Suggest what to do about each customer (e.g. propose to switch plan, send promotional offer, etc.)
21
Churn analysis

• Who: SaaS company selling monthly subscription
• Question asked: “Is this customer going to leave within 1 month?”
• Input: customer
• Output: no-churn or churn
• Data collection: history up until 1 month ago
22
Churn predic t ion
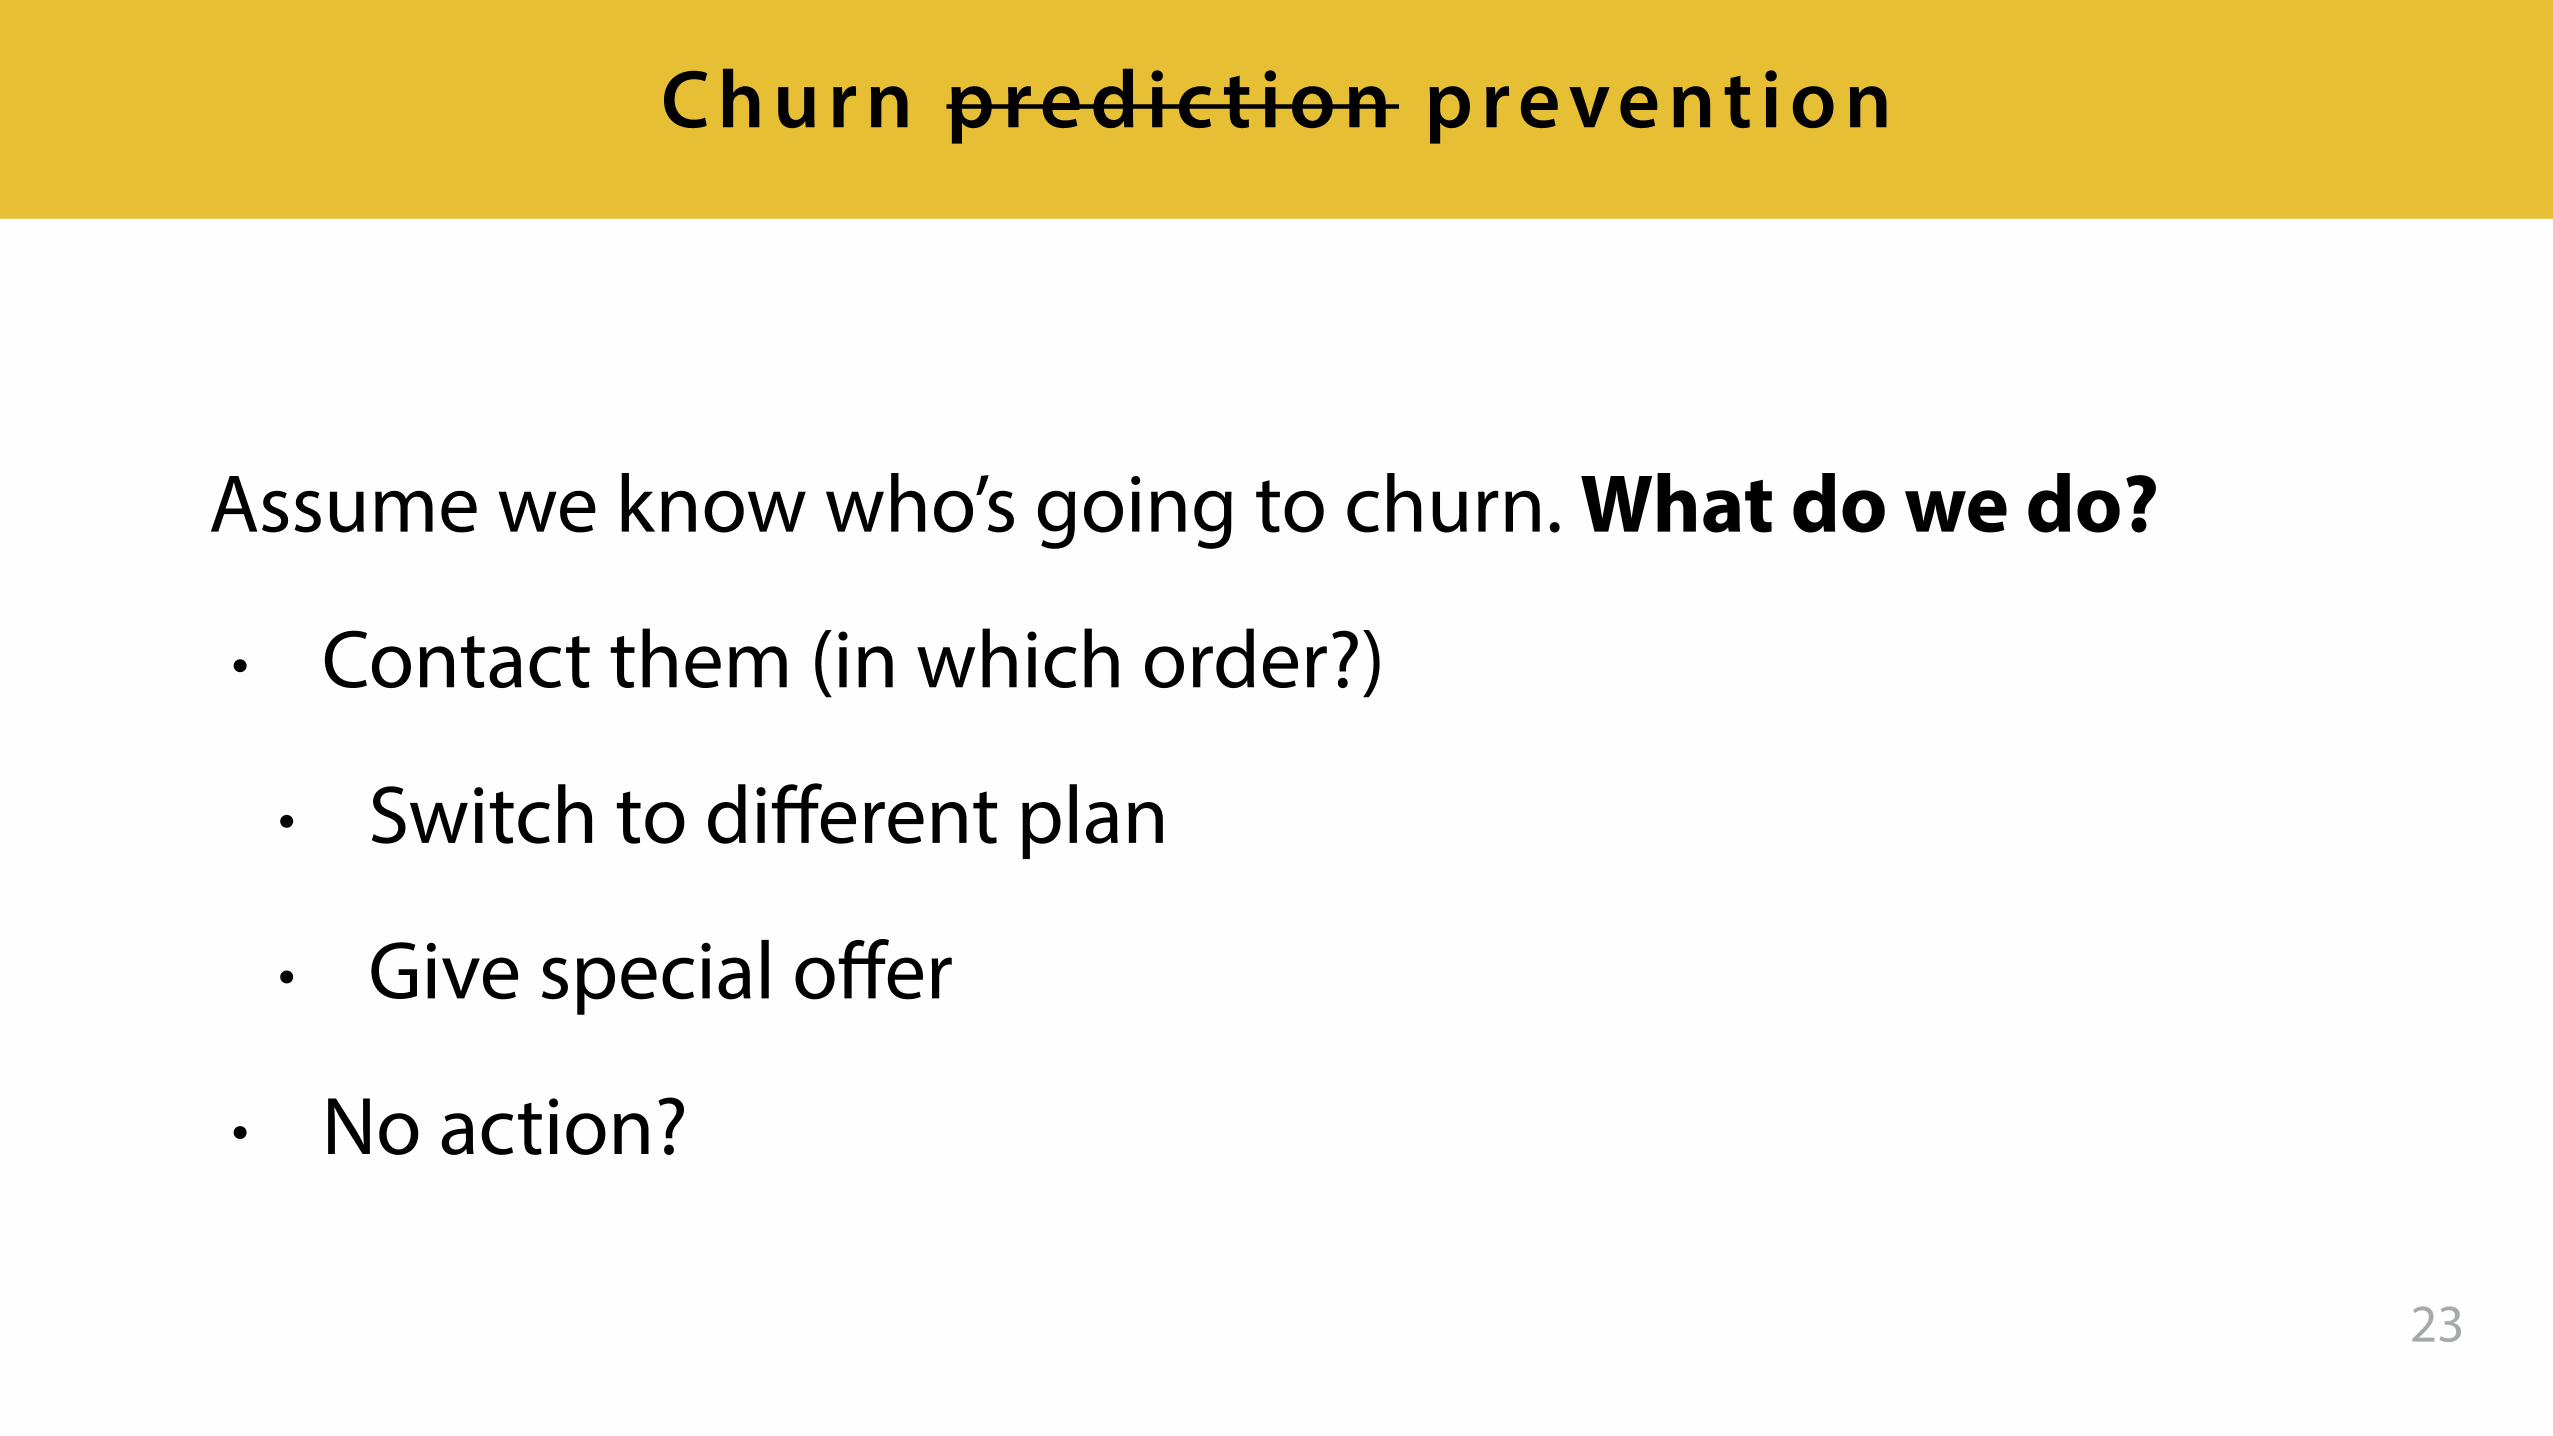
Assume we know who’s going to churn. What do we do?
• Contact them (in which order?)
• Switch to different plan
• Give special offer
• No action?
23
Churn predic t ion prevention

“3. Suggest what to do about each customer” → prioritised list of actions, based on…
• Customer representation
• Churn prediction
• Prediction confidence
• Revenue brought by customer
• Constraints on frequency of solicitations24
Churn prevention
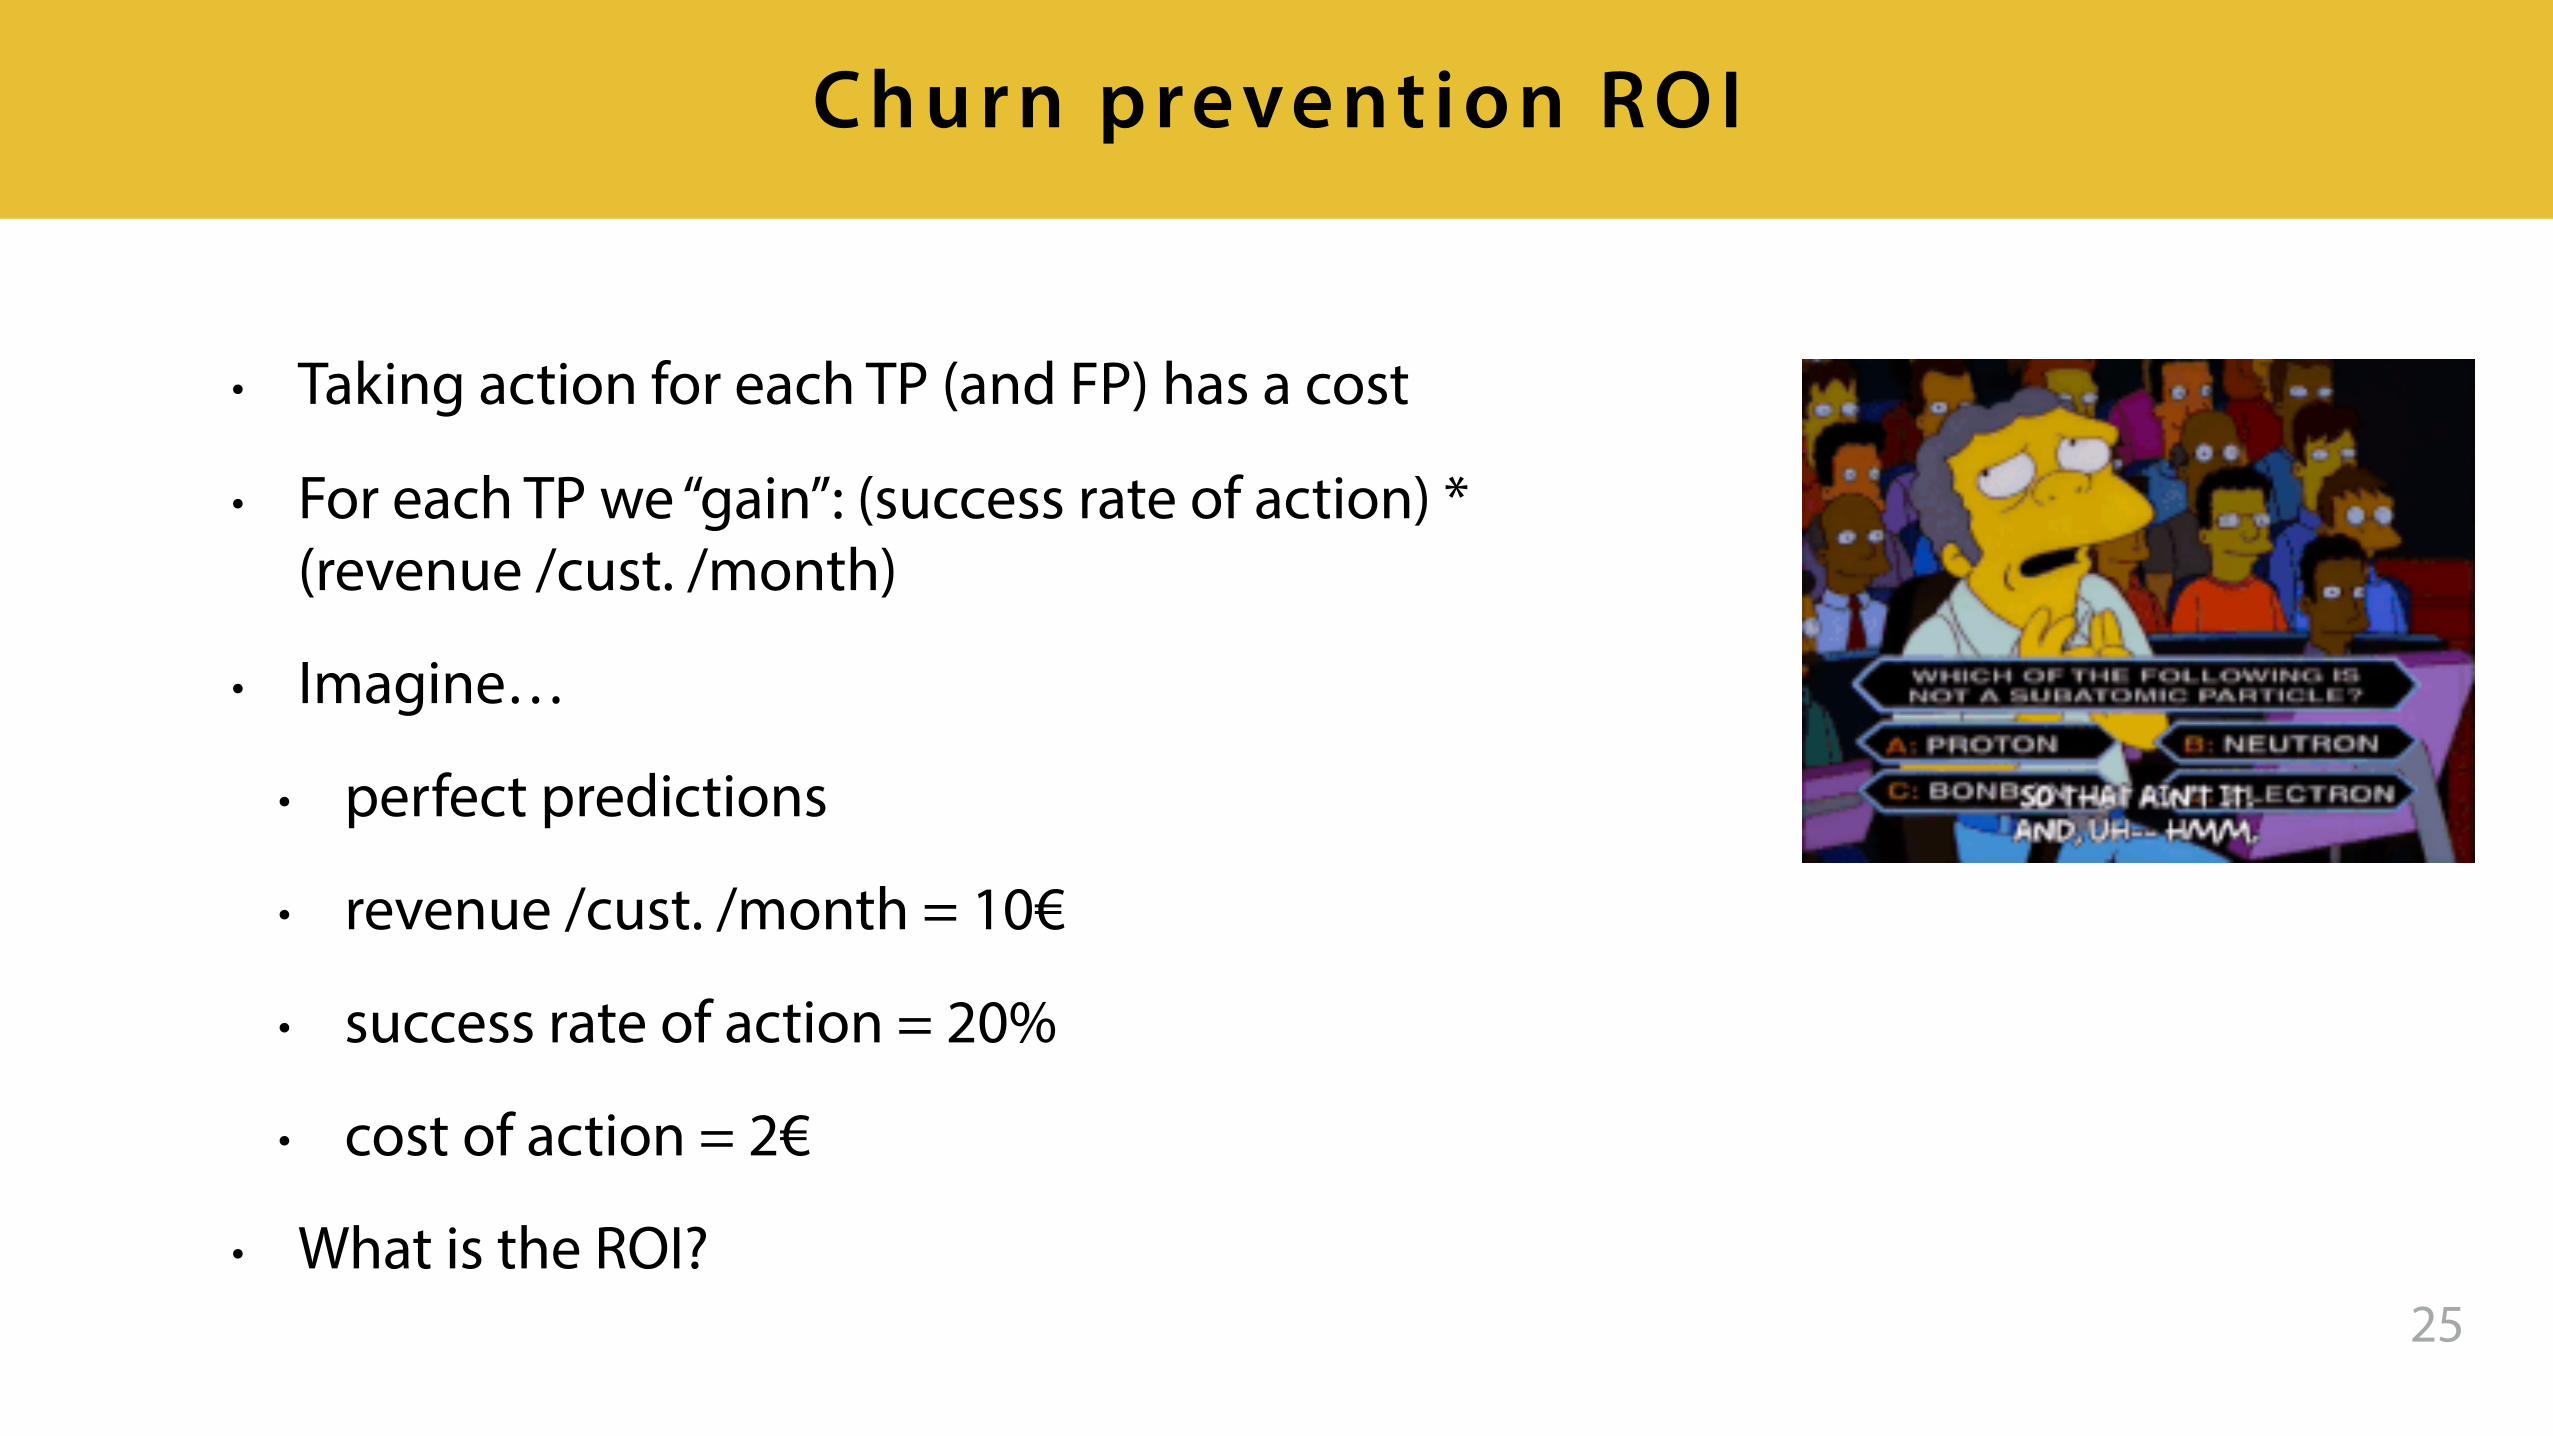
• Taking action for each TP (and FP) has a cost
• For each TP we “gain”: (success rate of action) * (revenue /cust. /month)
• Imagine…
• perfect predictions
• revenue /cust. /month = 10€
• success rate of action = 20%
• cost of action = 2€
• What is the ROI?25
Churn prevention ROI
Machine Learning Canvas
27
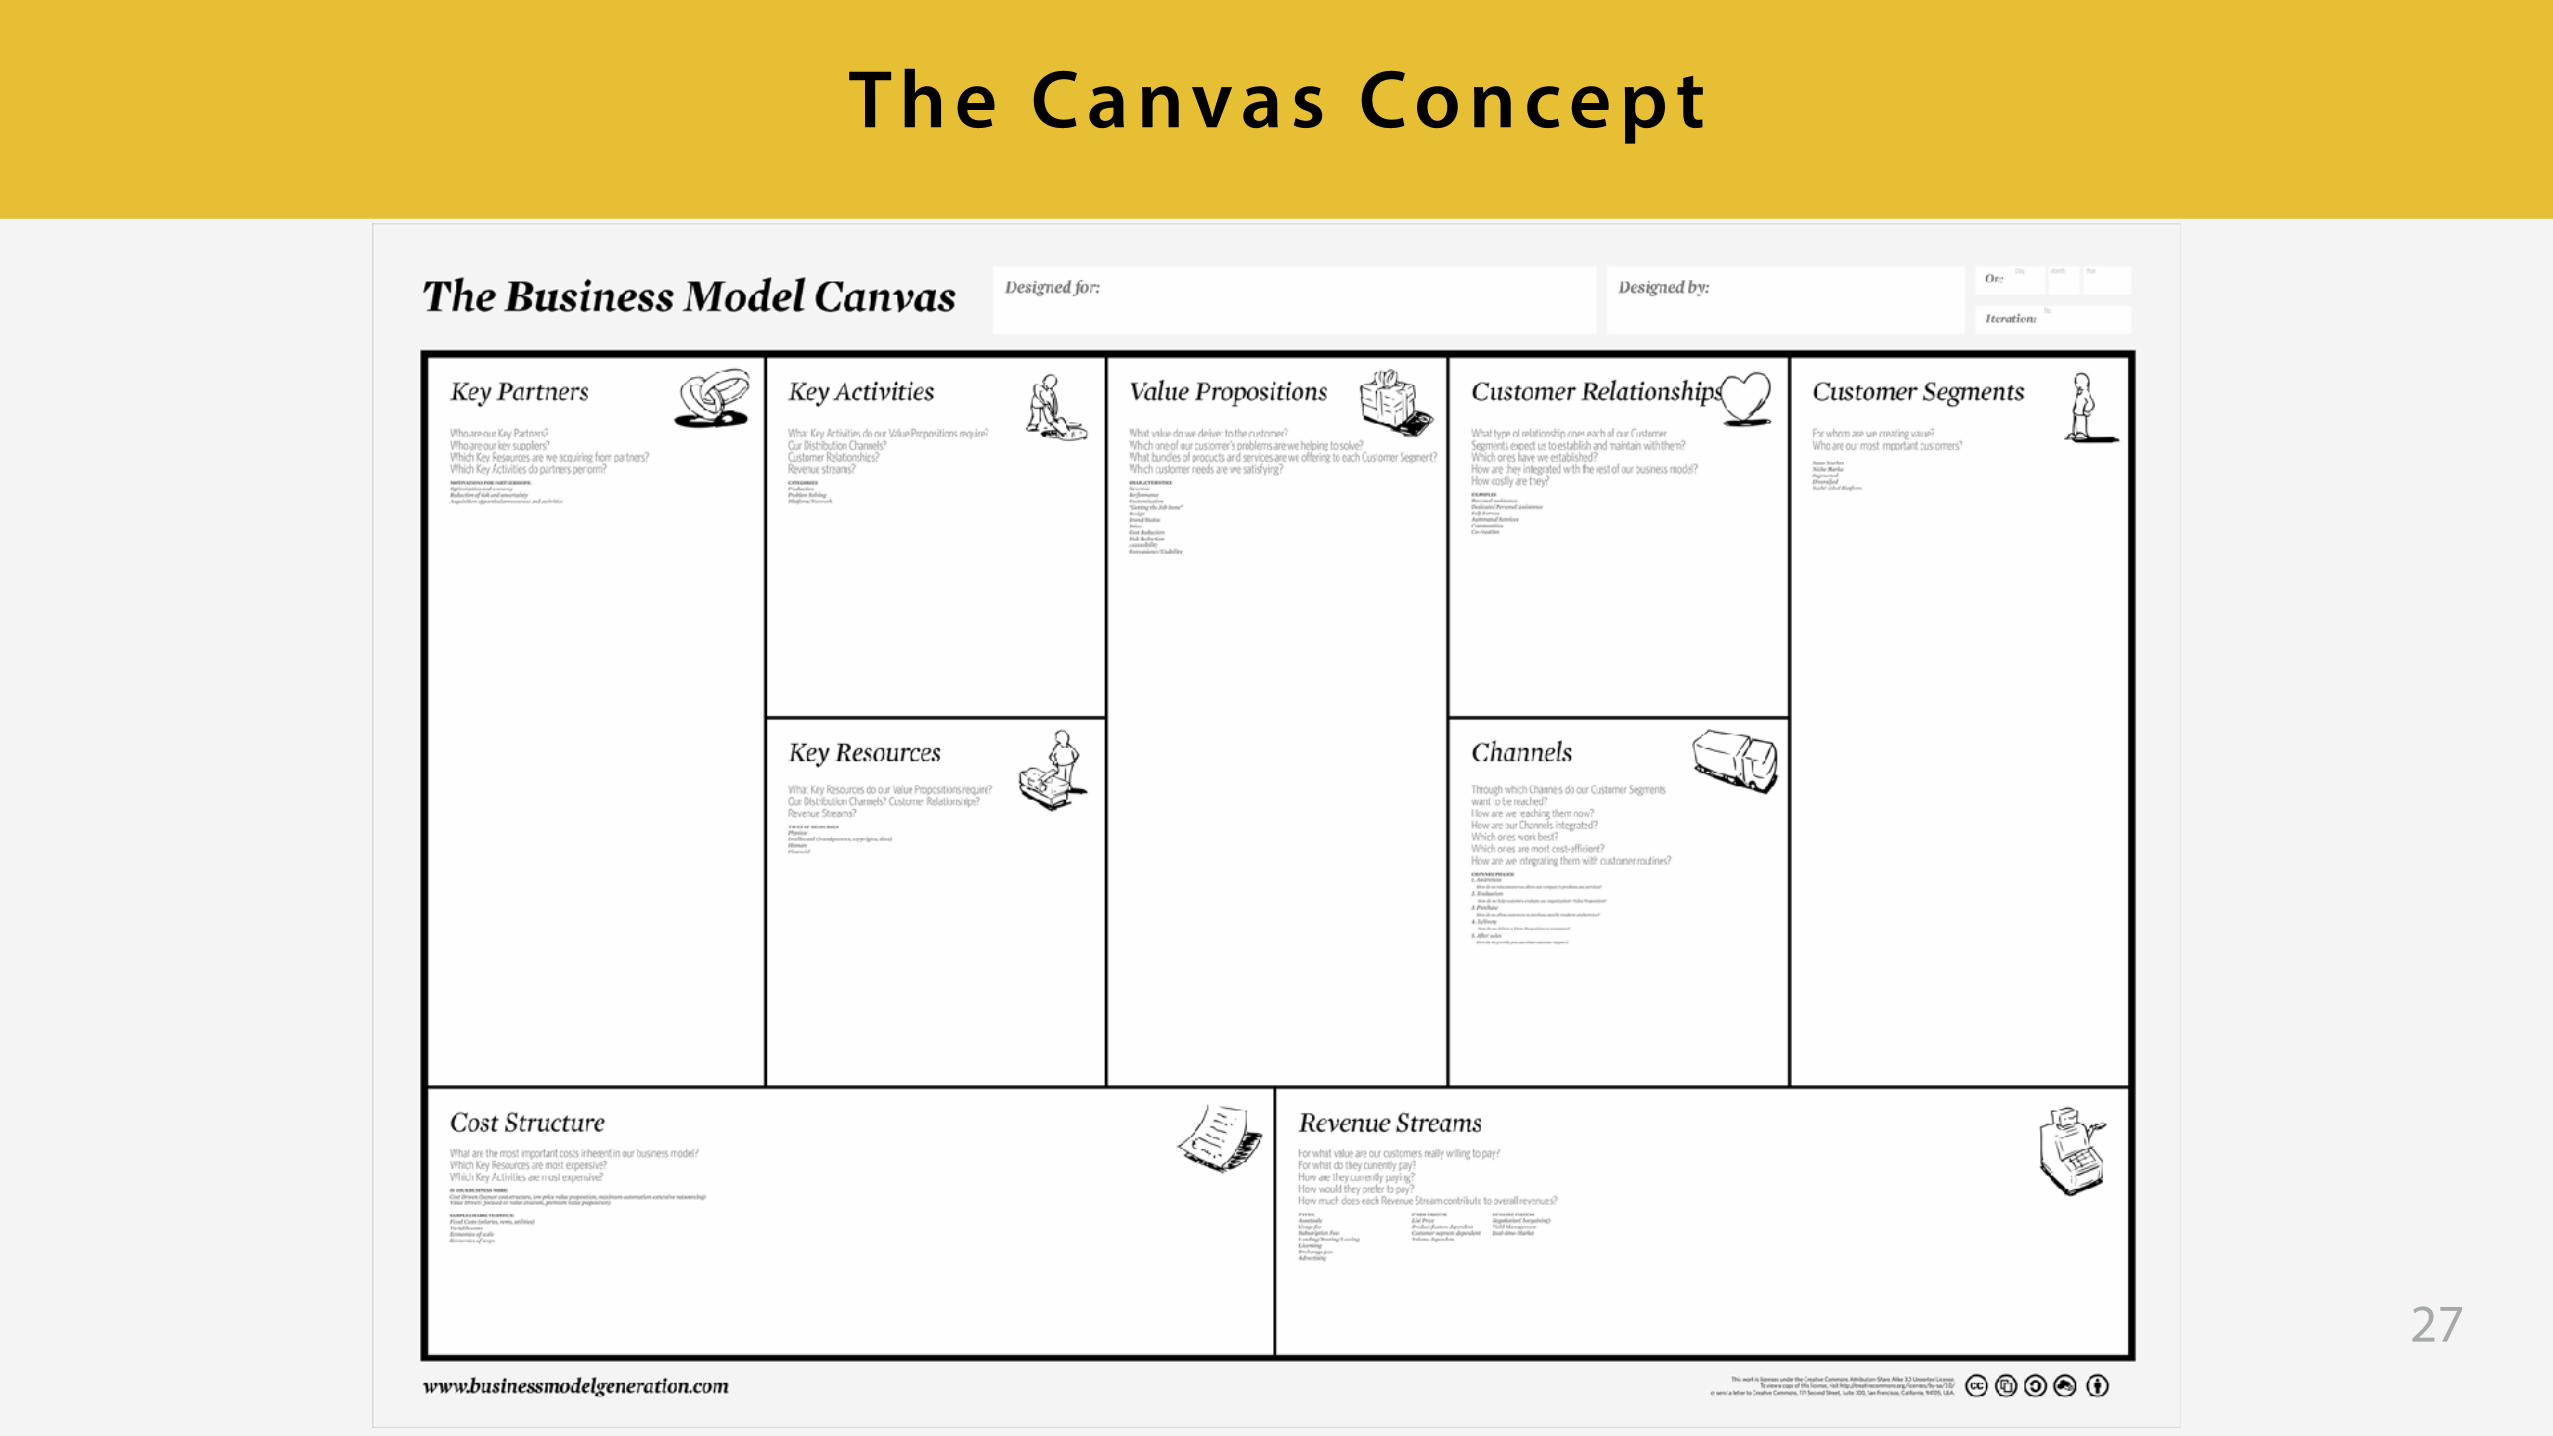
The Canvas Concept

28
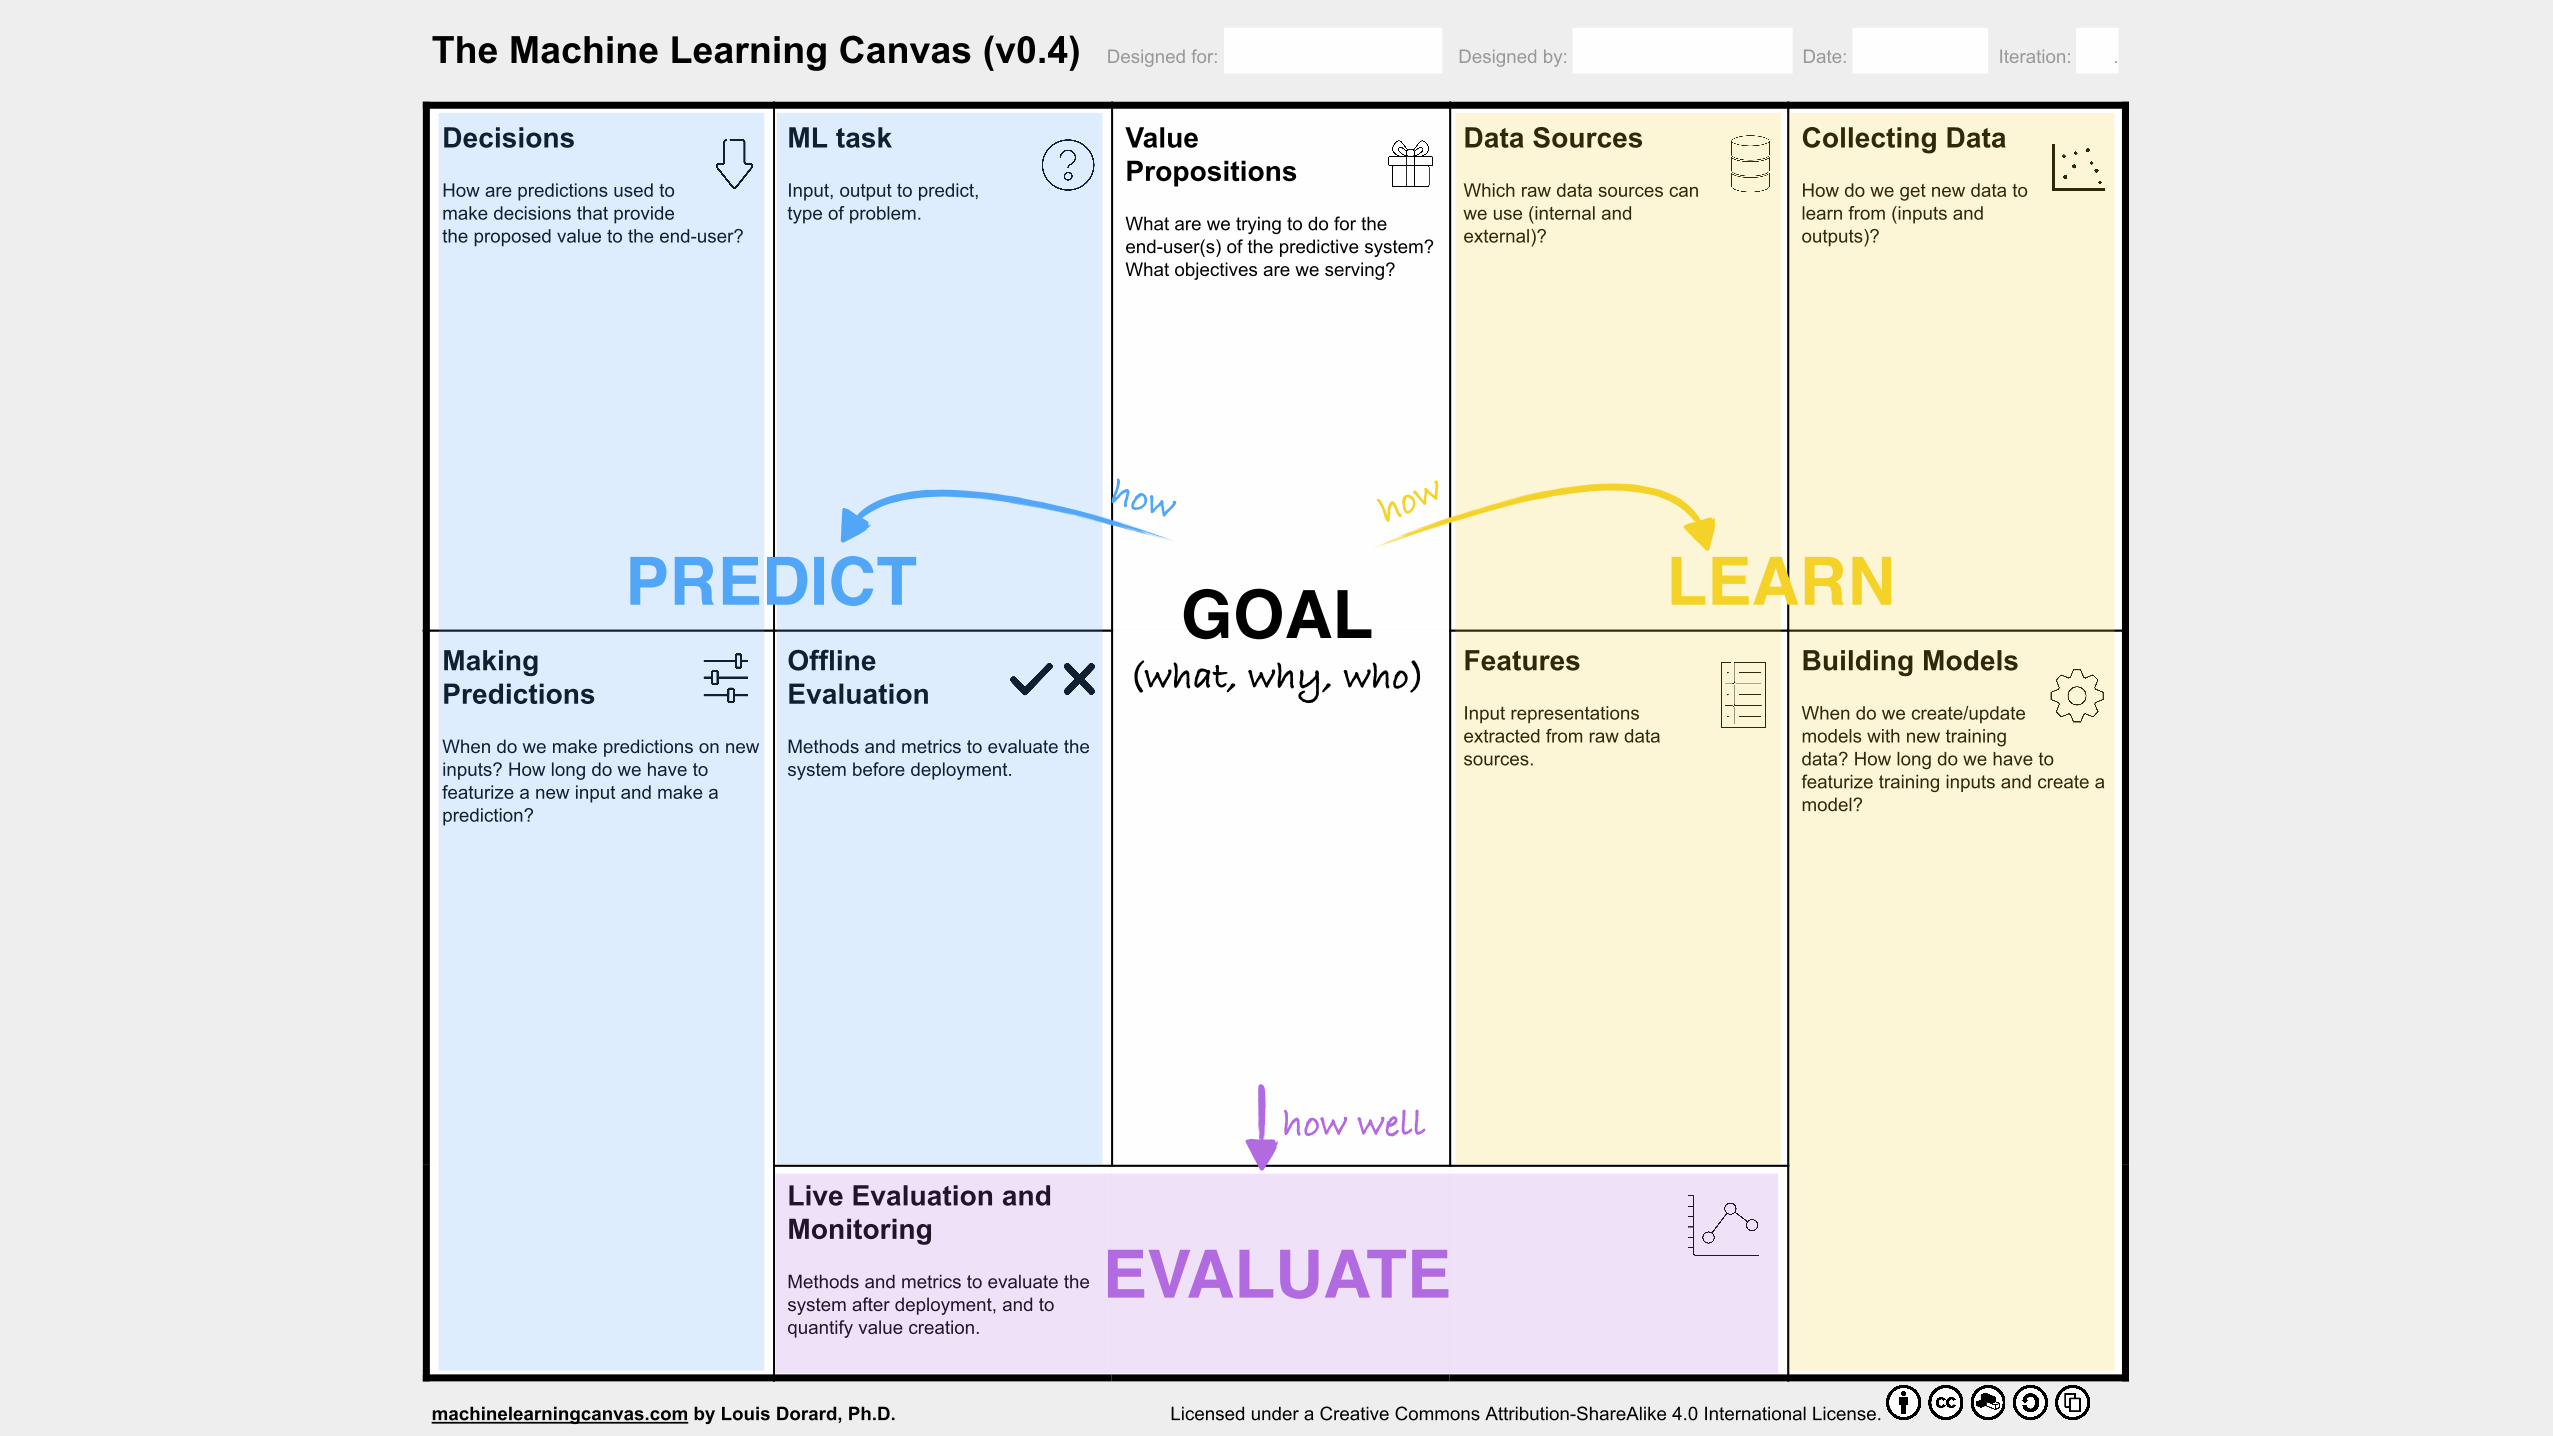
The M achine Learning Canvas
The Machine Learning Canvas (v0.4) Designed for: Designed by: Date: Iteration: .
Decisions
How are predictions used to
make decisions that provide
the proposed value to the enduser?
ML task
Input, output to predict,
type of problem.
Value
Propositions
What are we trying to do for the
enduser(s) of the predictive system?
What objectives are we serving?
Data Sources
Which raw data sources can
we use (internal and
external)?
Collecting Data
How do we get new data to
learn from (inputs and
outputs)?
Making
Predictions
When do we make predictions on new
inputs? How long do we have to
featurize a new input and make a
prediction?
Offline
Evaluation
Methods and metrics to evaluate the
system before deployment.
Features
Input representations
extracted from raw data
sources.
Building Models
When do we create/update
models with new training
data? How long do we have to
featurize training inputs and create a
model?
Live Evaluation and
Monitoring
Methods and metrics to evaluate the
system after deployment, and to
quantify value creation.
machinelearningcanvas.com by Louis Dorard, Ph.D. Licensed under a Creative Commons AttributionShareAlike 4.0 International License.

• (Not an adaptation of the Business Model Canvas)
• Describe the Learning part of a predictive system / an intelligent application:
• What data are we learning from?
• How are we using predictions powered by that learning?
• How are we making sure that the whole thing “works” through time?
29
The M achine Learning Canvas
30
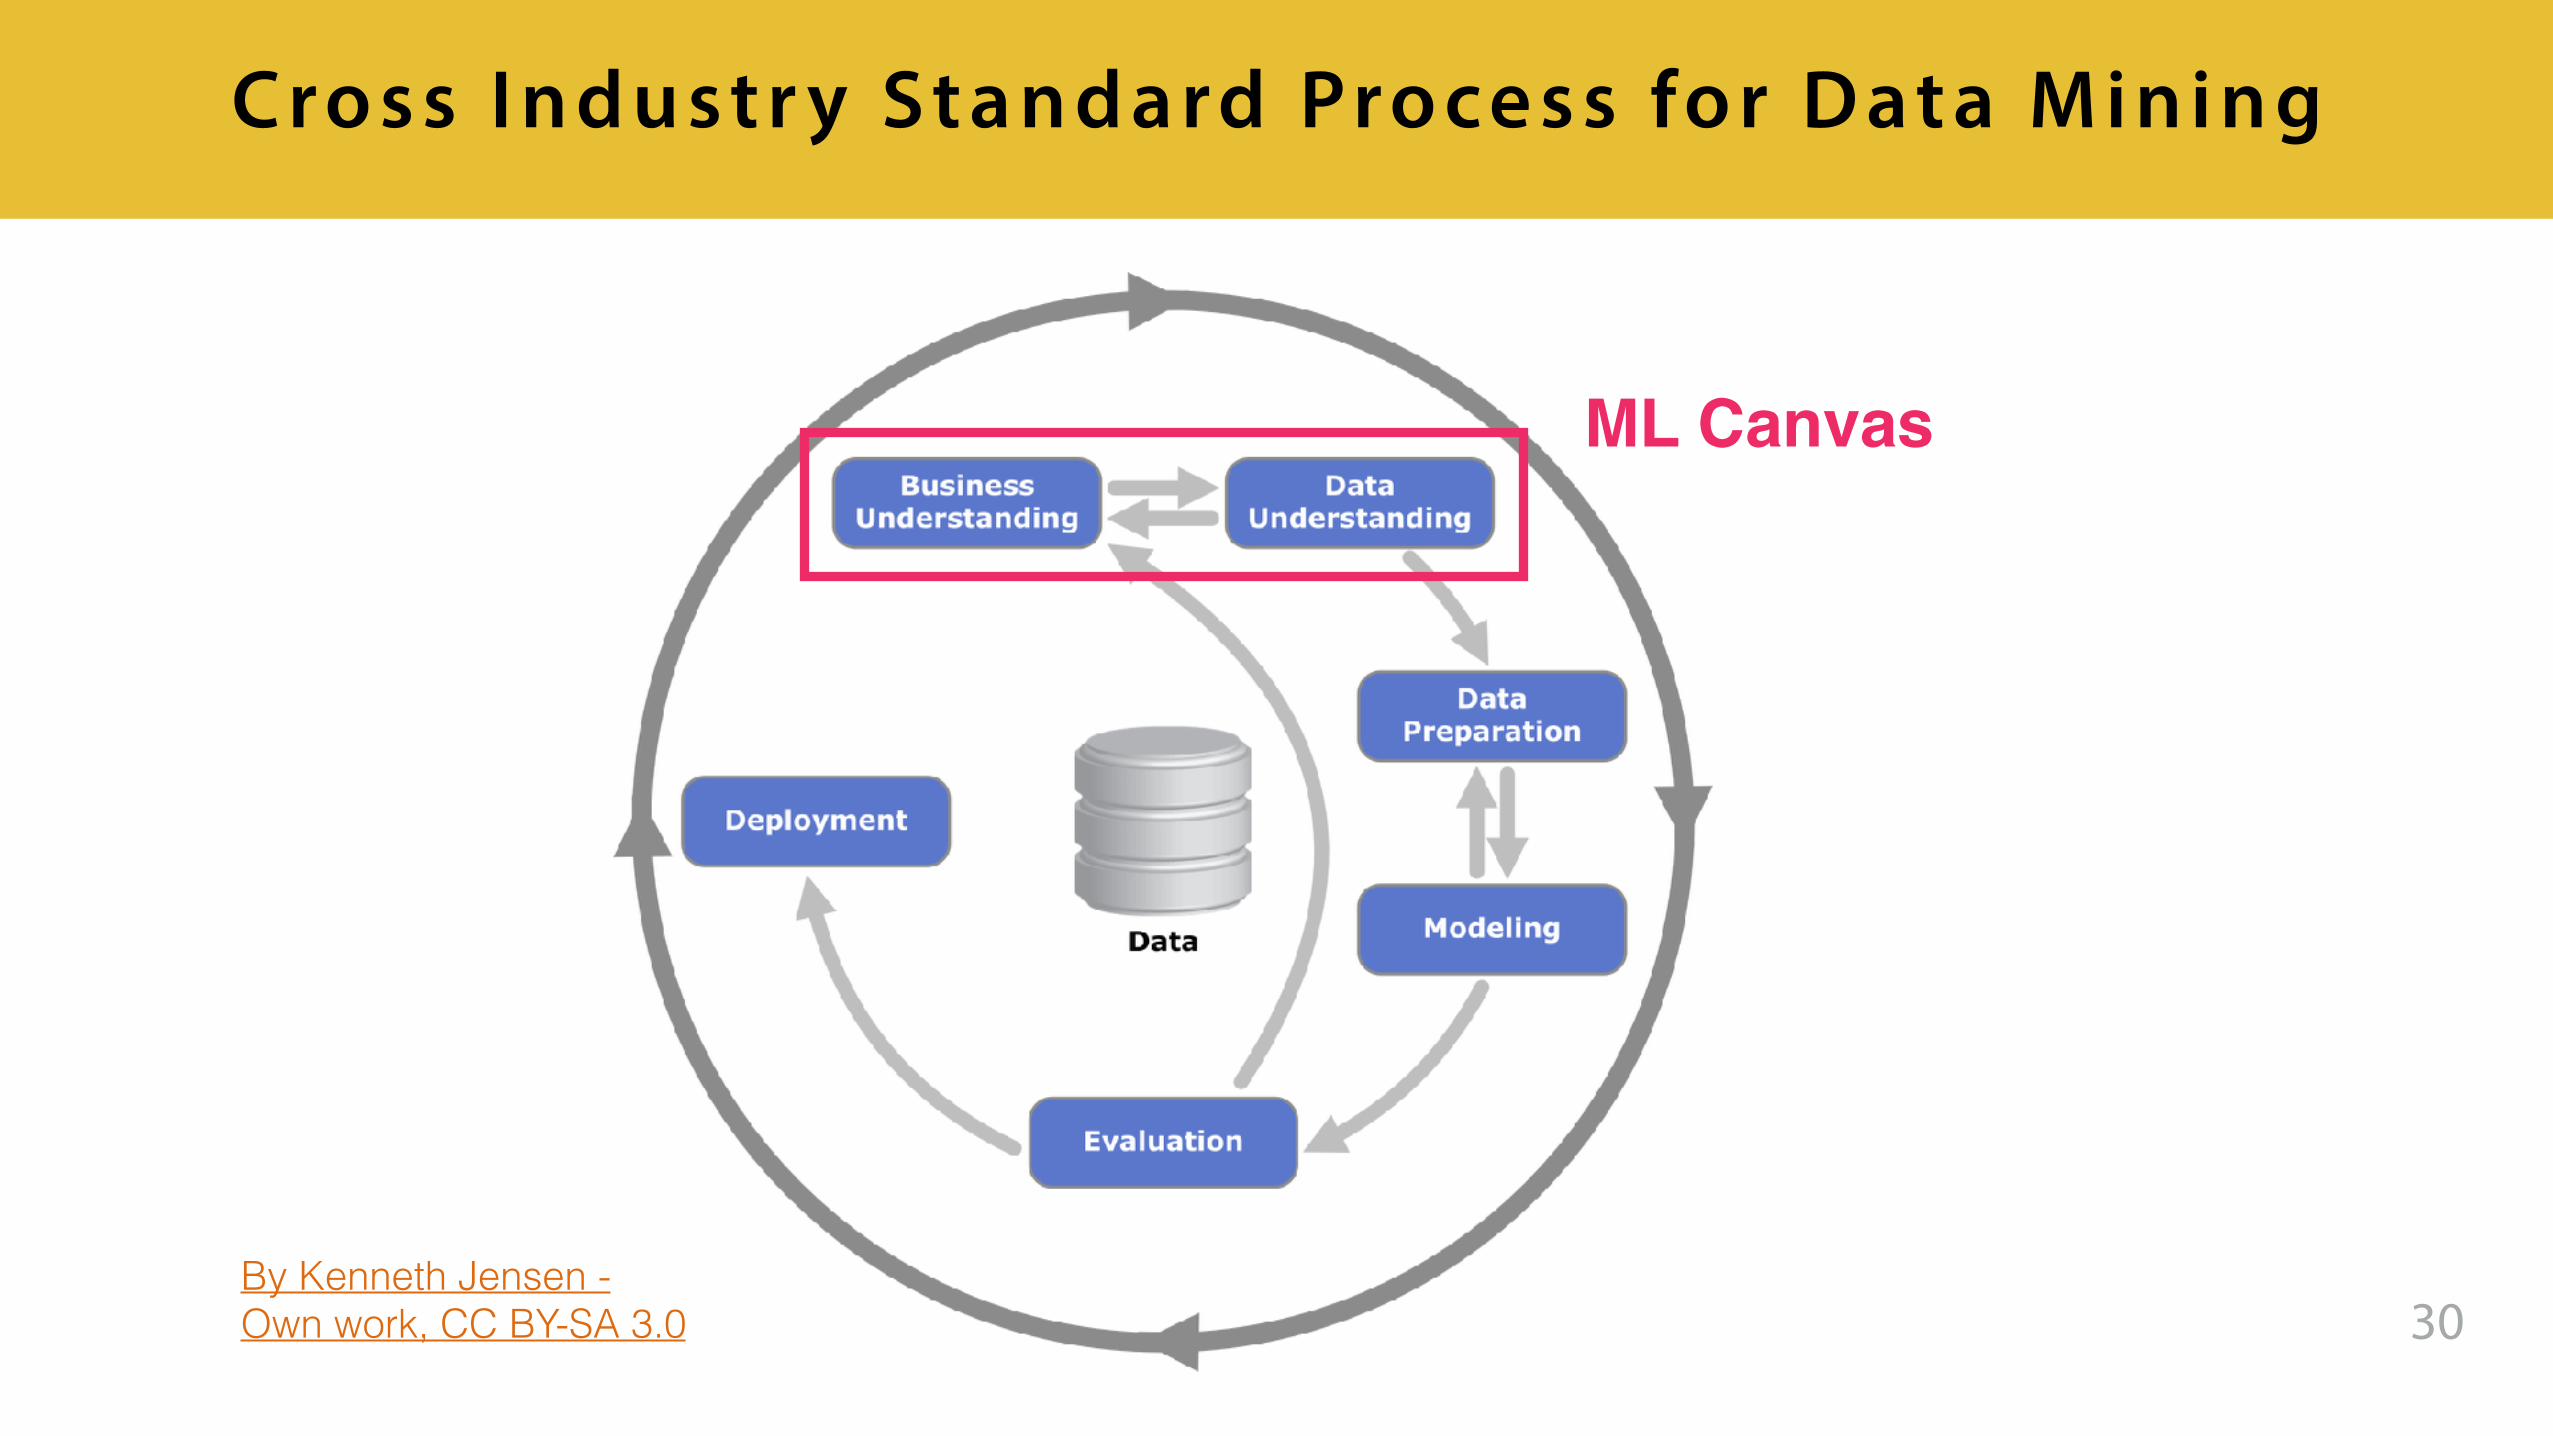
Cross I ndustr y Standard Process for Data M ining
By Kenneth Jensen - Own work, CC BY-SA 3.0
ML Canvas

–Ingolf Mollat, Principal Consultant at Blue Yonder
“The Machine Learning Canvas is providing our clients real business value by supplying the first critical entry point for their implementation
of predictive applications.”
The Machine Learning Canvas (v0.4) Designed for: Designed by: Date: Iteration: .
Decisions
How are predictions used to
make decisions that provide
the proposed value to the enduser?
ML task
Input, output to predict,
type of problem.
Value
Propositions
What are we trying to do for the
enduser(s) of the predictive system?
What objectives are we serving?
Data Sources
Which raw data sources can
we use (internal and
external)?
Collecting Data
How do we get new data to
learn from (inputs and
outputs)?
Making
Predictions
When do we make predictions on new
inputs? How long do we have to
featurize a new input and make a
prediction?
Offline
Evaluation
Methods and metrics to evaluate the
system before deployment.
Features
Input representations
extracted from raw data
sources.
Building Models
When do we create/update
models with new training
data? How long do we have to
featurize training inputs and create a
model?
Live Evaluation and
Monitoring
Methods and metrics to evaluate the
system after deployment, and to
quantify value creation.
machinelearningcanvas.com by Louis Dorard, Ph.D. Licensed under a Creative Commons AttributionShareAlike 4.0 International License.
LEARNPREDICT
EVALUATE
GOAL(what, why, who)
how how
how well

The Machine Learning Canvas (v0.4) Designed for: Designed by: Date: Iteration: .
Decisions
How are predictions used to
make decisions that provide
the proposed value to the enduser?
ML task
Input, output to predict,
type of problem.
Value
Propositions
What are we trying to do for the
enduser(s) of the predictive system?
What objectives are we serving?
Data Sources
Which raw data sources can
we use (internal and
external)?
Collecting Data
How do we get new data to
learn from (inputs and
outputs)?
Making
Predictions
When do we make predictions on new
inputs? How long do we have to
featurize a new input and make a
prediction?
Offline
Evaluation
Methods and metrics to evaluate the
system before deployment.
Features
Input representations
extracted from raw data
sources.
Building Models
When do we create/update
models with new training
data? How long do we have to
featurize training inputs and create a
model?
Live Evaluation and
Monitoring
Methods and metrics to evaluate the
system after deployment, and to
quantify value creation.
machinelearningcanvas.com by Louis Dorard, Ph.D. Licensed under a Creative Commons AttributionShareAlike 4.0 International License.
background
specifics
LEARNPREDICT
EVALUATE
GOAL(what, why, who)
DomainIntegration
PredictiveEngine

The Machine Learning Canvas (v0.4) Designed for: Designed by: Date: Iteration: .
Decisions
How are predictions used to
make decisions that provide
the proposed value to the enduser?
ML task
Input, output to predict,
type of problem.
Value
Propositions
What are we trying to do for the
enduser(s) of the predictive system?
What objectives are we serving?
Data Sources
Which raw data sources can
we use (internal and
external)?
Collecting Data
How do we get new data to
learn from (inputs and
outputs)?
Making
Predictions
When do we make predictions on new
inputs? How long do we have to
featurize a new input and make a
prediction?
Offline
Evaluation
Methods and metrics to evaluate the
system before deployment.
Features
Input representations
extracted from raw data
sources.
Building Models
When do we create/update
models with new training
data? How long do we have to
featurize training inputs and create a
model?
Live Evaluation and
Monitoring
Methods and metrics to evaluate the
system after deployment, and to
quantify value creation.
machinelearningcanvas.com by Louis Dorard, Ph.D. Licensed under a Creative Commons AttributionShareAlike 4.0 International License.
On 1st day of every month:
• Filter out ‘no-churn’ • Sort remaining by
descending (churn prob.) x (monthly revenue) and show prediction path for each
• Solicit customers
Predict answer to “Is this customer going to churn in the coming month?”
• Input: customer • Output: ‘churn’ or ‘no-
churn’ class (‘churn’ is the Positive class)
• Binary Classification
Context:
• Company sells SaaS with monthly subscription
• End-user of predictive system is CRM team
We want to help them…
• Identify important clients who may churn, so appropriate action can be taken
• Reduce churn rate among high-revenue customers
• Improve success rate of retention efforts by understanding why customers may churn
• CRM tool • Payments database • Website analytics • Customer support • Emailing to customers
Every month, we see which of last month’s customers churned or not, by looking through the payments database.
Associated inputs are customer “snapshots” taken last month.
Every month we (re-)featurize all current customers and make predictions for them.
We do this overnight.
Basic customer info at time t (age, city, etc.)
Events between (t - 1 month) and t: • Usage of product: # times
logged in, functionalities used, etc.
• Cust. support interactions • Other contextual, e.g.
devices used
Every month we create a new model from the previous month’s customers.
• Monitor churn rate • Monitor (#non-churn among solicited) / #solicitations
Customer retention Louis Dorard Sept. 2016 1

• We predict customer would churn but they don’t…
• Great! Prevention works!
• Sh*t! Data inconsistent…
• (Store which actions were taken?)


The Machine Learning Canvas (v0.4) Designed for: Designed by: Date: Iteration: .
Decisions
How are predictions used to
make decisions that provide
the proposed value to the enduser?
ML task
Input, output to predict,
type of problem.
Value
Propositions
What are we trying to do for the
enduser(s) of the predictive system?
What objectives are we serving?
Data Sources
Which raw data sources can
we use (internal and
external)?
Collecting Data
How do we get new data to
learn from (inputs and
outputs)?
Making
Predictions
When do we make predictions on new
inputs? How long do we have to
featurize a new input and make a
prediction?
Offline
Evaluation
Methods and metrics to evaluate the
system before deployment.
Features
Input representations
extracted from raw data
sources.
Building Models
When do we create/update
models with new training
data? How long do we have to
featurize training inputs and create a
model?
Live Evaluation and
Monitoring
Methods and metrics to evaluate the
system after deployment, and to
quantify value creation.
machinelearningcanvas.com by Louis Dorard, Ph.D. Licensed under a Creative Commons AttributionShareAlike 4.0 International License.
On 1st day of every month:
• Randomly filter out 50% of customers (hold-out set)
• Filter out ‘no-churn’ • Sort remaining by
descending (churn prob.) x (monthly revenue) and show prediction path for each
• Solicit customers
Predict answer to “Is this customer going to churn in the coming month?”
• Input: customer • Output: ‘churn’ or ‘no-
churn’ class (‘churn’ is the Positive class)
• Binary Classification
Context:
• Company sells SaaS with monthly subscription
• End-user of predictive system is CRM team
We want to help them…
• Identify important clients who may churn, so appropriate action can be taken
• Reduce churn rate among high-revenue customers
• Improve success rate of retention efforts by understanding why customers may churn
• CRM tool • Payments database • Website analytics • Customer support • Emailing to customers
Every month, we see which of last month’s customers churned or not, by looking through the payments database.
Associated inputs are customer “snapshots” taken last month.
Every month we (re-)featurize all current customers and make predictions for them.
We do this overnight.
Basic customer info at time t (age, city, etc.)
Events between (t - 1 month) and t: • Usage of product: # times
logged in, functionalities used, etc.
• Cust. support interactions • Other contextual, e.g.
devices used
• Monitor churn rate • Monitor (#non-churn among solicited) / #solicitations
Customer retention Louis Dorard Sept. 2016 1
Every month we create a new model from the previous month’s customers.

The Machine Learning Canvas (v0.4) Designed for: Designed by: Date: Iteration: .
Decisions
How are predictions used to
make decisions that provide
the proposed value to the enduser?
ML task
Input, output to predict,
type of problem.
Value
Propositions
What are we trying to do for the
enduser(s) of the predictive system?
What objectives are we serving?
Data Sources
Which raw data sources can
we use (internal and
external)?
Collecting Data
How do we get new data to
learn from (inputs and
outputs)?
Making
Predictions
When do we make predictions on new
inputs? How long do we have to
featurize a new input and make a
prediction?
Offline
Evaluation
Methods and metrics to evaluate the
system before deployment.
Features
Input representations
extracted from raw data
sources.
Building Models
When do we create/update
models with new training
data? How long do we have to
featurize training inputs and create a
model?
Live Evaluation and
Monitoring
Methods and metrics to evaluate the
system after deployment, and to
quantify value creation.
machinelearningcanvas.com by Louis Dorard, Ph.D. Licensed under a Creative Commons AttributionShareAlike 4.0 International License.
On 1st day of every month:
• Randomly filter out 50% of customers (hold-out set)
• Filter out ‘no-churn’ • Sort remaining by
descending (churn prob.) x (monthly revenue) and show prediction path for each
• Solicit customers
Predict answer to “Is this customer going to churn in the coming month?”
• Input: customer • Output: ‘churn’ or ‘no-
churn’ class (‘churn’ is the Positive class)
• Binary Classification
Context:
• Company sells SaaS with monthly subscription
• End-user of predictive system is CRM team
We want to help them…
• Identify important clients who may churn, so appropriate action can be taken
• Reduce churn rate among high-revenue customers
• Improve success rate of retention efforts by understanding why customers may churn
• CRM tool • Payments database • Website analytics • Customer support • Emailing to customers
Every month, we see which of last month’s customers churned or not, by looking through the payments database.
Associated inputs are customer “snapshots” taken last month.
Every month we (re-)featurize all current customers and make predictions for them.
We do this overnight.
Basic customer info at time t (age, city, etc.)
Events between (t - 1 month) and t: • Usage of product: # times
logged in, functionalities used, etc.
• Cust. support interactions • Other contextual, e.g.
devices used
Every month we create a new model from the previous month’s hold-out set (or the whole set, when initializing this system).
We do this overnight (along with making predictions).
• Monitor churn rate • Monitor (#non-churn among solicited) / #solicitations
Customer retention Louis Dorard Sept. 2016 1
The Machine Learning Canvas (v0.4) Designed for: Designed by: Date: Iteration: .
Decisions
How are predictions used to
make decisions that provide
the proposed value to the enduser?
ML task
Input, output to predict,
type of problem.
Value
Propositions
What are we trying to do for the
enduser(s) of the predictive system?
What objectives are we serving?
Data Sources
Which raw data sources can
we use (internal and
external)?
Collecting Data
How do we get new data to
learn from (inputs and
outputs)?
Making
Predictions
When do we make predictions on new
inputs? How long do we have to
featurize a new input and make a
prediction?
Offline
Evaluation
Methods and metrics to evaluate the
system before deployment.
Features
Input representations
extracted from raw data
sources.
Building Models
When do we create/update
models with new training
data? How long do we have to
featurize training inputs and create a
model?
Live Evaluation and
Monitoring
Methods and metrics to evaluate the
system after deployment, and to
quantify value creation.
machinelearningcanvas.com by Louis Dorard, Ph.D. Licensed under a Creative Commons AttributionShareAlike 4.0 International License.
On 1st day of every month:
• Randomly filter out 50% of customers (hold-out set)
• Filter out ‘no-churn’ • Sort remaining by
descending (churn prob.) x (monthly revenue) and show prediction path for each
• Solicit customers
Predict answer to “Is this customer going to churn in the coming month?”
• Input: customer • Output: ‘churn’ or ‘no-
churn’ class (‘churn’ is the Positive class)
• Binary Classification
Context:
• Company sells SaaS with monthly subscription
• End-user of predictive system is CRM team
We want to help them…
• Identify important clients who may churn, so appropriate action can be taken
• Reduce churn rate among high-revenue customers
• Improve success rate of retention efforts by understanding why customers may churn
• CRM tool • Payments database • Website analytics • Customer support • Emailing to customers
Every month, we see which of last month’s customers churned or not, by looking through the payments database.
Associated inputs are customer “snapshots” taken last month.
Every month we (re-)featurize all current customers and make predictions for them.
We do this overnight.
Basic customer info at time t (age, city, etc.)
Events between (t - 1 month) and t: • Usage of product: # times
logged in, functionalities used, etc.
• Cust. support interactions • Other contextual, e.g.
devices used
Every month we create a new model from the previous month’s hold-out set (or the whole set, when initializing this system).
We do this overnight (along with making predictions).
• Accuracy of last month’s predictions on hold-out set • Compare churn rate & lost revenue between last month’s
hold-out set and remaining set • Monitor (#non-churn among solicited) / #solicitations • Monitor ROI (based on diff. in lost revenue & cost of
solicitations)
Customer retention Louis Dorard Sept. 2016 1
The Machine Learning Canvas (v0.4) Designed for: Designed by: Date: Iteration: .
Decisions
How are predictions used to
make decisions that provide
the proposed value to the enduser?
ML task
Input, output to predict,
type of problem.
Value
Propositions
What are we trying to do for the
enduser(s) of the predictive system?
What objectives are we serving?
Data Sources
Which raw data sources can
we use (internal and
external)?
Collecting Data
How do we get new data to
learn from (inputs and
outputs)?
Making
Predictions
When do we make predictions on new
inputs? How long do we have to
featurize a new input and make a
prediction?
Offline
Evaluation
Methods and metrics to evaluate the
system before deployment.
Features
Input representations
extracted from raw data
sources.
Building Models
When do we create/update
models with new training
data? How long do we have to
featurize training inputs and create a
model?
Live Evaluation and
Monitoring
Methods and metrics to evaluate the
system after deployment, and to
quantify value creation.
machinelearningcanvas.com by Louis Dorard, Ph.D. Licensed under a Creative Commons AttributionShareAlike 4.0 International License.
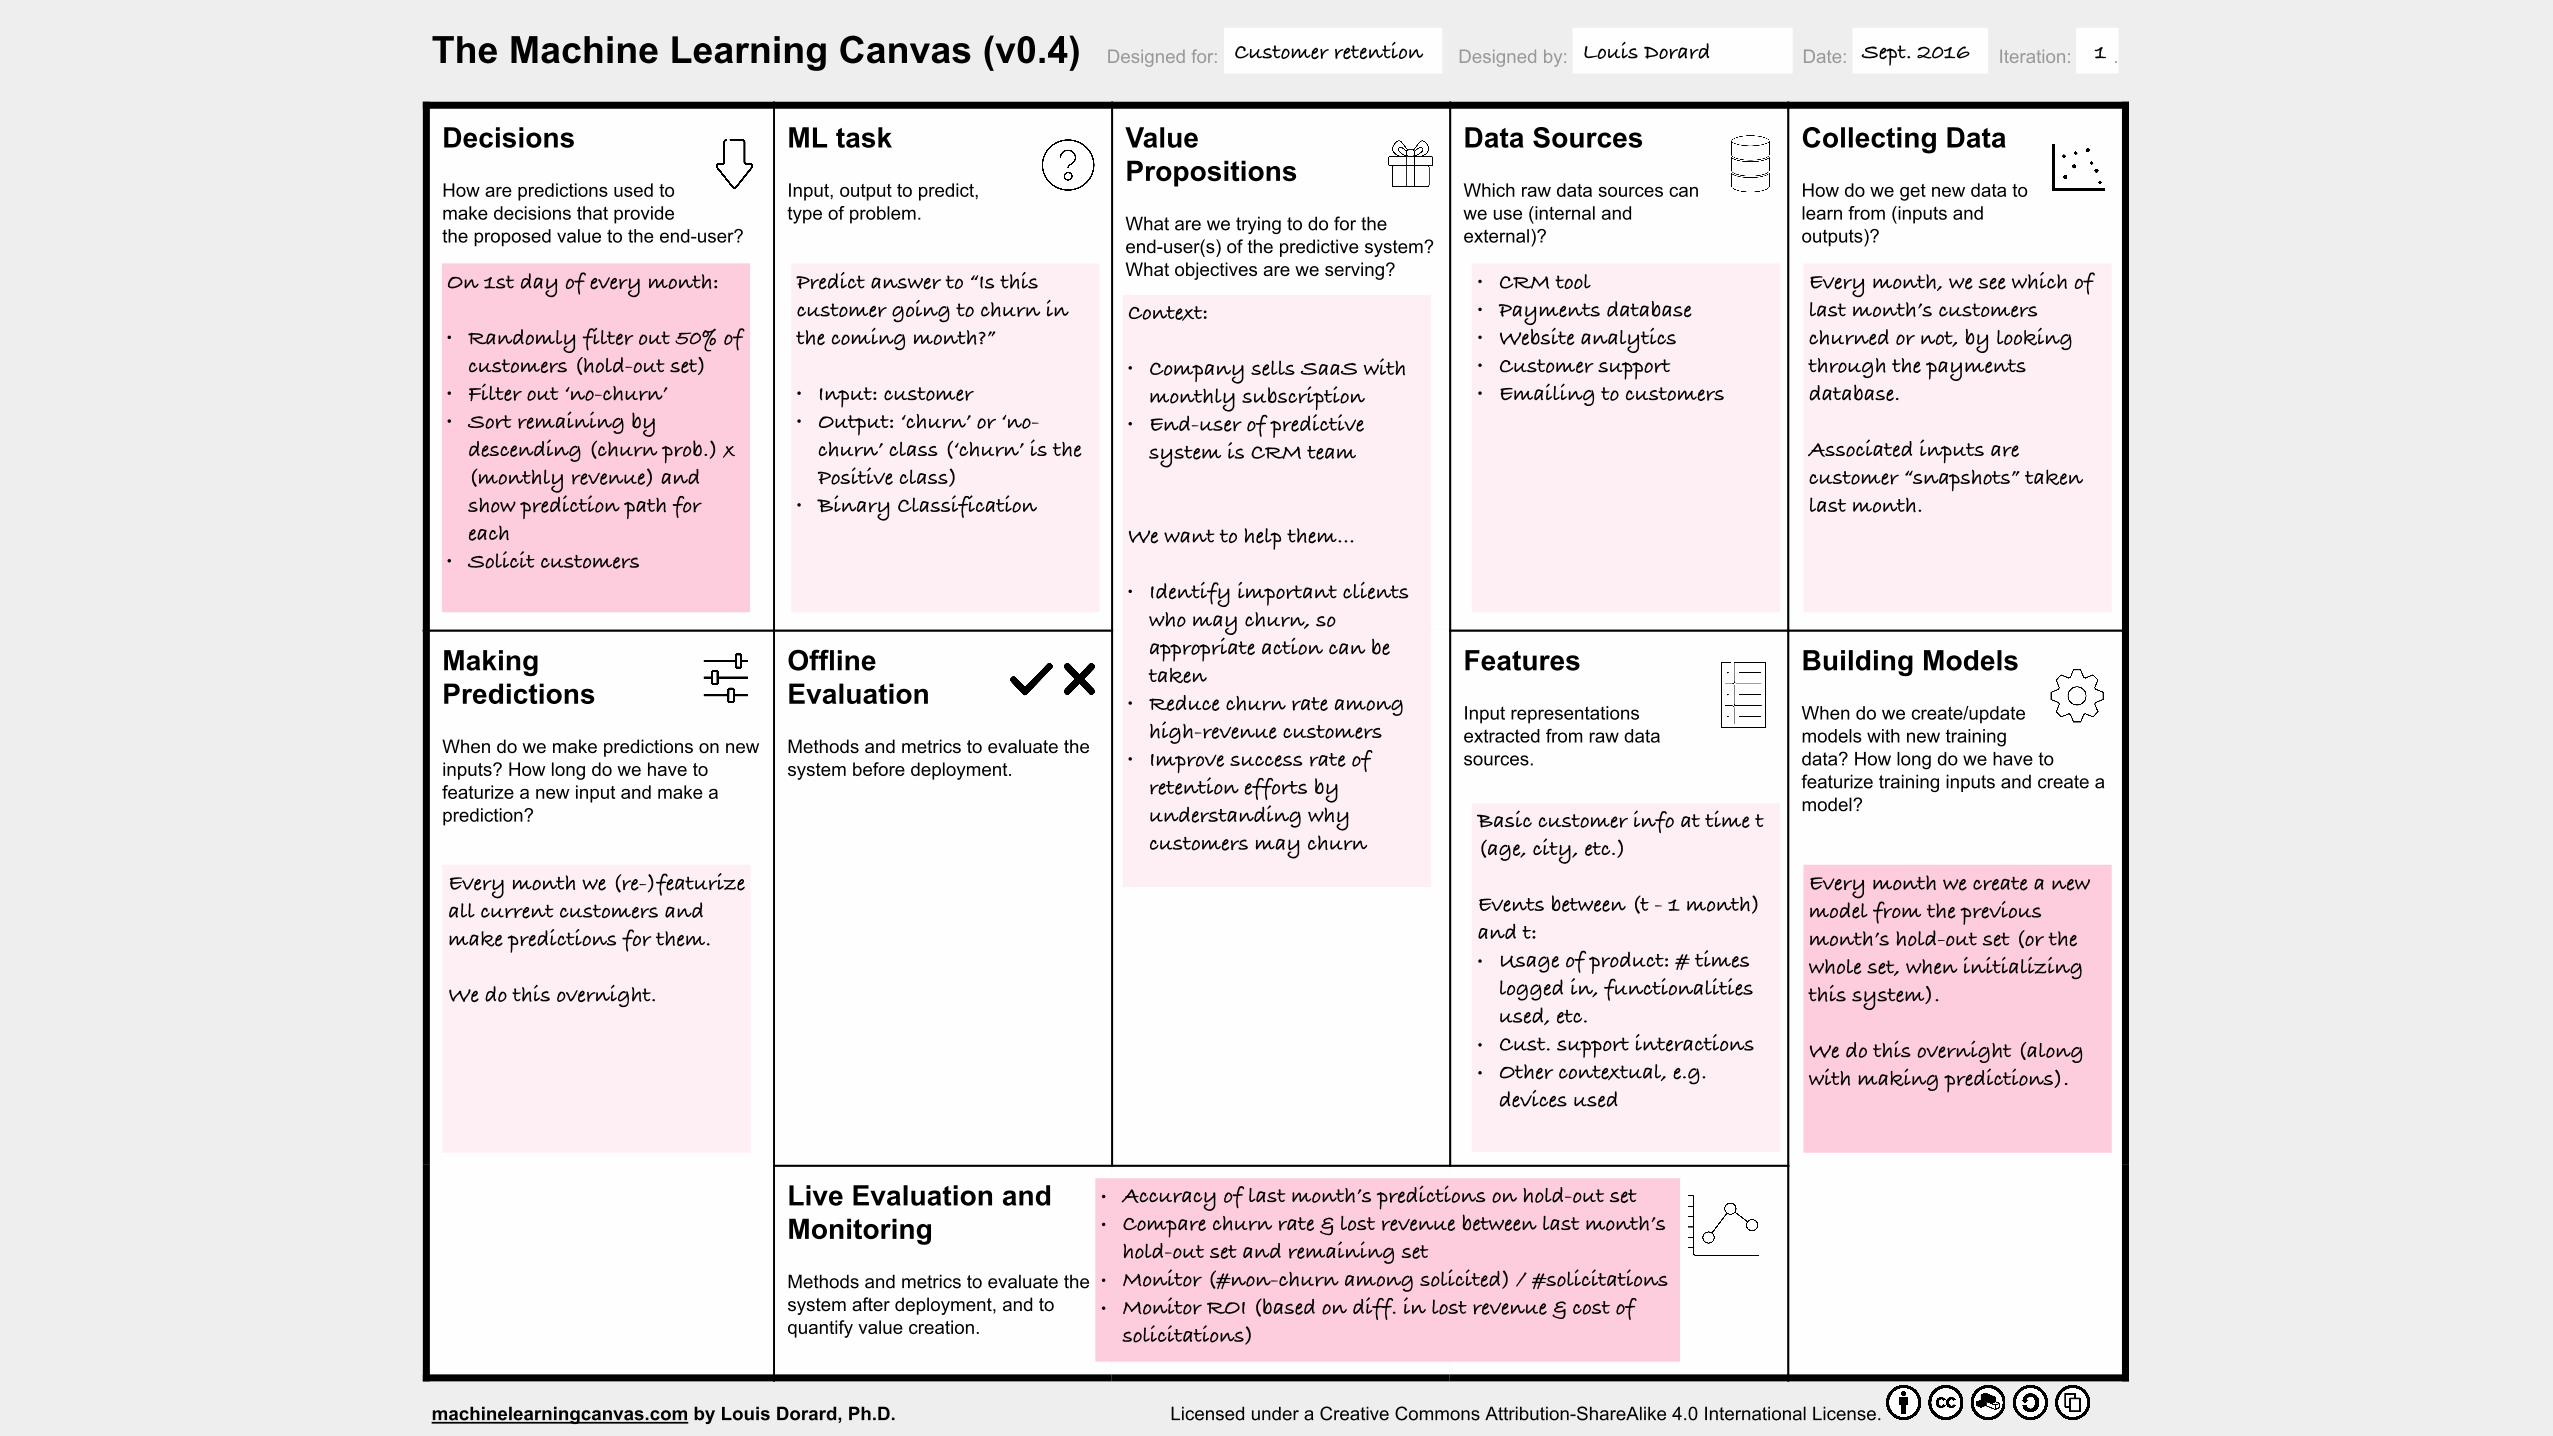
On 1st day of every month:
• Randomly filter out 50% of customers (hold-out set)
• Filter out ‘no-churn’ • Sort remaining by
descending (churn prob.) x (monthly revenue) and show prediction path for each
• Solicit customers
Before soliciting customers:
• Evaluate new model’s accuracy on pre-defined customer profiles
• Simulate decisions taken on last month’s customers (using model learnt from customers 2 months ago). Compute ROI w. different # customers to solicit & hypotheses on retention success rate (is it >0?)
Predict answer to “Is this customer going to churn in the coming month?”
• Input: customer • Output: ‘churn’ or ‘no-
churn’ class (‘churn’ is the Positive class)
• Binary Classification
Context:
• Company sells SaaS with monthly subscription
• End-user of predictive system is CRM team
We want to help them…
• Identify important clients who may churn, so appropriate action can be taken
• Reduce churn rate among high-revenue customers
• Improve success rate of retention efforts by understanding why customers may churn
• CRM tool • Payments database • Website analytics • Customer support • Emailing to customers
Every month, we see which of last month’s customers churned or not, by looking through the payments database.
Associated inputs are customer “snapshots” taken last month.
Every month we (re-)featurize all current customers and make predictions for them.
We do this overnight (along with building the model that powers these predictions and evaluating it).
Basic customer info at time t (age, city, etc.)
Events between (t - 1 month) and t: • Usage of product: # times
logged in, functionalities used, etc.
• Cust. support interactions • Other contextual, e.g.
devices used
Every month we create a new model from the previous month’s hold-out set (or the whole set, when initializing this system).
We do this overnight (along with offline evaluation and making predictions).
• Accuracy of last month’s predictions on hold-out set • Compare churn rate & lost revenue between last month’s
hold-out set and remaining set • Monitor (#non-churn among solicited) / #solicitations • Monitor ROI (based on diff. in lost revenue & cost of
solicitations)
Customer retention Louis Dorard Sept. 2016 1

The Machine Learning Canvas (v0.4) Designed for: Designed by: Date: Iteration: .
Decisions
How are predictions used to
make decisions that provide
the proposed value to the enduser?
ML task
Input, output to predict,
type of problem.
Value
Propositions
What are we trying to do for the
enduser(s) of the predictive system?
What objectives are we serving?
Data Sources
Which raw data sources can
we use (internal and
external)?
Collecting Data
How do we get new data to
learn from (inputs and
outputs)?
Making
Predictions
When do we make predictions on new
inputs? How long do we have to
featurize a new input and make a
prediction?
Offline
Evaluation
Methods and metrics to evaluate the
system before deployment.
Features
Input representations
extracted from raw data
sources.
Building Models
When do we create/update
models with new training
data? How long do we have to
featurize training inputs and create a
model?
Live Evaluation and
Monitoring
Methods and metrics to evaluate the
system after deployment, and to
quantify value creation.
machinelearningcanvas.com by Louis Dorard, Ph.D. Licensed under a Creative Commons AttributionShareAlike 4.0 International License.
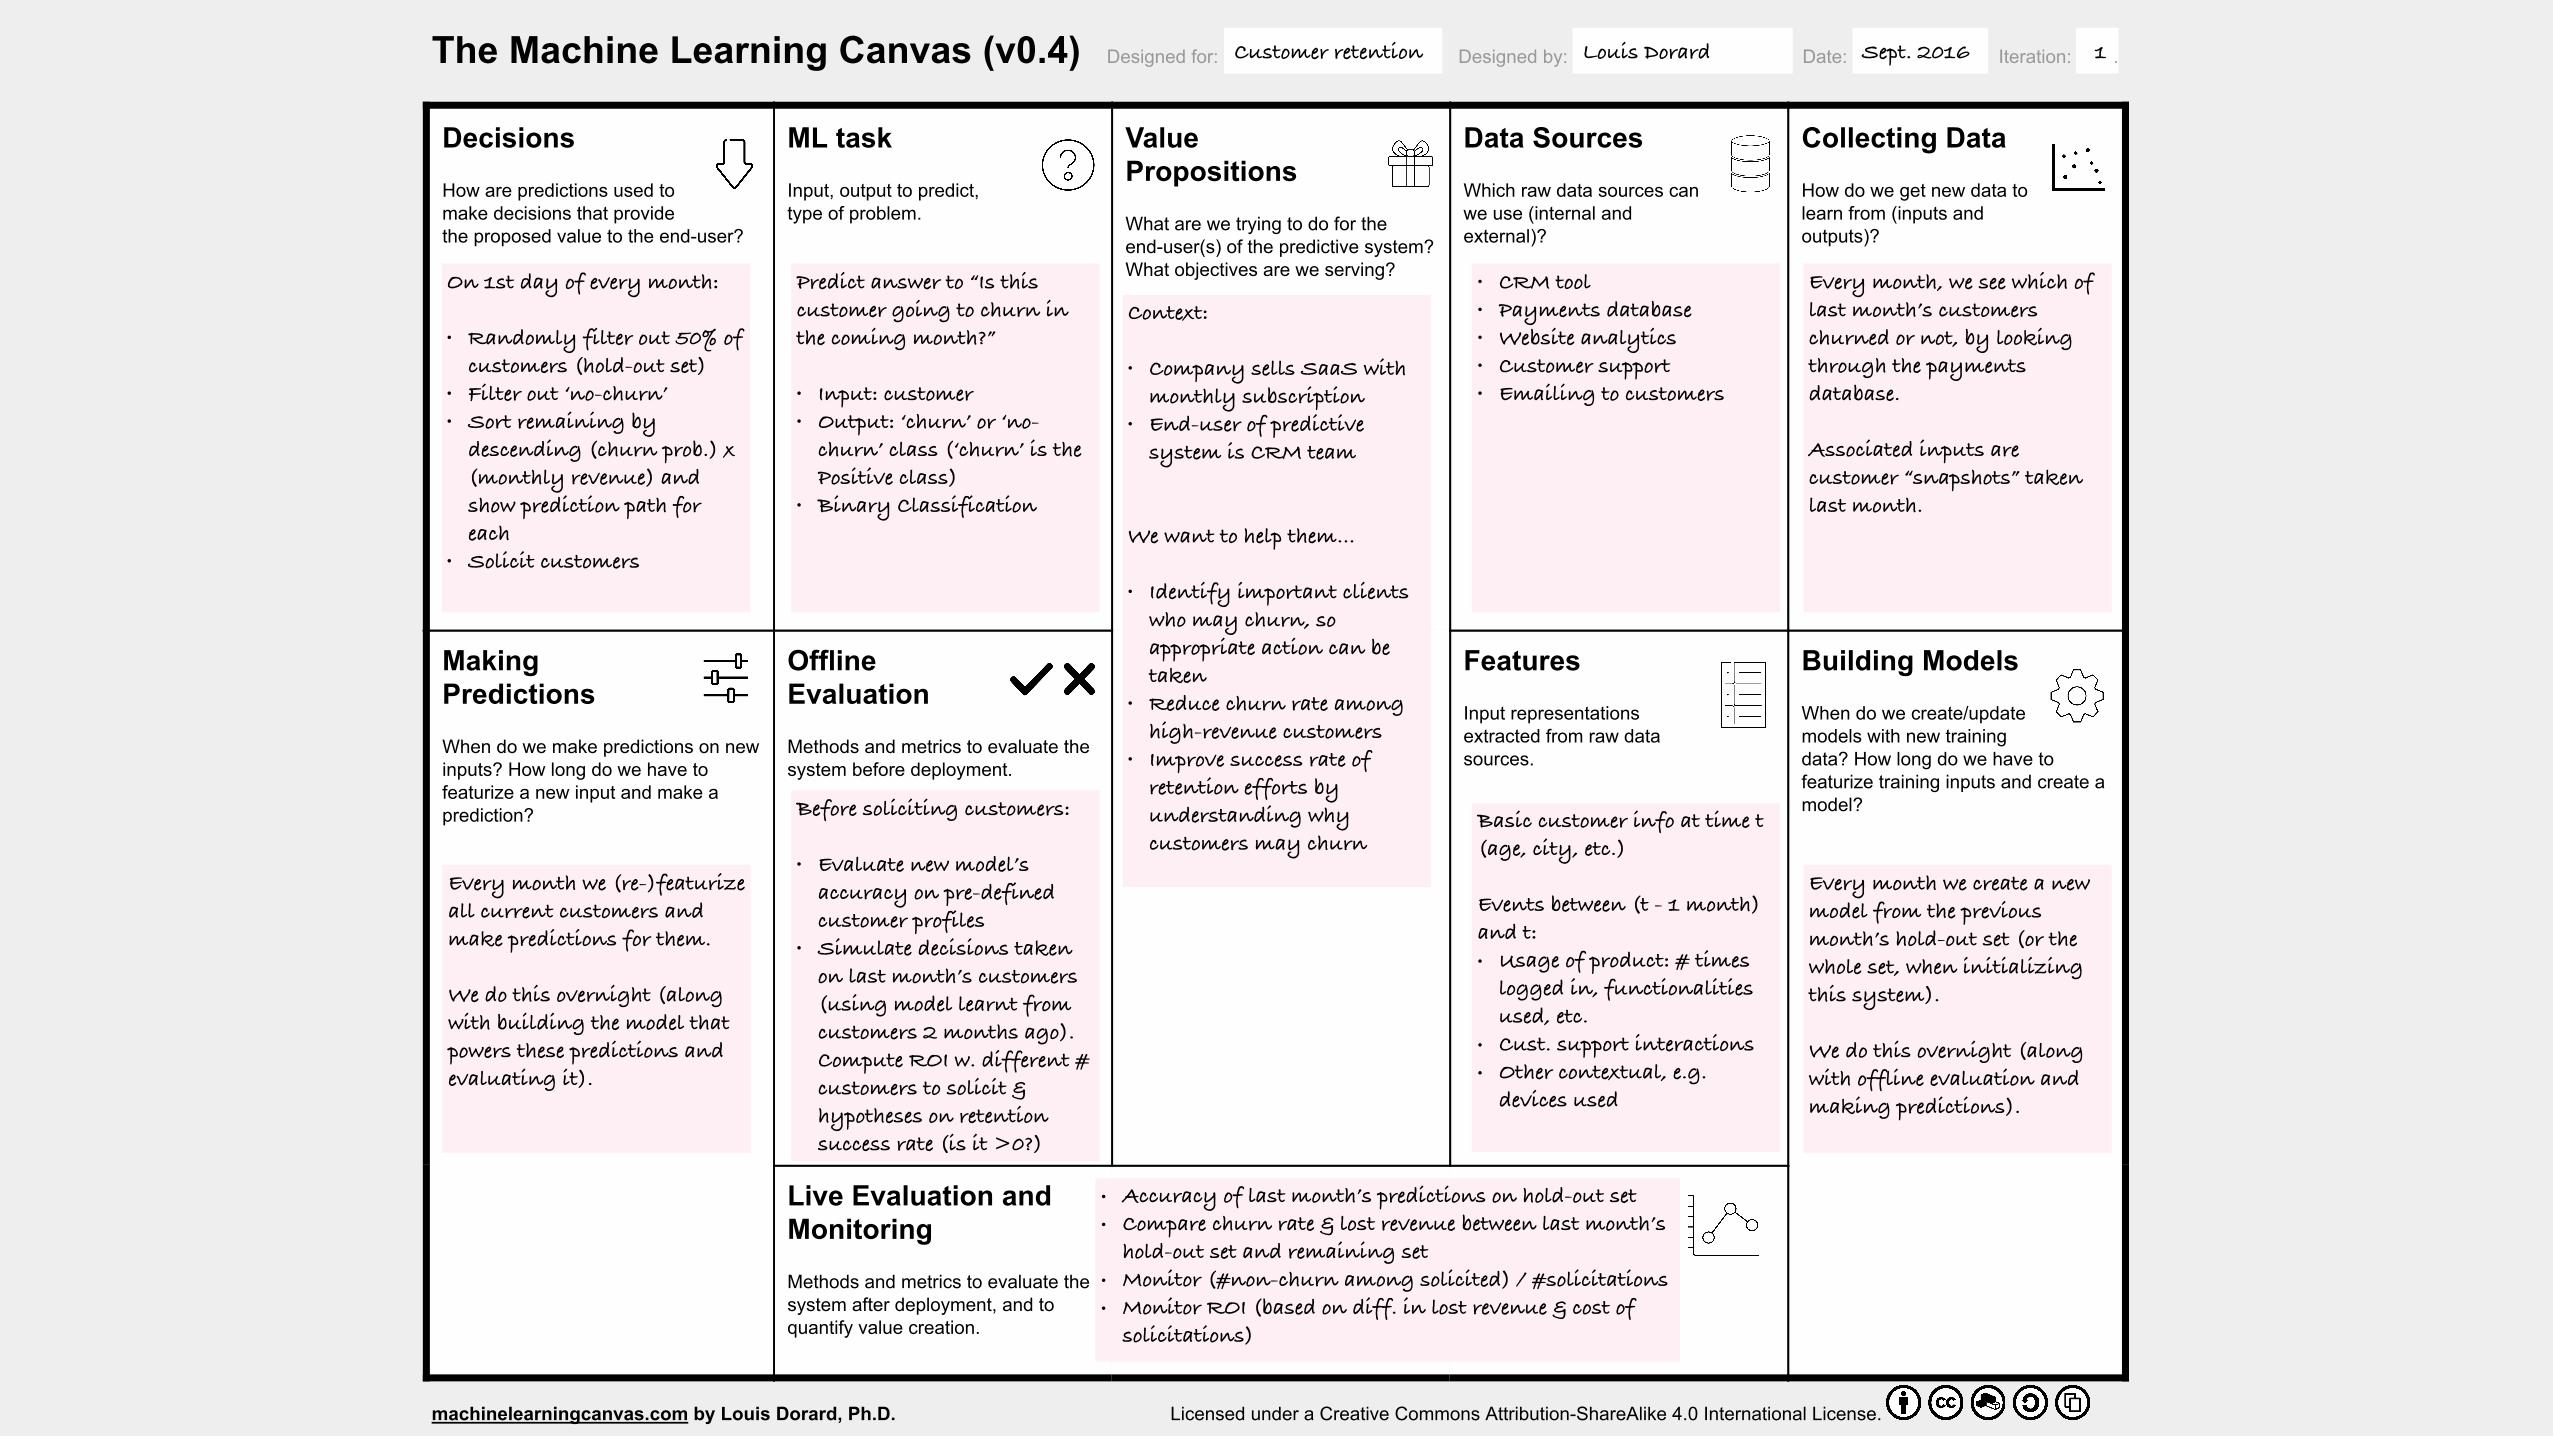
Before soliciting customers:
• Evaluate new model’s accuracy on pre-defined customer profiles
• Simulate decisions taken on last month’s customers (using model learnt from customers 2 months ago). Compute ROI w. different # customers to solicit & hypotheses on retention success rate (is it >0?)
Predict answer to “Is this customer going to churn in the coming month?”
• Input: customer • Output: ‘churn’ or ‘no-
churn’ class (‘churn’ is the Positive class)
• Binary Classification
Context:
• Company sells SaaS with monthly subscription
• End-user of predictive system is CRM team
We want to help them…
• Identify important clients who may churn, so appropriate action can be taken
• Reduce churn rate among high-revenue customers
• Improve success rate of retention efforts by understanding why customers may churn
• CRM tool • Payments database • Website analytics • Customer support • Emailing to customers
Every month, we see which of last month’s customers churned or not, by looking through the payments database.
Associated inputs are customer “snapshots” taken last month.
Every month we (re-)featurize all current customers and make predictions for them.
We do this overnight (along with building the model that powers these predictions and evaluating it).
Basic customer info at time t (age, city, etc.)
Events between (t - 1 month) and t: • Usage of product: # times
logged in, functionalities used, etc.
• Cust. support interactions • Other contextual, e.g.
devices used
Every month we create a new model from the previous month’s hold-out set (or the whole set, when initializing this system).
We do this overnight (along with offline evaluation and making predictions).
• Accuracy of last month’s predictions on hold-out set • Compare churn rate & lost revenue between last month’s
hold-out set and remaining set • Monitor (#non-churn among solicited) / #solicitations • Monitor ROI (based on diff. in lost revenue & cost of
solicitations)
Customer retention Louis Dorard Sept. 2016 1
On 1st day of every month:
• Randomly filter out 50% of customers (hold-out set)
• Filter out ‘no-churn’ • Sort remaining by
descending (churn prob.) x (monthly revenue) and show prediction path for each
• Solicit as many customers as suggested by simulation
• Assist data scientists, software engineers, product and business managers, in aligning their activities
• Make sure all efforts are directed at solving the right problem!
• Choose right algorithm / infrastructure / ML solution prior to implementation
• Guide project management
• machinelearningcanvas.com 45
Why f i l l in ML canvas?


–Jeremy Howard
“Great predictive modeling is an important part of the solution, but it no longer stands on its own; as products become more sophisticated, it
disappears into the plumbing.”

twitter.com/louisdorard

2 Shameless Plugs
Recommended