FRIDAY: Announcements• TODAY ends the 2nd week of this 5
week grading period
• Passing back Quiz #2 today
• Tuesday is Quiz #3
• Thursday is your first UNIT TEST (60%)

Calendar Key Links
• Parent Function Packet answers
• Factoring Packets (Answer Keys)
• All notes for this unit so far
• Quiz Correction Forms (Precalc Tab)

Quiz Corrections• Correct any problems you missed
(except bonus)
• Due on test day!!
• Show all work for the reworked problems. Don’t just give a new answer!
• Graded for accuracy based on– How many were wrong– How many did you fix– How many were correct

Graph: f(x) = 0
Constant
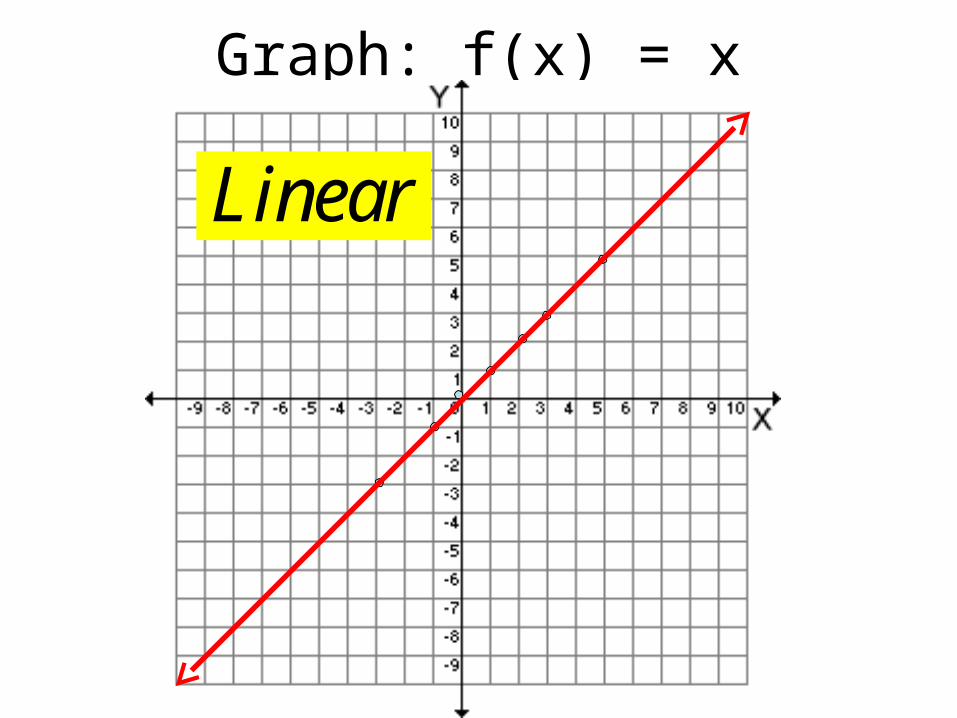
Graph: f(x) = x
Linear
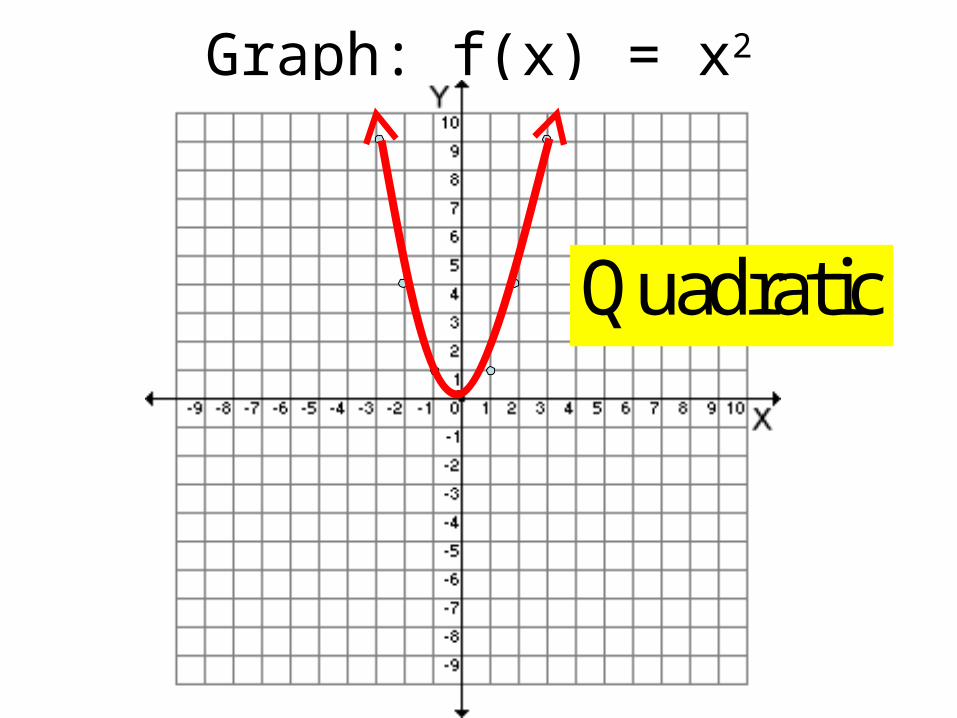
Graph: f(x) = x2
Quadratic
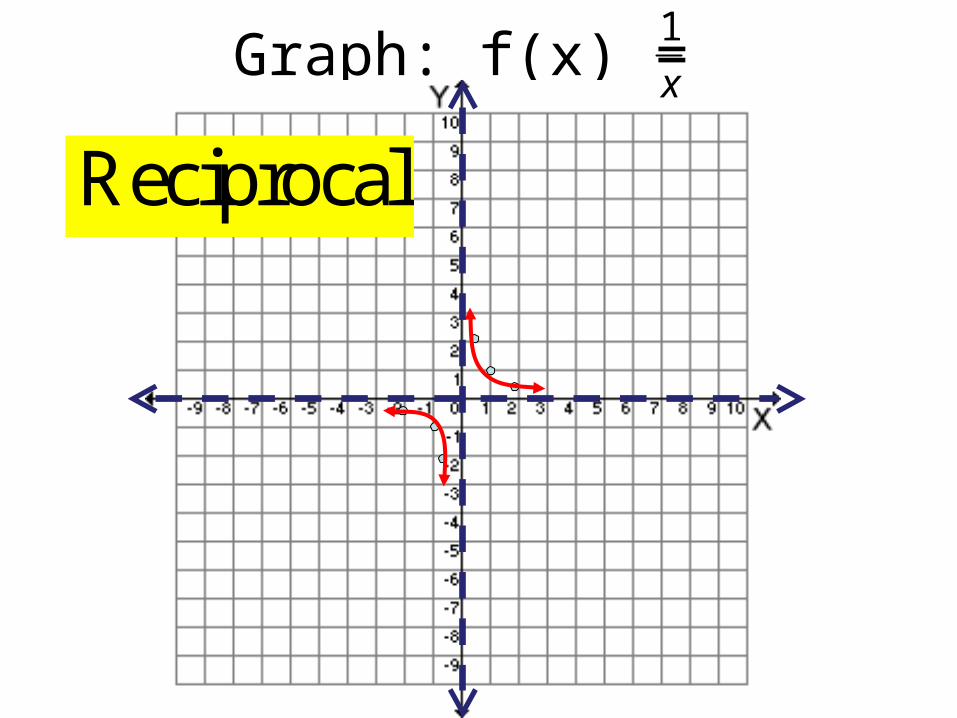
Graph: f(x) = 1
x
Reciprocal

Graph: f(x) = x
Square Root
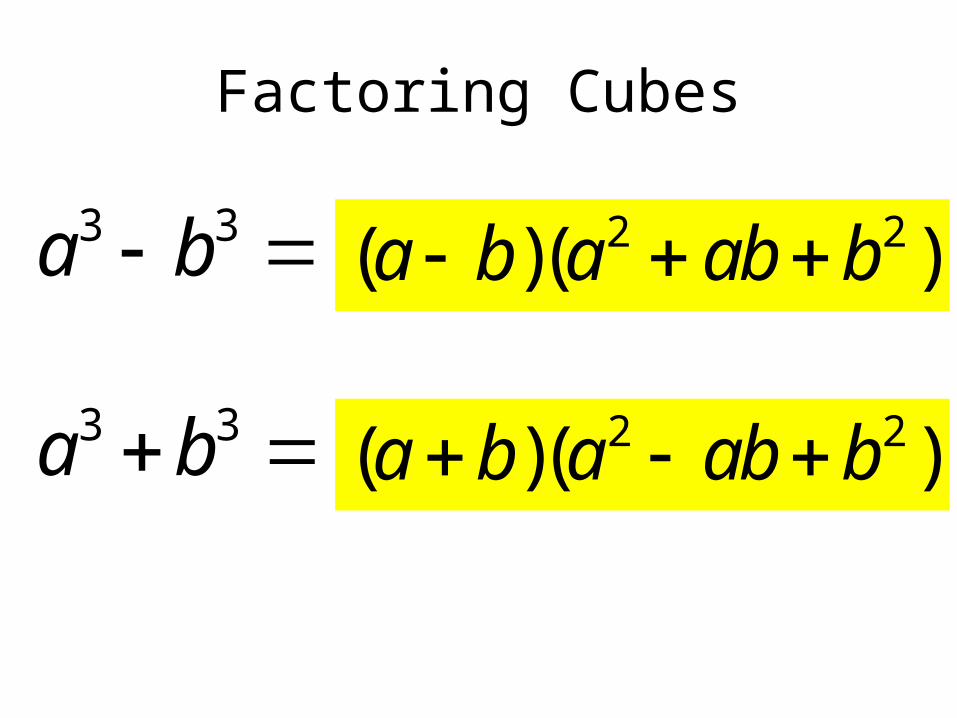
Factoring Cubes
3 3a b 2 2( )( )a b a ab b
3 3a b 2 2( )( )a b a ab b

Greatest Integer Function(GIF)and
Transformations
Copyright © by Houghton Mifflin Company, Inc. All rights reserved.
11
Objectives• I can find functional values of the
Greatest Integer Function (GIF)• I can graph the Greatest Integer
Function• I can identify characteristics of the GIF• I can recognize the order of
transformations

NEW function page
GREATEST INTEGER FUNCTION
(GIF)The greatest integer function is a
piece-wise defined function.
The GIF is like the bill for your cell phone, but in reverse. If you talk for 4 ½ minutes you get charged for 4 minutes.

Copyright © by Houghton Mifflin Company, Inc. All rights reserved.
13
Greatest Integer Function• f(x) = [x] or sometimes f(x) = [[x]]
• This generates the greatest integer less than or equal to the value of x
• Examples: [2.7] = 2
• [-3.6] = -4
• [1/3] = 0

Remembering GIF
• Use a number line!
• ALWAYS round Down
14

Start with a dark circle on the origin. The dark horizontal line is 1 unit long. It has an open circle on the right.
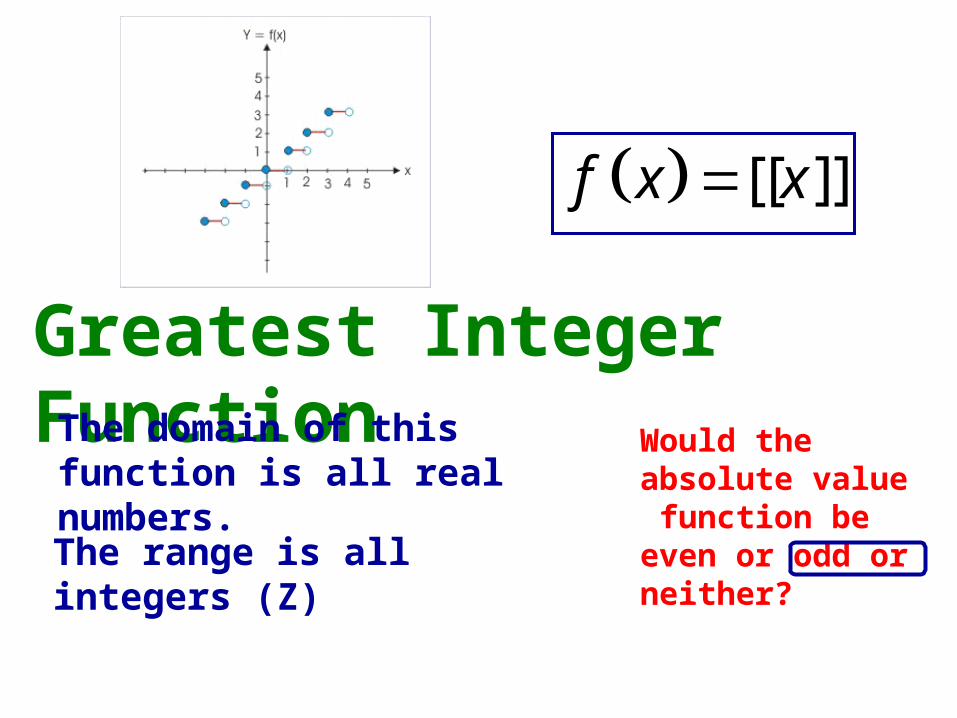
Greatest Integer FunctionThe domain of this function is all real numbers.
The range is all integers (Z)
Would the absolute value function be even or odd or neither?
[[ ]]f x x
Transformations
• Review from Algebra-2
• Types
• - Translations (left, right, up, down)
• - Reflections (x-axis, y-axis)
• - Size Changes (dilations)
17
Copyright © by Houghton Mifflin Company, Inc. All rights reserved.
18
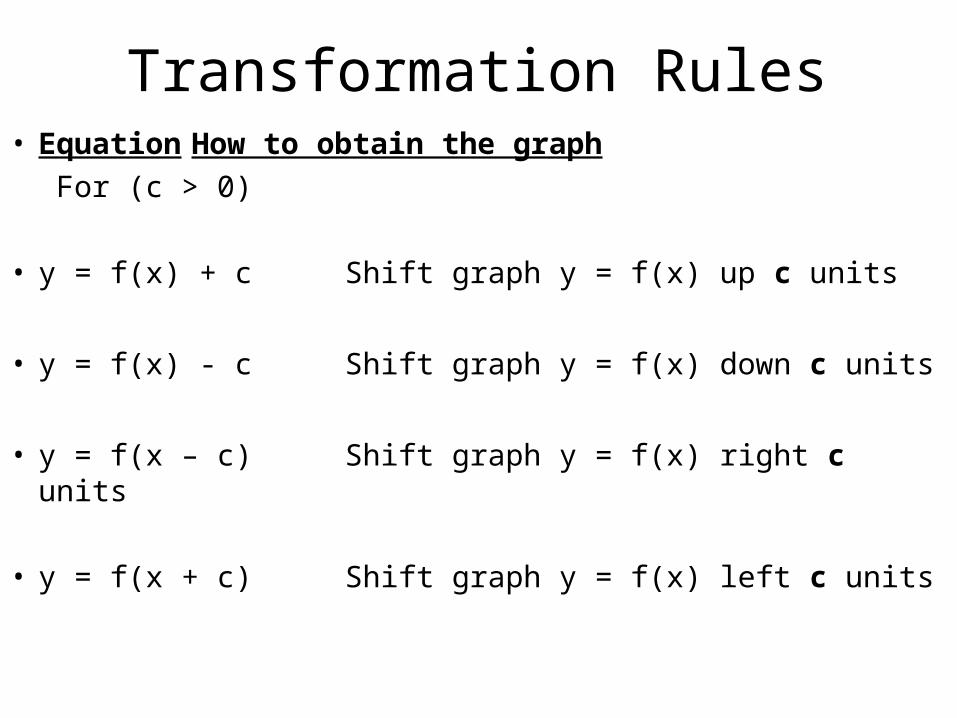
Transformation Rules• Equation How to obtain the graph
For (c > 0)
• y = f(x) + c Shift graph y = f(x) up c units
• y = f(x) - c Shift graph y = f(x) down c units
• y = f(x – c) Shift graph y = f(x) right c units
• y = f(x + c) Shift graph y = f(x) left c units
Copyright © by Houghton Mifflin Company, Inc. All rights reserved.
19
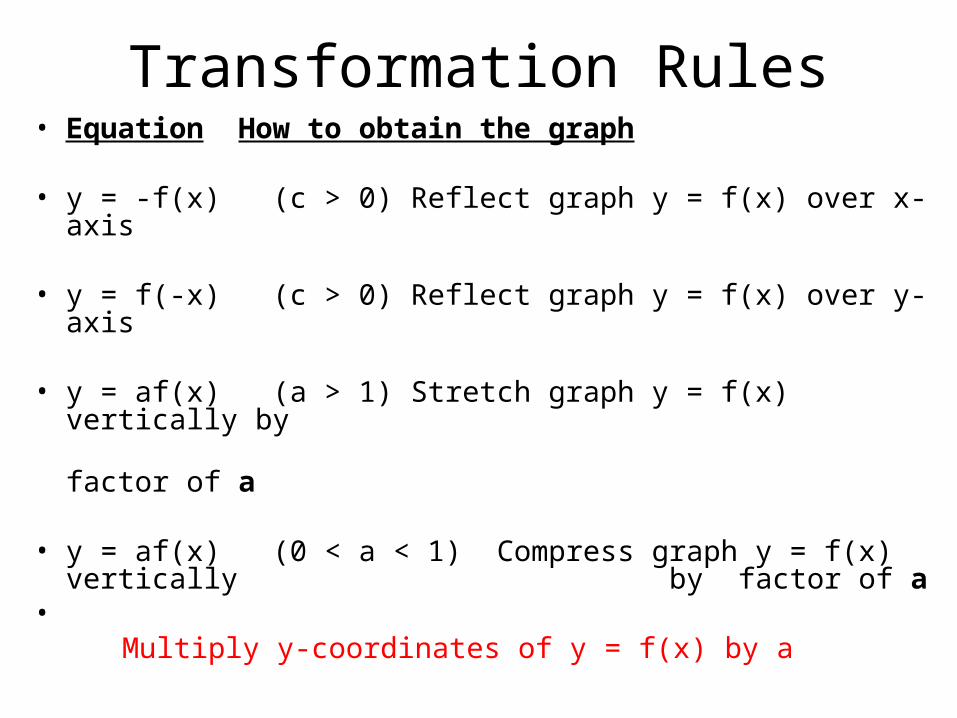
Transformation Rules• Equation How to obtain the graph
• y = -f(x) (c > 0) Reflect graph y = f(x) over x-axis
• y = f(-x) (c > 0) Reflect graph y = f(x) over y-axis
• y = af(x) (a > 1) Stretch graph y = f(x) vertically by
factor of a
• y = af(x) (0 < a < 1) Compress graph y = f(x) vertically by factor of a
• Multiply y-coordinates of y = f(x) by a
Copyright © by Houghton Mifflin Company, Inc. All rights reserved.
20
Translations
• Shifting of a graph vertically and/or horizontally
• Size does not change

Copyright © by Houghton Mifflin Company, Inc. All rights reserved.
21
f (x)
f (x) + c
+c
f (x) – c-c
If c is a positive real number, the graph of f (x) + c is the graph of y = f (x) shifted upward c units.
Vertical Shifts
If c is a positive real number, the graph of f (x) – c is the graph of y = f(x) shifted downward c units.
x
y
Copyright © by Houghton Mifflin Company, Inc. All rights reserved.
22
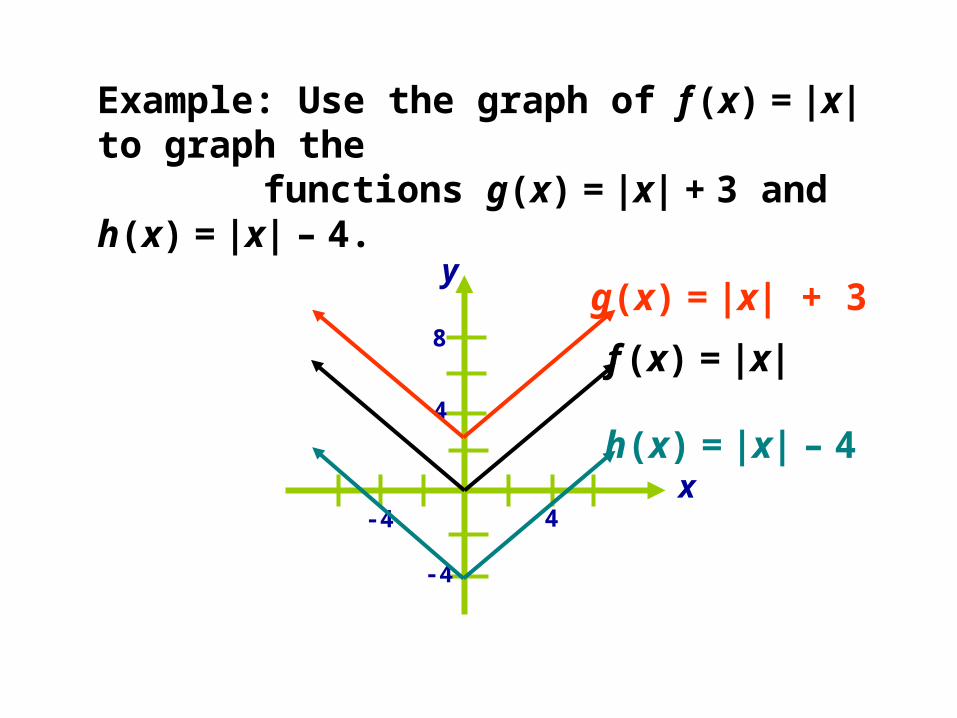
h(x) = |x| – 4
Example: Use the graph of f (x) = |x| to graph the functions g(x) = |x| + 3 and h(x) = |x| – 4.
f (x) = |x|
x
y
-4 4
4
-4
8
g(x) = |x| + 3
Copyright © by Houghton Mifflin Company, Inc. All rights reserved.
23
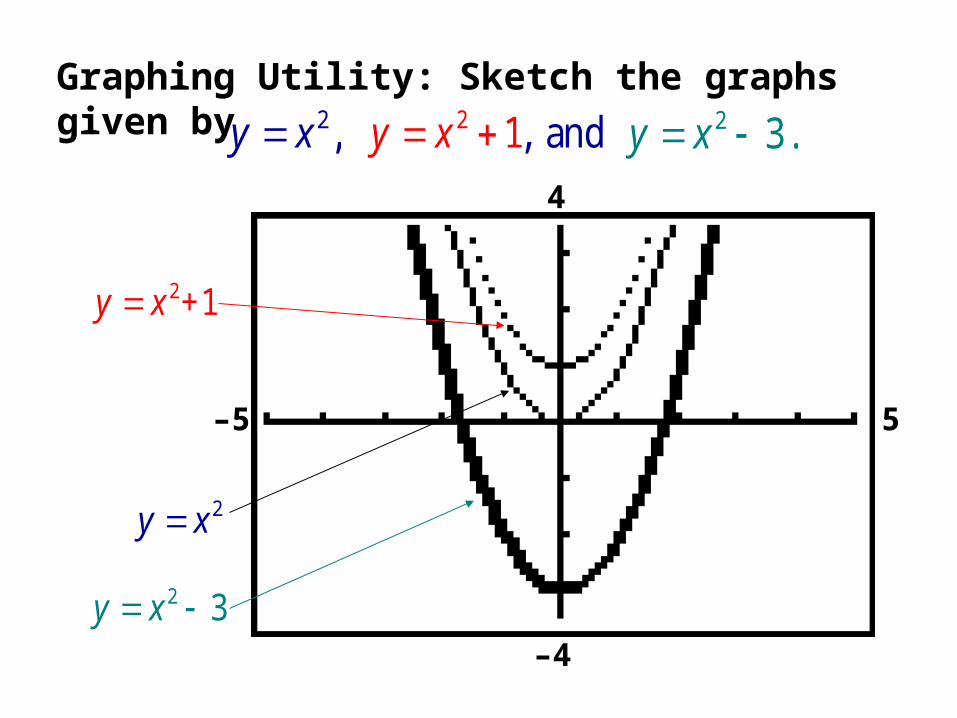
Graphing Utility: Sketch the graphs given by 2,y x 2 1, andy x 2 3.y x
–5 5
4
–4
2+1 y x
2y x
2 3y x
Copyright © by Houghton Mifflin Company, Inc. All rights reserved.
24
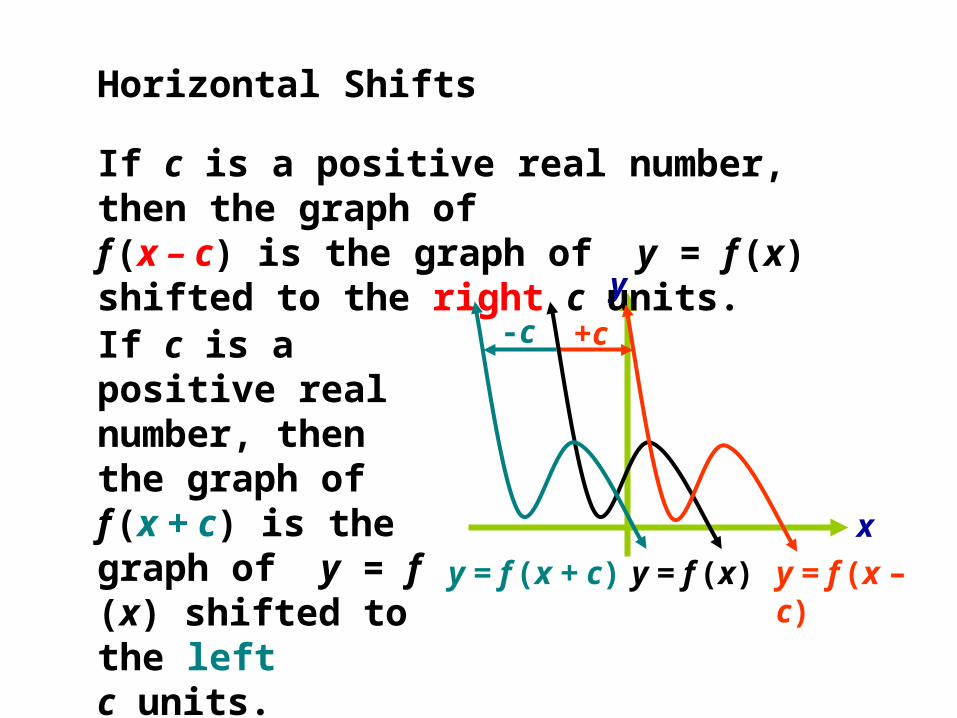
x
y
y = f (x) y = f (x – c)
+c
y = f (x + c)
-c
If c is a positive real number, then the graph of f (x – c) is the graph of y = f (x) shifted to the right c units.
Horizontal Shifts
If c is a positive real number, then the graph of f (x + c) is the graph of y = f
(x) shifted to the left
c units.
Copyright © by Houghton Mifflin Company, Inc. All rights reserved.
25
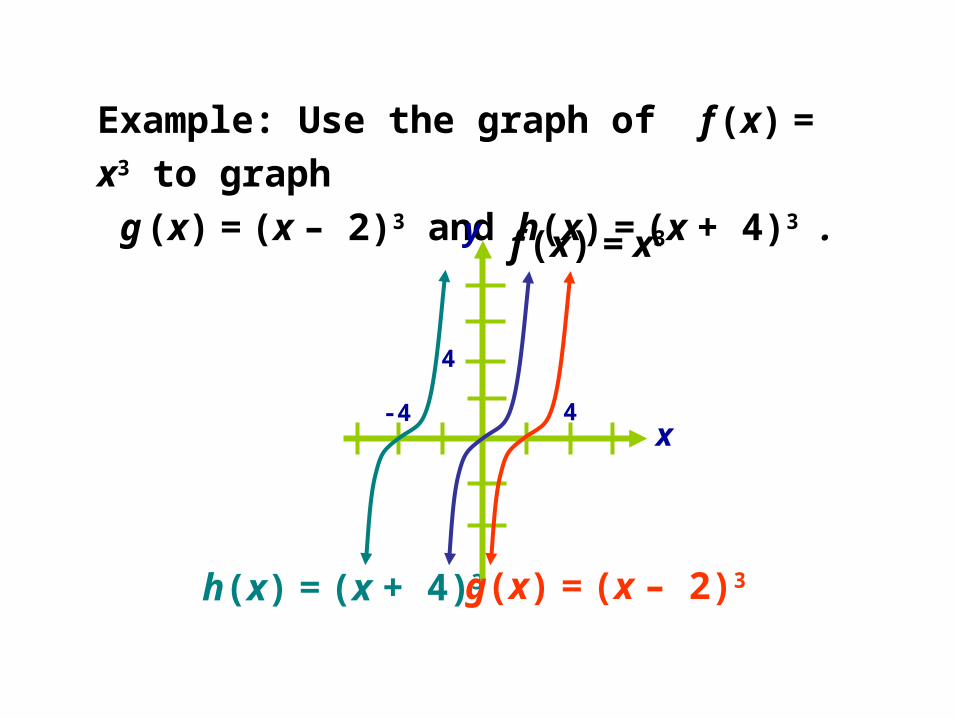
f (x) = x3
h(x) = (x + 4)3
Example: Use the graph of f (x) = x3 to graph
g (x) = (x – 2)3 and h(x) = (x + 4)3 .
x
y
-4 4
4
g(x) = (x – 2)3

Copyright © by Houghton Mifflin Company, Inc. All rights reserved.
26
Graphing Utility: Sketch the graphs given by 2,y x 2( 3) , andy x 2( 1) .y x
–5 6
7
–1
2( 3)y x
2y x
2( 1)y x

Copyright © by Houghton Mifflin Company, Inc. All rights reserved.
27
-4
y
4
x-4
x
y4
Example: Graph the function using the graph of .
First make a vertical shift 4 units downward.
Then a horizontal shift 5 units left.
45 xyxy
(0, 0)(4, 2)
(0, – 4)(4, –2)
xy
4 xy
45 xy
(– 5, –4) (–1, –2)
Copyright © by Houghton Mifflin Company, Inc. All rights reserved.
28
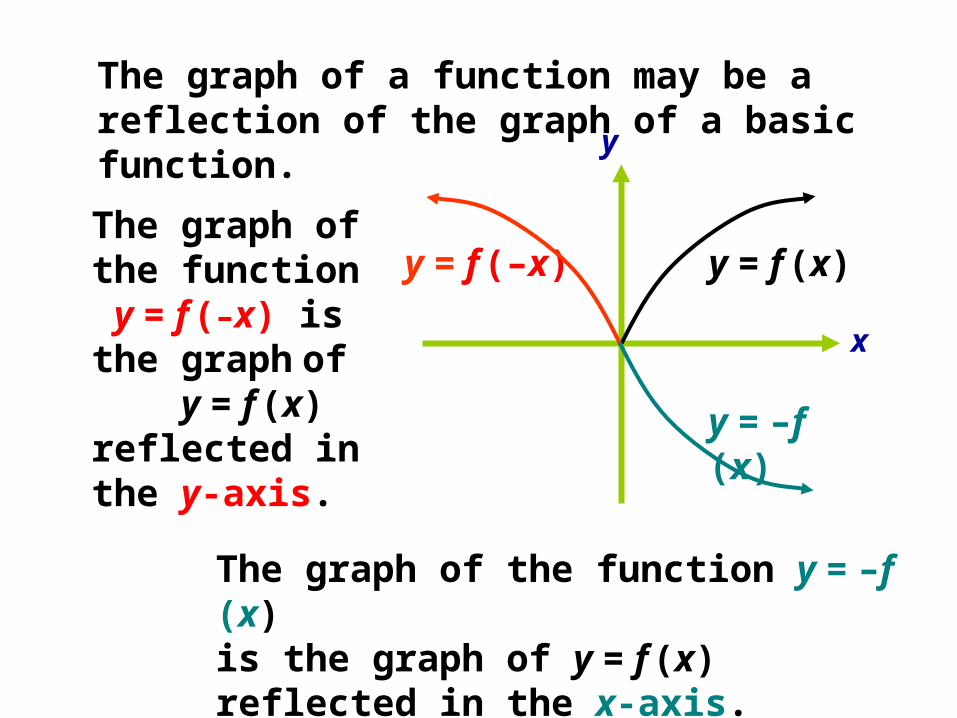
y = f (–x) y = f (x)
y = –f (x)
The graph of a function may be a reflection of the graph of a basic function.
The graph of the function y = f (–
x) is the graph of y = f (x) reflected in the y-axis.
The graph of the function y = –f (x) is the graph of y = f (x) reflected in the x-axis.
x
y

Copyright © by Houghton Mifflin Company, Inc. All rights reserved.
29
The graphs of many functions are transformations of the graphs of very basic functions.
The graph of y = –x2 is the reflection of the graph of y = x2 in the x-axis.
Example: The graph of y = x2 + 3 is the graph of y = x2 shifted upward three units. This is a vertical shift.
x
y
-4 4
4
-4
-8
8
y = –x2
y = x2 + 3
y = x2

Copyright © by Houghton Mifflin Company, Inc. All rights reserved.
30
x
y
4
4y = x2
y = – (x + 3)2
Example: Graph y = –(x + 3)2 using the graph of y = x2.
First reflect the graph in the x-axis.
Then shift the graph three units to the left.
x
y
– 4 4
4
-4
y = – x2
(–3, 0)
Copyright © by Houghton Mifflin Company, Inc. All rights reserved.
31
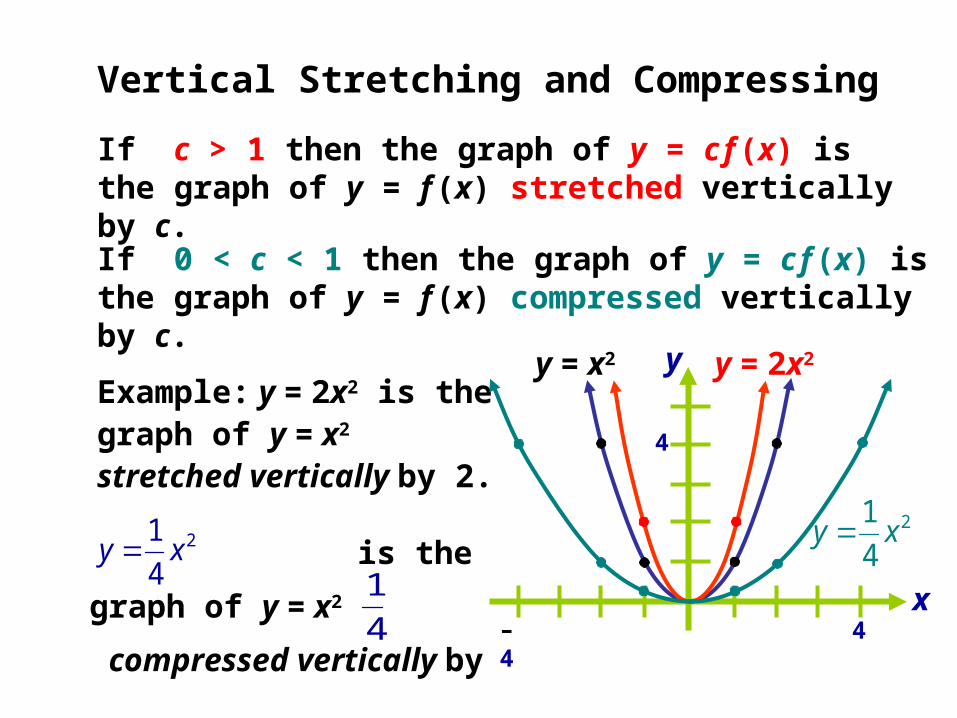
Vertical Stretching and Compressing
If c > 1 then the graph of y = c f (x) is the graph of y = f (x) stretched vertically by c.
If 0 < c < 1 then the graph of y = c f (x) is the graph of y = f (x) compressed vertically by c.
Example: y = 2x2 is the graph of y = x2 stretched vertically by 2.
– 4x
y
4
4
y = x2
is the graph of y = x2
compressed vertically by .
2
4
1xy
4
1
2
4
1xy
y = 2x2
Copyright © by Houghton Mifflin Company, Inc. All rights reserved.
32
- 4x
y
4
4
y = |x|
y = |2x|
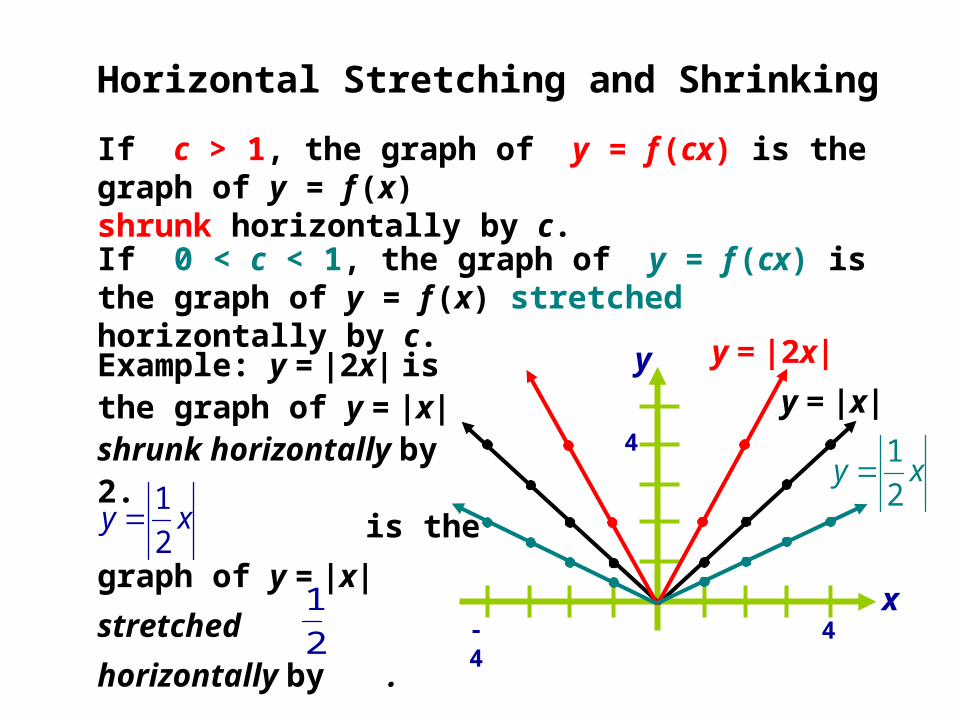
Horizontal Stretching and Shrinking
If c > 1, the graph of y = f (cx) is the graph of y = f (x) shrunk horizontally by c.
If 0 < c < 1, the graph of y = f (cx) is the graph of y = f (x) stretched horizontally by c.
Example: y = |2x| is the graph of y = |x| shrunk horizontally by 2.
xy2
1
is the
graph of y = |x| stretched
horizontally by .
xy2
1
2
1

Copyright © by Houghton Mifflin Company, Inc. All rights reserved.
33
Graphing Utility: Sketch the graphs given by 3,y x 3, d0 an1 y x 3.1
10y x
–5 5
5
–5
310y x
3y x
3110
y x

Copyright © by Houghton Mifflin Company, Inc. All rights reserved.
34
- 4
4
4
8
x
y
Example: Graph using the graph of y = x3.3)1(2
1 3 xy
3)1(2
1 3 xyStep 4:
- 4
4
4
8
x
y
Step 1: y = x3
Step 2: y = (x + 1)3
3)1(2
1 xyStep 3:
Graph y = x3 and do one transformation at a
time.
Copyright © by Houghton Mifflin Company, Inc. All rights reserved.
35
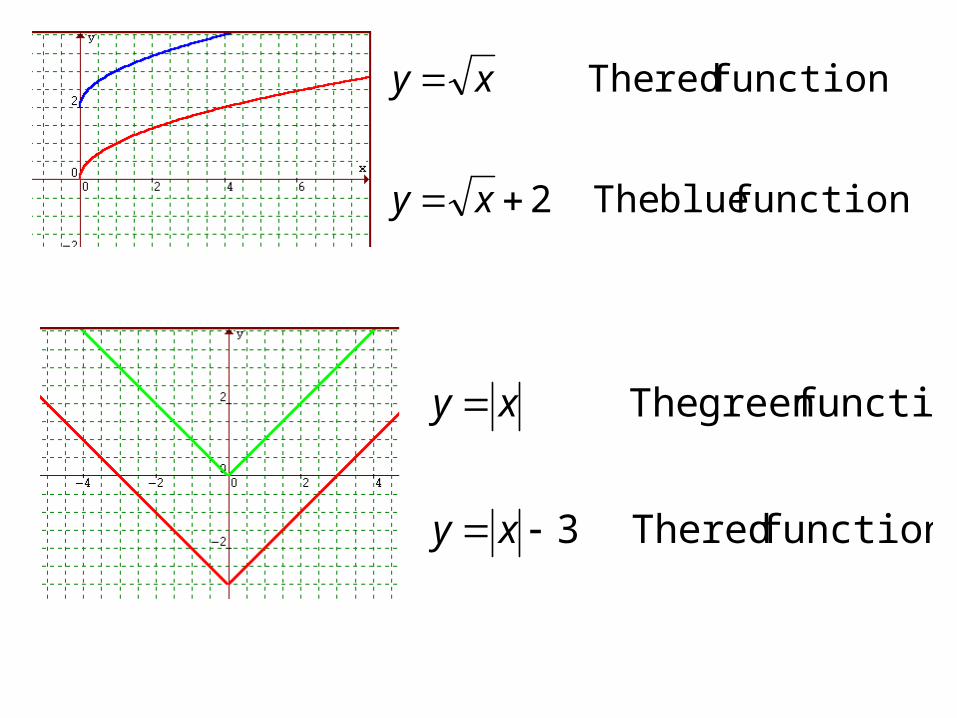
function blue The 2
function red The
xy
xy
function red The 3
functiongreen The
xy
xy
Homework
• WS 1-6
Recommended