Graduate Theses, Dissertations, and Problem Reports
2011
Friction and Leakage Characteristics of Inflatable Structures in Friction and Leakage Characteristics of Inflatable Structures in
Tunnels Tunnels
Joshua J. Sill West Virginia University
Follow this and additional works at: https://researchrepository.wvu.edu/etd
Recommended Citation Recommended Citation Sill, Joshua J., "Friction and Leakage Characteristics of Inflatable Structures in Tunnels" (2011). Graduate Theses, Dissertations, and Problem Reports. 4790. https://researchrepository.wvu.edu/etd/4790
This Thesis is protected by copyright and/or related rights. It has been brought to you by the The Research Repository @ WVU with permission from the rights-holder(s). You are free to use this Thesis in any way that is permitted by the copyright and related rights legislation that applies to your use. For other uses you must obtain permission from the rights-holder(s) directly, unless additional rights are indicated by a Creative Commons license in the record and/ or on the work itself. This Thesis has been accepted for inclusion in WVU Graduate Theses, Dissertations, and Problem Reports collection by an authorized administrator of The Research Repository @ WVU. For more information, please contact [email protected].

i
Friction and Leakage Characteristics of Inflatable Structures in Tunnels
Joshua J. Sill
Thesis submitted to the College of Engineering and Mineral Resources
at West Virginia University in the partial fulfillment of the requirements
for the degree of
Master of Science in
Mechanical Engineering
Kenneth Means, Ph.D., Chair Wade Huebsch, Ph.D. Eduardo Sosa, Ph.D.
Department of Mechanical and Aerospace Engineering
Morgantown, West Virginia 2011
Keywords: friction; leakage; fabrics; inflatables; tunnels; plugs
Copyright 2011 Joshua J. Sill

i
Abstract
Friction and Leakage Characteristics of Inflatable Structures in Tunnels
Joshua J. Sill
Inflatable technology has become a popular alternative for replacing conventional ways of building structures. Inflatable structures offer the benefits of being lightweight and portable while maintaining needed rigidity and reducing production costs. These benefits have prompted the use of inflatables in confined spaces such as pipes and tunnels to act as barriers with minimal infrastructure modification. This work focuses on using these inflatables, or plugs, in transportation subway tunnels as a way to mitigate threats such as floods.
In order to stop the flow of water, the plug must be capable of being pressurized and apply enough pressure on the tunnel walls so that it does not move while being acted upon by an opposing force. A small scale test bed was constructed in which a plug could be inflated inside of a pipe representing a tunnel with one closed end. This closed space between the closed tunnel end and the plug could then be pressurized with water applying an opposing force on the plug trying to push it out of the tunnel. The plug was set at different pressures while the tunnel pressure was raised to the plug pressure until slippage of the plug occurred. This pressure differential between the plug and tunnel was recorded and used to calculate a friction coefficient. Friction coefficients were calculated for three different materials lining the tunnel so a comparison could be made. These friction coefficients were also compared to laboratory friction machine testing of the same lining materials. This comparison showed that the tunnel and plug friction coefficients were much lower than the laboratory friction machine tests.
Rates of water leakage around the plug were also studied. The leakage rates were recorded for several different plug pressures while varying the tunnel pressure accordingly. It was observed that as pressure differential decreased between the plug and tunnel, the leakage rate increased. The leakage rates were also compared to the friction tests and indicated that an increased leakage rate caused a decrease in the friction coefficient. Leakage rates were also scaled and estimated for a larger plug and tunnel diameter.

iii
Acknowledgements
I would like to thank my committee members, Dr. Wade Huebsch and Dr.
Eduardo Sosa, for their help through the course of this project. I would also like to
thank my advisor, Dr. Kenneth Means, for his guidance, leadership, and kind nature
throughout my graduate studies.
The slippage and leakage tests performed for this thesis would have not been
possible without the help of my good friends, Christopher Griffin, Jared Grim, and Perry
(P.J.) Spaur. Thanks to all of you for your help. Also, thanks to Kevin Peil for
performing the friction machine testing.
Thanks to my wonderful girlfriend, Renae, who is always there to help,
encourage, and support me in all that I do. Thank you for everything you do for me. A
special thanks to my great family for always believing and encouraging me to do my
very best in all that I do.

iv
Table of Contents Abstract ........................................................................................................................ ii
Acknowledgements .......................................................................................................iii
List of Figures ............................................................................................................... vi
List of Tables ................................................................................................................ viii
Nomenclature ................................................................................................................. ix
Chapter 1 - Introduction ................................................................................................ 1
1.1 - Inflatable Structures Background ...................................................................... 1
1.2 - Current Research .............................................................................................. 4
1.3 - Objective ........................................................................................................... 6
1.4 - Importance of This Work ................................................................................... 7
Chapter 2 - Test Method ............................................................................................... 8
2.1 - Test Setup......................................................................................................... 8
2.1.1 - Tunnel ...................................................................................................... 10
2.1.2 - Hydraulic System ..................................................................................... 12
2.1.3 - Inflatable Plug .......................................................................................... 15
2.1.4 - Sensor System ........................................................................................ 18
2.2 - Tunnel Linings ................................................................................................. 19
Chapter 3 - Slippage Testing ...................................................................................... 23
3.1 - Introduction ..................................................................................................... 23
3.2 - Friction Tests Using A Friction Testing Machine ............................................. 23
3.3 - Procedure for Slippage Testing ....................................................................... 25
3.4 - Results/Discussion .......................................................................................... 26
Chapter 4 - Leakage Testing ...................................................................................... 53
4.1 - Introduction ..................................................................................................... 53

v
4.2 - Procedure ....................................................................................................... 53
4.3 - Results/Discussion .......................................................................................... 56
Chapter 5 - Error Analysis .......................................................................................... 64
5.1 - Introduction ..................................................................................................... 64
5.2 - Leakage Error ................................................................................................. 64
5.3 - Slippage Error ................................................................................................. 65
Chapter 6 - Conclusions and Future Work .................................................................. 68
6.1 - Leakage Testing Conclusions ......................................................................... 68
6.2 - Slippage Testing Conclusions ......................................................................... 68
6.3 - Future Work .................................................................................................... 69
References .................................................................................................................... 71
Appendix A - Pressure Transducer Documentation ...................................................... 74
Appendix B - Scale Documentation ............................................................................... 75
Appendix C - Pump Curve Documentation .................................................................... 76
Appendix D - Neoprene Specifications .......................................................................... 77
Appendix E - Slippage Data .......................................................................................... 78

vi
List of Figures
Figure 1-1 Lindstrand tunnel plug system (15) ................................................................ 3
Figure 1-2 Proof of concept testing at WMATA (19) ........................................................ 5
Figure 2-1 Schematic of test bed .................................................................................... 9
Figure 2-2 Cross-section of tunnel and plug setup .......................................................... 9
Figure 2-3 Tunnel dimensions and connections ........................................................... 11
Figure 2-4 Rear tunnel connections .............................................................................. 11
Figure 2-5 3000 gallon water supply with outlet hoses to pumps .................................. 13
Figure 2-6 Pump system for filling and pressurization ................................................... 14
Figure 2-7 Plug dimensions ........................................................................................... 15
Figure 2-8 Plug model showing ports ............................................................................ 16
Figure 2-9 Plug inflation outside of tunnel ..................................................................... 17
Figure 2-10 Plug inflated inside the tunnel with low pressure air ................................... 17
Figure 2-11 LabVIEW data collection program .............................................................. 18
Figure 2-12 Example of neoprene tunnel lining ............................................................. 20
Figure 2-13 Detailed view of tunnel linings: (A) Concrete, (B) Neoprene, and (C) Vinyl 22
Figure 3-1 Friction testing machine used in previous friction testing (20) ...................... 24
Figure 3-2 Wet friction machine test setup (20) ............................................................. 25
Figure 3-3 Example of slippage point for at 20 psi plug pressure .................................. 30
Figure 3-4 Example of slippage point location compared to the plug displacement ...... 30
Figure 3-5 Slippage point for 10 psi plug pressure with concrete lining ........................ 31
Figure 3-6 Concrete, 5 psi plug pressure ...................................................................... 32
Figure 3-7 Concrete, 10 psi plug pressure .................................................................... 33

vii
Figure 3-8 Concrete, 15 psi plug pressure .................................................................... 33
Figure 3-9 Concrete, 20 psi plug pressure .................................................................... 34
Figure 3-10 Concrete, 25 psi plug pressure .................................................................. 34
Figure 3-11 Neoprene, 5 psi plug pressure ................................................................... 35
Figure 3-12 Neoprene, 10 psi plug pressure ................................................................. 35
Figure 3-13 Neoprene, 15 psi plug pressure ................................................................. 36
Figure 3-14 Neoprene, 20 psi plug pressure ................................................................. 36
Figure 3-15 Neoprene, 25 psi plug pressure ................................................................. 37
Figure 3-16 Vinyl, 5 psi plug pressure ........................................................................... 37
Figure 3-17 Vinyl, 10 psi plug pressure ......................................................................... 38
Figure 3-18 Vinyl, 15 psi plug pressure ......................................................................... 38
Figure 3-19 Vinyl, 20 psi plug pressure ......................................................................... 39
Figure 3-20 Plug pressure vs pressure differential ........................................................ 40
Figure 3-21 Force balance and dimensions of tunnel and plug ..................................... 41
Figure 3-22 Hydrostatic pressure distribution on the plug ............................................. 42
Figure 3-23 Plug pressure vs. tunnel pressure for each tunnel lining ............................ 48
Figure 3-24 Leakage rate vs. friction coefficient ............................................................ 50
Figure 3-25 Plug pressure sensitivity ............................................................................ 51
Figure 4-1 Pressure differential vs. leakage rate for concrete ....................................... 58
Figure 4-2 Pressure differential vs. leakage rate for neoprene ...................................... 58
Figure 4-3 Pressure differential vs. leakage rate for vinyl .............................................. 59
Figure 4-4 Tunnel pressure vs. leakage rate for concrete lining .................................... 60
Figure 4-5 Leakage rates from 4ft and 16ft tunnels at a plug pressure of 20 psi ........... 62

viii
List of Tables
Table 3-1 Desired and actual plug pressure error ......................................................... 27
Table 3-2 Slippage data for different tunnel linings ....................................................... 28
Table 3-3 Friction coefficients for different tunnel linings............................................... 47
Table 3-4 Comparison of friction values for different testing methods ........................... 49
Table 3-5 Relationship between friction coefficient and leakage rate ............................ 50
Table 4-1 Example leakage collection sheet ................................................................. 54
Table 4-2 Leakage rate test results ............................................................................... 57
Table 4-3 Estimated leakage rates for a 16 ft diameter tunnel ...................................... 63
Table 5-1 Leakage errors for each tunnel lining ............................................................ 65
Table 5-2 Friction coefficient error for each tunnel lining ............................................... 66

ix
Nomenclature
gpm gallons per minute
psi pounds per square inch
psig pounds per square inch gauge
psf pounds per square foot
f friction coefficient
𝐹������ total force applied on the tunnel, lbs
𝐹���� total force applied on the plug, lbs
𝑃������ total tunnel pressure, psi
𝑃���� total plug pressure, psi
F force, lbs
P pressure, psi
𝐴� area of tunnel cross-section, 𝑓𝑡�
𝛾 specific gravity of water, ������
h height, ft
r radius, ft
L cylindrical part of plug length that is in contact with tunnel walls, ft
ℎ� vertical depth of the centroid of object which the pressure is acting upon, ft
𝐷� diameter of tunnel, ft
𝐹�� force from the hydrostatic pressure acting on the tunnel, lbs
𝐹�� force from the hydrostatic pressure acting on the plug, lbs
𝑃�� hydrostatic pressure from the water in the tunnel, psi
𝑃�� hydrostatic pressure from the water in the plug, psi
𝐹��� force from pressure applied by the pumps on the tunnel, lbs

x
𝐹��� force from pressure applied by the pumps on the plug, lbs
𝑃��� pressure applied by the pumps on the tunnel, psi
𝑃��� pressure applied by the pumps on the plug, psi
W weight, lbs
T Time, seconds
VDC volts direct current

1
Chapter 1 - Introduction
1.1 - Inflatable Structures Background
For many years inflatable structures have continued to gain popularity throughout
the world. Space exploration prompted much of the research in this area starting in the
early 1970's with companies beginning to design and test inflatable space structural
systems (1) (2). This research has continued and now offers many inflatable structures
that can be seen in a wide variety of industries. Space exploration still plays a large role
in the development of inflatable designs with examples such as flexible containment
covers for the Hubble Telescope and impact landing airbag systems for the Mars
Exploration missions (3). Military applications include items such as lightweight portable
buildings and tents that act as barriers against chemical and biological agents (4) (5).
More recognizable examples include airships (6) and even the roofs of stadiums and
buildings such as the Metrodome (7) and Carrier Dome (8).
Inflatable structures used as plugs are also being used in the repair of pipe
systems. Even though this technique has been evolving since the early 1920's with
patents dating as early as 1949 (9), recent technology improvements have allowed
significant product innovations to make it far more effective and successful (10). In the
past many methods have been used to prevent the flow of substances in confined
spaces. Traditional ways most commonly include the use of valves in pipes or the use
of flood gates in tunnels and waterways. Other methods, such as injecting concrete or
grouts into pipes, have been used to seal sections which have failed. These permanent
seals then require the flow to be permanently rerouted.

2
An example of a situation in which inflatable plugs could have been useful is in
the Great Chicago Flood of 1992. In this event, a breach in a freight tunnel connected
to over 100 buildings caused the river to flood into city building basements. The tunnels
were originally designed to transport goods to different buildings to relieve traffic
congestion but were later used for running fiber optic cables. The water caused the city
to be shut down and the Chicago Loop was declared a federal emergency. Engineers
were tasked with the cleanup and removal of water and then installed permanent plugs
to prevent any future disaster (11).
By using inflatable structures, one or more plugs can be inserted into pipes and
then inflated to seal off certain sections so that repairs can be performed (12). Once
repairs are finished, the plugs can be deflated and removed so the pipe can resume
normal operation. This method is common when fixing sewage pipes that have
deteriorated or been damaged. This technique is also used in many production plant
environments where fluid systems must be repaired but the entire system cannot be
shut down. In special cases the plugs can even be filled with a variety of different
liquids. For example, when a diesel line must be repaired, the plug can be filled with
diesel so if the plug does leak, the lines are not contaminated with a foreign substance
(13).
Breakthroughs in material strengths and manufacturing methods also allow
inflatable plugs to be applied in much larger scales to seal tunnels in the event of an
accident. Underground mines, subway tunnels, and automobile tunnels are a few
examples of large scale situations where accidents can occur. These large plugs can
be used to block smoke, fire, and water.

3
Lindstrand Technologies has developed inflatable tunnel plugs for use in the
London Underground Victoria Line subway system. In 1987 a disastrous fire engulfed
an old wooden escalator at the King's Cross underground station killing thirty one
people (14). In order to help prevent another disaster, the Lindstrand tunnel plugs are
installed at pre-positioned 100 meter intervals and inflated by remote control when
needed. These plugs seal the tunnel thus cutting off the flow of oxygen that a fire needs
to burn. They also inhibit the spread of smoke and other harmful agents in the air (15).
An example of the plugs developed by Lindstrand is shown in Figure 1-1.
Figure 1-1 Lindstrand tunnel plug system (15)
Petersen, which has extensive knowledge with pipe plugs, has recently
performed some very large operations to stop mine flooding. In 2008, the Cigar Lake
Uranium Mine in Canada developed a large leak which stopped work. A plug that was
seven meters (23 feet) in diameter was constructed and placed in the tunnel using a

4
remote operated vehicle. The plug was then filled first with water to check position and
then with grout to form a permanent seal to stop the leak (16).
These inflatable plugs have several advantages over other methods. Minimal
infrastructure modification is necessary in order to install and deploy the plugs. They
can be installed quickly and can function independently of other systems. Comparable
structures to the plugs such as a flood gate or other system require extensive
modifications that could take years to install. Inflatable structures also offer the
advantage of being lightweight when compared to equivalent structures made from
other materials. This aids in the ease of transportation and also lowers manufacturing
costs. Since the material is pliable, plugs can be folded into compact packages and
inserted into very small openings and then inflated to fill large spaces. These
advantages are making inflatable structures a popular and ingenious alternative to
protect underground transportation infrastructure.
1.2 - Current Research
Currently, West Virginia University (WVU) is doing research in the area of
inflatable structures which is focused on tunnel plugs. Several organizations are
involved in the Resilient Tunnel Project (RTP) to help create a tunnel plug that is
capable of blocking underground transportation tunnels in case of a disaster. This
project aims to address post-9/11 concerns that terrorists will target vulnerable tunnels
causing catastrophic damages (17). The plug(s) could be installed at key points in
tunnels and deployed in the event of flooding, fire, smoke or other disaster (18) .

5
The RTP has conducted several phases of testing, the first being a full scale
proof of concept test demonstrated in the Washington Metropolitan Area Transit
Authority (WMATA) tunnel system (18). This test is shown in Figure 1-2.
Figure 1-2 Proof of concept testing at WMATA (19)
These full scale low pressure air tests were then followed by one-quarter scale
testing with high pressures using water. The small scale testing was performed with
water filling both the plug and also pressurizing a space behind the plug to see if it could
withstand the applied pressure. By applying pressure behind the plug, friction
coefficients and leakage rates were obtained to further enhance plug design and
optimization.

6
Materials testing of the fabric used to manufacture the tunnel plugs was also
conducted. Since it may be necessary for the plugs to be inflated for extended periods
of time, the long term loading properties of the material were studied so they could be
better understood. Some aspects that were studied were the prediction of creep failure
times given an applied stress in the fabric and also quasi-static testing to provide the
ultimate strength and Young's modulus (20). A laboratory method of studying fabric
friction was also introduced with minor modifications to the standard ASTM D1894 (21).
This method used a friction testing machine to obtain the friction coefficient between
fabric and different surfaces using small samples of fabric (20)(22).
1.3 - Objective
The main objective of this thesis is to determine an experimental friction
coefficient between an inflatable plug and a tunnel surface lined with different materials
using water as the inflation medium. This is determined by finding the pressure
differential at which the plug slips when acted upon by a longitudinal opposing head
pressure that is applied behind the plug. This friction coefficient from the plug-tunnel
tests can then be compared to laboratory friction tests performed on plug material with a
friction testing machine.
A secondary objective includes measuring the leakage rate of water flowing
around the plug when it is pressurized within the tunnel. The leakage rate will be
measured for different pressure differentials between the plug and tunnel to determine
common trends.

7
1.4 - Importance of This Work
Even though friction coefficients between the plug and tunnel can be calculated
using friction testing machines, these results cannot take into account other factors that
may be present. The data obtained from the plug and tunnel friction tests presented in
this work will be very important in future plug design. The friction coefficients will allow
designers to know how the plug performs under actual test conditions.
The leakage rates measured during testing will also be important in later plug
design and implementation. The rates will allow the tunnel operators to be aware of
how much water they must be able to handle and dispose of during an event. The data
collected will ultimately aid in the design and construction of a full scale inflatable plug
for implementation in tunnel systems.
Even though there has been numerous tests and designs for inflatable structures
using air as the inflation medium, very limited work has been published using water for
inflation. The results presented in this work will also help gain a better understanding of
the testing techniques used and equipment needed for this type of inflation.

8
Chapter 2 - Test Method
2.1 - Test Setup
This test bed was made up of four main components: an inflatable plug, a
concrete pipe representing a tunnel, a hydraulic pump system, and a sensor system.
The total system was designed for a maximum pressure of 36 psig with a factor of
safety of 1.5. Because of the compressibility of gases, air was avoided as the inflation
medium and water was used instead. An air compressor capable of providing the
needed volume and pressure was not as cost effective nor as safe as using pumps and
water. Minimal energy is dissipated in bursts with high pressures of water.
A 3000 gallon water storage tank was used as the water source so that the water
could be recycled for multiple tests. A schematic of the test bed is shown in Figure 2-1.
Arrows indicate the flow of water during testing. Water is pumped from the water tank
to both the plug and tunnel through the plug pumps and the tunnel pumps to fill and
pressurize the respective volumes. Any leakage that flows around the plug is caught in
the collection trough and pumped back into the water tank.
Each test required both the plug and the space between the plug and the end of
the tunnel to be filled and pressurized with water. Figure 2-2 provides a conceptual
representation of the how the plug was inflated in the tunnel and the pressure being
applied by the volume of water behind it.

9
Figure 2-1 Schematic of test bed
Figure 2-2 Cross-section of tunnel and plug setup

10
The tunnel volume behind the plug is referred to as the tunnel pressure, 𝑃������. The
plug volume is also filled with pressurized water and referred to as the plug pressure,
𝑃����.
The following basic test sequence was followed for each test:
1. Insert deflated plug approximately 6 feet into open end of the tunnel.
2. Attach hoses to plug for inflation and pressure readings.
3. Inflate plug until full but not pressurized and turn off pumps.
4. Fill space between the plug and the closed end of the tunnel. While the tunnel is
filling with water, air is being displaced and must escape through the air outlet in
the top of the tunnel.
5. Once the tunnel is full, the pumps are shut off and the air outlet is closed.
6. The plug and tunnel can then be pressurized to the desired pressures.
It is important to note that the plug pressure was kept above the tunnel pressure to
avoid plug slippage unless specific slippage tests were performed. Detailed
descriptions of each component making up the test bed are provided in the subsequent
sections.
2.1.1 - Tunnel
The tunnel dimensions are shown in Figure 2-3. One end of the tunnel was
sealed and contained connections to fill the tunnel, release pressure, and measure
pressure. These connections are shown in Figure 2-4.
11
Figure 2-3 Tunnel dimensions and connections
Figure 2-4 Rear tunnel connections
Tunnel air release
Tunnel air release
Tunnel air release
Closed End Open End
Tunnel air release
Pressure ports
Tunnel fill port
Camera port

12
The tunnel was constructed of steel rings with a concrete inner and outer layer.
The tunnel was designed to withstand at least a maximum of 60 psi. The concrete
inner layer was prepared so the friction characteristics mimicked those that can be
expected in an actual tunnel. A support structure was designed using I-beams so that
deflection in the tunnel in the longitudinal direction could be minimized to reduce the risk
of cracking or damage. The interior of the tunnel is capable of being lined with different
materials using an adhesive to attach them to the walls.
2.1.2 - Hydraulic System
This system contains a 3000 gallon water supply that is capable of filling both the
plug and the tunnel. This water supply is connected to 4 inch hoses that are rated to 75
psig. These hoses are then routed to the pumps for inflation. The water supply and
outlet hoses are shown in Figure 2-5.

13
Figure 2-5 3000 gallon water supply with outlet hoses to pumps
Both the tunnel and the plug had a dual pump system for inflation. A high flow,
low pressure pump and a low flow, high pressure pump were connected in parallel for
maximum efficiency. This pump system is shown in Figure 2-6. The high flow pump
filled the large volumes quickly and were then shut off. The high pressure pumps were
then activated to pressurize the volume. Both the tunnel and the plug pump systems
had a pressure regulator located downstream to control the pressures. The plug also
had an upstream pressure regulator to aid the downstream regulator for precise control
of the plug pressure. The downstream pressure regulators were capable of adjusting
the pressure between 5 and 35 psi. Adapters were also added to the pump system so
that the municipal water supply could also be used as a pressure source if desired. The
Outlet to pumps
3000 gal water tank

14
high flow pump was capable of a flow rate of 200 gpm and a head pressure of 21 psi.
The high pressure pump was capable of a flow rate of 65 gpm and a head pressure of
53 psi. The pump curves can be found in Appendix C.
Figure 2-6 Pump system for filling and pressurization
A collection trough was positioned at the open end of the tunnel to catch and
recycle any water that leaked out from testing. Another high flow pump was connected
to this trough and acted as the recirculation pump to return the water to the 3000 gallon
supply tank. All pumps were controlled manually with a switchboard. Only the
recirculation pump had a depth gauge which switched it on automatically once the
trough was full.
High pressure pump
Pressure regulator
Outlet to plug/tunnel
High flow pump
Inlet from storage tank

15
2.1.3 - Inflatable Plug
The plug was constructed from a fabric made of Vectran fibers. The Vectran
fabric was protected with a urethane coating on both the inside and outside of the plug.
This coating was important on the inside to provide water proofing characteristics and
important on the outside to help protect the fabric from abrasion.
The plug had an outer diameter of 50 inches. This is slightly oversized to the
tunnel's 48 inch diameter in order to ensure maximal contact between the tunnel and
plug. The total length from end cap to end cap was 110 inches. It was designed for a
maximum inflation pressure of 40 psig with a factor of safety of 3. It has a volume of
approximately 800 gallons. The dimensions are shown in Figure 2-7.
Figure 2-7 Plug dimensions
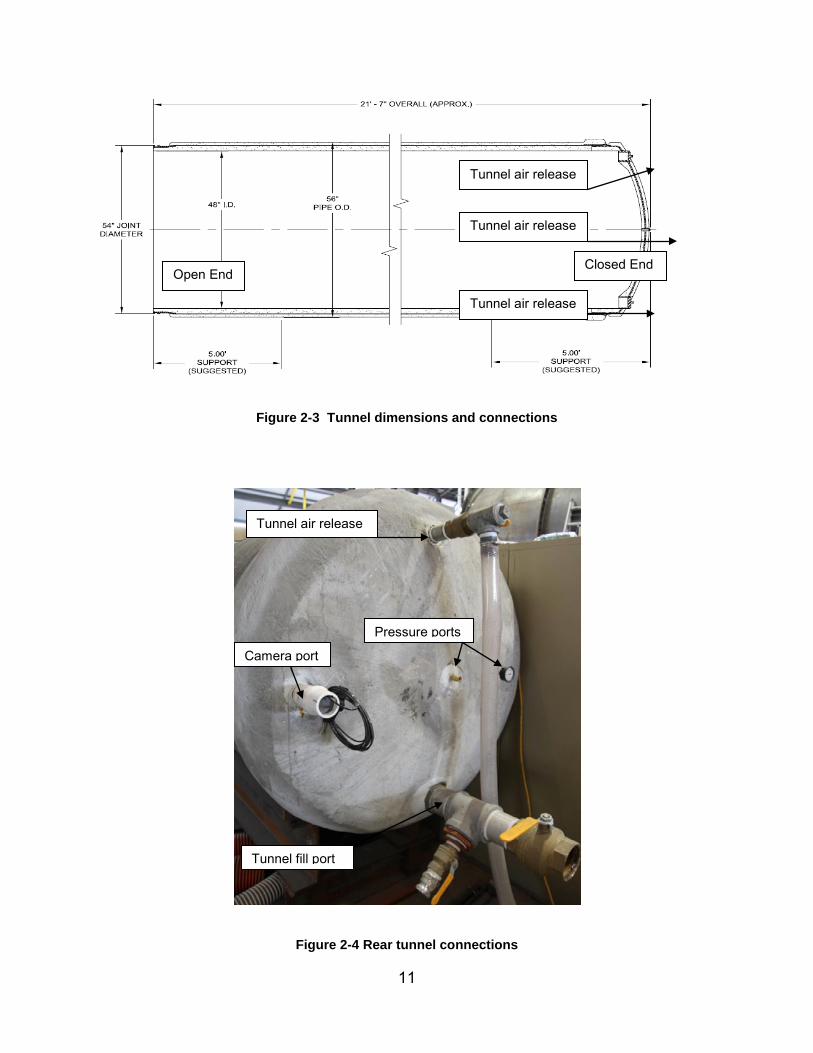
The plug had a total of three ports on the front end cap. These ports are shown
in the plug model in Figure 2-8. The air purge outlet at the top of the plug is used to
evacuate the air that is displaced when filled with water. The pressure transducer used
16
to measure the plug pressure was connected to the drain port. Figure 2-9 shows an
inflation outside of the tunnel. This inflation was used to check for leaks and defects in
the plug fabric. Figure 2-10 also shows the plug inflated inside the tunnel with air at low
pressure.
Figure 2-8 Plug model showing ports

17
Figure 2-9 Plug inflation outside of tunnel
Figure 2-10 Plug inflated inside the tunnel with low pressure air
Plug air release
Plug fill port
Plug drainage port

18
2.1.4 - Sensor System
A sensor system was implemented in order to collect data from the plug. Digital
pressure transducers were connected to measure the tunnel and plug pressures.
These pressure transducers had a pressure range of 0-50 psi with an output of 0-5
VDC. Both of the transducers were at the same height for both the tunnel and plug to
keep their readings consistent. The sensor specifications can be seen in Appendix A.
A displacement sensor was also attached to the plug to measure movement. For the
leakage data a digital scale, model Ohaus D31P300BX, was used for flow rate
calculations.
The sensors were attached to a 16 bit data acquisition board and used a
LabVIEW program to collect the data. A screen shot of the LabVIEW program is shown
in Figure 2-11.
Figure 2-11 LabVIEW data collection program

19
For the friction testing performed, data was sampled at one second intervals,
taking readings for plug pressure, tunnel pressure, and plug displacement
simultaneously. The data was stored in Microsoft Excel.
2.2 - Tunnel Linings
In addition to the original concrete interior of the tunnel, two more materials were
used to line the inside of the tunnel. These included a soft neoprene rubber and also a
vinyl floor coating. There were several factors that influenced the selection of these
materials such as roughness, compressibility, ease of application, and potential
application in full scale prototypes. The materials chosen could be installed easily in a
full scale application if they prove to provide benefits. The most significant determining
factor was choosing materials that would not cause abrasion to the plug material. Since
the plug would be serving for other tests not covered in the topic of this thesis, special
care had to be taken to ensure its protection. Due to this limitation, rough or potentially
damaging materials were avoided. The liner materials were attached to the tunnel
using removable adhesive tape. This removable adhesive allowed the liners to be
removed so another could be installed or to expose the original concrete. The liners
were installed a length of 8 feet along the tunnel which ensured the entire plug-tunnel
contact area was covered. Figure 2-12 shows a portion of installed neoprene inside the
tunnel. The vinyl floor covering was installed in the same manner.

20
Figure 2-12 Example of neoprene tunnel lining
For all tests it was also assumed that the tunnel linings were wet. Additional reasons for
selection and material properties are explained in the following sections.
Concrete
Concrete was used because it most accurately simulates a potential finished
surface that would be used in underground structures such as subways. Both friction
and leakage data was desired for this surface. The concrete surface used in this
situation was smooth to help minimize abrasions when testing with the plug. It is
classified as ICRI-CSP #1 smooth concrete (23). A detailed view of the concrete in the
tunnel is shown in Figure 2-13 (A).
Liner
Plug

21
Neoprene Rubber
Leakage rates coming from around the plug was one of the main topics of
concern. Leakage occurs around the plug when water passes through small wrinkles or
imperfections in the plug-tunnel contact area that cannot be observed. This prompted a
hypothesis of limiting leakage using a material that would conform and expand into
voids between the plug and the tunnel wall. The compressibility and non-abrasive
properties of neoprene seemed to meet the requirements necessary. Even though the
primary focus of neoprene was to study leakage, friction testing was also performed to
gain additional information.
The neoprene was 1/2 inch thick and lined the tunnel along the full plug-tunnel
contact length. It has a density of 4-8 𝑙𝑏𝑠/𝑓𝑡� and a firmness of 2-5 psi (25%
deflection). More mechanical properties are shown in Appendix D. A detailed view of
the neoprene is shown in Figure 2-13 (B).
Vinyl Floor Coating
The vinyl floor coating was chosen as a lining that would produce a more slippery
surface as opposed to concrete and neoprene. This would give a wider variety of
testing surfaces so they could be compared with each other for the friction coefficients.
The vinyl coating was also studied in the leakage tests to see if any significant
differences were present as compared to the other linings.
The vinyl floor coating possessed a smooth, slick, plastic like surface. It had a
thickness of 0.0625 inch. The surface was completely uniform with no protruding
features. A detailed view of the vinyl is shown in Figure 2-13 (C).

22
Figure 2-13 Detailed view of tunnel linings: (A) Concrete, (B) Neoprene, and (C) Vinyl
A B C

23
Chapter 3 - Slippage Testing
3.1 - Introduction
The objective of the slippage testing was to evaluate the relationship between the
plug and tunnel pressures (pressure differential) when the plug started to slip. These
pressure differentials were then used to calculate the friction coefficient that exists
between the plug and the different tunnel surfaces. These friction coefficients were also
compared to other friction coefficient estimates obtained using different testing methods.
By comparing these values, other factors influencing the friction coefficients can better
be understood. It is hypothesized that the vinyl tunnel lining will have the lowest friction
coefficient due to its very smooth, plastic like characteristics.
3.2 - Friction Tests Using A Friction Testing Machine
Previous friction tests were performed on the same Vectran fabric used in the
experiments presented in this work. These tests were designed to simulate the
conditions present in a plug and tunnel scenario. This friction machine is shown in
Figure 3-1. This machine works by placing a fabric sample between the sled and a
stationary plane as shown in the figure. The fabric sample was attached to the sled with
double-sided foam sticky tape. A normal force is applied by adding weight to the sled
shaft. A total weight of 24.45 lbs was added which provided a pressure of 11 psi
between the sled and plane. The hydraulic cylinder is then actuated and a load cell
measures the force required to break contact between the sled and the plane. The
linear variable differential transducer (LVDT) provided the displacement feedback which
occurred with the moving plane. This applied force from the hydraulic cylinder along

24
with the normal force is then used to calculate the friction coefficient between the sled
(fabric) and the plane (tunnel surface). All of the tests from the friction testing machine
were also performed while submerged in water so they more accurately replicated the
slippage tests performed on the plug-tunnel setup. This water setup is shown in Figure
3-2.
Figure 3-1 Friction testing machine used in previous friction testing (20)

25
Figure 3-2 Wet friction machine test setup (20)
3.3 - Procedure for Slippage Testing
The plug was inserted into the tunnel and connected to the inflation system. The
plug was then filled with water but not pressurized beyond 5 psi. After the plug was
filled, the tunnel was then filled with water but not pressurized. Once testing was ready
to begin, the tunnel pressure was raised to 2 psi less than the plug pressure. The data
collection system was activated once the pressures were within this 2 psi differential.
Data was sampled at 1 second intervals collecting values for plug pressure, tunnel
pressure, and plug displacement. The data was recorded for six plug pressures which
were 5, 10, 15, 20, 25, and 30 psi. Each of these pressures was tested for all three of
the tunnel linings for a total of 18 slippage tests performed.
The goal of the testing was to find the point at which the plug would move due to
the force acting on it by the tunnel pressure. Since all regulators and switches were

26
manually operated, two people were required for testing. One person controlled the
plug pressure while the other person controlled the tunnel pressure. Changing the
tunnel pressure had a residual effect of the plug pressure. If the tunnel pressure would
increase or decrease, it would increase or decrease the plug pressure respectively.
The test was performed by keeping the plug pressure constant and raising the tunnel
pressure towards the plug pressure until the plug slipped. A loud, audible thumping
noise occurred when slippage took place which indicated that the test for that pressure
could be stopped. The plug pressure was continuously adjusted to keep it as close as
possible to the desired test pressure. If the plug pressure was not adjusted, it would
continue to raise as the tunnel pressure was raised which would not produce the
desired results.
The tests started at the lowest plug pressure and continued to the next highest
pressure systematically. When testing for one pressure was completed, the data was
recorded and then restarted for the next pressure. When all six plug pressures were
recorded for a given tunnel lining, the plug and tunnel were deflated and a new liner was
installed. The tests then continued with the same procedure for each additional liner.
3.4 - Results/Discussion
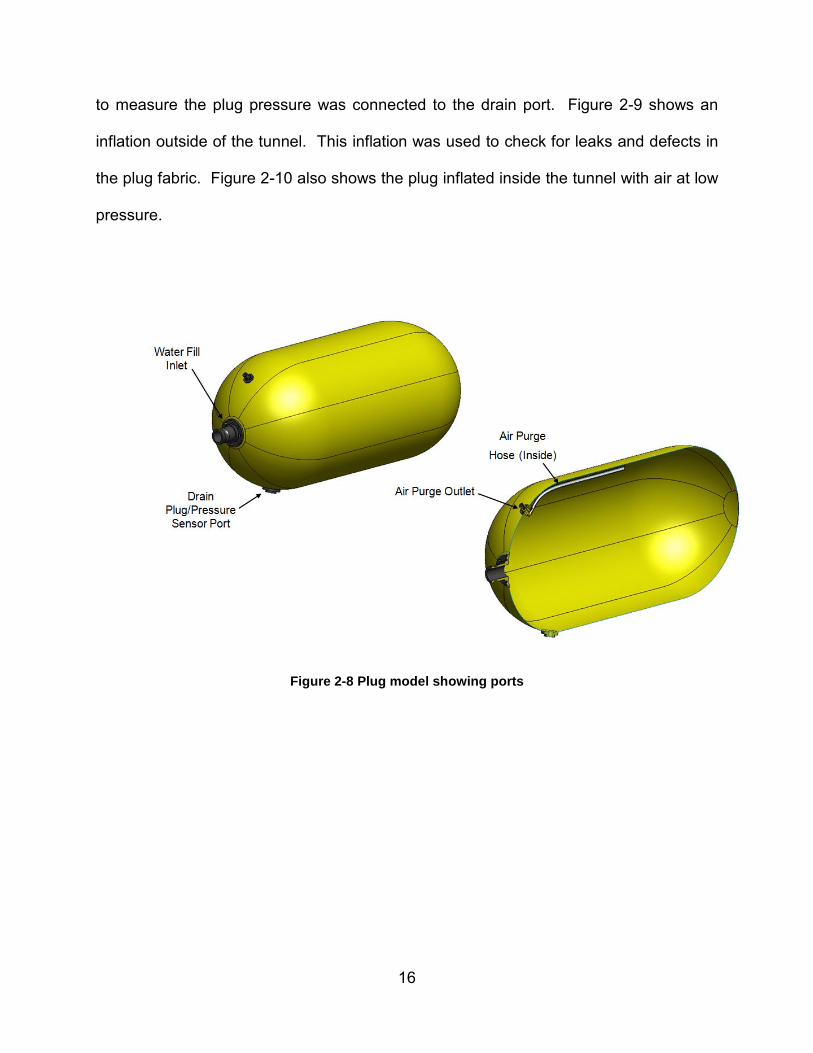
Because of the sensitivity of the plug pressure adjustment, it was difficult to reach
and maintain the exact plug pressure desired for the tests. Table 3-1 shows the
difference in the desired and actual plug pressures when slippage occurred. The errors
varied from 0.49% for the 15 psi neoprene coating to 33.34% for the 5 psi vinyl coating.
Since the friction coefficients could be calculated using the actual pressure, these errors
27
did not play a significant role. These error values do indicate that the plug pressure did
not deviate more than about 5% in 10 out of the 14 slippage tests.
Table 3-1 Desired and actual plug pressure error
Concrete Desired Plug Pressure (psi)
Actual Plug Pressure (psi)
Percent Difference
5 6.109 22.18% 10 10.535 5.35% 15 15.271 1.81% 20 19.536 -2.32% 25 24.136 -3.46%
Neoprene Desired Plug Pressure (psi)
Actual Plug Pressure (psi)
Percent Difference
5 4.584 -8.32% 10 9.518 -4.82% 15 15.073 0.49% 20 19.834 -0.83% 25 24.706 -1.18%
Vinyl Desired Plug Pressure (psi)
Actual Plug Pressure (psi)
Percent Difference
5 6.667 33.34% 10 11.998 19.98% 15 15.147 0.98% 20 20.416 2.08%
28
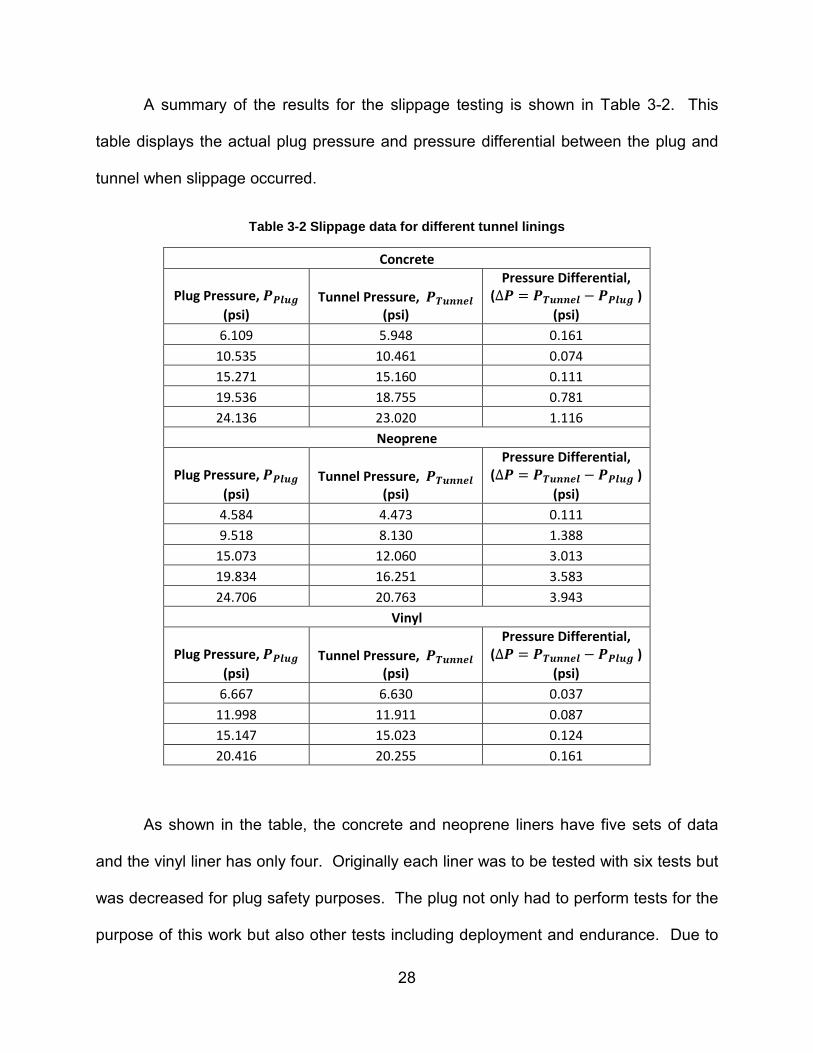
A summary of the results for the slippage testing is shown in Table 3-2. This
table displays the actual plug pressure and pressure differential between the plug and
tunnel when slippage occurred.
Table 3-2 Slippage data for different tunnel linings
Concrete
Plug Pressure, 𝑷𝑷𝒍𝒖𝒈 (psi)
Tunnel Pressure, 𝑷𝑻𝒖𝒏𝒏𝒆𝒍 (psi)
Pressure Differential, (∆𝑷 = 𝑷𝑻𝒖𝒏𝒏𝒆𝒍 − 𝑷𝑷𝒍𝒖𝒈 )
(psi) 6.109 5.948 0.161
10.535 10.461 0.074 15.271 15.160 0.111 19.536 18.755 0.781 24.136 23.020 1.116
Neoprene
Plug Pressure, 𝑷𝑷𝒍𝒖𝒈 (psi)
Tunnel Pressure, 𝑷𝑻𝒖𝒏𝒏𝒆𝒍 (psi)
Pressure Differential, (∆𝑷 = 𝑷𝑻𝒖𝒏𝒏𝒆𝒍 − 𝑷𝑷𝒍𝒖𝒈 )
(psi) 4.584 4.473 0.111 9.518 8.130 1.388
15.073 12.060 3.013 19.834 16.251 3.583 24.706 20.763 3.943
Vinyl
Plug Pressure, 𝑷𝑷𝒍𝒖𝒈 (psi)
Tunnel Pressure, 𝑷𝑻𝒖𝒏𝒏𝒆𝒍 (psi)
Pressure Differential, (∆𝑷 = 𝑷𝑻𝒖𝒏𝒏𝒆𝒍 − 𝑷𝑷𝒍𝒖𝒈 )
(psi) 6.667 6.630 0.037
11.998 11.911 0.087 15.147 15.023 0.124 20.416 20.255 0.161
As shown in the table, the concrete and neoprene liners have five sets of data
and the vinyl liner has only four. Originally each liner was to be tested with six tests but
was decreased for plug safety purposes. The plug not only had to perform tests for the
purpose of this work but also other tests including deployment and endurance. Due to

29
these factors, it was decided to keep the plug pressure below 70% of its design
pressure. This decision did not allow any plug pressures to exceed 25 psi. By keeping
the plug pressure lower, it minimized the risk of plug damage due to slippage. While
performing the testing for the vinyl tunnel lining, one of the plug fittings became caught
against the tunnel creating unsafe conditions thus causing the test to end prematurely
without collecting data for the 25 psi plug pressure.
After reviewing the data from each slippage test, it was determined that the
displacement sensor recording the movement of the plug did not collect valuable data.
The slippage itself created very small displacements and that, combined with static
interference and poor sensor resolution produced values for that were not able to be
used to determine the point at which the plug slipped. Each set of data did, however,
display unique trends in the plug and tunnel pressures that allowed the slippage point to
be easily seen. When the plug slipped, it caused a sudden increase in tunnel volume.
This volume increase caused a sudden decrease in the pressure in tunnel which also
caused a decrease in plug pressure. An example of the data is shown in Figure 3-3.
Only one set of data displayed an ideal case where the displacement sensor could be
used to see the slippage point. This is shown in Figure 3-5.

30
Figure 3-3 Example of slippage point for at 20 psi plug pressure
Figure 3-4 Example of slippage point location compared to the plug displacement
0
5
10
15
20
25
0 10 20 30 40 50 60
Pres
sure
(psi
)
Time (s)
Plug Pressure
Tunnel Pressure
Slippage Point
0
0.05
0.1
0.15
0.2
0.25
0.3
0.35
0.4
0 10 20 30 40 50 60
Plug
Dis
plac
emen
t (in
)
Time (s)
Slippage Point

31
Figure 3-5 Slippage point for 10 psi plug pressure with concrete lining
Figure 3-3 starts by showing the plug pressure being maintained as close as
possible to the testing pressure of 20 psi. The tunnel pressure was slowly raised to
approach the plug pressure. When the tunnel pressure was raised to the slippage point
(tunnel and plug pressure were nearly equal), both pressures dropped dramatically as
seen at approximately 36 seconds indicated by the black line. It was at this point that
the pressure differential was measured and the true slippage point was defined. The
values collected from the displacement sensor at the same 20 psi plug pressure with
the same slippage point are shown in Figure 3-4. It can be seen that there is no clearly
0
0.1
0.2
0.3
0.4
0.5
0.6
0
2
4
6
8
10
12
0 50 100 150 200 250 300
Disp
lace
men
t (in
)
Pres
sure
(psi
)
Time (sec)
Displacement
Plug
Tunnel
Slippage Point

32
defined point in the displacement at which the slippage occurs; therefore, the
displacement data is omitted in the later graphs. The slippage data that was obtained
and analyzed to find the slippage points is shown in Figure 3-6 through Figure 3-19.
The exact slippage points in each graph are shown with the black vertical line. The
original data which contains the pressure and displacement measurements are shown
in Appendix E.
Figure 3-6 Concrete, 5 psi plug pressure
0
1
2
3
4
5
6
7
8
0 50 100 150 200 250
Pres
sure
(psi
)
Time (s)
Concrete, 5 psi plug pressure
Tunnel Pressure
Plug Pressure

33
Figure 3-7 Concrete, 10 psi plug pressure
Figure 3-8 Concrete, 15 psi plug pressure
0
2
4
6
8
10
12
0 50 100 150 200 250
Pres
sure
(psi
)
Time (s)
Tunnel Pressure
Plug PressureConcrete, 10 psi plug pressure
0
2
4
6
8
10
12
14
16
18
20
0 20 40 60 80 100 120 140 160
Pres
sure
(psi
)
Time (s)
Concrete, 15 psi plug pressure

34
Figure 3-9 Concrete, 20 psi plug pressure
Figure 3-10 Concrete, 25 psi plug pressure
0
5
10
15
20
25
0 20 40 60 80 100 120
Pres
sure
(psi
)
Time (s)
Plug Pressure
Tunnel Pressure
Concrete, 20 psi plug pressure
0
5
10
15
20
25
30
0 50 100 150 200 250 300 350 400
Pres
sure
(psi
)
Time (s)
Concrete, 25 psi plug pressure

35
Figure 3-11 Neoprene, 5 psi plug pressure
Figure 3-12 Neoprene, 10 psi plug pressure
0
1
2
3
4
5
6
7
8
0 10 20 30 40 50 60
Pres
sure
(psi
)
Time (s)
Plug Pressure
Tunnel Pressure
Neoprene, 5 psi plug pressure
0
2
4
6
8
10
12
0 10 20 30 40 50 60 70 80 90 100
Pres
sure
(psi
)
Time (s)
Plug Pressure
Tunnel Pressure
Neoprene, 10 psi plug pressure

36
Figure 3-13 Neoprene, 15 psi plug pressure
Figure 3-14 Neoprene, 20 psi plug pressure
0
2
4
6
8
10
12
14
16
18
0 10 20 30 40 50 60 70
Pres
sure
(psi
)
Time (s)
Plug Pressure
Tunnel Pressure
Neoprene, 15 psi plug pressure
0
5
10
15
20
25
0 10 20 30 40 50 60 70
Pres
sure
(psi
)
Time (s)
Neoprene, 20 psi plug pressurePlug Pressure
Tunnel Pressure

37
Figure 3-15 Neoprene, 25 psi plug pressure
Figure 3-16 Vinyl, 5 psi plug pressure
0
5
10
15
20
25
30
0 10 20 30 40 50 60 70 80 90 100
Pres
sure
(psi
)
Time (s)
Tunnel Pressure
Plug Pressure Neoprene, 25 psi plug pressure
0
1
2
3
4
5
6
7
8
0 20 40 60 80 100 120
Pres
sure
(psi
)
Time (s)
Vinyl, 5 psi plug pressure
Plug Pressure
Tunnel Pressure

38
Figure 3-17 Vinyl, 10 psi plug pressure
Figure 3-18 Vinyl, 15 psi plug pressure
0
2
4
6
8
10
12
14
0 10 20 30 40 50 60
Pres
sure
(psi
)
Time (s)
Vinyl, 10 psi plug pressure
Plug Pressure
Tunnel Pressure
0
2
4
6
8
10
12
14
16
18
0 10 20 30 40 50 60 70 80 90
Pres
sure
(psi
)
Time (s)
Plug Pressure
Tunnel Pressure
Vinyl, 15 psi plug pressure

39
Figure 3-19 Vinyl, 20 psi plug pressure
The results summarized in Table 3-2 are shown plotted in Figure 3-20. This
figure indicates that as plug pressure increases, the pressure differential at which the
plug slips also increases. This is true for all three tunnel linings although there is a
slight deviation at lower pressure with the concrete liner.
0
5
10
15
20
25
0 10 20 30 40 50 60
Pres
sure
(psi
)
Time (s)
Plug Pressure
Tunnel Pressure
Vinyl, 20 psi plug pressure

40
Figure 3-20 Plug pressure vs pressure differential
These pressure differentials were then used to calculate the friction coefficient for
each tunnel lining. A static force balance was used to find the friction coefficient
corresponding to the slippage instant in terms of the measured plug and tunnel
pressures. The general static friction equation 𝐹� = 𝑓 ∗ 𝑁 was used. Figure 3-21
shows a free body diagram of the acting forces applied to the tunnel and plug test bed
along with their dimensions.
0
0.5
1
1.5
2
2.5
3
3.5
4
4.5
5
0 5 10 15 20 25 30
Pres
sure
Diff
eren
tial (
psi)
Plug Pressure (psi)
Concrete
Neoprene
Vinyl
Neoprene
Concrete
Vinyl

41
Figure 3-21 Force balance and dimensions of tunnel and plug
For slippage to occur, the equation 𝐹������ > 𝐹���� ∗ 𝑓 had to be satisfied.
Since both the forces acting on the plug and tunnel (𝐹������ 𝑎𝑛𝑑 𝐹����) can be
determined from the measured pressures, the friction coefficient could be calculated.
The pressures that were applied to the plug and tunnel at the time of slippage were
used to find the forces. The general equation 𝐹 = 𝑃 ∗ 𝐴 was used. The pressures had
two components, the hydrostatic pressure of the water volume and the applied pressure
from the pumps.
The force of the hydrostatic pressure of the water in the plug was first calculated.
The hydrostatic pressure distribution is shown in Figure 3-22.

42
Figure 3-22 Hydrostatic pressure distribution on the plug
As seen from Figure 3-22, the pressure increases towards the bottom of the plug and
decreases towards the top, therefore an integral was used to calculated the total force
acting on the plug. The plug was simplified to a cylinder because the end caps were not
in contact with the tunnel.
The total force is given by:
F = P ∗ A [3-1]
43
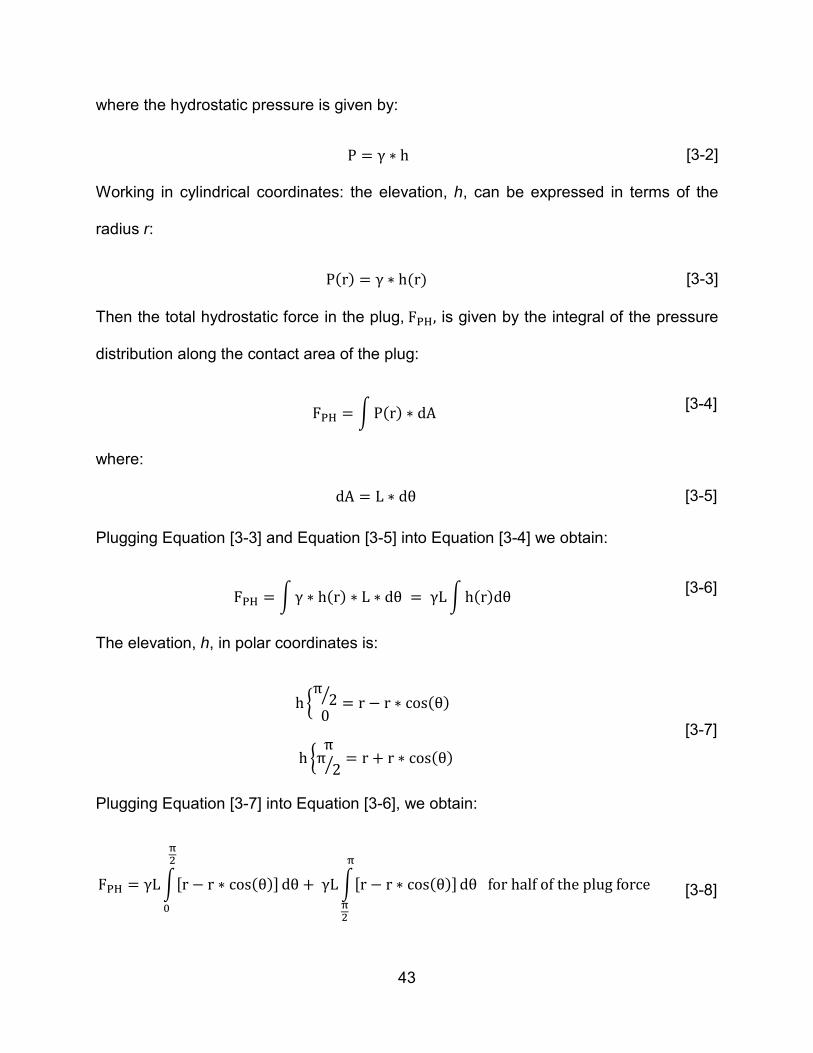
where the hydrostatic pressure is given by:
P = γ ∗ h [3-2]
Working in cylindrical coordinates: the elevation, h, can be expressed in terms of the
radius r:
P(r) = γ ∗ h(r) [3-3]
Then the total hydrostatic force in the plug, F��, is given by the integral of the pressure
distribution along the contact area of the plug:
F�� = �P(r) ∗ dA [3-4]
where:
dA = L ∗ dθ [3-5]
Plugging Equation [3-3] and Equation [3-5] into Equation [3-4] we obtain:
F�� = �γ ∗ h(r) ∗ L ∗ dθ = γL�h(r)dθ [3-6]
The elevation, h, in polar coordinates is:
h �π
2�0� = r − r ∗ cos(θ)
h �ππ
2�� = r + r ∗ cos(θ)
[3-7]
Plugging Equation [3-7] into Equation [3-6], we obtain:
F�� = γL�[r − r ∗ cos(θ)] dθ
��
�
+ γL�[r − r ∗ cos(θ)] dθ for half of the plug force �
��
[3-8]

44
Then the total hydrostatic force in the plug is:
F�� = 2 ∗ γ ∗ L ∗ r ∗ ( π − 2)
F�� = 2 ∗ 62.4 ������∗ 6ft ∗ 2ft ∗ ( π − 2)ft
F�� = 1709.65 lbs
[3-9]
The hydrostatic force of the water in the tunnel volume was then calculated as follows:
F�� = γ ∗ h� ∗ A� [3-10]
Where:
h� =D�
2 [3-11]
Then, combining Equations [3-10] and [3-11]:
F�� = 62.4lbsft�
∗ 2𝑓𝑡 ∗ 𝜋 ∗ (2𝑓𝑡)�
F�� = 1568.3 lbs
[3-12]
The values resulting from Equations [3-9] and [3-12] were then added to their respective
pressures that were applied by the pumps. Equation [3-13] shows the friction coefficient
calculation:
F�� + F���F�� + F���
= f [3-13]
where F�� is the hydrostatic tunnel force, F��� is the force from the applied tunnel
pressure, F�� is the hydrostatic plug force, and F��� is the force from the applied plug
pressure.

45
For the tunnel:
F��� = P��� ∗ A� = P��� ∗ 144in�
ft�∗ π ∗ (2ft)�
[3-14]
For the plug:
F��� = P��� ∗ π ∗ D ∗ L = P��� ∗ 144in�
ft�∗ 𝜋 ∗ 4𝑓𝑡 ∗ 6𝑓𝑡
[3-15]
Then combining Equations [3-13], [3-14], and [3-15] yield:
1568.3 lbs + P��� ∗ 1808.64 in�
1709.65 lbs + P��� ∗ 10857.34 in�= f
[3-16]
Equation [3-16] was then used in combination with the slippage data to produce the
friction coefficients for the different tunnel linings shown in Table 3-3. In these
calculations it was assumed that the tunnel force acting on the end of the plug was
acting on a flat circular face. The true shape of the end cap of the plug is hemispherical
but due to the uncertainty of deformation caused by the acting tunnel force, this
hemispherical shape was not accounted for. The assumption of a flat circular plate
yields the worst case condition that could occur, therefore, was used for the friction
coefficient calculations.
If a hemispherical face was used it would result in a slightly higher friction
coefficient due to the larger surface area on which the tunnel pressure acts. This can

46
be seen by calculating 1/4 of the plug force on the hemisphere using a double integral.
The force is:
F4
= �P ∗ dA
��
�
[3-17]
where dA = rdθ ∗ rd∅ and dθ represents the distance in the longitudinal direction and
d∅ represents the distance in the lateral direction. Only the horizontal component of the
pressure is used in both the lateral and longitudinal direction to yield:
F4
= �P ∗ cos∅ ∗ cosθ ∗
��
�
rdθ ∗ rd∅ = P ∗ r�� cos∅ ∗ cosθ
��
�
d∅dθ
[3-18]
Integrating Equation [3-18] yields:
F4
= P ∗ r� [3-19]
where the area for the hemispherical end , 𝐴���������� , is 4 ∗ r�. For the flat plate used
for the friction coefficient calculations, the tunnel area, 𝐴� , is 3.14 ∗ r�. The
hemispherical end cap area is approximately 21% larger than the assumed flat plate
area which would result in an approximate 21% larger friction coefficient. As previously
stated, the smaller area value was used for the worst case scenario.

47
Table 3-3 Friction coefficients for different tunnel linings
Concrete Plug
Pressure (psi)
Tunnel Pressure
(psi) Pressure
Differential (psi)
Friction Coefficient, f
Eq. [3-16] 6.109 5.948 0.161 0.181
10.535 10.461 0.074 0.177 15.271 15.16 0.111 0.173 19.536 18.755 0.781 0.166 24.136 23.02 1.116 0.164
Average Friction
Coefficient 0.172
Neoprene Plug
Pressure (psi)
Tunnel Pressure
(psi) Pressure
Differential (psi)
Friction Coefficient, f
Eq. [3-16] 4.584 4.473 0.111 0.188 9.518 8.13 1.388 0.155
15.073 12.06 3.013 0.141 19.834 16.251 3.583 0.143 24.706 20.763 3.943 0.145
Average Friction
Coefficient 0.154
Vinyl Plug
Pressure (psi)
Tunnel Pressure
(psi) Pressure
Differential (psi)
Friction Coefficient, f
Eq. [3-16] 6.667 6.63 0.037 0.183
11.998 11.911 0.087 0.175 15.147 15.023 0.124 0.173 20.416 20.255 0.161 0.171
Average Friction
Coefficient 0.176

48
Figure 3-23 Plug pressure vs. tunnel pressure for each tunnel lining
It can be observed in Table 3-3 that the neoprene tunnel lining had the lowest
average friction coefficient of 0.154 while the vinyl lining had the highest value of 0.176.
The concrete was very close to the vinyl with a value of 0.172. The results contradict
the original hypothesis which suggested that the vinyl covering would have the lowest
friction coefficient. It is thought that the urethane coating on the plug fabric sticks well to
the plastic like surface of the vinyl lining, creating this higher friction coefficient. Figure
3-23 shows the plug pressure verses the tunnel pressure for the different tunnel linings.
The increased slopes of vinyl and concrete indicate a higher friction coefficient than that
of neoprene.
0
5
10
15
20
25
0 5 10 15 20 25 30
Plug
Pre
ssur
e (p
si)
Tunnel Pressure (psi)
Concrete
Neoprene
Vinyl
Concrete
Vinyl
Neoprene

49
These friction values were also compared to other values obtained from the
friction machine testing of the material. A comparison of these values is shown in Table
3-4.
Table 3-4 Comparison of friction values for different testing methods
Average Friction Coefficient
Plug-Tunnel Test
Friction Machine Test
Concrete 0.172 0.620 Neoprene 0.154 0.610
Vinyl 0.176 0.710
From the results summarized in Table 3-4, it can be easily noticed that the friction
values for the plug and tunnel slippage tests are significantly lower than the values from
the friction sled tests. This information tells us not that values are incorrect but that
there are other factors influencing the friction characteristics in the tunnel tests that were
not present in the sled tests. Note also that the sled tests do follow the same trend as
the plug and tunnel tests in that the neoprene has the lowest friction coefficient and the
vinyl having the highest value.
Leakage rate (presented in Chapter 4) appears to be one factor that influences
the friction factor. This relationship is shown in Table 3-5.

50
Table 3-5 Relationship between friction coefficient and leakage rate
Average Friction
Coefficient (f)
Average Leakage
Rate (gpm)
Neoprene 0.154 1.09 Concrete 0.172 0.90
Vinyl 0.176 0.61
When comparing the average friction coefficient to the average leakage rate of different
tunnel linings, it can be observed that there is an inverse relationship. As the leakage
rate increases, the friction coefficient decreases. This relationship is shown in Figure
3-24.
Figure 3-24 Leakage rate vs. friction coefficient
0
0.2
0.4
0.6
0.8
1
1.2
0.15 0.155 0.16 0.165 0.17 0.175 0.18
Leak
age
(gpm
)
Friction Coefficient
Neoprene
Concrete
Vinyl

51
One of the possible explanations for this relationship is that the increase in flow
rate creates larger spaces or crevices in which the water moves around the plug. This
water flow could be causing hydrodynamic effects like a thin layer of water between the
plug and tunnel surface causing a decrease in the friction coefficient.
The pressure sensitivity of the plug to the tunnel pressure that was previously
discussed in Section 3.3 can be seen in Figure 3-25 and shows what happens when the
plug pressure is not adjusted when the tunnel is being pressurized.
Figure 3-25 Plug pressure sensitivity
The plug pressure is set to 10 psi and the pressure is not adjusted and the tunnel
pressure is raised from 1 psi to 10 psi. The plug pressure increases approximately 4 psi
0
2
4
6
8
10
12
14
16
0 50 100 150 200 250
Pres
sure
(psi
)
Time (sec)
Plug
Tunnel
52
due to this tunnel pressure increase. This shows that if the plug pressure was not
adjusted while performing the tests, the maximum design pressure of the plug could be
exceeded, causing the plug material to fail.
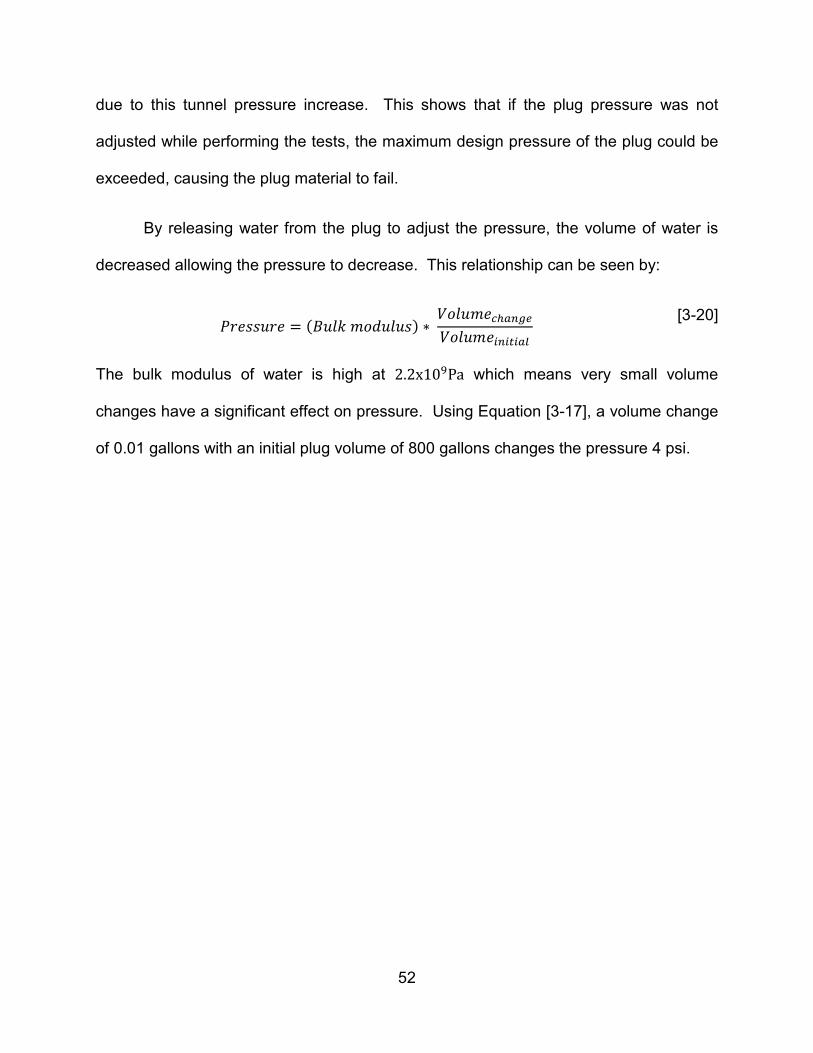
By releasing water from the plug to adjust the pressure, the volume of water is
decreased allowing the pressure to decrease. This relationship can be seen by:
𝑃𝑟𝑒𝑠𝑠𝑢𝑟𝑒 = (𝐵𝑢𝑙𝑘 𝑚𝑜𝑑𝑢𝑙𝑢𝑠) ∗ 𝑉𝑜𝑙𝑢𝑚𝑒������𝑉𝑜𝑙𝑢𝑚𝑒�������
[3-20]
The bulk modulus of water is high at 2.2x10�Pa which means very small volume
changes have a significant effect on pressure. Using Equation [3-17], a volume change
of 0.01 gallons with an initial plug volume of 800 gallons changes the pressure 4 psi.

53
Chapter 4 - Leakage Testing
4.1 - Introduction
The leakage testing provided data showing how changes in the plug and tunnel
pressure affected leakage flow rates. Several different plug pressures were evaluated
with different pressure differentials between them and the tunnel. These leakage rates
were performed for three different tunnel linings.
4.2 - Procedure
The plug was inserted into the tunnel and connected to the inflation system. The
plug was then filled with water but not pressurized beyond 5 psi. After the plug was
filled, the tunnel was then filled with water but not pressurized. Both pressures were
then adjusted to the desired positions, making sure the tunnel pressure always stayed
at least 1 psi below the plug pressure to avoid the chance of plug slippage. One person
was located at each the plug pressure regulator and the tunnel pressure regulator. By
using two people, the pressures could be adjusted simultaneously to reach the desired
test point. The pressures had to be carefully observed because the change in one
pressure affected the pressure in the other.
Leakage rates were recorded for seven different plug pressures ranging from 5
psi to the maximum allowable pressure of 35 psi. The tunnel pressure was set to a
certain percentage of the plug pressure. These percentages were 20%, 40%, 60%, and
80%. Percentages of the plug pressure were used to keep the data consistent across
the various plug pressures. For each plug pressure, three leakage rates were recorded
for each of the tunnel pressures (percentage of plug pressure). This equaled a total of
54
12 leakage rates for each plug pressure. An average leakage for each plug and tunnel
pressure combination could then be found. A total of 84 leakage tests were performed
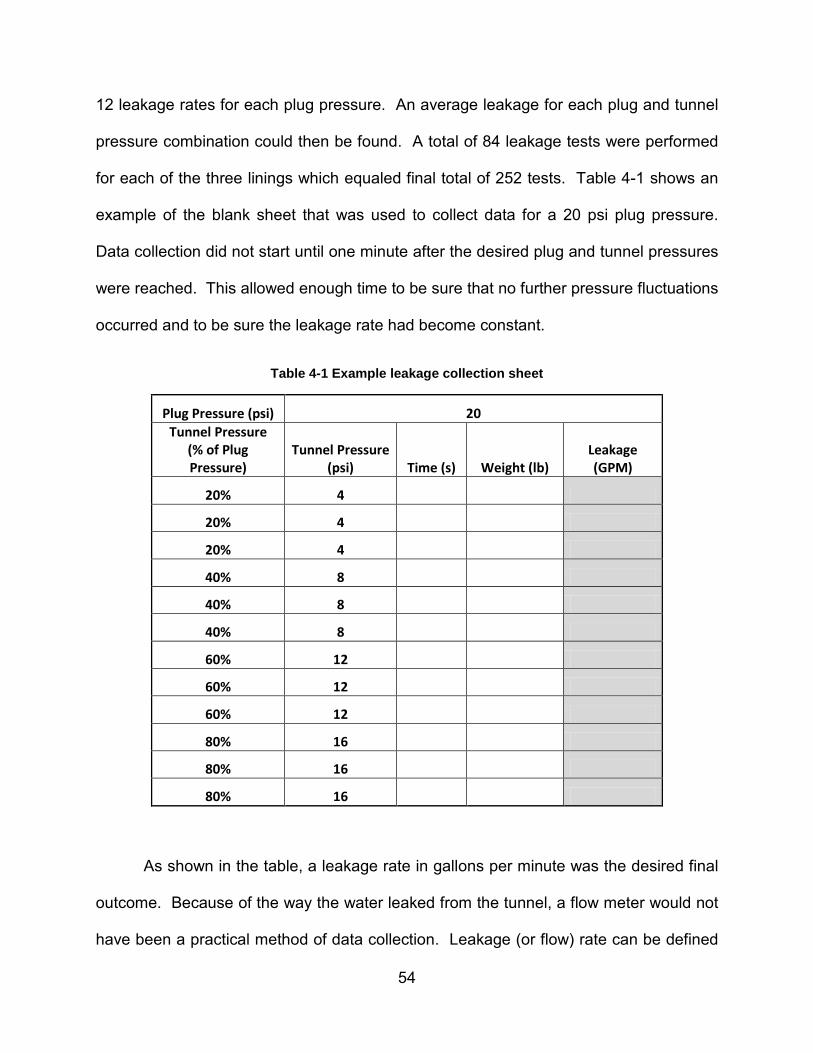
for each of the three linings which equaled final total of 252 tests. Table 4-1 shows an
example of the blank sheet that was used to collect data for a 20 psi plug pressure.
Data collection did not start until one minute after the desired plug and tunnel pressures
were reached. This allowed enough time to be sure that no further pressure fluctuations
occurred and to be sure the leakage rate had become constant.
Table 4-1 Example leakage collection sheet
Plug Pressure (psi) 20 Tunnel Pressure
(% of Plug Pressure)
Tunnel Pressure (psi) Time (s) Weight (lb)
Leakage (GPM)
20% 4
20% 4
20% 4
40% 8
40% 8
40% 8
60% 12
60% 12
60% 12
80% 16
80% 16
80% 16
As shown in the table, a leakage rate in gallons per minute was the desired final
outcome. Because of the way the water leaked from the tunnel, a flow meter would not
have been a practical method of data collection. Leakage (or flow) rate can be defined

55
as the volume of water per unit of time as seen in Equation [4-1]. Using this definition, a
container was used to collect a volume of water during a specific time. This volume and
the time in which it was collected equaled the leakage rate. The equations used for the
calculations are shown below:
𝐿𝑒𝑎𝑘𝑎𝑔𝑒 𝑅𝑎𝑡𝑒 =𝑉𝑜𝑙𝑢𝑚𝑒𝑇𝑖𝑚𝑒
[4-1]
𝑉𝑜𝑙𝑢𝑚𝑒 =𝑊𝑒𝑖𝑔ℎ𝑡
𝛾
[4-2]
Then, combining Equations [4-1] and [4-2]:
𝐿𝑒𝑎𝑘𝑎𝑔𝑒 𝑅𝑎𝑡𝑒 =�𝑊𝑒𝑖𝑔ℎ𝑡
𝛾 �
𝑇𝑖𝑚𝑒 �1 𝑚𝑖𝑛60 𝑠𝑒𝑐�
[4-3]
Where water is:
𝛾 = �62.4 𝑙𝑏𝑠𝑓𝑡�
� �1 𝑓𝑡�
7.48 𝑔𝑎𝑙� = 8.34
𝑙𝑏𝑠𝑔𝑎𝑙
Therefore:
𝐿𝑒𝑎𝑘𝑎𝑔𝑒 𝑅𝑎𝑡𝑒 =
� 𝑊𝑒𝑖𝑔ℎ𝑡
8.34 𝑙𝑏𝑠𝑔𝑎𝑙�
𝑇𝑖𝑚𝑒 �1 𝑚𝑖𝑛60 𝑠𝑒𝑐�
[4-4]
As shown in Equation [4-2], the weight was divided by the specific gravity of water to
obtain the volume. This volume was then divided by the time it took to collect the water
which gave the leakage rate in gallons per minutes (gpm) shown in Equation [4-4]. The
weight of the water was measured by pouring it into another container positioned on a

56
scale. The data was collected and assembled in a spreadsheet to obtain the final
values for the leakage rate so they could be compared.
4.3 - Results/Discussion
The results for the leakage rates are shown in Table 4-2. This table summarizes
the results of these tests in the following ways. Each plug pressure has a total of four
different leakage rates, one for each respective tunnel pressure obtained from Table
4-1. These leakage rates are the result of an average of three separate leakage
readings for each tunnel pressure. The pressure differential was calculated by taking
the difference between the plug and tunnel pressures. The leakage results for each
tunnel lining were graphed and displayed in Figure 4-1, Figure 4-2, and Figure 4-3. The
scales on each graph are kept the same for comparison purposes.
It can be observed in each graph that the leakage rate decreases when the
pressure differential between the plug and tunnel increases. This is an expected result.
A larger pressure differential means that the plug and tunnel pressures are further from
each other. When this differential increases, the plug is able to exert more force on the
tunnel walls which seals the contact surface better and therefore the water in the tunnel
is not able to flow around the plug. This trend is observed across all tunnel linings
indicating that it is independent of the tunnel lining material.

57
Table 4-2 Leakage rate test results
Concrete Neoprene Vinyl
Plug Pressure
(psi)
Tunnel Pressure (% of Plug Pressure)
Tunnel Pressure
(psi)
Pressure Differential
(psi) Leakage
Rate (gpm) Leakage
Rate (gpm) Leakage
Rate (gpm) 5 20% 1 4 0.21 0.11 0.08 5 40% 2 3 0.31 0.40 0.23 5 60% 3 2 0.41 0.75 0.36 5 80% 4 1 0.54 0.94 0.49
10 20% 2 8 0.25 0.27 0.17 10 40% 4 6 0.39 0.57 0.32 10 60% 6 4 0.28 0.81 0.42 10 80% 8 2 0.68 1.09 0.54 15 20% 3 12 0.23 0.29 0.21 15 40% 6 9 0.48 0.53 0.34 15 60% 9 6 0.65 0.76 0.47 15 80% 12 3 0.84 1.04 0.61 20 20% 4 16 0.33 0.29 0.19 20 40% 8 12 0.52 0.53 0.32 20 60% 12 8 0.73 0.76 0.44 20 80% 16 4 0.94 1.04 0.60 25 20% 5 20 0.35 0.30 0.20 25 40% 10 15 0.58 0.53 0.33 25 60% 15 10 0.79 0.77 0.46 25 80% 20 5 1.04 1.06 0.62 30 20% 6 24 0.37 0.31 0.23 30 40% 12 18 0.61 0.53 0.36 30 60% 18 12 0.84 0.79 0.49 30 80% 24 6 1.10 1.15 0.65 35 20% 7 28 0.39 0.31 0.31 35 40% 14 21 0.63 0.54 0.44 35 60% 21 14 0.87 0.83 0.58 35 80% 28 7 1.16 1.31 0.76
Average Leakage at 80% of Plug
Pressure 0.90 1.09 0.61

58
Figure 4-1 Pressure differential vs. leakage rate for concrete
Figure 4-2 Pressure differential vs. leakage rate for neoprene
0.00
0.20
0.40
0.60
0.80
1.00
1.20
1.40
0 5 10 15 20 25 30
Leak
age
Rate
(gpm
)
Pressure Differential (psi)
5
10
15
20
25
30
35
Plug Pressure
(psi)
0.00
0.20
0.40
0.60
0.80
1.00
1.20
1.40
0 5 10 15 20 25 30
Leak
age
Rate
(gpm
)
Pressure Differential (psi)
5
10
15
20
25
30
35
Plug Pressure
(psi)

59
Figure 4-3 Pressure differential vs. leakage rate for vinyl
Pressure differential is not the only factor that influences the leakage rate. When
observing the aforementioned figures, it is noticed that for a given pressure differential,
the leakage rate increases as the plug pressure increases. This is indicative of higher
plug pressures causing more leakage, despite having the same pressure differentials.
Figure 4-4 shows an example of this trend with concrete lining. Since the plug pressure
must always be more than the tunnel pressure to avoid unwanted plug slippage, plotting
the tunnel pressure with respect to leakage rates was used to represent how the
leakage rate increases with increased pressures in both the tunnel and plug. As shown,
the largest tunnel pressure (consequently having the largest plug pressure) has the
largest leakage rate. All linings follow this general trend.
0.00
0.20
0.40
0.60
0.80
1.00
1.20
1.40
0 5 10 15 20 25 30
Leak
age
Rate
(gpm
)
Pressure Differential (psi)
5
10
15
20
25
30
35
Plug Pressure
(psi)

60
Figure 4-4 Tunnel pressure vs. leakage rate for concrete lining
To gain a better understanding of how the different tunnel linings performed
against each other, a common tunnel pressure was compared. The leakage rates for
80% of the plug pressure were averaged which is shown in Table 4-2 and the results
were unexpected. It was originally hypothesized that by adding a compressible material
that could fill any voids between the plug and tunnel would decrease leakage. The
compressible neoprene lining which was thought to be the best for this test actually
performed the worst with a leakage rate of 1.09 gpm. The vinyl lining actually
performed the best with the least leakage rate of 0.61 gpm. The plain concrete lining
fell between the other two with a rate of 0.90 gpm. The maximum leakage rate was
0.00
0.20
0.40
0.60
0.80
1.00
1.20
1.40
0 5 10 15 20 25 30
Leak
age
Rate
(gpm
)
Tunnel Pressure (psi)
5
10
15
20
25
30
35
Plug Pressure
(psi)

61
1.31 gpm which occurred with the neoprene lining at 35 psi plug pressure and 28 psi
tunnel pressure. The minimum leakage rate was 0.08 gpm which occurred with the
vinyl lining at 5 psi plug pressure and 1 psi tunnel pressure.
The results from these tests were also used to calculate approximate leakages
that could be expected in a larger tunnel (16 foot diameter). This diameter was chosen
since it is the size of the tunnel that will be tested in future RTP experiments.
In order to calculate the leakage rate for the 16 foot tunnel, several assumptions
had to be made. It was assumed that the velocity of leakage did not change from the
original 4 foot test to the larger scaled 16 foot test. The Bernoulli equation:
𝑝� + ��𝜌𝑉�� + 𝛾𝑧� = 𝑝� + �
�𝜌𝑉�� + 𝛾𝑧� (24) [4-5]
was used to calculate the velocity of the flow from the original data. It was assumed in
the Bernoulli equation that the heights of the flow, 𝑧� and 𝑧� were equal, therefore
cancelled. It was assumed that the velocity on the pressurized side of the tunnel,
𝑉� ,was 0 and the pressure on the open side of the tunnel, 𝑝�, was 0. These
assumptions reduced the equation to 𝑝� = ��𝜌𝑉�� which was rearranged to form
𝑉� = ����∗����
with 144 being used to convert the tunnel pressure, 𝑝� in psi, to psf. This
equation was then used to calculate the velocity for each leakage rate. The equation for
flow rate 𝑄 = 𝑉𝐴 was then used to find the leakage area, A, for each leakage rate. A
scaling factor was calculated from the ratio of the 4 foot tunnel cross sectional area to
the 16 foot tunnel cross sectional area. This resulted in ������ ������
����� �������= 16 . This scaling
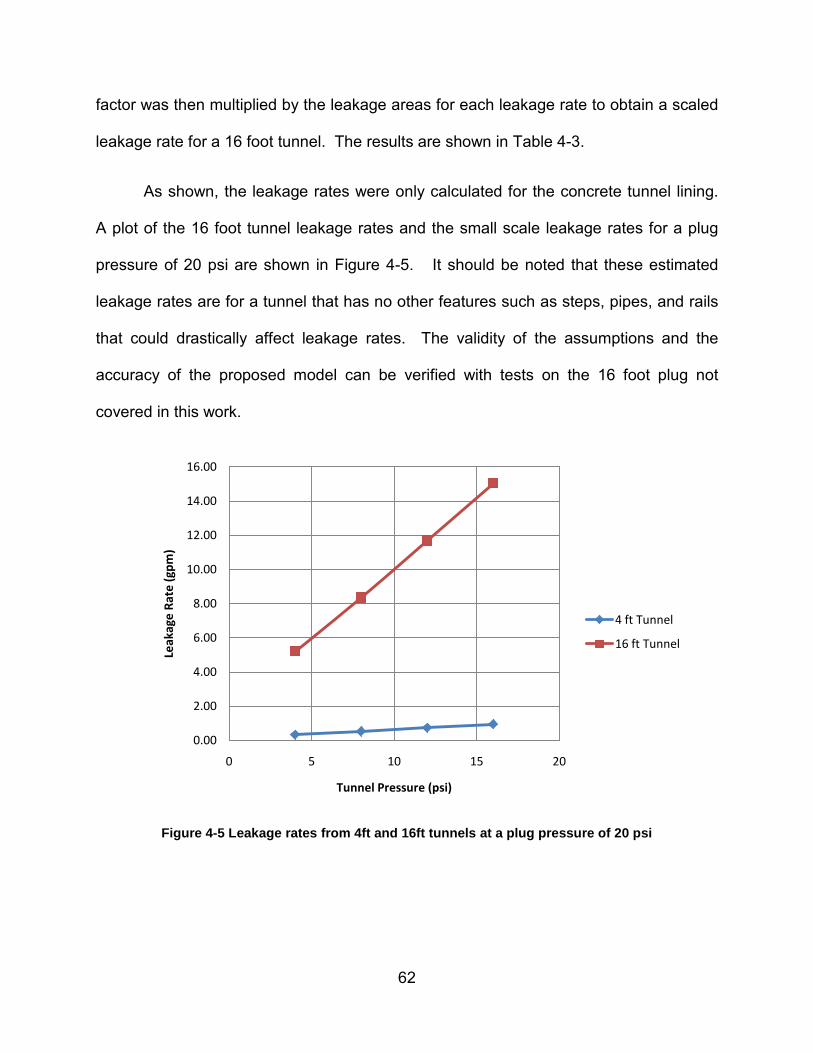
62
factor was then multiplied by the leakage areas for each leakage rate to obtain a scaled
leakage rate for a 16 foot tunnel. The results are shown in Table 4-3.
As shown, the leakage rates were only calculated for the concrete tunnel lining.
A plot of the 16 foot tunnel leakage rates and the small scale leakage rates for a plug
pressure of 20 psi are shown in Figure 4-5. It should be noted that these estimated
leakage rates are for a tunnel that has no other features such as steps, pipes, and rails
that could drastically affect leakage rates. The validity of the assumptions and the
accuracy of the proposed model can be verified with tests on the 16 foot plug not
covered in this work.
Figure 4-5 Leakage rates from 4ft and 16ft tunnels at a plug pressure of 20 psi
0.00
2.00
4.00
6.00
8.00
10.00
12.00
14.00
16.00
0 5 10 15 20
Leak
age
Rate
(gpm
)
Tunnel Pressure (psi)
4 ft Tunnel
16 ft Tunnel

63
Table 4-3 Estimated leakage rates for a 16 ft diameter tunnel
Concrete
Plug Pressure
(psi)
Tunnel Pressure
(% of Plug Pressure)
Tunnel Pressure
(psi)
Pressure Differential
(psi)
Tested 4 ft
Leakage Rate
(gpm) Velocity
(ft/s) Area (ft^2)
16ft Scaled
Leakage Area (ft^2)
16ft Leakage
Rate (gpm) 5 20 1 4 0.21 12.18 3.87E-05 6.20E-04 3.39 5 40 2 3 0.31 17.23 4.04E-05 6.47E-04 5.00 5 60 3 2 0.41 21.10 4.36E-05 6.98E-04 6.61 5 80 4 1 0.54 24.37 4.94E-05 7.90E-04 8.64
10 20 2 8 0.25 17.23 3.20E-05 5.12E-04 3.96 10 40 4 6 0.39 24.37 3.59E-05 5.74E-04 6.27 10 60 6 4 0.28 29.84 2.09E-05 3.34E-04 4.48 10 80 8 2 0.68 34.46 4.38E-05 7.00E-04 10.83 15 20 3 12 0.23 21.10 2.41E-05 3.86E-04 3.65 15 40 6 9 0.48 29.84 3.59E-05 5.74E-04 7.69 15 60 9 6 0.65 36.55 3.98E-05 6.37E-04 10.46 15 80 12 3 0.84 42.21 4.41E-05 7.05E-04 13.36 20 20 4 16 0.33 24.37 2.99E-05 4.79E-04 5.23 20 40 8 12 0.52 34.46 3.38E-05 5.41E-04 8.36 20 60 12 8 0.73 42.21 3.86E-05 6.18E-04 11.71 20 80 16 4 0.94 48.74 4.30E-05 6.88E-04 15.05 25 20 5 20 0.35 27.24 2.86E-05 4.58E-04 5.60 25 40 10 15 0.58 38.53 3.34E-05 5.35E-04 9.25 25 60 15 10 0.79 47.19 3.75E-05 5.99E-04 12.69 25 80 20 5 1.04 54.49 4.24E-05 6.79E-04 16.60 30 20 6 24 0.37 29.84 2.79E-05 4.46E-04 5.97 30 40 12 18 0.61 42.21 3.20E-05 5.11E-04 9.69 30 60 18 12 0.84 51.69 3.62E-05 5.79E-04 13.44 30 80 24 6 1.10 59.69 4.11E-05 6.58E-04 17.62 35 20 7 28 0.39 32.24 2.66E-05 4.26E-04 6.17 35 40 14 21 0.63 45.59 3.10E-05 4.96E-04 10.15 35 60 21 14 0.87 55.83 3.47E-05 5.56E-04 13.92 35 80 28 7 1.16 64.47 4.01E-05 6.42E-04 18.58

64
Chapter 5 - Error Analysis
5.1 - Introduction
Error analysis is defined as the study and evaluation of uncertainly in
measurements (25). All measurements made in experiments come with a degree of
uncertainty. This analysis estimates the error that could be present within the tests that
were performed. There are several types of error calculations that can be used. The
technique used in this section is called the propagation of uncertainties method. The
general formula used for this method is shown as:
∆𝑋 = ��𝜕𝑋𝜕𝑌
∆𝑌��
+ �𝜕𝑋𝜕𝑍
∆𝑍��
+ ⋯ [5-1]
where ∆𝑋 is error of the original function and ∆𝑌 and ∆𝑍 are the errors of the respective
measured values used to calculated the function (23).
5.2 - Leakage Error
To calculate the leakage error, the general equation:
𝑄 =𝑊𝑇
[5-2]
where W is weight and T is time, was used since this is basic equation used calculate
the leakage rate presented in Chapter 4. Then, putting Equation [5-2] in terms of
Equation [5-1]:
∆𝑄 = ��𝜕𝑄𝜕𝑊
∆𝑊��
+ �𝜕𝑄𝜕𝑇
∆𝑇��
[5-3]
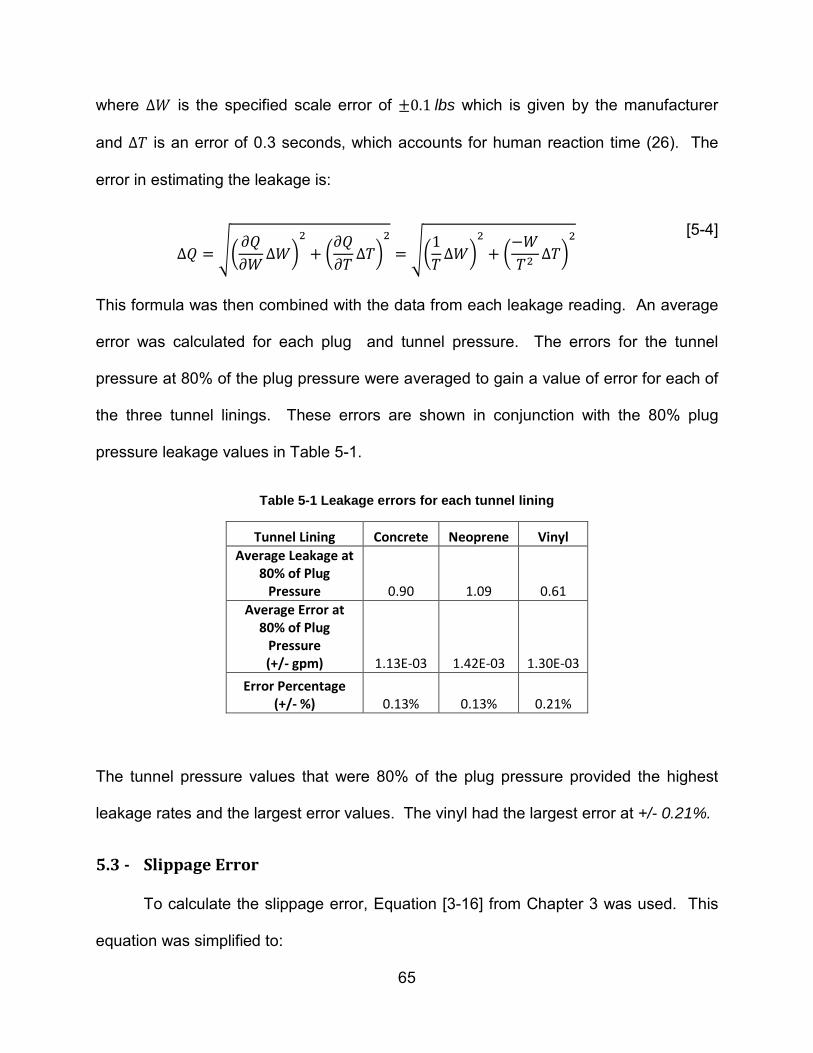
65
where ∆𝑊 is the specified scale error of ±0.1 lbs which is given by the manufacturer
and ∆𝑇 is an error of 0.3 seconds, which accounts for human reaction time (26). The
error in estimating the leakage is:
∆𝑄 = ��𝜕𝑄𝜕𝑊
∆𝑊��
+ �𝜕𝑄𝜕𝑇
∆𝑇��
= ��1𝑇∆𝑊�
�
+ �−𝑊𝑇�
∆𝑇��
[5-4]
This formula was then combined with the data from each leakage reading. An average
error was calculated for each plug and tunnel pressure. The errors for the tunnel
pressure at 80% of the plug pressure were averaged to gain a value of error for each of
the three tunnel linings. These errors are shown in conjunction with the 80% plug
pressure leakage values in Table 5-1.
Table 5-1 Leakage errors for each tunnel lining
Tunnel Lining Concrete Neoprene Vinyl Average Leakage at
80% of Plug Pressure 0.90 1.09 0.61
Average Error at 80% of Plug
Pressure (+/- gpm) 1.13E-03 1.42E-03 1.30E-03
Error Percentage (+/- %) 0.13% 0.13% 0.21%
The tunnel pressure values that were 80% of the plug pressure provided the highest
leakage rates and the largest error values. The vinyl had the largest error at +/- 0.21%.
5.3 - Slippage Error
To calculate the slippage error, Equation [3-16] from Chapter 3 was used. This
equation was simplified to:

66
𝑓 =𝑃���𝐴�𝑃���𝐴�
[5-5]
which is the ratio between the applied force from the tunnel and the applied force of the
plug as explained in Chapter 3. Then, the error for the friction can be expressed in
terms of Equation [5-1] as:
∆𝑓 = ��𝜕𝑓
𝜕𝑃���∆𝑃����
�
+ �𝜕𝑓𝜕𝐴�
∆𝐴���
+ �𝜕𝑓
𝜕𝑃���∆𝑃����
�
+ �𝜕𝑓𝜕𝐴�
∆𝐴���
[5-6]
where ∆𝑃��� and ∆𝑃��� are the errors of the pressure transducers which are accurate to
±0.25% of 0-50 psi. This gives and error of ±0.125 𝑝𝑠𝑖 for each pressure transducer.
Both ∆𝐴� and ∆𝐴� were limited by the resolution of the measuring device resulting in a
value of ±0.0625 𝑖𝑛𝑐ℎ𝑒𝑠. Since 𝐴� and 𝐴� are equal because of the constraints of the
tunnel, the error is then written as:
∆𝑓 = ��1
𝑃���∆𝑃����
�
+ �𝑃���𝑃���𝐴�
∆𝐴���
+ �−𝑃���𝑃����
∆𝑃�����
+ �−𝑃���𝑃���𝐴�
∆𝐴���
[5-7]
Equation [5-7] was then used to calculate an error for each of the friction coefficients.
An average was then found for each tunnel lining. The results are shown in Table 5-2.
Table 5-2 Friction coefficient error for each tunnel lining
Tunnel Lining Concrete Neoprene Vinyl
Average Friction Coefficient 0.172 0.154 0.176
Average Error (+/- f) 0.016 0.018 0.017
Error Percentage (+/- f) 9.30% 11.69% 9.66%

67
Both the concrete and vinyl errors are less than +/-10%. Only the neoprene showed a
larger error at +/-11.69%.

68
Chapter 6 - Conclusions and Future Work
6.1 - Leakage Testing Conclusions
The leakage testing was performed by inflating a plug within a small scale tunnel
with a specified pressure of water. A volume of water was then pressurized behind the
plug and the flow rate coming around the plug was then measured. The testing was
performed for seven different plug pressures on three different tunnel linings with the
tunnel pressures varying by a percentage of the plug pressure. These tests showed
that a compressible material like neoprene was not ideal in preventing leakage as it
allowed the largest average flow rate of 1.09 gpm while the concrete and vinyl had
values of 0.90 gpm and 0.61 gpm respectively at a tunnel pressure of 80% of the plug
pressure.
Several trends were also noted in the leakage results. The most important
trends show that as the pressure differential between the plug and tunnel increased, the
leakage rate decreased; it was also shown that the higher plug pressures (which in turn
had higher tunnel pressures) also produced higher leakage rates.
6.2 - Slippage Testing Conclusions
Friction coefficients were calculated by the slippage testing performed with the
plug and tunnel pressure differentials. The plug was inflated to as close to possible to
several predefined pressures. The tunnel pressure was then brought as close as
possible to the plug pressure until slippage occurred. The difference in the tunnel and
plug pressures were then used to find the friction coefficient for three different tunnel
linings that were tested.

69
The vinyl tunnel lining produced the largest average friction value of 0.176. The
lowest average value was the neoprene lining with 0.154. The concrete was very close
to the vinyl with an average value of 0.172. It was also found that as the plug pressure
increased, the pressure differential at which slippage occurred also increased. The
friction coefficient was also found to have an inverse relationship with the leakage rate.
As the leakage rate increased, the friction coefficient decreased, meaning that slippage
occurred easier when the leakage rate was higher. This was most likely due to the
increased flow of water around the plug creating less surface area for the plug to
contact the tunnel walls.
6.3 - Future Work
One of the most important areas for future work is to expand the number of
tunnel linings for both the leakage and slippage testing. These different surfaces would
give a wider variety of friction coefficients and leakage trends that could be associated
for any tunnel. Various concrete surfaces with a different roughness would be
especially valuable as that is the material used in most tunnels.
Most tunnel sections always contain some features such as side steps, pipes,
track rails, or other miscellaneous items. Additional testing for both leakage and
slippage with these features present in the tunnel would be very helpful. By performing
these small scale tests using scaled features, a much more accurate measurement of
leakage rate could be obtained since the plug is not capable of completely sealing
around these items. The friction coefficient calculated from the slippage data would
also provide more accurate results due to the decreased surface area that may not be
touching the tunnel walls.

70
It was observed in the leakage tests that the plug did not always inflate the exact
same way within the tunnel. This was due to the plug being slightly oversized to make
sure it was always in contact with the tunnel. Some tests had to be stopped and
restarted from initial inflation so that the orientation could be adjusted. These
stoppages indicated that there was a possibility that the plug might have larger wrinkles
allowing more leakage around the plug. More trials from initial inflation would help to
see if this was indeed a problem. A larger number of trials would give a more accurate
representation of the average leakage across the pressure ranges.
Another method of measuring the leakage rate would also be preferred for future
testing. The method used in these tests was slow and time consuming requiring post
processing and other calculations. A flow meter able to be connected to the tunnel
would make the data collection process quicker and easier so a larger number of trials
could be performed.
A more accurate way of measuring when the plug moves during the slippage
tests is also an item of future work. This could be accomplished by using laser sensors
to measure displacement to gain a better understanding of how the plug slides within
the tunnel. Due to the efforts to minimize plug damage, the trials for the friction data
had to be very limited. For future design evaluations, more data for this area is certainly
needed to confirm plug length depending on the friction surface of the tunnel.

71
References
1. L'Garde. Inflatable Space Structures. Cited: March 23, 2011.
http://www.lgarde.com/index.htm.
2. Cadogan, D., Sandy, C. and Grahne, M. Development and Evaluation of the Mars
Pathffinder Inflatable Airbag Landing System. 49th International Astronautical Congress.
1998.
3. Cadogan, David, et al. Intelligent Flexible Materials for Deployable Space Structures
(InFlex). ILC Dover LP. 2006.
4. Hanlon, Mike. Inflatable composite structures enable lightweight transportable
buildings. 2005, http://www.gizmag.com/go/4017/.
5. Mills, Warwick. Inflatable Systems Military and Defense Applications. Cited Online:
March 23, 2011. http://www.warwickmills.com/Inflatables/Inflatable-Systems.aspx.
6. Dover, ILC. Lighter Than Air Structures. Cited Online: March 23, 2011.
http://www.ilcdover.com/Lighter-Than-Air-Structures/.
7. Humphrey, Hubert H. About the Metrodome. Cited Online: March 23, 2011.
http://www.msfc.com/about.cfm.
8. Syracuse University Athletics. History of the Carrier Dome. Cited Online: March 23,
2011. http://suathletics.syr.edu/sports/2009/2/3/GEN_0203090820.aspx.
9. Inflatable Plug Bag for Testing Plumbing. Patent. 1949.
72
10. Petersen. Peterson Companies. Cited Online: March 23, 2011.
http://www.pipeplug.com/aboutus.html.
11. Inouye, Randall R. The Great Chicago Flood of 1992. 1992, Civil Engineering—
ASCE, Vol. 62, pp. 52-55.
12. Inflatable Apparatus for Sealing a Pipeline. Patent. 1999.
13. Petersen. Miscellaneous Line Stop Case Studies. Cited Online: March 23, 2011.
http://www.pipeplug.com/misc_line_stop_case_studies.html.
14. Firetactics. KINGS CROSS FIRE - LONDON 2007 from the LONDON FIRE
JOURNAL. Cited Online: March 23, 2011.
http://www.firetactics.com/KINGSCROSS.htm.
15. Lindstrand. Inflatable Tunnel Plugs. Cited Online: March 23, 2011.
http://www.lindstrandtech.com/innovation_centre.html.
16. Petersen. An Inflatable Tunnel Seal Stops Flooding of World's Largest
Undeveloped Uranium Mine. Cited Online: March 23, 2011.
http://www.pipeplug.com/case_study_camecos_cigar_lake_flooding_remediation.html.
17. Parker, Doug J. Transit Cooperative Research Program Synthesis 80 Transit
Security Update. 2008.
18. TSA. TSA Collaborates on Resilient Tunnel Project. [Online] [Cited: March 23,
2011.] http://www.tsa.gov/weekly/062909.shtm.
73
19. Going Underground: Homeland Security Works on Tool to Prevent Tunnel
Disasters. Fox News. [Online] September 5, 2008. [Cited: March 23, 2011.]
http://www.foxnews.com/story/0,2933,417461,00.html.
20. Weadon, Timothy L. Master's Thesis. Long Term Loading and Additional Material
Properties of Vectran Fabric for Inflatable Structure Applications. West Virginia
University. 2010.
21. International, ASTM. Standard Test Method for Static and Kinetic Coefficients of
Friction of Plastic Film and Sheeting. ASTM D1894.
22. Molina, Juan C. Master's Thesis. Mechanical Characterization of Fabrics for
Inflatable Structures. West Virginia University. 2008.
23. ICRI (International Concrete Repair Institute). Guideline for Selecting and
Specifying Concrete Surface Preparation for Sealers, Coatings, and Polymer Overlays.
1997.
24. Young, Donald F., et al. A Brief Introduction to Fluid Mechanics. [ed.] Lea Radick.
4th. s.l. : John Wiley & Sons, Inc., 2007.
25. Taylor, John R. An Introduction to Error Analysis: The Study of Uncertainties in
Physical Measurements. [ed.] 2nd. s.l. : University Science Books, 1997.
26. Kosinski, Robert J. A Literature Review on Reaction Time. [Online] September
2010. [Cited: April 8, 2011.]
http://biae.clemson.edu/bpc/bp/Lab/110/reaction.htm#Type%20of%20Stimulus.

74
Appendix A - Pressure Transducer Documentation

75
Appendix B - Scale Documentation

76
Appendix C - Pump Curve Documentation
High flow, low pressure pump curve
Low flow, high pressure pump curve

77
Appendix D - Neoprene Specifications
Material Type Weather-Resistant Neoprene/EPDM/SBR
Foam Rubber
Texture Type Fine Cell
Shape Sheets, Bars, and Strips
Foam Firmness
Extra Soft
Backing No Backing
Firmness, psi 2-5 (25% Deflection)
Thickness 1/2"
Compression Recovery
Fair
Thickness Tolerance
±0.040"
Color Black
Length 6' Finish Textured
Length Tolerance ±2-1/2" Tolerance Standard
Width 42"
Specifications Met
American Society for Testing and
Materials (ASTM), Military
Specifications (MIL),
Underwriters Laboratories
(UL)
Width Tolerance ±1-1/4"
ASTM Specification
ASTM D1056
Temperature Range
-40° to +200° F
MIL Specification
MIL-C-3133C, MIL-STD-
670B Density 4-8 lbs./cu. ft.
UL
Specification UL 94HF1
Foam Structure Closed Cell
Properties Weather Resistant,
Flame Resistant
Notes Material does not have a
skin

78
Appendix E - Slippage Data
0
0.1
0.2
0.3
0.4
0.5
0.6
0.7
0.8
0
1
2
3
4
5
6
7
8
0 50 100 150 200 250
Disp
lace
men
t (in
)
Pres
sure
(psi
)
Time (sec)
Concrete, 5 psi Plug Pressure
Plug Pressure
Tunnel Pressure
Displacment
Displacement
Plug
Tunnel
0
0.1
0.2
0.3
0.4
0.5
0.6
0
2
4
6
8
10
12
0 50 100 150 200 250 300
Disp
lace
men
t (in
)
Pres
sure
(psi
)
Time (sec)
Concrete, 10 psi Plug Pressure
Plug Pressure
Tunnel Pressure
Displacment
Displacement
Plug
Tunnel

79
0
0.1
0.2
0.3
0.4
0
5
10
15
20
0 20 40 60 80 100 120 140 160
Disp
lace
men
t (in
)
Pres
sure
(psi
)
Time (sec)
Concrete, 15 psi Plug Pressure
Plug Pressure
Tunnel Pressure
Displacment
Displacement
Plug
Tunnel
0
0.1
0.2
0.3
0.4
0.5
0
5
10
15
20
25
0 50 100 150 200
Disp
lace
men
t (in
)
Pres
sure
(psi
)
Time (s)
Concrete, 20 psi Plug Pressure
Plug Pressure
Tunnel Pressure
Displacement
Plug
Tunnel
Displacement

80
0
0.1
0.2
0.3
0.4
0.5
0.6
0
5
10
15
20
25
30
0 50 100 150 200 250 300 350 400
Disp
lace
men
t (in
)
Pres
sure
(psi
)
Time (sec)
Concrete, 25 psi Plug Pressure
Plug Pressure
Tunnel Pressure
DisplacmentDisplacement
Plug
Tunnel
0
0.05
0.1
0.15
0.2
0.25
0.3
0.35
0.4
0
1
2
3
4
5
6
7
8
0 10 20 30 40 50 60
Disp
lace
men
t (in
)
Pres
sure
(psi
)
Time (sec)
Neoprene, 5 psi Plug Pressure
Plug Pressure
Tunnel Pressure
Displacement
Displacement
Tunnel
Plug

81
0
0.1
0.2
0.3
0.4
0.5
0.6
0
2
4
6
8
10
12
0 20 40 60 80 100
Disp
lace
men
t (in
)
Pres
sure
(psi
)
Time (sec)
Neoprene, 10 psi Plug Pressure
Plug Pressure
Tunnel Pressure
Displacement
Plug
Displacement
Tunnel
0
0.1
0.2
0.3
0.4
0
5
10
15
20
0 10 20 30 40 50 60 70
Disp
lace
men
t (in
)
Pres
sure
(psi
)
Time (sec)
Neoprene, 15 psi Plug Pressure
Plug Pressure
Tunnel Pressure
DisplacementTunnel
Plug
Displacement
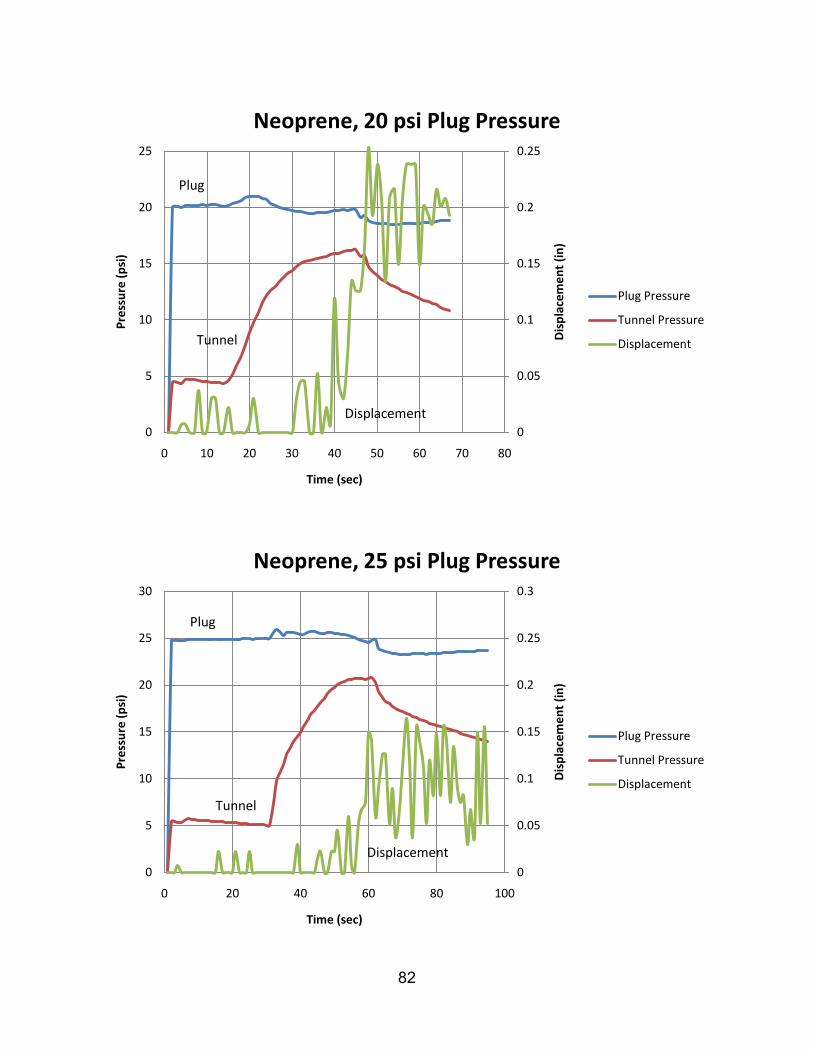
82
0
0.05
0.1
0.15
0.2
0.25
0
5
10
15
20
25
0 10 20 30 40 50 60 70 80
Disp
lace
men
t (in
)
Pres
sure
(psi
)
Time (sec)
Neoprene, 20 psi Plug Pressure
Plug Pressure
Tunnel Pressure
Displacement
Displacement
Tunnel
Plug
0
0.05
0.1
0.15
0.2
0.25
0.3
0
5
10
15
20
25
30
0 20 40 60 80 100
Disp
lace
men
t (in
)
Pres
sure
(psi
)
Time (sec)
Neoprene, 25 psi Plug Pressure
Plug Pressure
Tunnel Pressure
Displacement
Displacement
Tunnel
Plug

83
0
0.05
0.1
0.15
0.2
0.25
0.3
0.35
0.4
0
1
2
3
4
5
6
7
8
0 20 40 60 80 100 120
Disp
lace
men
t (in
)
Pres
sure
(psi
)
Time (sec)
Vinyl, 5 psi Plug Pressure
Plug Pressure
Tunnel Pressure
Displacement
Displacement
Tunnel
Plug
0
0.1
0.2
0.3
0.4
0.5
0.6
0
2
4
6
8
10
12
0 20 40 60 80 100
Disp
lace
men
t (in
)
Pres
sure
(psi
)
Time (sec)
Vinyl, 10 psi Plug Pressure
Plug Pressure
Tunnel Pressure
Displacement
Plug
Displacement
Tunnel

84
0
0.1
0.2
0.3
0.4
0
5
10
15
20
0 10 20 30 40 50 60 70 80
Disp
lace
men
t (in
)
Pres
sure
(psi
)
Time (sec)
Vinyl, 15 psi Plug Pressure
Plug Pressure
Tunnel Pressure
DisplacementTunnel
Plug
Displacement
0
0.1
0.2
0.3
0.4
0.5
0
5
10
15
20
25
0 10 20 30 40 50 60 70
Disp
lace
men
t (in
)
Pres
sure
(psi
)
Time (sec)
Vinyl, 20 psi Plug Pressure
Plug Pressure
Tunnel Pressure
Displacement
Tunnel
Plug
Displacement
Recommended


![SINKING SHAFTS – VENTILATION AND HYGIENE CHALLENGES - … Shafts - Vent... · – Column design friction factor –Atkinson [K] = 0.0025 Ns2/m4 – Column design leakage factor](https://img.pdfslide.us/doc/110x75/5e1836bc457d3d4fd1764220/sinking-shafts-a-ventilation-and-hygiene-challenges-shafts-vent-a-column.jpg)