Free PowerPoint SamplesBy Impress TrainingFor National Environment Agency

Style Guide1
Content2 Libraries
3 Before & After
4 Extras
5 + Older Samples

Slides Vs. ReportsGeneral concepts for better content design>
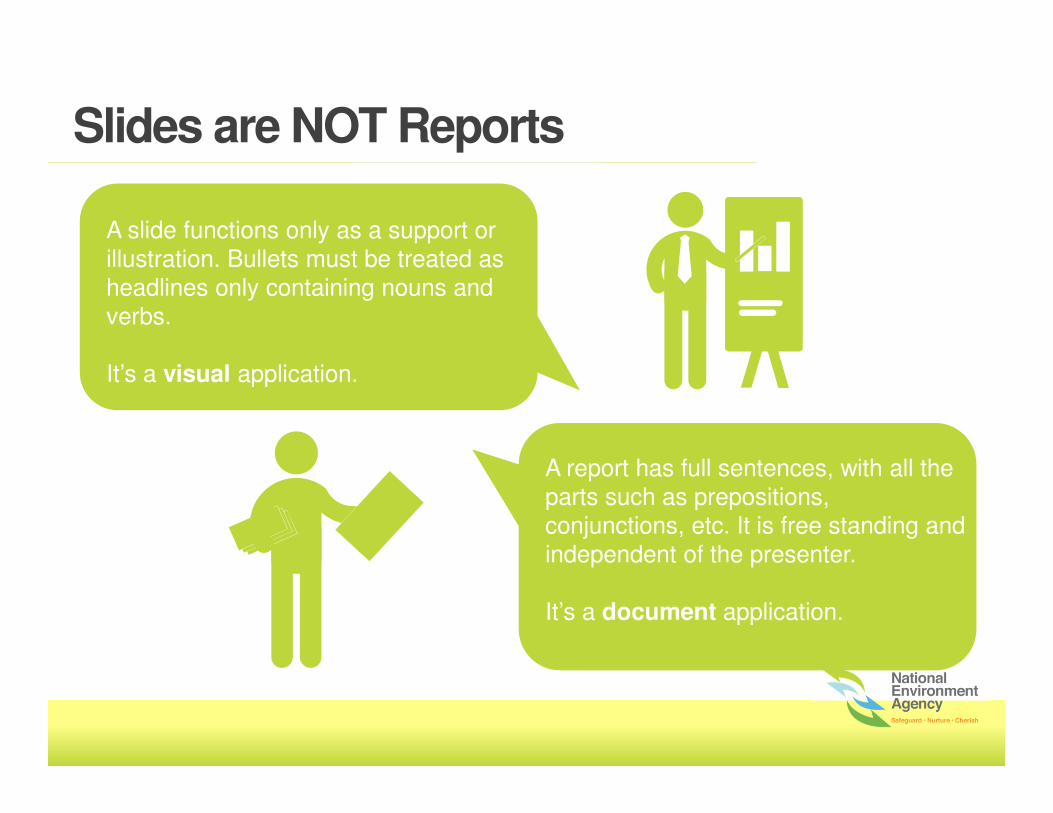
Slides are NOT Reports
A report has full sentences, with all the parts such as prepositions, conjunctions, etc. It is free standing and independent of the presenter.
It’s a document application.
A slide functions only as a support or illustration. Bullets must be treated as headlines only containing nouns and verbs.
It’s a visual application.

A possible slide process…
1
Full Documentation
Submission
In submission of “presentation material” – it is best practice to submit a full report to have all
information approved.
2 3
Extract all the “key information” and summarise it. Doing so cuts down unnecessary clutter and
gets to the key messages,
Deliver the key messages. Slides are there only to help “visualise” what presenters
cannot “verbalize”.
Cut the report down to key points
Slides are created to illustrate key points

SmallerFont
Amount of information
LessAnimation
LightBackground
MoreExplanation
MoreData
BiggerFont
MoreAnimation
DarkBackground
LessExplanation
LessData
Handout Meeting Email Presentation Platform

Further Reading

Further Reading

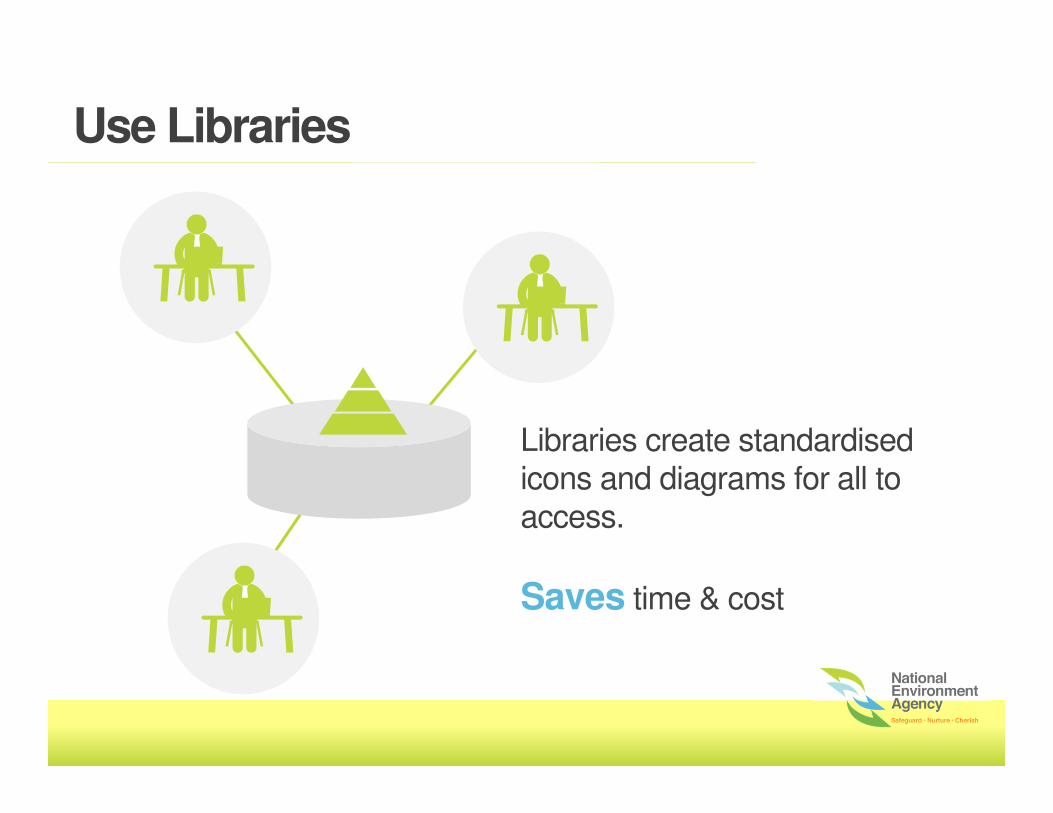
Use Libraries
Use Libraries to reduce redundancy at work or duplication of activities.
Time & Cost is wasted.
i.e. drawing similar diagram or icons
Use Libraries
Libraries create standardised icons and diagrams for all to access.
Saves time & cost

An example of a company library - ZF
https://ci-portal.zf.com/ciportal/content/en/media/office_media/ppt/ppt_template_manual.jsp
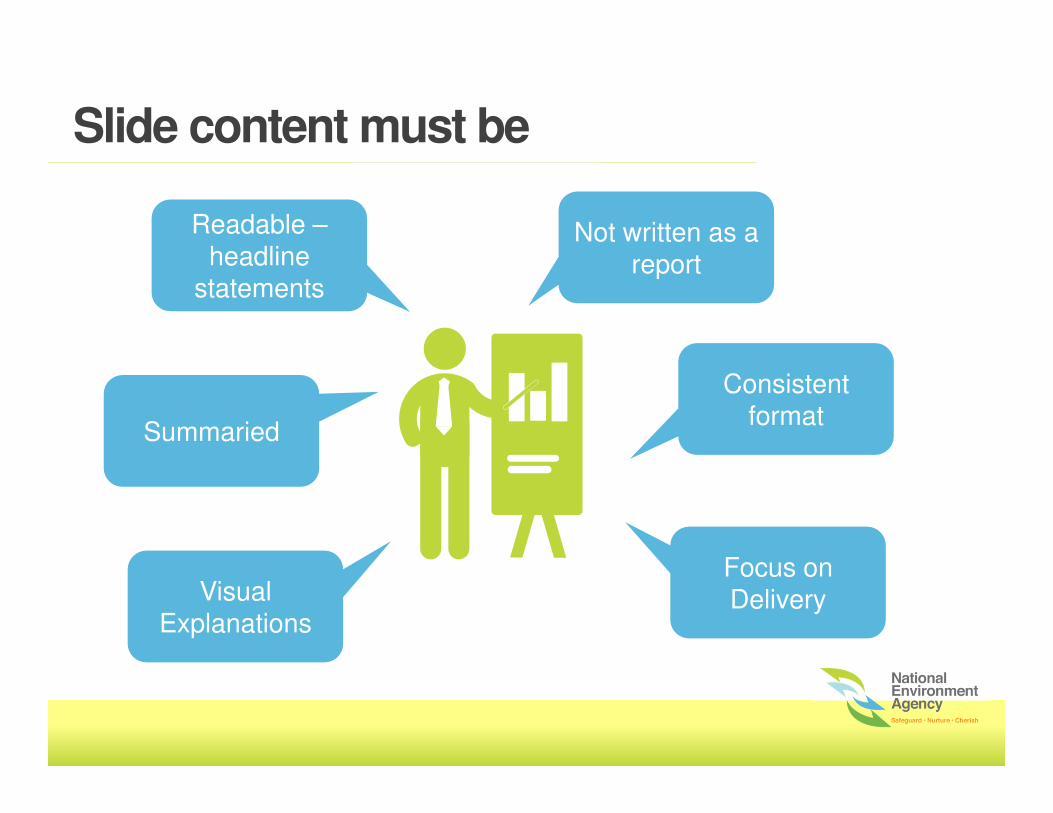
Slide content must be
Consistent format
Readable –headline
statements
Summaried
Visual Explanations
Not written as a report
Focus on Delivery

Enforcement
1. Today, 10 Environment Health officers went to 30 Hawker stalls
around the island.
2. Of those, seven were fined due to lack of hygiene standards.
3. The fines ill amount to S$2000 each.
10 30
7Should be delivered verbally
Should be delivered verbally

Enforcement
Environment Health Officers
10 30Hawker Stalls
7
Fined because of hygiene standards
S$2000Per fine
Style GuideGeneral formatting and colouring1

Lime
R = 190
G = 215
B = 59
R =89
G = 183
B = 221
R =175
G = 223
B = 228
R = 245
G = 130
B = 35
R = 103
G = 49
B = 5
Green
R = 116
G = 183
B = 73
NEA Logo / Brand Colours

Dashed line borders with a light neutral grey
• Green as the main top
hierarchy level of the diagram
• White text
• Lime as the subset hierarchical
level of the diagram
• White text
• Grey or Orange as the final hierarchical level of the diagram
• Black text
Using colours for diagrams
• Green as the main top
hierarchy level of the diagram
• White text
• Lime as the subset hierarchical
level of the diagram
• White text
• Grey or Orange as the final hierarchical level of the diagram
• Black text
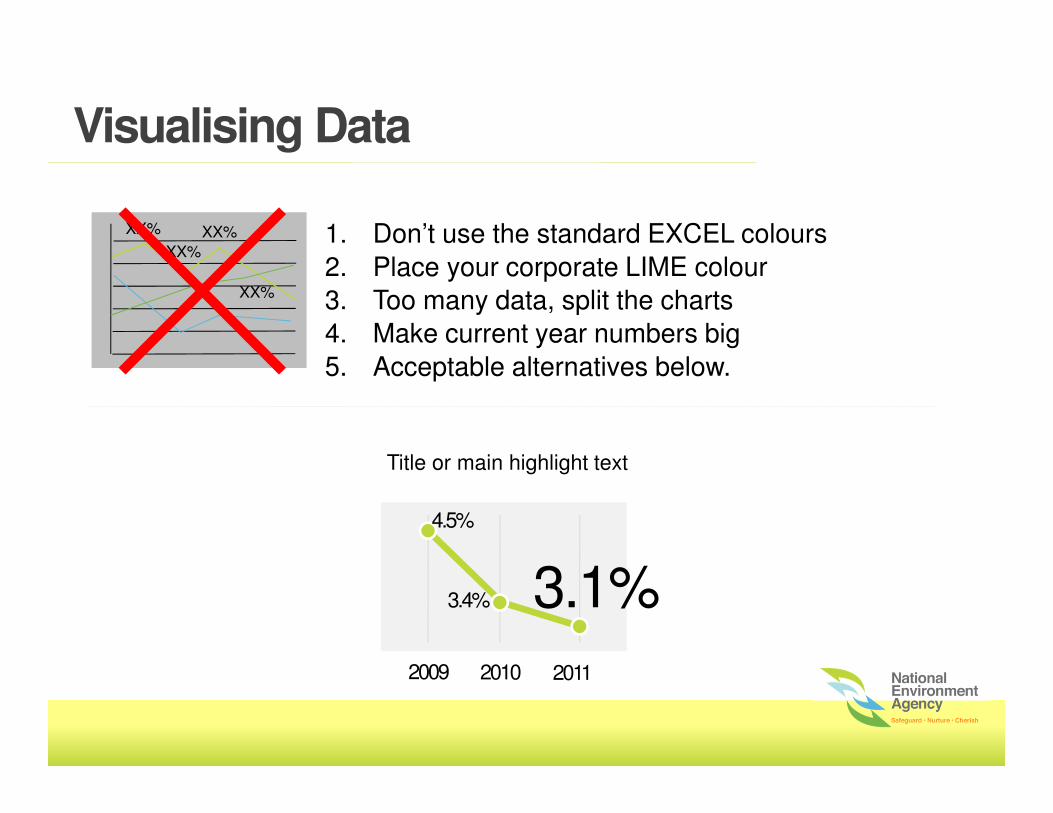
Title or main highlight text
3.1%3.4%
4.5%
2009 2010 2011
1. Don’t use the standard EXCEL colours
2. Place your corporate LIME colour
3. Too many data, split the charts
4. Make current year numbers big
5. Acceptable alternatives below.
XX%
XX%
XX%
XX%
Visualising Data
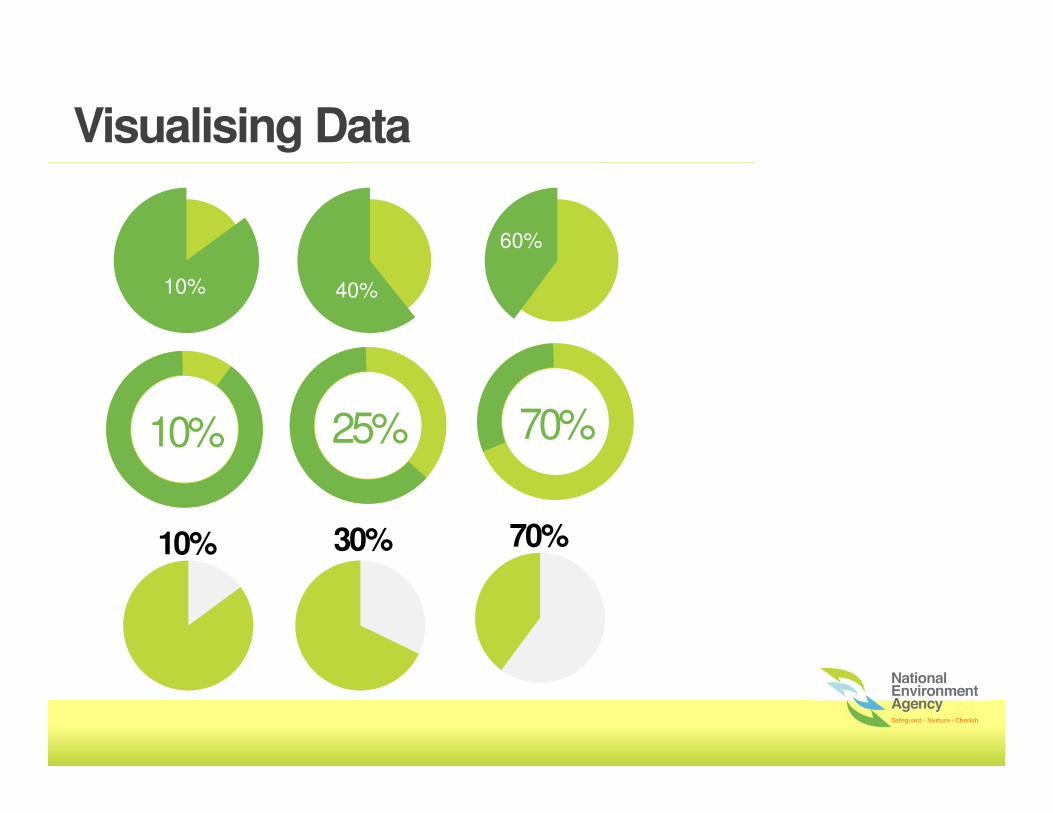
Visualising Data
10% 25% 70%
10% 40%
60%
10% 30% 70%

1. Cut content to the key message.
2. Visualise data and information where possible
3. Presentations are a 1:Many experience.
4. Readability is critical and should kept to a minimum and use
consistent formatting (arrangement of data)
or
Cut
Content
Visualise 1:Many Media Readability
Just the key message.
Use infographics Presentations are not reports and use 3 senses compared to just 1
Consistent formatting for improved readability
Visualising Information
Visualising Information
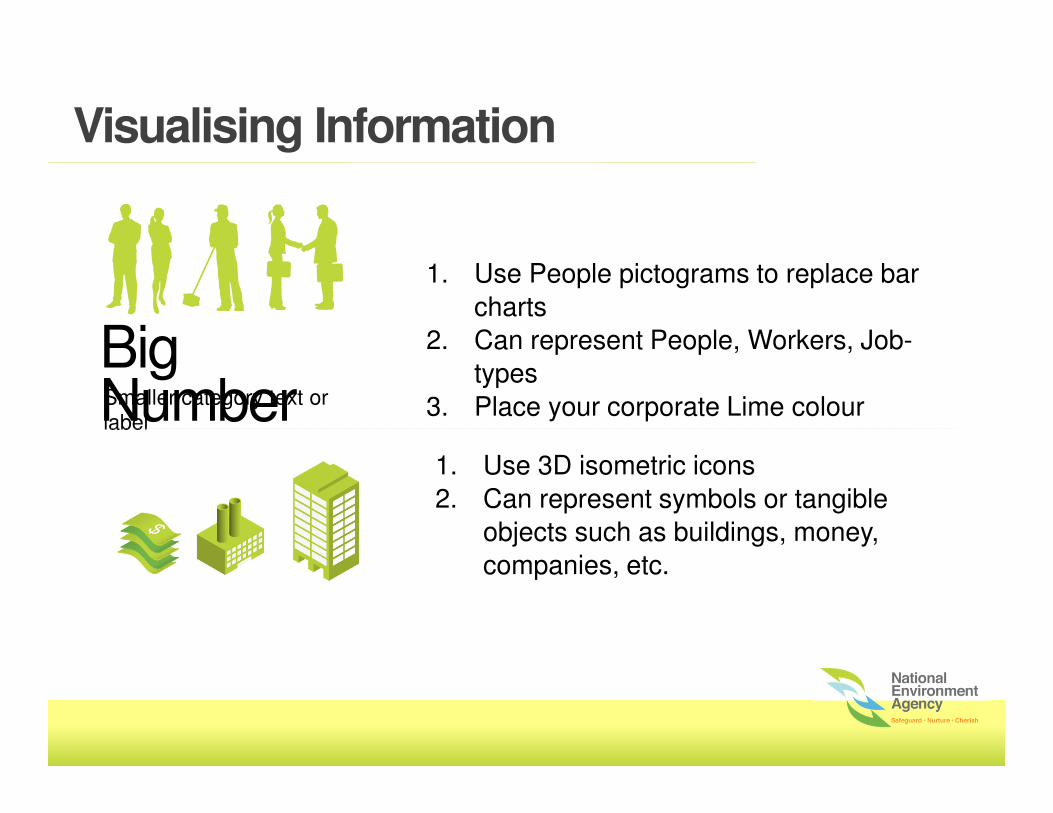
Big NumberSmaller category text or label
1. Use People pictograms to replace bar
charts
2. Can represent People, Workers, Job-
types
3. Place your corporate Lime colour
1. Use 3D isometric icons
2. Can represent symbols or tangible
objects such as buildings, money,
companies, etc.

Enforcement
1. Today, 10 Environment Health officers went to 30 Hawker stalls
around the island.
2. Of those, seven were fined due to lack of hygiene standards.
3. The fines ill amount to S$2000 each.
10 30
7

Enforcement
Environment Health Officers
10 30 Hawker Stalls
7
Fined because of hygiene standards
S$2000Per fine

Quick Reference LibrariesGeneral icons in NEA style2


Sample NEA Icon Library


Before & After slidesMakeovers including extra alternatives3

Domestic & trade waste 4,050 tonnes/day
Non-domestic waste 3,120 tonnes/day
Waste Output : 7,170 tonnes/day
43.5%56.5%
Domestic Vs Non-domestic Waste (2008)

43.5%
56.5%
Domestic & trade waste4050 tonnes/ day
Non-Domestic waste
3120 tonnes/ day
Domestic Vs. Non-domestic Waste

Waste-to-Resource Loop
Waste-to-Energy
CollectionLandfill
Consumers
Commercial & Retail
Residential
Producers
Factories & Industries
Waste Generated
Waste Recycled
(58%)
IncinerableWaste(40%)
Non-IncinerableWaste(2%)
Ash
Electricity
Reduce Reuse
Recycle
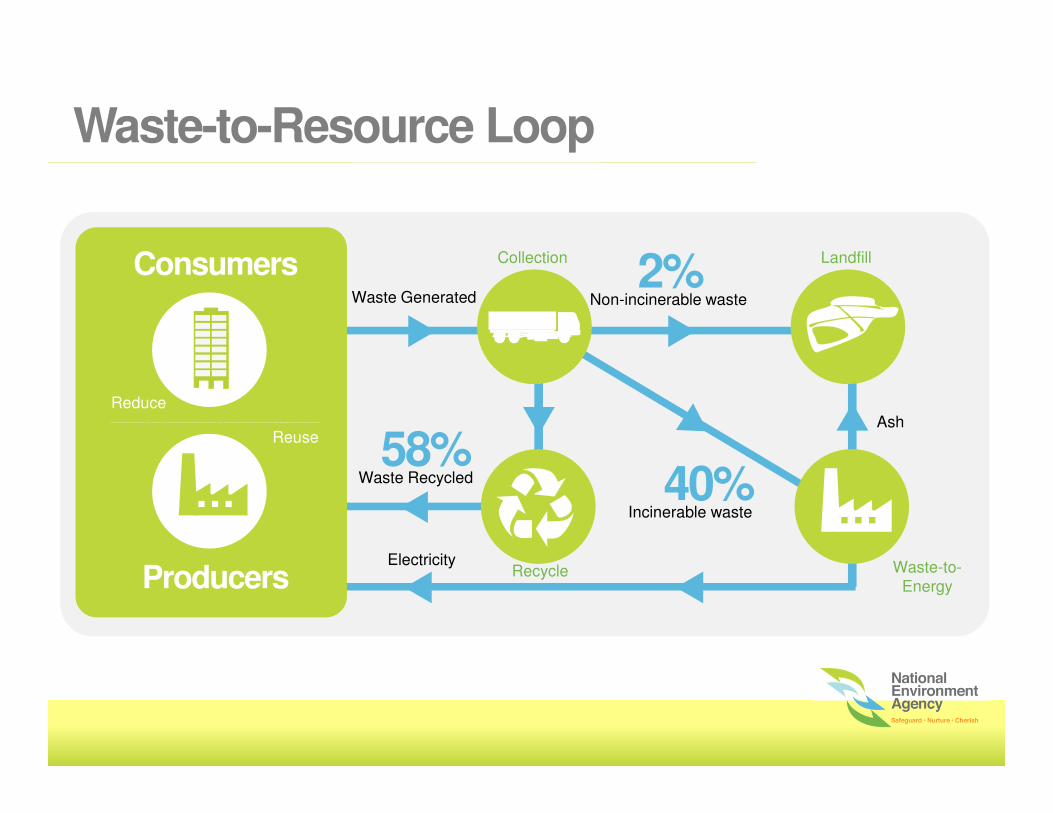
Waste-to-Resource Loop
2%Non-incinerable waste
Consumers
Producers
Ash
40%Incinerable waste
58%Waste Recycled
Waste Generated
ElectricityRecycle
Collection Landfill
Waste-to-Energy
Reduce
Reuse

A.C.T.I.O.N. @ PCF (Activity Content Targeted to Instill environmental Ownership and Nurture @ PCF)
� First programme roll-out to target at the PCF students
in Central Singapore.
� Aim to encourage children to kick-start their
environmental friendly lifestyle including dengue
prevention, 3Rs, litter-free and so on
� Educational package which consists of an activity
booklet and a color pencil set is specially designed to
instill good environmental practices among young
children and to encourage them to take ownership in
dengue prevention
Existing Dengue Prevention Programme
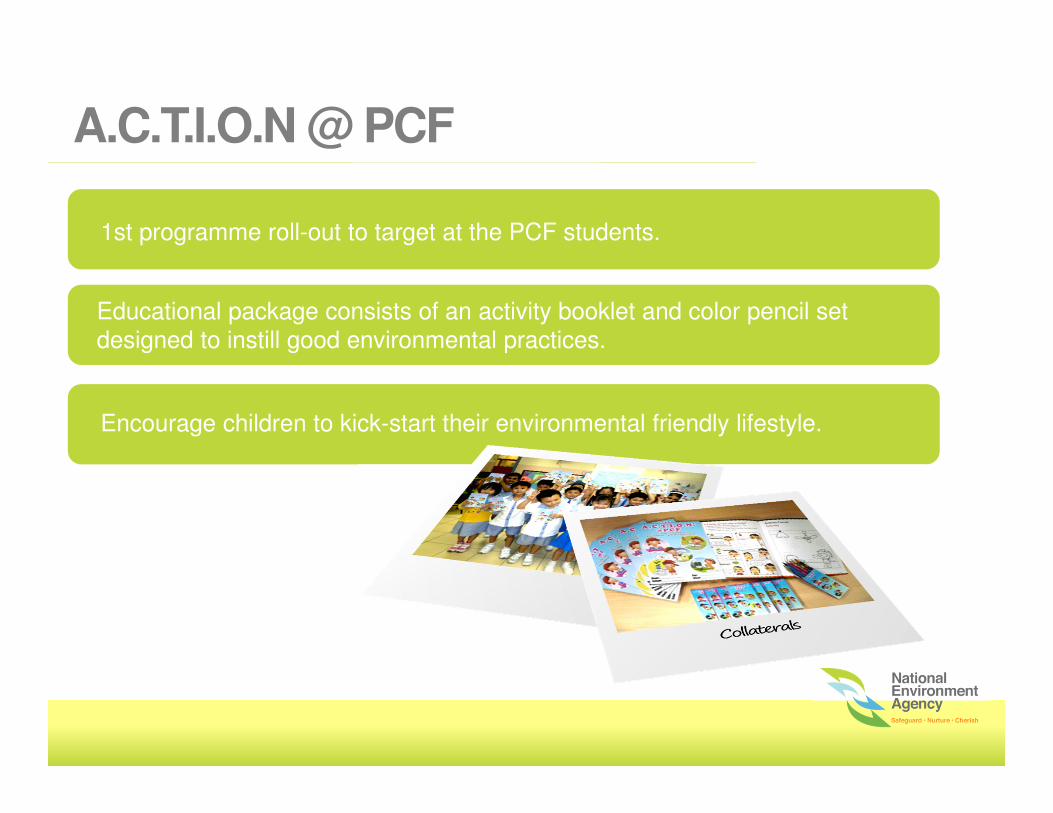
A.C.T.I.O.N @ PCF
1st programme roll-out to target at the PCF students.
Encourage children to kick-start their environmental friendly lifestyle.
Educational package consists of an activity booklet and color pencil set designed to instill good environmental practices.

A.C.T.I.O.N @ PCF
1st programme roll-out to target at the PCF students.
1
Educational package consists of an activity booklet and color pencil set designed to instill good environmental practices.
2
Encourage children to kick-start their environmental friendly lifestyle.
3

3R FUND
• The $8-million 3R Fund was launched on 22 April 2009 by Minister (Environment and Water Resources), Dr Yaacob Ibrahim, to co-fund projects that could reduce the amount of waste disposed.
• Projects that qualified for funding included those involving a redesign of production processes and packaging, as well as projects that dealt with the provision of recycling infrastructure and equipment.A total of 73 applications were received, and 15 projects were selected for implementation. This amounted to a total grant of $4.4 million, and a projected 49,800 tonnes of waste to be recycled.
• The 3R Fund complemented the $20-million Innovation for Environmental Sustainability (IES) Fund, which was set up in 2001 to encourage and assist industries to undertake innovative environmental projects that possessed commercialisation potential and would help to achieve environmental sustainability.
• To date, more than 13 companies have been granted funding support to test-bed new techniques or innovative methods to turn recyclables into marketable materials.
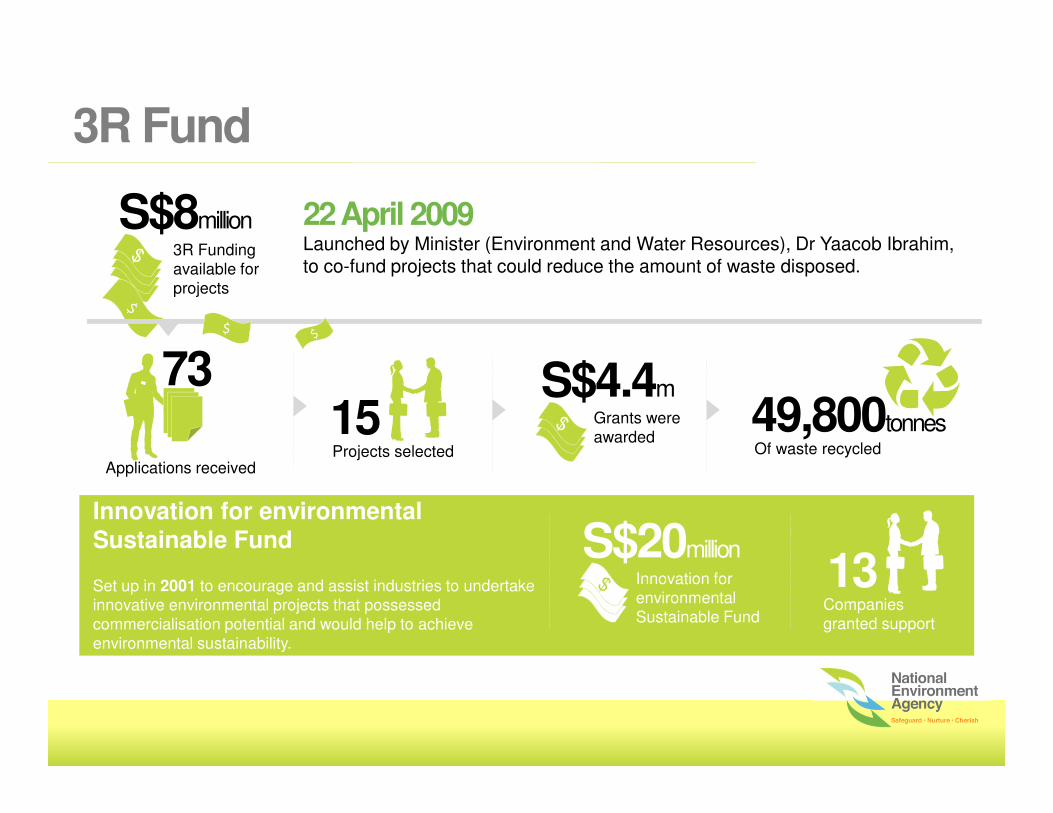
3R Fund
3R Funding available for projects
S$8million
73
Applications received
Grants were awarded
S$4.4m
15Projects selected
49,800tonnesOf waste recycled
22 April 2009 Launched by Minister (Environment and Water Resources), Dr Yaacob Ibrahim, to co-fund projects that could reduce the amount of waste disposed.
Innovation for environmental Sustainable Fund
S$20million
Innovation for environmental Sustainable Fund
Set up in 2001 to encourage and assist industries to undertake innovative environmental projects that possessed commercialisation potential and would help to achieve environmental sustainability.
13Companies granted support

Measures to improve waste minimisation and recycling for businesses
• For businesses, we will strengthen voluntary partnerships. For a start, a second SPA will
be launched in July 2012 with new targets to reduce packaging waste by 6,500 tons
annually, and to bring on board a total of 315 signatories by 2015. A total of 138 signatories
have expressed interest to participate in the second SPA. The first SPA, which commenced
in 2007, achieved a reduction of 7,100 tons of packaging waste with an estimated $14.9
million in savings over a four-year period and had 139 signatories
• Measures targeted specifically at large commercial premises will also come into effect to
enhance the 3Rs. Hotels with more than 200 rooms and shopping malls with net lettable
areas of more than 50,000 square feet, are required by law to report waste data and submit
waste reduction plans (including setting of targets) from 2014. Such a reporting exercise
would help build greater awareness among building managers to improve their premises’
waste management systems.
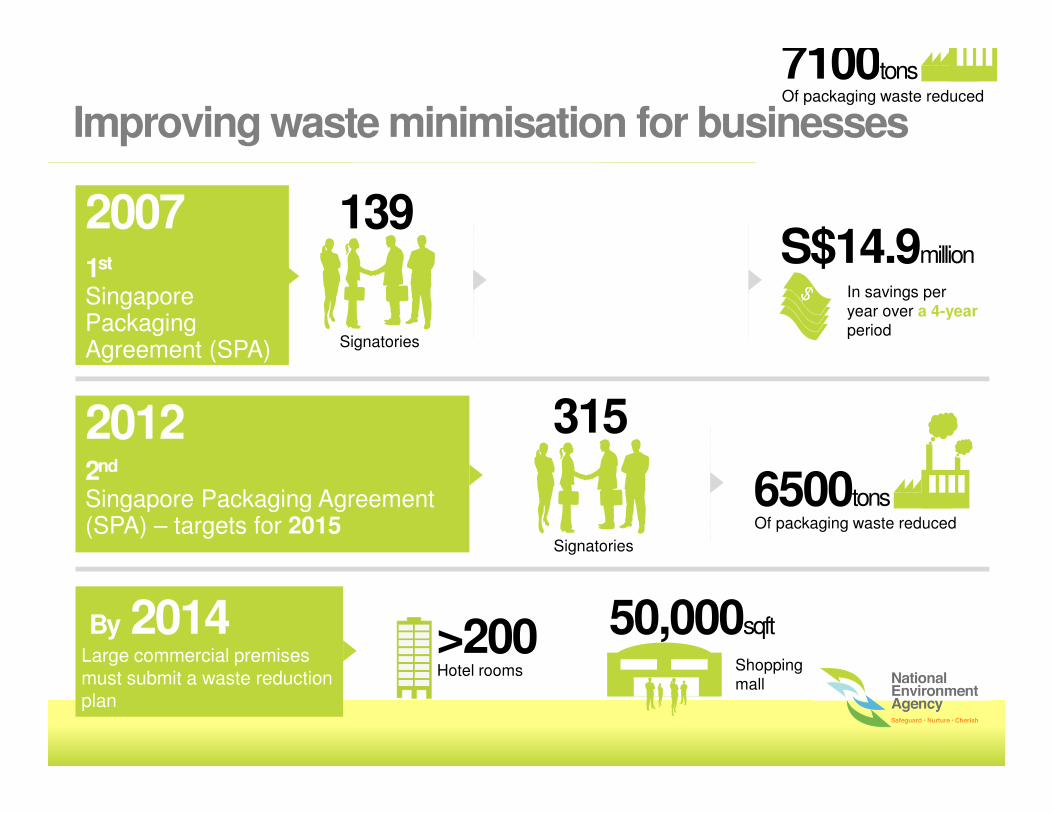
Improving waste minimisation for businesses
Signatories
139
7100tonsOf packaging waste reduced
S$14.9million
In savings per year over a 4-year period
20071st
Singapore Packaging Agreement (SPA)
20122nd
Singapore Packaging Agreement (SPA) – targets for 2015
Signatories
315
6500tonsOf packaging waste reduced
>200Hotel rooms
50,000sqft
Shopping mall
By 2014Large commercial premises must submit a waste reduction plan

INCREASED FREQUENCY OF CHECKS AT FOOD OUTLETS• The number of officers conducting inspections increased from 63 in January 2010 to 102 in March 2011.
• The increased manpower had allowed NEA to carry out more frequent inspections of stalls which had poorer food hygiene grades, and at premises where the standards of cleanliness required improvement.
• Currently, hygiene officers conduct an average of 250 inspections daily, as compared to 193 in January 2010.
GREATER PENALTIES FOR FOOD HYGIENE-RELATED OFFENCESSince 1 April 2010, the composition fine for food hygiene-related offences had been increased as detailed in the table below.
Severity of Offence Demerit PointsComposition Fine
before 1 April 2010
Composition Fine
after 1 April 2010
Minor Offence 2 points$100
$200
Major Offence 4 points $300
Serious Offence 6 points $400

Increased Food Outlet checks in 2011
102Officers
Compared to 63 Officers in 2010
250
2011
193
2010
Daily Inspections
Greater Penalties for Food Hygiene-related offences
Severity of Offence Demerit PointsComposition Finebefore 1 April 2010
Composition Fineafter 1 April 2010
Minor Offence 2 points$100
$200
Major Offence 4 points $300
Serious Offence 6 points $400
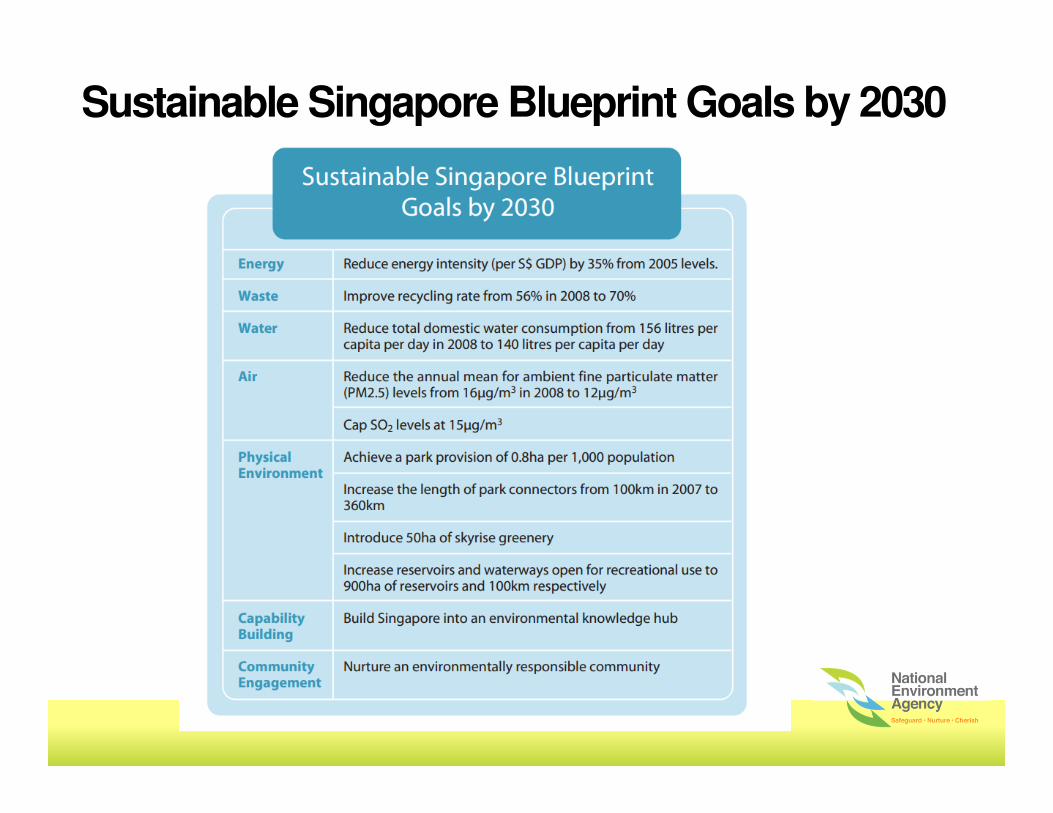
Sustainable Singapore Blueprint Goals by 2030

2030 Sustainable Singapore Blueprint Goals
EnergyReduce energy intensity by 35% from 2005 levels
WasteImprove recycling rate from 56% in 2008 to 70%
WaterReduce total domestic consumption from 156 litres per capita per day in 2008 to 140 litres per capita per day
AirReduce annual mean ambient air particles (PM2.5) levels from 16ug/m3 in 2008 to 12ug/m3
Physical EnvironmentPark connectors increased to 360km. Introduce 50ha of skyrise greenery. Increase reservoirs use to 900ha and 100km respectively
Capability BuildingBuild Singapore into an environment knowledge hub
Community EngagementNurture an environmentally responsible community

2030 Sustainable Singapore Blueprint Goals
35%Energy intensity Reduction
56%
2008
70%2030
Improve recycling rate
140litresTotal domestic water consumption
from 156 litres in 2008
ENERGY WASTE WATER
Nurture an environmentally responsible community
Build Singapore into an environment knowledge hub
COMMUNITY ENGAGEMENT
CAPABILITY BUILDING
0.8haPer 1000 population
360kmPark connectorsFrom 100km in 2007
PHYSICAL ENVIRONMENT
50haSkyrisegreenery
900haIncreased reservoir and 100km waterways for recreational use
AIR
15ug/m3
Capping SO2
levels
12ug/m3
Annual mean ambient fine particles, down from 16ug/m3 in 2008

Recycling in Condos – Status• Recycling programme launched in 2002
• Only 38% have recycling bins/bags within estate
• Placed recycling bins in public areas : helps cover another 12%
• Continual requests from various residents for recycling facilities in estate
• In 2007:
– Consulted with major stakeholders (MCST, APFM, NC, SISV, etc) in 07 to encourage recycling
– Followed up with letters and reminders to MCST
• Only slight improvement
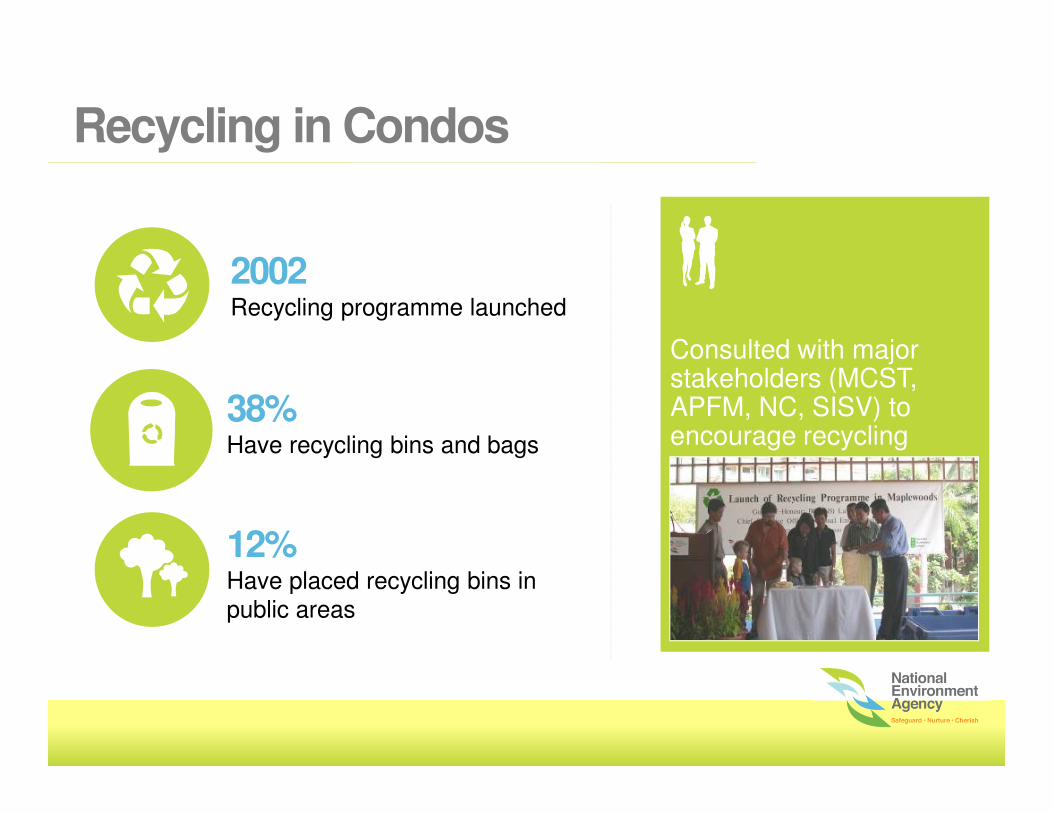
Recycling in Condos
2002Recycling programme launched
38%Have recycling bins and bags
12%Have placed recycling bins in public areas
Consulted with major stakeholders (MCST, APFM, NC, SISV) to encourage recycling

Recycling in the Domestic Sector
100%HDB & Landed properties served
38%Have recycling receptacles
87%Houses are covered –Condos not included
National Recycling Recycling in Condos
By 2008Will have mandated receptacles for recycling

What is Causing the Climate to Change?What is Causing the Climate to Change?7Enhanced Greenhouse Effect
Relative Contribution of Human-made emissions of GHGs
• Over the last 100 years, there has been a build up of GHG (e.g. CO2).
• Increase in CO2 level has enhanced the Greenhouse Effect by trapping more heat within the atmosphere, contributing to a warmer planet.
Source (Picture Left): http://www.koshland-science-museum.org.

Extra heat is kept in the air by ‘greenhouse gases’
Less heat is able to be released into space
Some sunlight is bounced back into space
What’s causing climate change?

What’s causing climate change?

Extra heat is kept in the air by ‘greenhouse gases’
Less heat is able to be released into space
Some sunlight is bounced back into space
What’s causing climate change?

� What is ‘Litter-Free’ ?
� What happens to the waste?
� Impacts of littering
� Ways to keep Singapore clean
� My Role as a ‘Litter-Free Ambassador’
� Quizzes
Contents

What is Litter Free?1
Contents
2 What happens to waste?
3 Impacts of littering
4 Ways to keep Singapore clean
5 Litter Free Ambassador
6 Quizzes

a) Fridge : Buy the smallest model refrigerator that meetsyour needs as generally, larger models use more energyto operate
b) Laptop : Consider buying a laptop for your next computerupgrade
c) Water heater : Choose an instantaneous water heater –more energy efficient
d) Thermo-flask : Use a thermo-flask to keep hot water -Electric air-pots cost about $25 a year*
e) Pressure cooker : It consumes less energy and cook faster. It saves up to 2/3 of cooking time and energy usage can be cut by 50-75%
When Purchasing
New Home Appliances

When purchasing new home appliances
FridgeBuy smaller models that meet general needs as larger models use more energy
LaptopMore convenient than buying larger PC’s
Water HeaterInstantaneous heaters are more energy efficient
Thermo-flaskKeeping water hotter, for longer
Pressure CookerConsumes less energy, costs less and cooks faster

2 Public Toilet
2.4 Sanitary FittingsNew Requirement – 2.4.2:• Where there is more than one cubicle, at least one squatting type
WC pan is to be provided.• A water tap point coupled with spring nozzle shall be provided within
every cubicle where a squatting WC pan is provided.• The cubicle, where a squatting WC pan is provided, should be
kerbed such that water will not flow out of the boundary of the cubicle. The cubicle floor shall be properly graded towards the gully trap within the cubicle.
Rationale:• Cater to cultural needs.

Minimum 2 cubicles must have a squatting WC pan
A water tap point coupled with spring nozzle
Must be kerbed and properly graded towards the gully trap within the cubicle.
2. Public Toilet

2. Public Toilet
Minimum 2 cubicles must have a squatting WC pan
A water tap point coupled with spring nozzle
Must be kerbed and properly graded towards the gully trap within the cubicle.

2. Public Toilet
Minimum 2 cubicles must have a squatting WC pan
A water tap point coupled with spring nozzle
Must be kerbed and properly graded towards the gully trap within the cubicle.

2. Public Toilet
Minimum 2 cubicles must have a squatting WC pan
A water tap point coupled with spring nozzle
Must be kerbed and properly graded towards the gully trap within the cubicle.

What about Singapore? Have We been Getting Warmer too?What about Singapore? Have We been Getting Warmer too?4
25.8
26.0
26.2
26.4
26.6
26.8
27.0
27.2
27.4
27.6
27.8
28.0
28.2
28.4
28.6
1948 1952 1956 1960 1964 1968 1972 1976 1980 1984 1988 1992 1996 2000 2004 2008
TE
MP
ER
AT
UR
E (
DE
G C
)
YEAR
MEAN SURFACE TEMPERATURE
Source (Graph): National Environment Agency(Changi Meteorological Station)

25.8
26.0
26.2
26.4
26.6
26.8
27.0
27.2
27.4
27.6
27.8
28.0
28.2
28.4
28.6
1948 1952 1956 1960 1964 1968 1972 1976 1980 1984 1988 1992 1996 2000 2004 2008
Source (Graph): National Environment Agency (Changi Meteorological Station)
Feeling the heat?
Temperature (C)

Solid Waste Challenge
12002600
5700
7700
6800
7600
0
1000
2000
3000
4000
5000
6000
7000
8000
9000
1970 1975 1980 1985 1990 1995 2000 2005 2010
Tons per day
At the current refuse disposal rate, we require�1 new WTE plant every 5-7 years�1 new landfill every 25-30 years
WasteExplosio
n

1200
2600
5700
7700
6800
7600
0
1000
2000
3000
4000
5000
6000
7000
8000
9000
1970 1975 1980 1985 1990 1995 2000 2005 2010
Solid Waste Challenge
1
1 Landfill
WTE Plant
Every 5-7 years
Every 25-30 years
At the current refuse disposal rate, we would require:
Tons per day

How Electricity Consumption has Grown
Population Increase(millions)
20081970 20081970
Annual ElectricityConsumption (thousand GWh)
1.9 37.94
WHERE DO WE STAND?
2.42 times 20.0 times
Source: http://www.singstat.gov.sg/stats/themes/people/hist/popn.html
Energy Market Authority
2 4.84
Recommended


![[PPT]PowerPoint Presentation - Stanford Universityweb.stanford.edu/class/archive/anthsci/anthsci192... · Web viewProbability Questions what is a good general size for artifact samples?](https://img.pdfslide.us/doc/110x75/5b0a8ca07f8b9abe5d8e5a8e/pptpowerpoint-presentation-stanford-viewprobability-questions-what-is-a-good.jpg)