www.oecd.org/economy/surveys/economic-survey-france.htm
OECD
OECD Economics
2015 OECD ECONOMIC SURVEY OF FRANCE
Growth and jobs
Paris, 2 April 2015

2

3
Well-being is high
http://dx.doi.org/10.1787/888933192276
Source : OECD (2014), OECD Better Life Index , www.oecdbetterlifeindex.org.
Better life index, 2014Index scale of 0 to 10, from lowest to highest level of life quality
0 1 2 3 4 5 6 7 8 9
10Income and wealth
Jobs and earnings
Housing
Work and life balance
Health status
Education and skillsSocial connections
Civic engagement andgovernance
Environmental quality
Personal security
Subjective well-being
France
OECD
4
Income inequality is moderate
http://dx.doi.org/10.1787/888933192276
NORDNKCZEFINBELSWENLDAUTDEUIRLPOLFRA
1. Latest available year.Source: OECD, Income Distribution and Poverty Database.
0
5
10
15
20
25
30
35
40
45
0
5
10
15
20
25
30
35
40
45
NOR DNK CZE FIN BEL SWE NLD AUT DEU IRL POL FRA KOR CAN ITA NZL AUS GRC PRT ESP GBR USA
Gini index after taxes and transfers, per cent¹
5
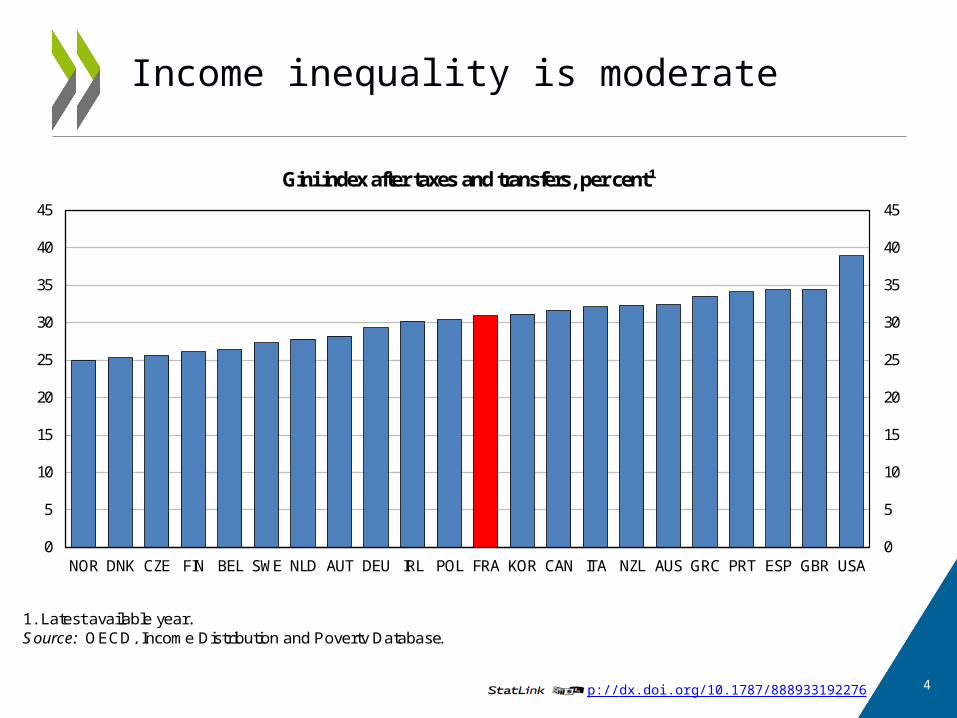
But per capita growth has been weak for some time (I)
http://dx.doi.org/10.1787/888933192276
ITAFRAGRCDNKPRTBELFINESPCANDEUNLDUSA
Source : OECD, National Accounts and Economic Outlook 96 Databases .
0
1
2
3
4
5
0
1
2
3
4
5
ITA FRA GRC DNK PRT BEL FIN ESP CAN DEU NLD USA AUT NZL SWE CZE NOR GBR AUS IRL POL KOR
Annualised real per capita GDP growth, 1990-2014% %
6
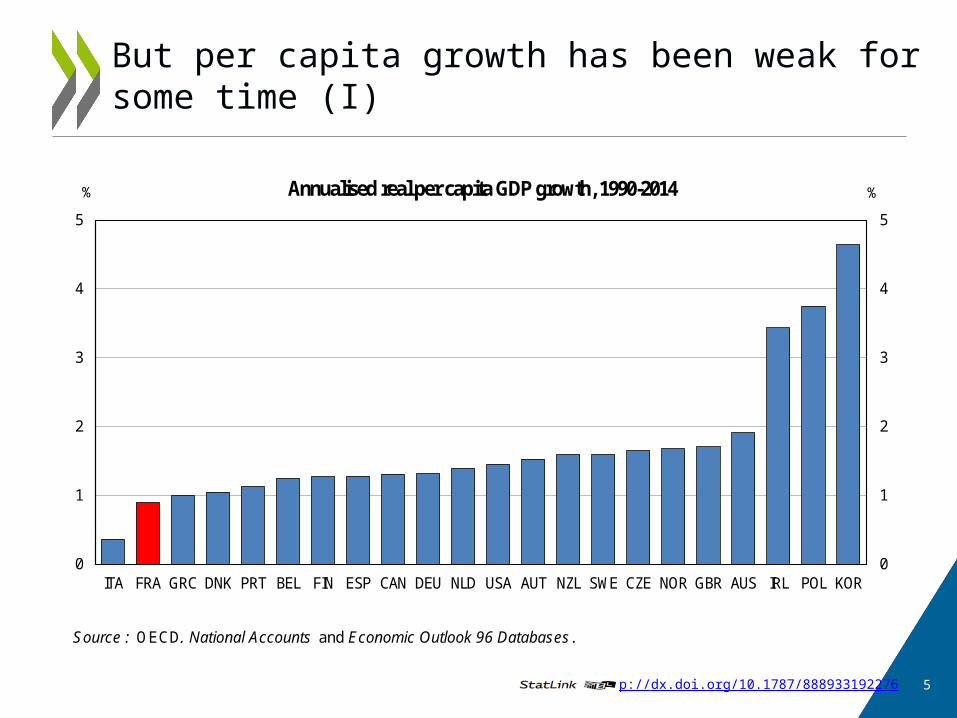
But per capita growth has been weak for some time (II)
Source : OECD, National Accounts and Economic Outlook 96 Databases .
-5
-4
-3
-2
-1
0
1
2
3
4
5
1990 1994 1998 2002 2006 2010 2014
France
OECD
Annual % change
90
100
110
120
130
140
1990 1994 1998 2002 2006 2010 2014
France
OECD
Index, 1990=100
Real per capita GDP growth
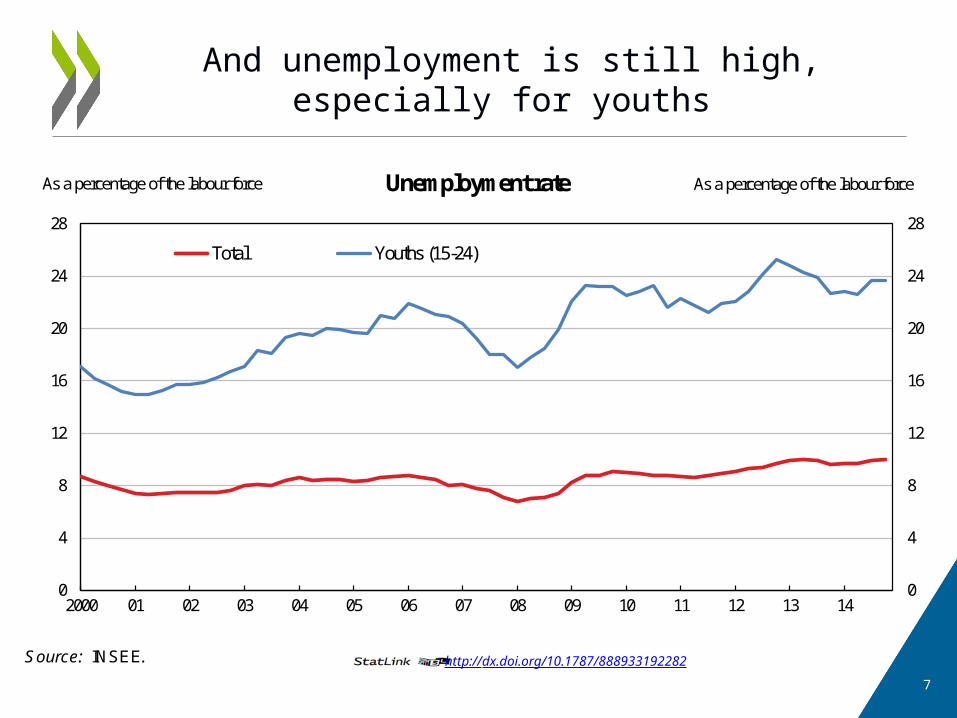
7
And unemployment is still high, especially for youths
Source: INSEE.
0
4
8
12
16
20
24
28
0
4
8
12
16
20
24
28
2000 01 02 03 04 05 06 07 08 09 10 11 12 13 14
Unemployment rate
Total Youths (15-24)
As a percentage of the labour force As a percentage of the labour force
http://dx.doi.org/10.1787/888933192282

8
Main findings
o Boosting medium-term growth will require continuing and deepening structural reforms.
o High public spending has led to high taxes, including on labour.
o The labour market remains inflexible.
o The low-skilled and unemployed lack training opportunities.
o Weak competition, notably in some services sectors, hurts growth.

9
Key recommendations
o Implement additional structural reforms to improve the outlook for growth.
o Make targeted reductions in public spending to cut taxes in the medium term.
o Redouble efforts to reduce complexity, notably of the labour code and lay-off procedures.
o Improve the quality of vocational education, concentrating it on the neediest.
o Move faster to eliminate economic rents and privileges to boost employment, equity and competition.

The challenges
11
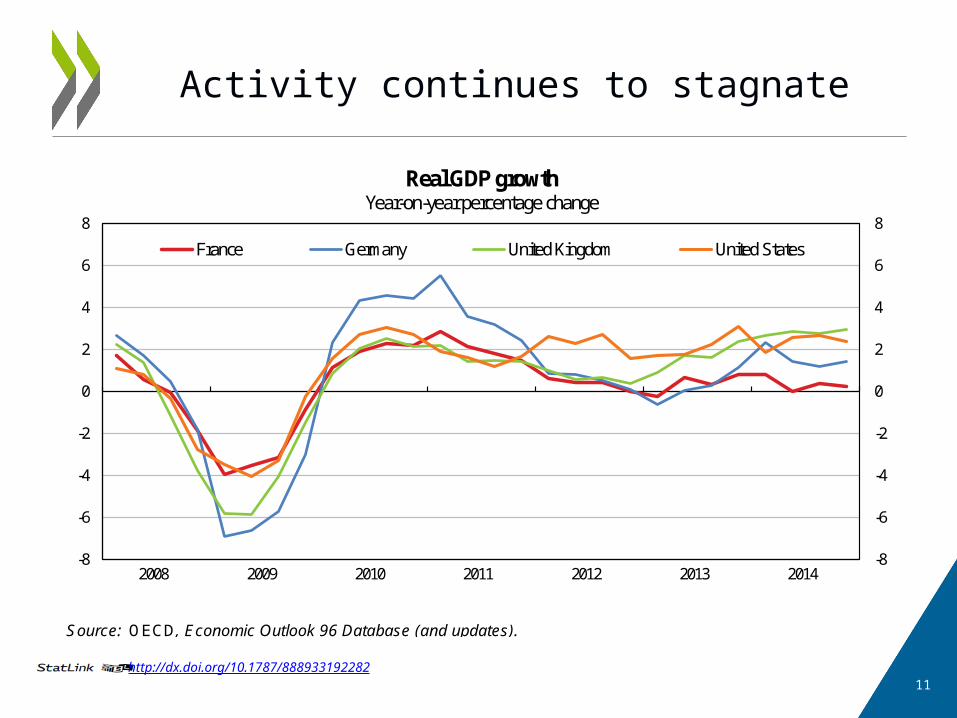
Activity continues to stagnate
http://dx.doi.org/10.1787/888933192282
Source: OECD, Economic Outlook 96 Database (and updates).
-8
-6
-4
-2
0
2
4
6
8
-8
-6
-4
-2
0
2
4
6
8
2008 2009 2010 2011 2012 2013 2014
Real GDP growthYear-on-year percentage change
France Germany United Kingdom United States

12
Business investment is weak
http://dx.doi.org/10.1787/888933192282
Source: OECD, Economic Outlook 96 Database (and updates) .
-20
-15
-10
-5
0
5
10
15
-20
-15
-10
-5
0
5
10
15
2008 2009 2010 2011 2012 2013 2014
Business investmentYear-on-year percentage change, volume
France Germany United States

13
Export performance has not improved
1. Difference between export growth and export market growth, in volume terms.Source: OECD, Economic Outlook 96 Database (and updates) .
-4
-3
-2
-1
0
1
2
3
90
100
110
120
130
140
2000 2001 2002 2003 2004 2005 2006 2007 2008 2009 2010 2011 2012 2013 2014
Export market shares and the current account balance
Export performance¹ (left axis) Current account balance (right axis)
Index 2010=100 As a percentage of GDP
http://dx.doi.org/10.1787/888933192282

14
Public debt is still rising
http://dx.doi.org/10.1787/888933192324
1
Source: OECD, Economic Outlook 96 Database (and updates) .
20
30
40
50
60
70
80
90
100
0
1
2
3
4
5
6
7
8
1990 1992 1994 1996 1998 2000 2002 2004 2006 2008 2010 2012 2014
Public deficit and debt, 1990-2014As a percentage of GDP
General government deficit (left axis)
General government debt, Maastricht definition (right axis)

15
To address these challenges, speed up the pursuit and
implementation of ambitious structural reforms
16
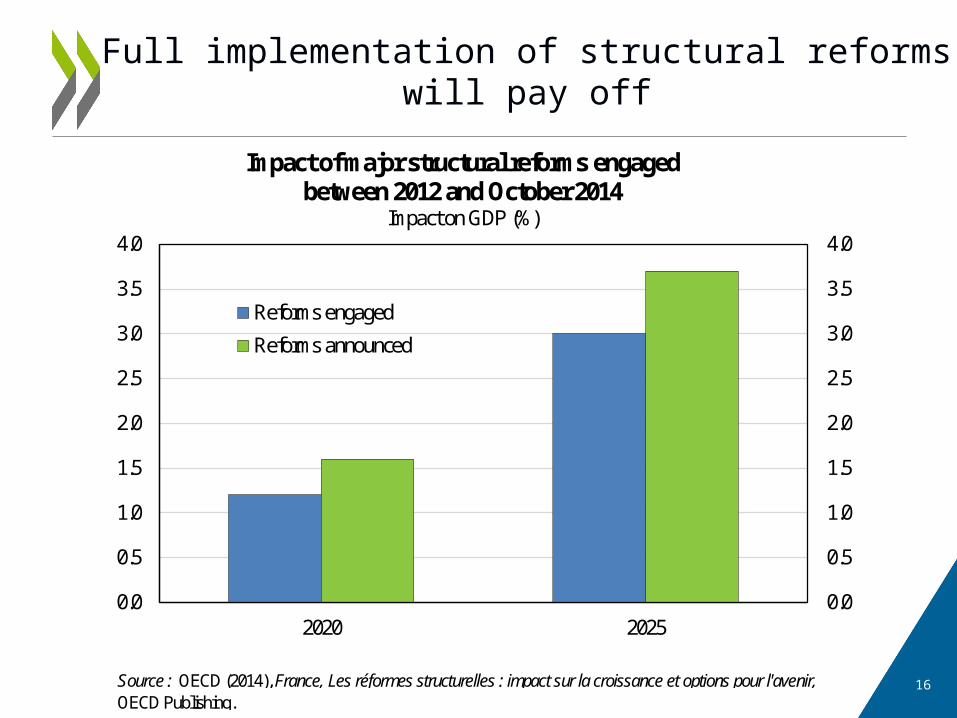
Full implementation of structural reforms will pay off
Source : OECD (2014), France, Les réformes structurelles : impact sur la croissance et options pour l'avenir,OECD Publishing.
0.0
0.5
1.0
1.5
2.0
2.5
3.0
3.5
4.0
0.0
0.5
1.0
1.5
2.0
2.5
3.0
3.5
4.0
2020 2025
Impact of major structural reforms engaged between 2012 and October 2014
Impact on GDP (%)
Reforms engaged
Reforms announced

17
Make green growth a priority
http://dx.doi.org/10.1787/888933192487
Raise environmental taxes, notably on diesel, to reduce pollution
USACANOECDESPSVKFRACHEPOLBELDEUPRTIRL
Source : OECD, Environmental Taxation Database.
1. 2011 for Belgium, Greece and the Netherlands; environmental taxes cover taxes on energy products (including electricity, petrol, diesel and other fossil fuels), automotive vehicles, transportation, waste management, substances that deplete the ozone layer, and other environment-related taxes.
0
1
2
3
4
5
0
1
2
3
4
5
USA
CAN
OECD ES
P
SVK
FRA
CHE
POL
BEL
DEU
PRT
IRL
GBR
SWE
AUT
EST
GRC
CZE
HUN
ITA
FIN
NLD
DNK
SVN
Environment-related tax revenues, 2012¹As a percentage of GDP

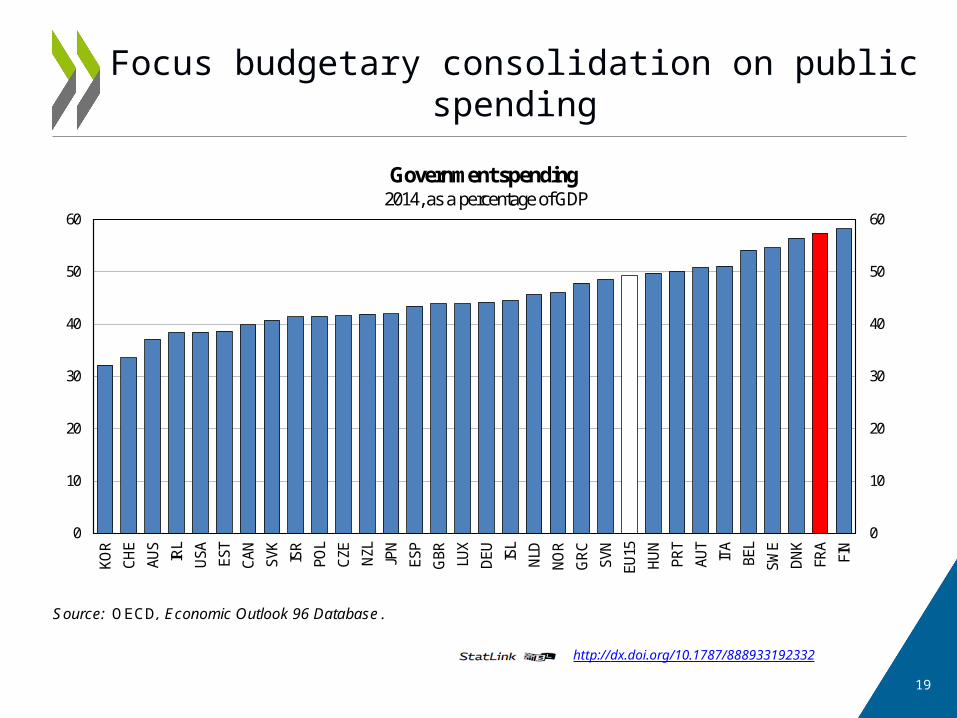
Lower public spending substantially in the medium term
19
Focus budgetary consolidation on public spending
http://dx.doi.org/10.1787/888933192332
KORCHEAUSIRLUSAESTCANSVKISRPOLCZENZL
Source: OECD, Economic Outlook 96 Database .
0
10
20
30
40
50
60
0
10
20
30
40
50
60
KOR
CHE
AUS
IRL
USA
EST
CAN
SVK
ISR
POL
CZE
NZL
JPN
ESP
GBR LU
X
DEU
ISL
NLD
NOR
GR
C
SVN
EU15
HUN
PRT
AUT
ITA
BEL
SWE
DNK
FRA
FIN
Government spending2014, as a percentage of GDP
20
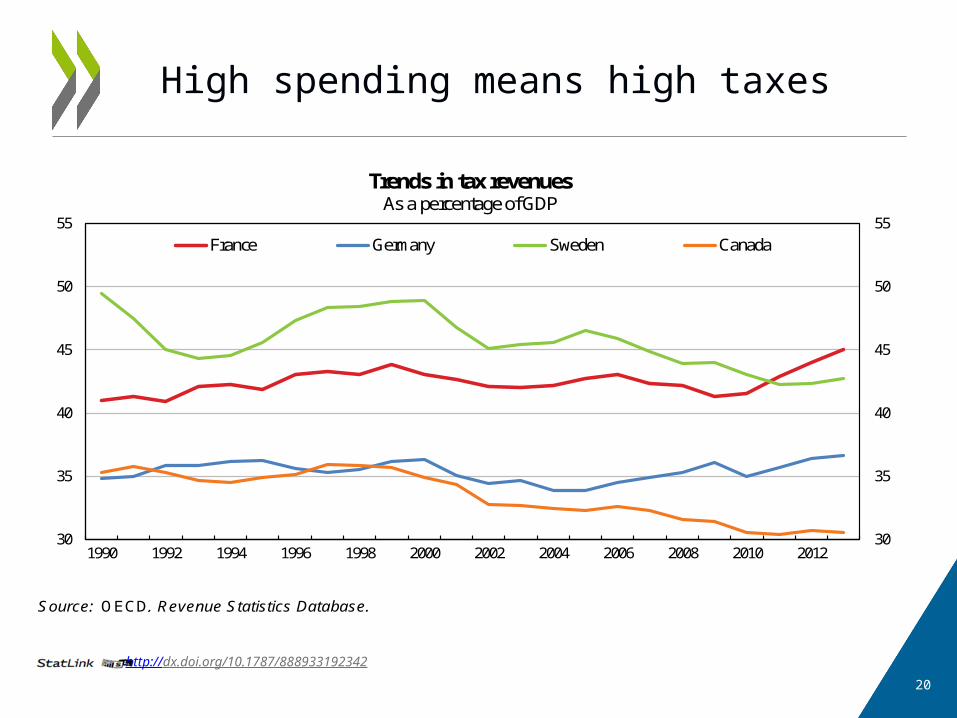
High spending means high taxes
http://dx.doi.org/10.1787/888933192342
Source: OECD, Revenue Statistics Database.
30
35
40
45
50
55
30
35
40
45
50
55
1990 1992 1994 1996 1998 2000 2002 2004 2006 2008 2010 2012
Trends in tax revenuesAs a percentage of GDP
France Germany Sweden Canada

21
The share of public employment is high
Ensure the number of civil servants matches underlying needs
Reform the job mobility rules for public employees
http://dx.doi.org/10.1787/888933192332
CHEJPNGRCMEXNLDKORDEUNZLAUSPRTAUTCZE
Source: OECD, Economic Outlook 96 Database .
0
5
10
15
20
25
30
35
0
5
10
15
20
25
30
35
CHE
JPN
GRC
MEX
NLD
KOR
DEU
NZL
AUS
PRT
AUT
CZE IRL TUR ITA USA
SVK
POL
LUX
ESP
GBR
EU15 SVN
BEL
CAN
HUN
FRA
EST ISL FIN SWE
DNK
NOR
Share of government employment2014, as a percentage of total employment
22
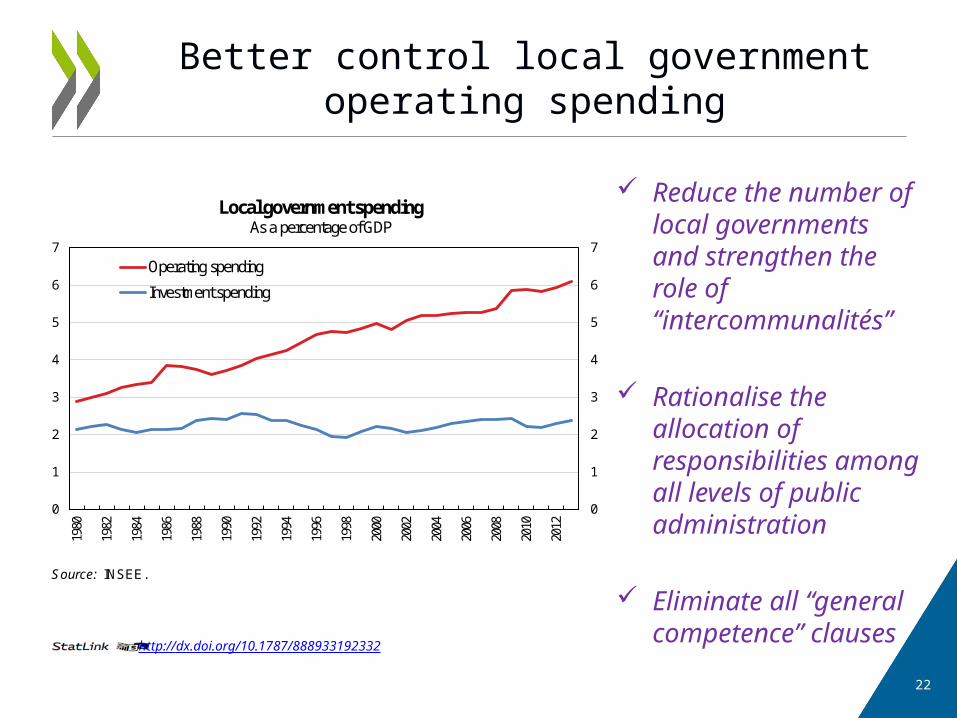
Better control local government operating spending
Reduce the number of local governments and strengthen the role of “intercommunalités”
Rationalise the allocation of responsibilities among all levels of public administration
Eliminate all “general competence” clauses
http://dx.doi.org/10.1787/888933192332
Source: INSEE.
0
1
2
3
4
5
6
7
0
1
2
3
4
5
6
7
1980
1982
1984
1986
1988
1990
1992
1994
1996
1998
2000
2002
2004
2006
2008
2010
2012
Local government spendingAs a percentage of GDP
Operating spending
Investment spending
23
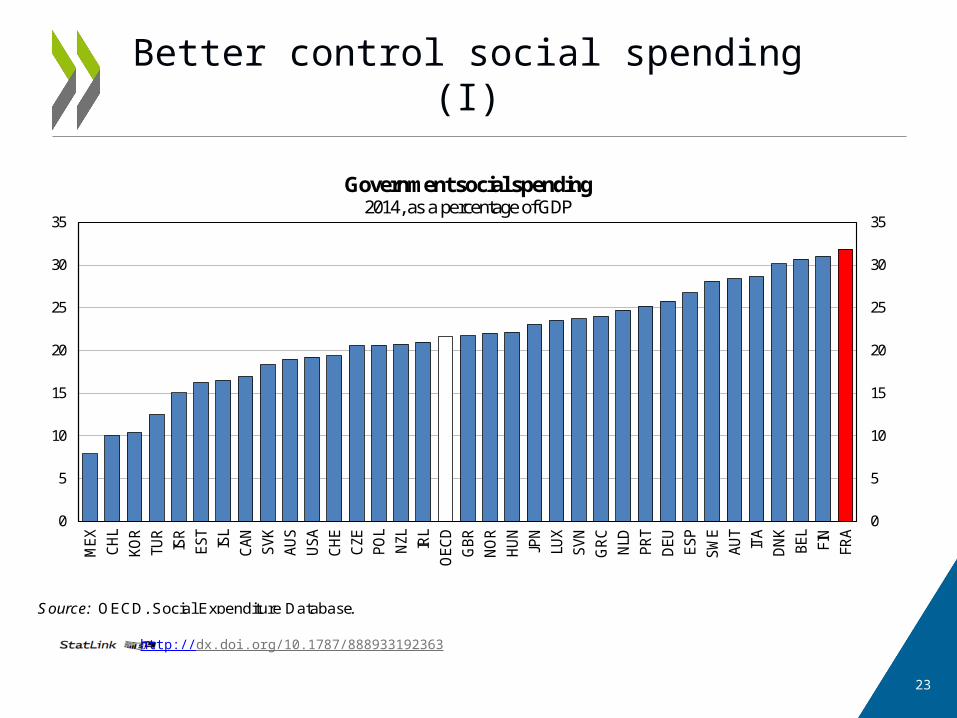
Better control social spending (I)
http://dx.doi.org/10.1787/888933192363
MEXCHLKORTURISRESTISLCANSVKAUSUSACHE
Source: OECD, Social Expenditure Database.
0
5
10
15
20
25
30
35
0
5
10
15
20
25
30
35
MEX CH
LKO
RTU
RIS
RES
TIS
LC
AN SVK
AUS
USA
CH
EC
ZEPO
LN
ZL IRL
OEC
DG
BRN
OR
HU
NJP
NLU
XSV
NG
RC
NLD
PRT
DEU ES
PSW
EAU
TIT
AD
NK
BEL
FIN
FRA
Government social spending2014, as a percentage of GDP

24
Better control social spending (II)
Hold down health-care spending: Close small, under-utilised public hospitals, Continue making greater use of ambulatory surgery and generic
drugs, Encourage doctors more to limit their prescriptions.
Ensure that public pensions play their part in reducing public spending as a share of GDP: Modify the parameters of complementary pension schemes, Narrow further the specific features of special pension regimes.
Modify the parameters of unemployment benefits: Plan to reduce their maximum duration when growth picks up, Tighten their conditionality on effective job search or training.

Reform the labour market
26
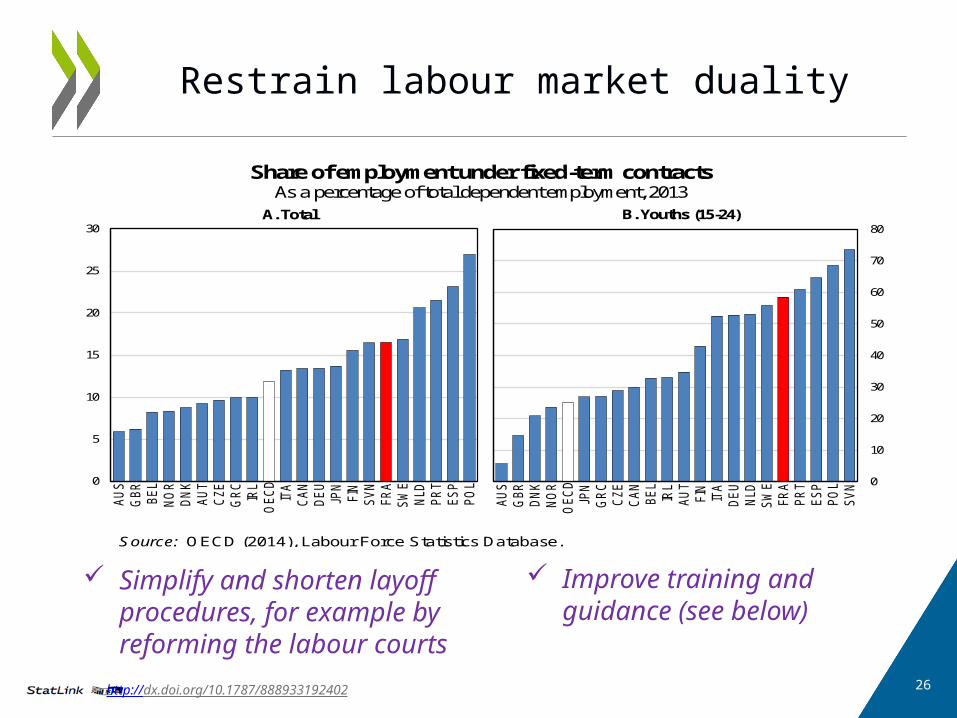
Restrain labour market duality
http://dx.doi.org/10.1787/888933192402
Simplify and shorten layoff procedures, for example by reforming the labour courts
Improve training and guidance (see below)
Source: OECD (2014), Labour Force Statistics Database.
0
10
20
30
40
50
60
70
80
AU
S
GB
R
DN
K
NO
R
OE
CD
JPN
GR
C
CZ
E
CA
N
BE
L
IRL
AU
T
FIN ITA
DE
U
NL
D
SW
E
FR
A
PR
T
ES
P
PO
L
SV
N
B. Youths (15-24)
0
5
10
15
20
25
30
AU
S
GB
R
BE
L
NO
R
DN
K
AU
T
CZ
E
GR
C
IRL
OE
CD
ITA
CA
N
DE
U
JPN
FIN
SV
N
FR
A
SW
E
NL
D
PR
T
ES
P
PO
L
A. Total
Share of employment under fixed-term contractsAs a percentage of total dependent employment, 2013
27
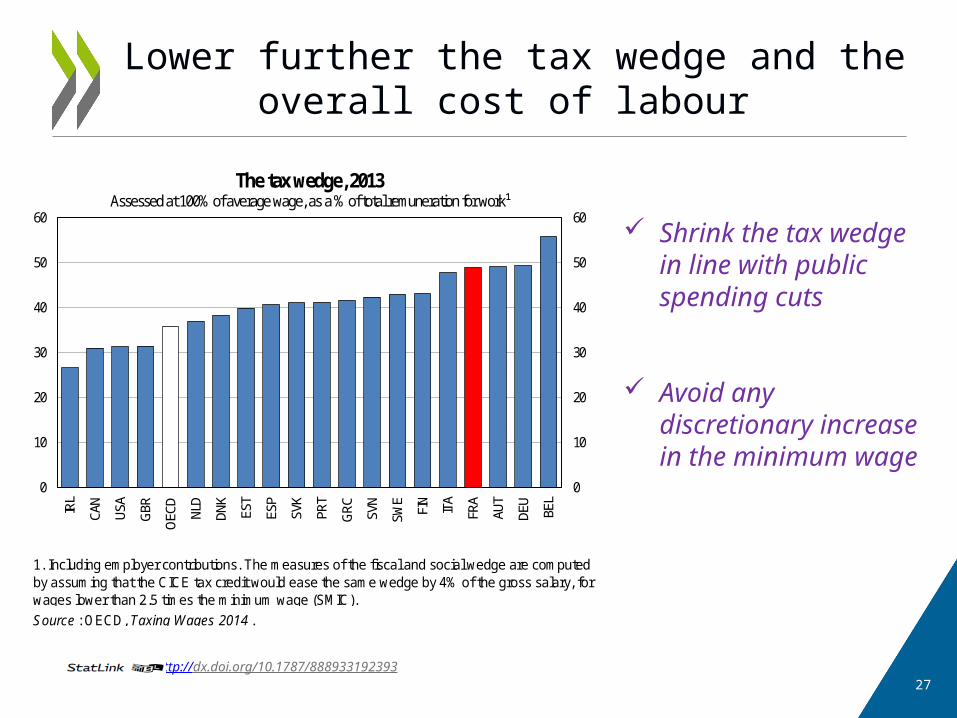
Lower further the tax wedge and the overall cost of labour
http://dx.doi.org/10.1787/888933192393
Shrink the tax wedge in line with public spending cuts
Avoid any discretionary increase in the minimum wage
IRLCANUSAGBROECDNLDDNKESTESPSVKPRTGRC
Source : OECD, Taxing Wages 2014 .
1. Including employer contributions. The measures of the fiscal and social wedge are computedby assuming that the CICE tax credit would ease the same wedge by 4% of the gross salary, for wages lower than 2.5 times the minimum wage (SMIC).
0
10
20
30
40
50
60
0
10
20
30
40
50
60
IRL
CAN
USA
GBR
OECD NL
D
DNK
EST
ESP
SVK
PRT
GRC
SVN
SWE
FIN
ITA
FRA
AUT
DEU
BEL
The tax wedge, 2013Assessed at 100% of average wage, as a % of total remuneration for work¹
28
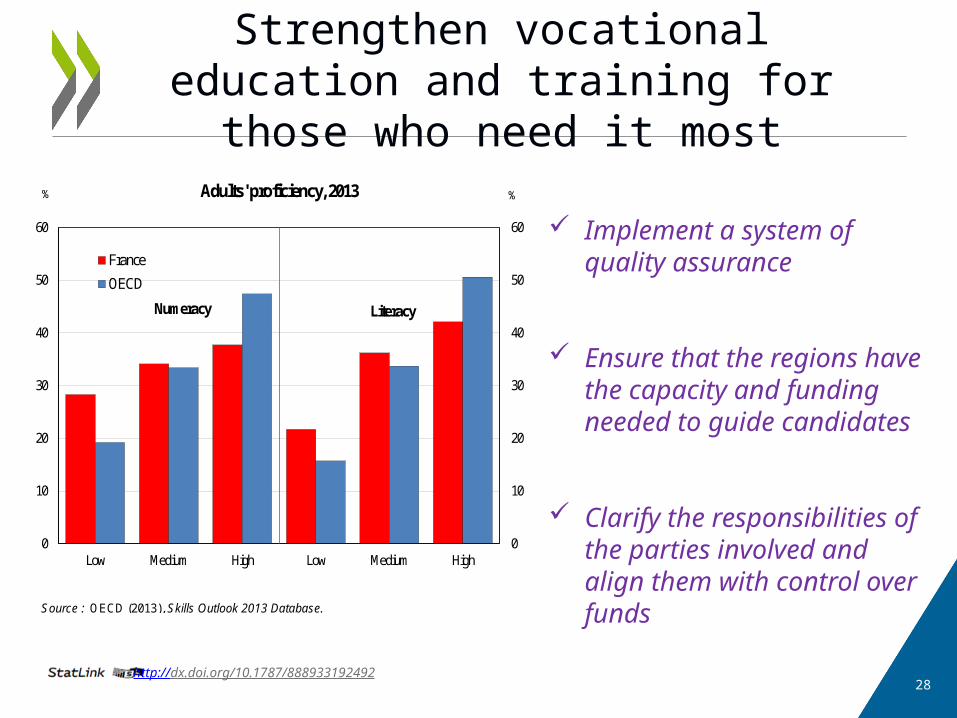
Strengthen vocational education and training for those who need it most
Implement a system of quality assurance
Ensure that the regions have the capacity and funding needed to guide candidates
Clarify the responsibilities of the parties involved and align them with control over funds
http://dx.doi.org/10.1787/888933192492
Source : OECD (2013), Skills Outlook 2013 Database.
0
10
20
30
40
50
60
0
10
20
30
40
50
60
Low Medium High Low Medium High
Adults' proficiency, 2013
France
OECD
Numeracy Literacy
% %

29
Develop apprenticeships as from high school
http://dx.doi.org/10.1787/888933192439
Attract highly qualified teachers
Give them credit for professional experience outside of teaching
Provide more individualised support for students in difficulty
Ensure business mentors have pedagogical training
Source: Ministry of National Education, DEPP.
0
50
100
150
200
250
300
350
400
450
0
50
100
150
200
250
300
350
400
450
1986
1987
1988
1989
1990
1991
1992
1993
1994
1995
1996
1997
1998
1999
2000
2001
2002
2003
2004
2005
2006
2007
2008
2009
2010
2011
2012
2013
Number of apprentices by level of diploma, thousands
Secondary education, short programmesSecondary education, long programmesTertiary education

30
Strengthen competition

31
Continue to simplify the business environment
Implement the measures proposed by the business simplification committee
Charge an independent institution with the task of examining all regulations
http://dx.doi.org/10.1787/888933192453
CANNZLUSAGBRAUSDEUDNKJPNCHLFINNLDNOR
1. 2008 for the United States.Source : OECD (2013), Product Market Regulation Statistics .
0.0
0.5
1.0
1.5
2.0
2.5
3.0
0.0
0.5
1.0
1.5
2.0
2.5
3.0
CAN
NZL
USA
GBR
AUS
DEU
DNK
JPN
CHL
FIN NLD
NOR IRL
CHE
SWE ITA EST
SVK ISR
ESP
AUT
CZE ISL
KOR
GRC
PRT
FRA
SVN
BEL
HUN
Administrative barriers to starting up corporations, 2013¹From most (0) to least (6) favourable to competition
32
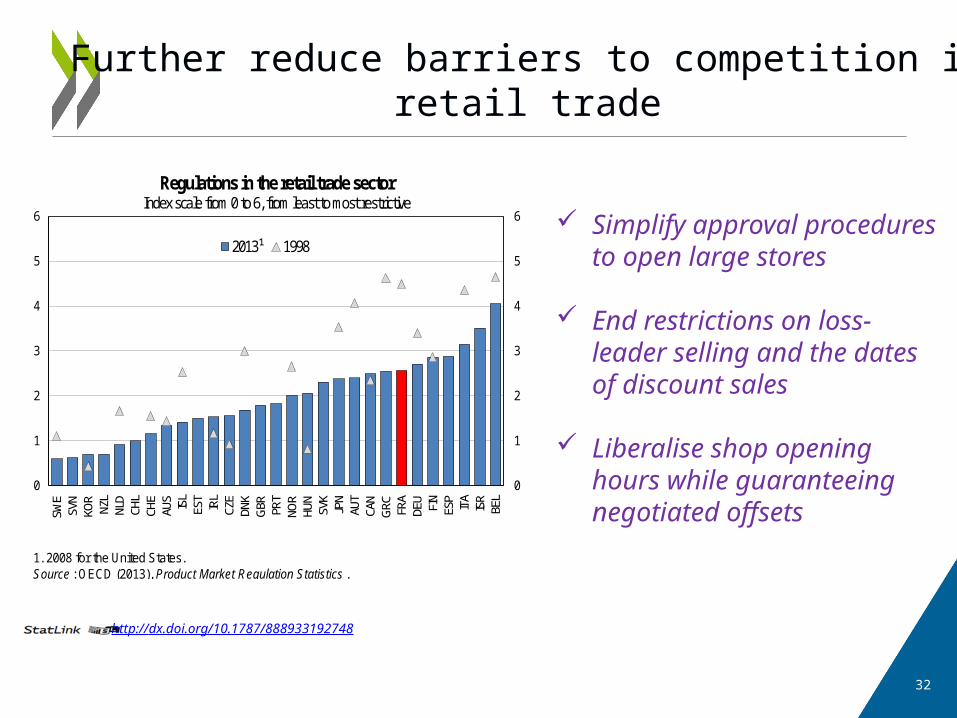
Further reduce barriers to competition in retail trade
Simplify approval procedures to open large stores
End restrictions on loss-leader selling and the dates of discount sales
Liberalise shop opening hours while guaranteeing negotiated offsets
http://dx.doi.org/10.1787/888933192748
SWESVNKORNZLNLDCHLCHEAUSISLESTIRLCZE
1. 2008 for the United States.Source : OECD (2013), Product Market Regulation Statistics .
0
1
2
3
4
5
6
0
1
2
3
4
5
6
SWE
SVN
KOR
NZL
NLD
CHL
CHE
AUS ISL
EST
IRL
CZE
DNK
GBR
PRT
NOR
HUN
SVK
JPN
AUT
CAN
GRC
FRA
DEU FIN
ESP ITA
ISR
BEL
Regulations in the retail trade sectorIndex scale from 0 to 6, from least to most restrictive
2013¹ 1998
33
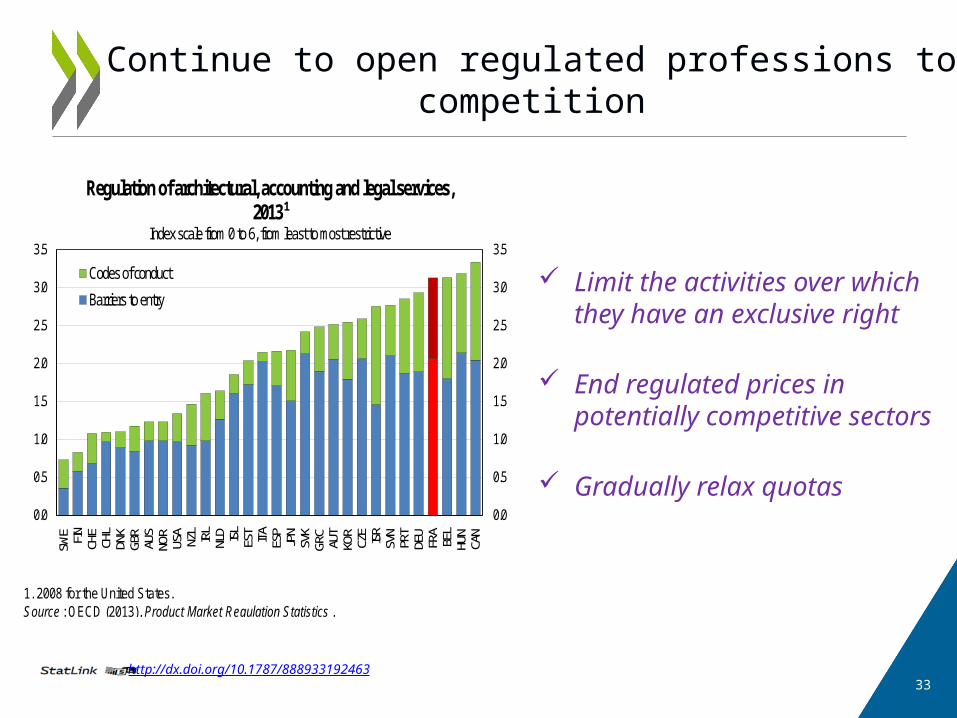
Continue to open regulated professions to competition
http://dx.doi.org/10.1787/888933192463
Limit the activities over which they have an exclusive right
End regulated prices in potentially competitive sectors
Gradually relax quotas
1. 2008 for the United States.Source : OECD (2013), Product Market Regulation Statistics .
0.0
0.5
1.0
1.5
2.0
2.5
3.0
3.5
0.0
0.5
1.0
1.5
2.0
2.5
3.0
3.5
SWE FIN CHE
CHL
DNK
GBR
AUS
NOR
USA
NZL IRL
NLD ISL EST ITA ESP
JPN
SVK
GRC
AUT
KOR
CZE ISR SVN
PRT
DEU
FRA
BEL
HUN
CAN
Regulation of architectural, accounting and legal services, 2013¹
Index scale from 0 to 6, from least to most restrictive
Codes of conduct
Barriers to entry

More information…
www.oecd.org/economy/surveys/economic-survey-france.htm
OECD
OECD Economics
34
Disclaimers: The statistical data for Israel are supplied by and under the responsibility of the relevant Israeli authorities. The use of such data by the OECD is without prejudice to the status of the Golan Heights, East Jerusalem and Israeli settlements in the West Bank under the terms of international law.This document and any map included herein are without prejudice to the status of or sovereignty over any territory, to the delimitation of international frontiers and boundaries and to the name of any territory, city or area.
Recommended