FOURTH QUARTER 2020 RESULTS2.2.21
STEPHEN LITTLETONVICE PRESIDENT, INVESTOR RELATIONS AND SECRETARY
2
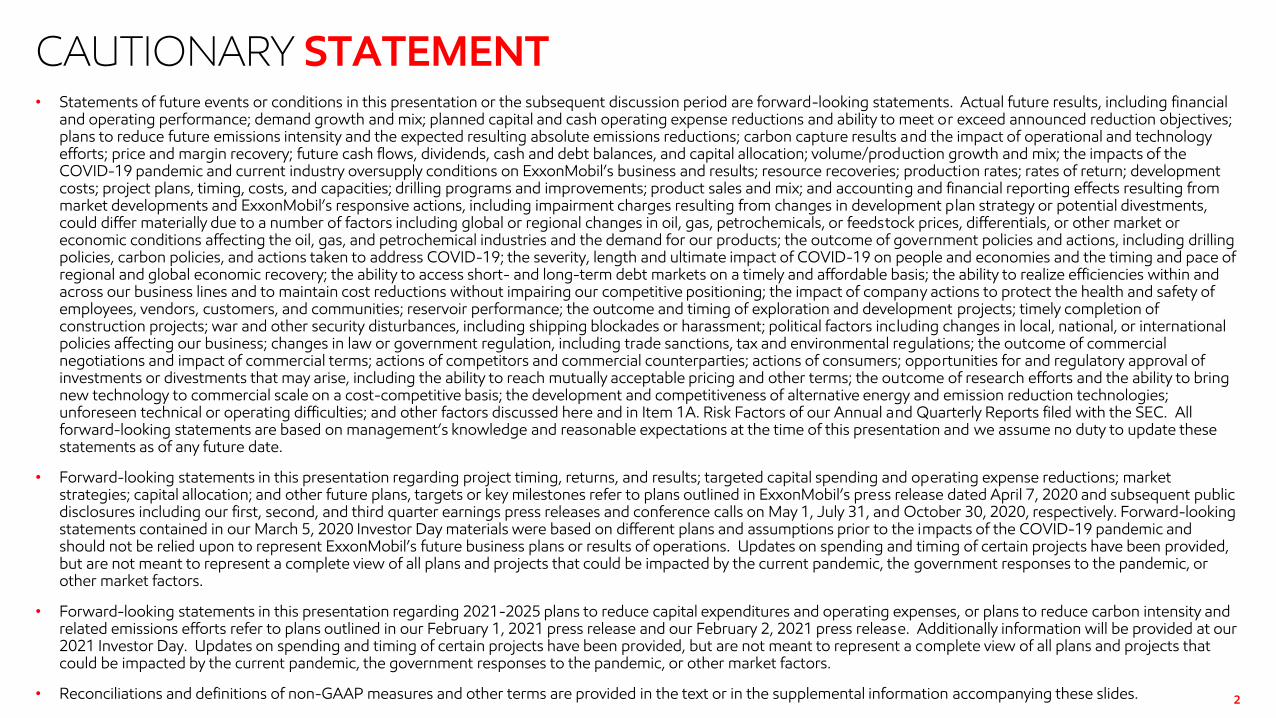
CAUTIONARY STATEMENT• Statements of future events or conditions in this presentation or the subsequent discussion period are forward-looking statements. Actual future results, including financial
and operating performance; demand growth and mix; planned capital and cash operating expense reductions and ability to meet or exceed announced reduction objectives; plans to reduce future emissions intensity and the expected resulting absolute emissions reductions; carbon capture results and the impact of operational and technology efforts; price and margin recovery; future cash flows, dividends, cash and debt balances, and capital allocation; volume/production growth and mix; the impacts of the COVID-19 pandemic and current industry oversupply conditions on ExxonMobil’s business and results; resource recoveries; production rates; rates of return; development costs; project plans, timing, costs, and capacities; drilling programs and improvements; product sales and mix; and accounting and financial reporting effects resulting from market developments and ExxonMobil’s responsive actions, including impairment charges resulting from changes in development plan strategy or potential divestments, could differ materially due to a number of factors including global or regional changes in oil, gas, petrochemicals, or feedstock prices, differentials, or other market or economic conditions affecting the oil, gas, and petrochemical industries and the demand for our products; the outcome of government policies and actions, including drilling policies, carbon policies, and actions taken to address COVID-19; the severity, length and ultimate impact of COVID-19 on people and economies and the timing and pace of regional and global economic recovery; the ability to access short- and long-term debt markets on a timely and affordable basis; the ability to realize efficiencies within and across our business lines and to maintain cost reductions without impairing our competitive positioning; the impact of company actions to protect the health and safety of employees, vendors, customers, and communities; reservoir performance; the outcome and timing of exploration and development projects; timely completion of construction projects; war and other security disturbances, including shipping blockades or harassment; political factors including changes in local, national, or international policies affecting our business; changes in law or government regulation, including trade sanctions, tax and environmental regulations; the outcome of commercial negotiations and impact of commercial terms; actions of competitors and commercial counterparties; actions of consumers; opportunities for and regulatory approval of investments or divestments that may arise, including the ability to reach mutually acceptable pricing and other terms; the outcome of research efforts and the ability to bring new technology to commercial scale on a cost-competitive basis; the development and competitiveness of alternative energy and emission reduction technologies; unforeseen technical or operating difficulties; and other factors discussed here and in Item 1A. Risk Factors of our Annual and Quarterly Reports filed with the SEC. All forward-looking statements are based on management’s knowledge and reasonable expectations at the time of this presentation and we assume no duty to update these statements as of any future date.
• Forward-looking statements in this presentation regarding project timing, returns, and results; targeted capital spending and operating expense reductions; market strategies; capital allocation; and other future plans, targets or key milestones refer to plans outlined in ExxonMobil’s press release dated April 7, 2020 and subsequent public disclosures including our first, second, and third quarter earnings press releases and conference calls on May 1, July 31, and October 30, 2020, respectively. Forward-looking statements contained in our March 5, 2020 Investor Day materials were based on different plans and assumptions prior to the impacts of the COVID-19 pandemic and should not be relied upon to represent ExxonMobil’s future business plans or results of operations. Updates on spending and timing of certain projects have been provided, but are not meant to represent a complete view of all plans and projects that could be impacted by the current pandemic, the government responses to the pandemic, or other market factors.
• Forward-looking statements in this presentation regarding 2021-2025 plans to reduce capital expenditures and operating expenses, or plans to reduce carbon intensity and related emissions efforts refer to plans outlined in our February 1, 2021 press release and our February 2, 2021 press release. Additionally information will be provided at our 2021 Investor Day. Updates on spending and timing of certain projects have been provided, but are not meant to represent a complete view of all plans and projects that could be impacted by the current pandemic, the government responses to the pandemic, or other market factors.
• Reconciliations and definitions of non-GAAP measures and other terms are provided in the text or in the supplemental information accompanying these slides.

UPSTREAM
Increased gas realizations; liquids realizations in-line with 3Q, recovering through quarter
Government-mandated curtailments increased to ~190 Koebd
Matched best-ever reliability performance
Announced hydrocarbon discovery offshore Suriname
DEVELOPMENTS SINCE THIRD QUARTER 2020
3
DOWNSTREAMBest-ever personnel and process safety
Best-ever reliability
~2 MBD of industry refinery closures announced in 2020, 4 times the 10-year average
CORPORATEExceeded reduction targets for full-year capital and operating spend
Preserved value of capital plan while responding to market environment
CHEMICALBest-ever personnel and process safety
Best-ever reliability
Improved margins from strong packaging demand and automotive / durable demand recovery
Best-ever refers to data since the Exxon – Mobil merger.

4
RESULTS 4Q20 VS. 3Q20
• Earnings increased by $900 million excluding identified items
• Captured benefits of improving gas and LNG markets
• Benefited from increased Guyana production
• Strong demand for performance products coupled with reliable operations drove Chemical earnings
• Focused project development plans on highest value, strategic investments
U/S D/S CHEM C&F TOTAL
3Q20 GAAP Earnings / (Loss) (0.4) (0.2) 0.7 (0.7) (0.7)
Non-cash inventory valuation - - 0.1 - 0.1
3Q20 Earnings / (Loss) ex. Identified Items (0.4) (0.2) 0.5 (0.7) (0.8)
Price / margin / forex 0.5 (0.2) 0.3 - 0.6
Unsettled derivatives: mark-to-market1 0.1 (0.3) (0.2)
Demand / volume 0.2 - - - 0.2
Other base business 0.4 - (0.1) 0.1 0.2
4Q20 Earnings / (Loss) ex. Identified Items 0.7 (0.7) 0.7 (0.7) 0.1
Identified items (19.3) (0.5) - (0.3) (20.2)
4Q20 GAAP Earnings / (Loss) (18.5) (1.2) 0.7 (1.0) (20.1)
Billions of dollars unless specified otherwise.Due to rounding, numbers presented above may not add up precisely to the totals indicated.See Supplemental Information for footnotes and reconciliation of Identified Items.

5
EARNINGS 4Q20 VS. 3Q20
110
Volume 4Q20 ex. Ident. Items
160
(510)
150
CONTRIBUTING FACTORS TO CHANGE IN EARNINGSMillion USD
3Q20 ex. Ident. Items
Mfg. /yield
530
Price
570
Expenses Tax / other
(793)
• Upstream liquids growth and reduced economic curtailments improved earnings
• Timing of planned turnaround, maintenance and exploration drove higher expenses
• Leveraged Downstream and Chemical integration to capture opportunities from dynamic market conditions
• Strong reliability and improved product yields underpinned manufacturing results

6
EARNINGS 2020 VS. 2019
1 Cash Opex before tax.
• Reduced cash Opex $8 billion versus 20191
− Includes ~$3 billion of structural reductions
• Volume down primarily due to lower demand
• Improved reliability and product yields delivered ~$1 billion
9.6
(1.4)
(1.1)
(0.2)
(14.1)
Expenses
CONTRIBUTING FACTORS TO CHANGE IN EARNINGSBillion USD
Price2019 ex. Ident. Items
Volume
3.3
1.0
Mfg. /yield
Inventory valuation
/ other
2020 ex. Ident. Items

7
UPSTREAM VOLUMES 2020 VS. 2019
See Supplemental Information for reconciliation of curtailments.
• High-return liquids growth in Permian and Guyana offset Norway divestment
• Volumes in-line with production plan excluding curtailments and entitlements
• Maintenance timing reduced economic impact of curtailments
3,952
3,761150
Divestments
CONTRIBUTING FACTORS TO CHANGE IN VOLUMESKoebd
2019 Curtail-ments
Entitle-ments
60
(170) (150)
Liquids growth / other
Gas demand / other
2020
(80)
Govtmandate
Groningen Limits
8
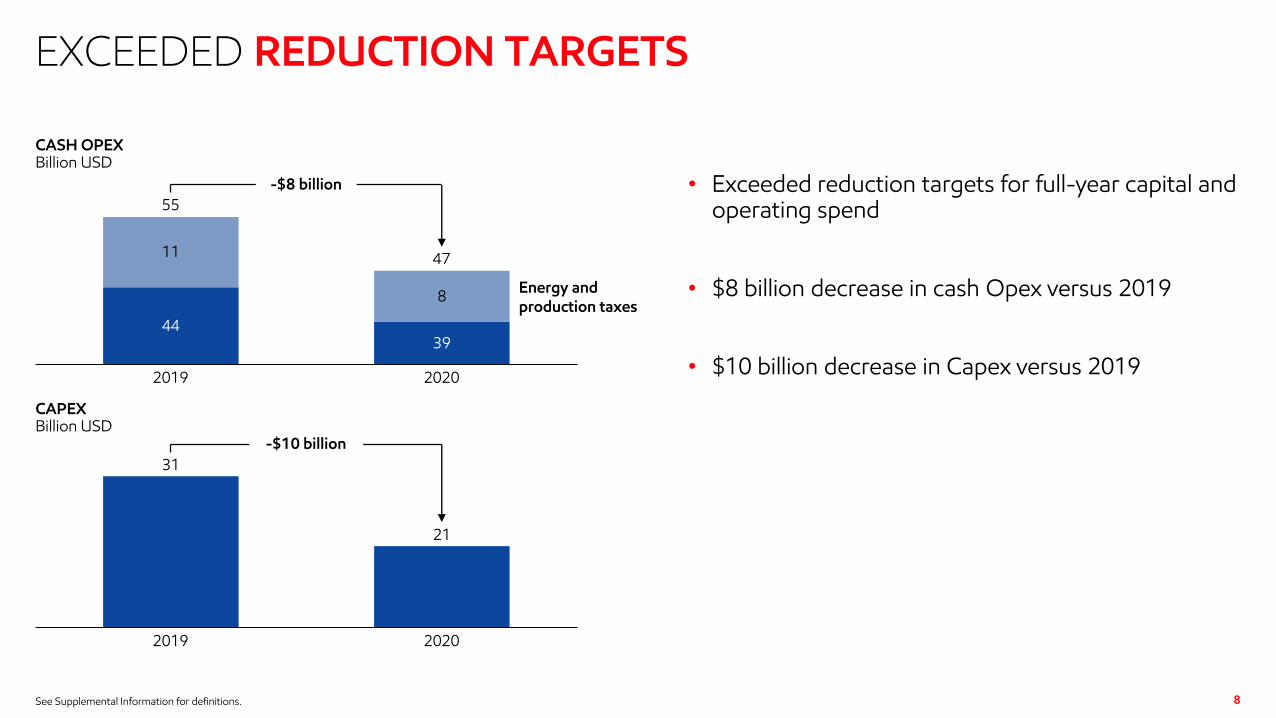
EXCEEDED REDUCTION TARGETS
• Exceeded reduction targets for full-year capital and operating spend
• $8 billion decrease in cash Opex versus 2019
• $10 billion decrease in Capex versus 2019
See Supplemental Information for definitions.
4439
11
8
2019
CASH OPEXBillion USD
2020
55
47
-$8 billion
31
21
CAPEXBillion USD
2019 2020
-$10 billion
Energy and production taxes

9
FOURTH QUARTER 2020 CASH PROFILE
• Cash flow from operations improved $600 million from 3Q20, excluding working capital effects
• Gross debt reduced by $1.2 billion in quarter
Billions of USD. Due to rounding, numbers presented above may not add up precisely to the totals indicated.See Supplemental Information for footnotes. 9
4Q20 2020
Beginning Cash 8.8 3.1
Earnings / (Loss) (20.1) (22.4)
Identified items: impairment 19.3 20.1
Depreciation1 5.0 20.1
Working Capital / Other1 (0.2) (3.0)
Cash Flow from Operating Activities 4.0 14.7
Proceeds Associated with Asset Sales 0.8 1.0
Cash Flow from Operations and Asset Sales 4.8 15.7
Shareholder Distributions (3.7) (14.9)
PP&E Adds / Investments and Advances2 (4.1) (19.5)
Debt / Other Financing (1.5) 19.9
Ending Cash 4.4 4.4
Ending Debt3 67.6 67.6

CORPORATECorporate and financing expenses expected to be ~$700 million
Operating cash flow funds dividend and Capex at current prices and margins
FIRST QUARTER 2021 OUTLOOK
CHEMICALContinued demand resilience across key markets
Scheduled maintenance in-line with 4Q
UPSTREAMAnnounced government-mandated curtailments averaging ~150 Koebd
Production expected to be ~140 Koebd higher due to seasonal gas demand
DOWNSTREAMDemand levels consistent with 4Q
Higher planned turnarounds and maintenance offset with additional efficiencies
10

MANAGEMENT PERSPECTIVES
DARREN WOODSCHAIRMAN OF THE BOARD AND CHIEF EXECUTIVE OFFICER
FOCUSED ON SHAREHOLDER VALUE
• Delivering world class safety and reliability
• Driving structural cost reductions
• Advancing flexible portfolio of high-return, cost-advantaged investments
• Maintaining strong dividend and fortified balance sheet
• Reducing emissions while developing needed technologies to support the Paris Agreement
12

Operational excellence
<0.02 LTIR1
Best ever workforce safety and reliability performance.
Guyana
~9Boeb4
18 discoveries, Liza Phase 1 producing at capacity, Liza Phase 2 on schedule, and fully funded Payara.
Chemical
>9M tonnes
Record polyethylene sales. New capacity capturing demand growth for high-value products.
Permian
~370Koebd
Exceeded volumes plan despite curtailments. Improved operating and development metrics.
Capex flexibility
>30% decrease
Deferral costs offset by savings to preserve long-term value.
2020 PERSPECTIVE
See Supplemental Information for footnotes.
Operating cost savings2
>15% reduction
From reorganizations, efficiencies, and workforce optimizations.
Met emission targets for
202025% reduction in flaring and 15% reduction in methane emissions.3
CO2 Captured
120M tonnes
#1 in CCS for over 30 years; equivalent to >25M cars.5
13
14
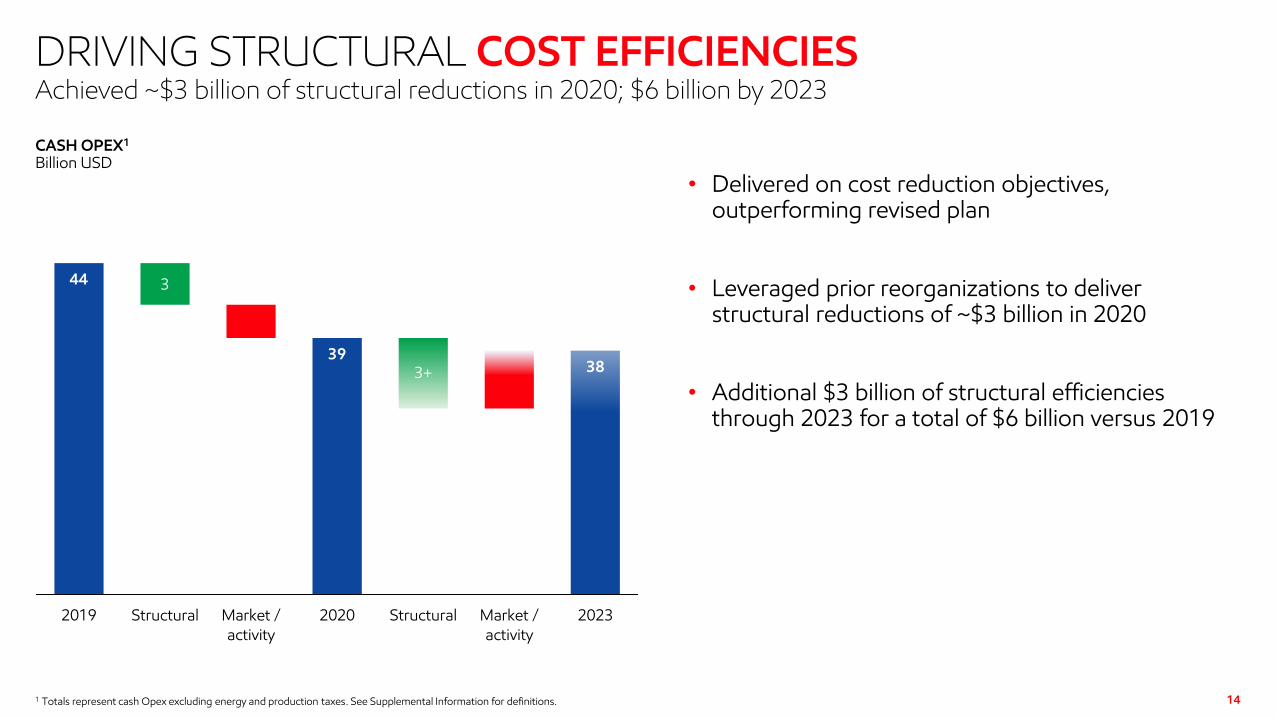
DRIVING STRUCTURAL COST EFFICIENCIES
• Delivered on cost reduction objectives, outperforming revised plan
• Leveraged prior reorganizations to deliver structural reductions of ~$3 billion in 2020
• Additional $3 billion of structural efficiencies through 2023 for a total of $6 billion versus 2019
1 Totals represent cash Opex excluding energy and production taxes. See Supplemental Information for definitions.
44
41
39 39
34 34
38
3
3+
2019 Structural Market /activity
2020 Structural Market /activity
2023
CASH OPEX1
Billion USD
Achieved ~$3 billion of structural reductions in 2020; $6 billion by 2023
0
10
20
2021 2022 - 2025,average
15
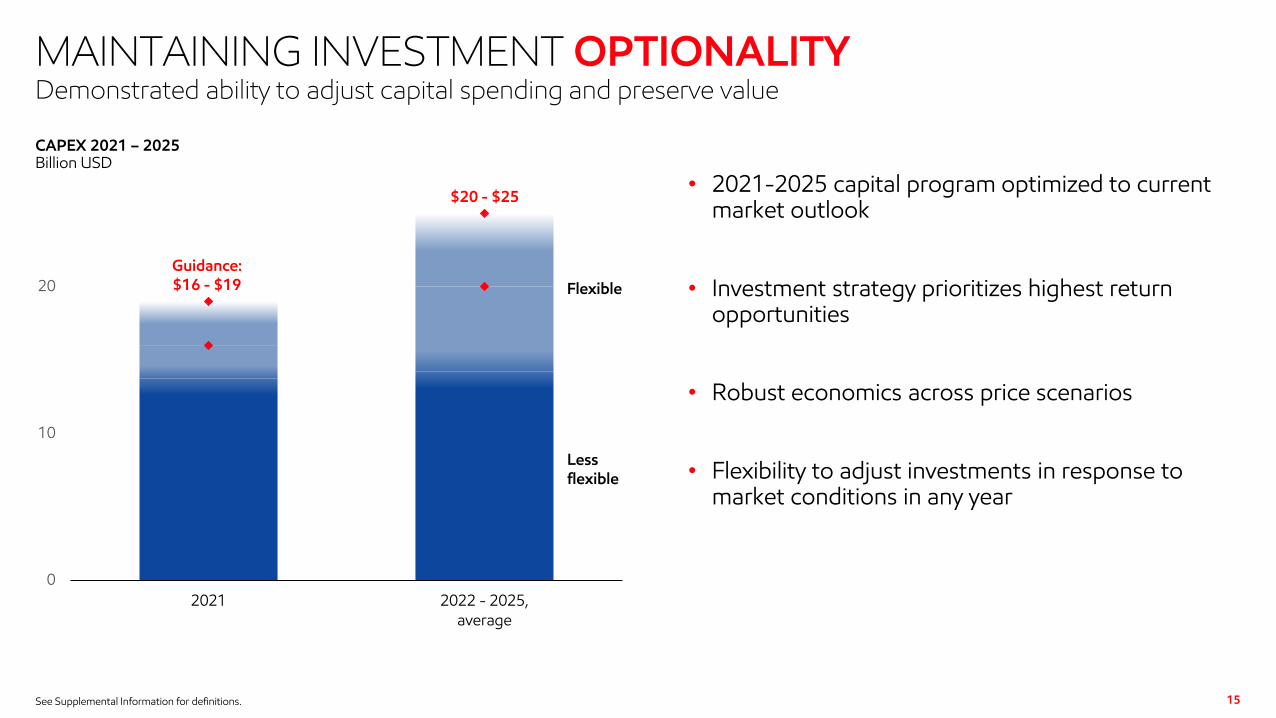
MAINTAINING INVESTMENT OPTIONALITY
• 2021-2025 capital program optimized to current market outlook
• Investment strategy prioritizes highest return opportunities
• Robust economics across price scenarios
• Flexibility to adjust investments in response to market conditions in any year
See Supplemental Information for definitions.
CAPEX 2021 – 2025Billion USD
Demonstrated ability to adjust capital spending and preserve value
Flexible
Lessflexible
$20 - $25
Guidance: $16 - $19
16
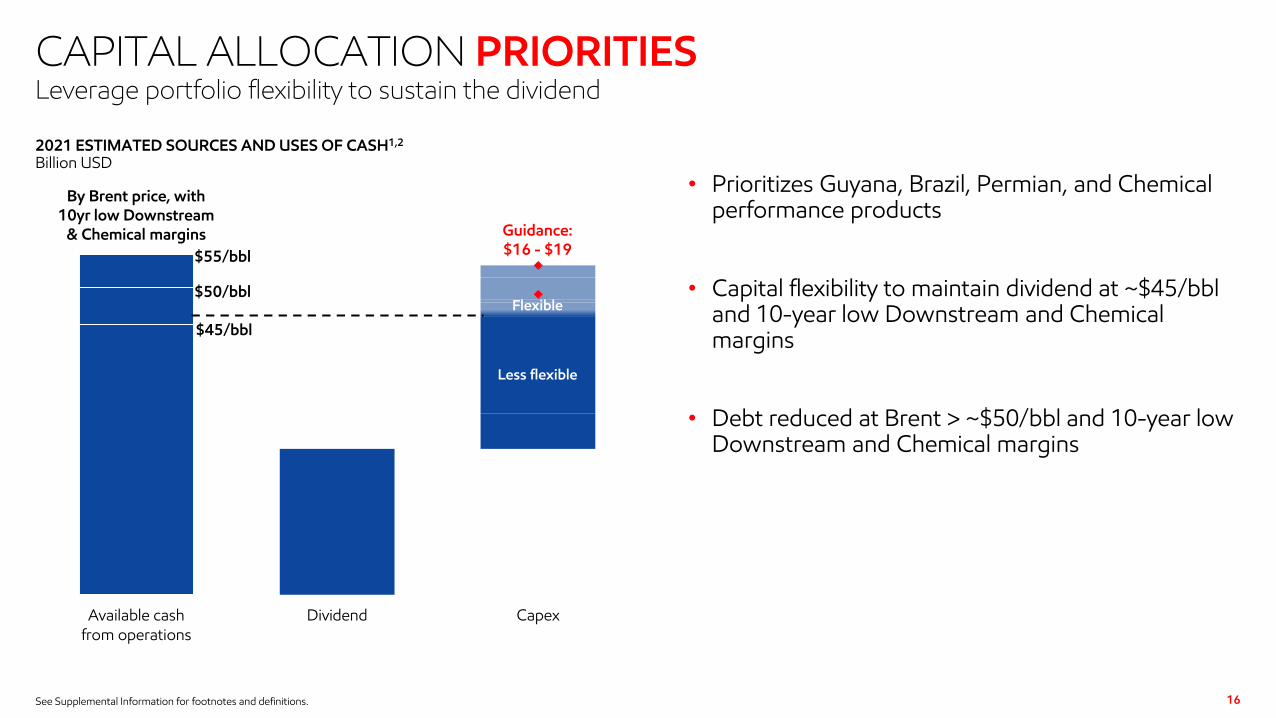
CAPITAL ALLOCATION PRIORITIES
• Prioritizes Guyana, Brazil, Permian, and Chemical performance products
• Capital flexibility to maintain dividend at ~$45/bbland 10-year low Downstream and Chemical margins
• Debt reduced at Brent > ~$50/bbl and 10-year low Downstream and Chemical margins
See Supplemental Information for footnotes and definitions.
$45/bbl
$50/bbl
$55/bbl
Available cashfrom operations
Dividend Capex
2021 ESTIMATED SOURCES AND USES OF CASH1,2
Billion USD
Leverage portfolio flexibility to sustain the dividend
By Brent price, with 10yr low Downstream
& Chemical margins Guidance:$16 - $19
Flexible
Less flexible

17
CAPITAL ALLOCATION PRIORITIES
• Prioritizes Guyana, Brazil, Permian, and Chemical performance products
• Capital flexibility to maintain dividend at ~$35/bbland average Downstream and Chemical margins
• Debt reduced / shareholder distributions at Brent > ~$50/bbl and 10-year average Downstream and Chemical margins
See Supplemental Information for footnotes and definitions.
$40/bbl
$45/bbl
$50/bbl
$55/bbl
Available cashfrom operations
Dividend Capex
2025 ESTIMATED SOURCES AND USES OF CASH1,2
Billion USD
Leverage portfolio flexibility to sustain the dividend
By Brent price, with 10yr avg. Downstream
& Chemical marginsGuidance: $20 - $25
Less flexibleFlexible
Less flexible
18
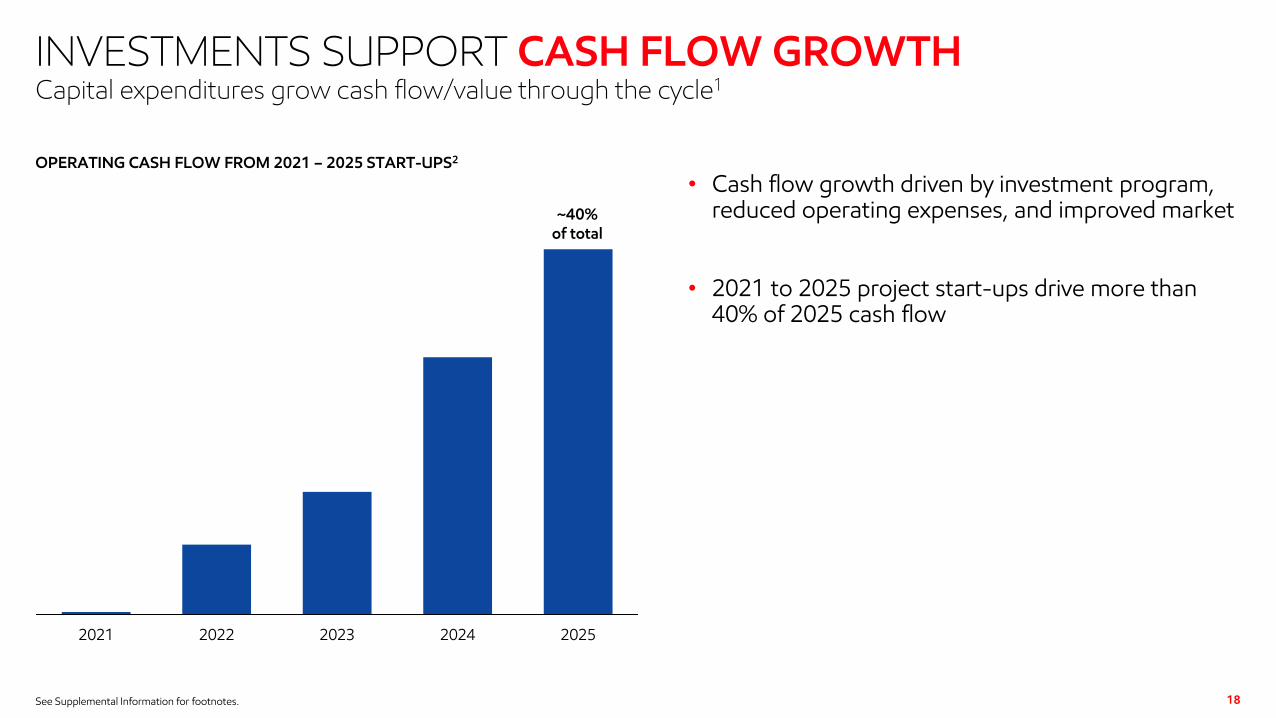
INVESTMENTS SUPPORT CASH FLOW GROWTH
• Cash flow growth driven by investment program, reduced operating expenses, and improved market
• 2021 to 2025 project start-ups drive more than 40% of 2025 cash flow
See Supplemental Information for footnotes.
2021 2022 2023 2024 2025
OPERATING CASH FLOW FROM 2021 – 2025 START-UPS2
Capital expenditures grow cash flow/value through the cycle1
~40% of total

19
INDUSTRY-LEADING INVESTMENTS
• Industry-leading investments focus on highest-return, lowest cost-of-supply opportunities
• Developing projects at less than $40/bbl cost-of-supply
• ~90% of Upstream investments generate >10% returns at ≤$35/bbl
• Average return of 32% at third-party price outlooks3
See Supplemental Information for footnotes and definitions.
0
15
30
45
2021 – 2025 Cumulative Capex
UPSTREAM INVESTMENTS1,2
Brent $/bbl required to generate the cost-of-supply plus 10% return
Upstream capital program prioritizing low cost-of-supply opportunities
$40/bbl Brent

20
STRENGTHENING PERMIAN PERFORMANCE
• Permian development exceeding expectations
• 2020 drilling rates 50% better than plan
− >20% better than 2019
• Drilling and completion costs ~15% lower than plan
− >25% lower than 2019
− ~2/3 of improvements due to performance
− Fracture stages per day 30% better than 2019
See Supplemental Information for footnotes.
75%
150%
2018 2019 2020
DRILLING RATES1
Lateral feet per day; indexed to 2018
DRILLING AND COMPLETION COSTS1
Cost per lateral foot; indexed to 2018
50%
100%
2018 2019 2020
Significantly improving operating and development metrics

0
400
800
2020 2021 2025
21
FLEXIBLE PERMIAN DEVELOPMENT PLAN
• Flexible short-cycle Permian development
• Reduced 2020 Capex ~35% below plan
− 2020 volumes on plan, ~100 Koebd above 2019
• Pace of investment set by:
− Maintaining positive free cash flow
− Delivering industry-leading capital efficiency
− Achieving double digit returns at <$35/bbl
• Longer term outlook of ~700 Koebd by 2025
• Unique technology program brings significant upside to current planning basis
See Supplemental Information for footnotes.
PERMIAN PRODUCTION1
Koebd
Production range
~$60/bbl
~$50/bbl
Options to reduce spend with market changes
22
DELIVERING CAPITAL ALLOCATION PRIORITIES
• Focused capital program delivers exceptional returns and price resiliency
• Restructured organization driving significant efficiencies
• Advantaged projects deliver low-cost supply and near-term cash flow
• Flexibility to efficiently respond to market developments
• Ability to preserve balance sheet and maintain dividend across low price environments

Support
Paris AgreementEngaging in climate related policy, including a carbon tax.
23See Supplemental Information for footnotes.
Operated GHG emissions
-6% since 2016
Absolute emissions have declined since start of the Paris Agreement.1
Global CCS leader
40%
Of all CO2 captured, equivalent to planting ~2 billion trees.3
DELIVERING LOWER EMISSIONSCommitted to addressing risk of climate change
Announced reduction plans to
2025Absolute Upstream GHG emissions to drop by 30%, methane & flaring 40-50%.
Renewables in operations (600MW)
#2 All-time buyer
Of wind / solar power among Oil & Gas; top 5% across all corporates.4
Hydrogen produced
1.3MTA
Developing technology to produce low-carbon H2with CCS at scale.
Low carbon
SolutionsNew business to advance commercial CCS opportunities and deploy technologies.
Research, develop, commercialize
>$3 Billion2
Lower-emission solutions: CCS / hydrogen, biofuels, cogeneration & efficiency.

LOWERING EMISSIONS
• Achieved 6% absolute GHG reduction since Paris Agreement in 20163
• Reducing intensity across businesses results in ~11 to 13% lower emissions2
• Robust processes for continuing efficiency improvements and lower emissions
• Accretive investments deliver additional emission reductions
See Supplemental Information for footnotes.
EXXONMOBIL AND SOCIETY’S EMISSIONS1
Indexed to 2016; %
Committed to reducing emissions
85
90
95
100
105
2016 2017 2018 2019 2020 2021 2022 2023 2024 2025
-11% to -13%2
Global, +2%
ExxonMobil, -6%
Non-OECD, +4%
OECD, -1%
ExxonMobil 2020 estimate (including Covid)
24

0
0.1
0.2
0.3
0.4
0.5
0.6
0.7
0.8
0.9
1
-100%
-75%
-50%
-25%
0%
2015 2030 2045 2060 2075
Society’s emissions
2016
25
REDUCTIONS CONSISTENT WITH PARIS AGREEMENT
See Supplemental Information for footnotes.
EXXONMOBIL AND SOCIETY’S EMISSIONS1,2,3
Percent reduction versus 2016
Plans provide affordable and reliable energy while minimizing environmental impacts
Paris submissions (estimated 2016 Nationally Determined Contributions)
Hypothetical2°C pathway
Hypothetical1.5°C pathway
Netzero
ExxonMobil GHG emissions 2025 Plan
26
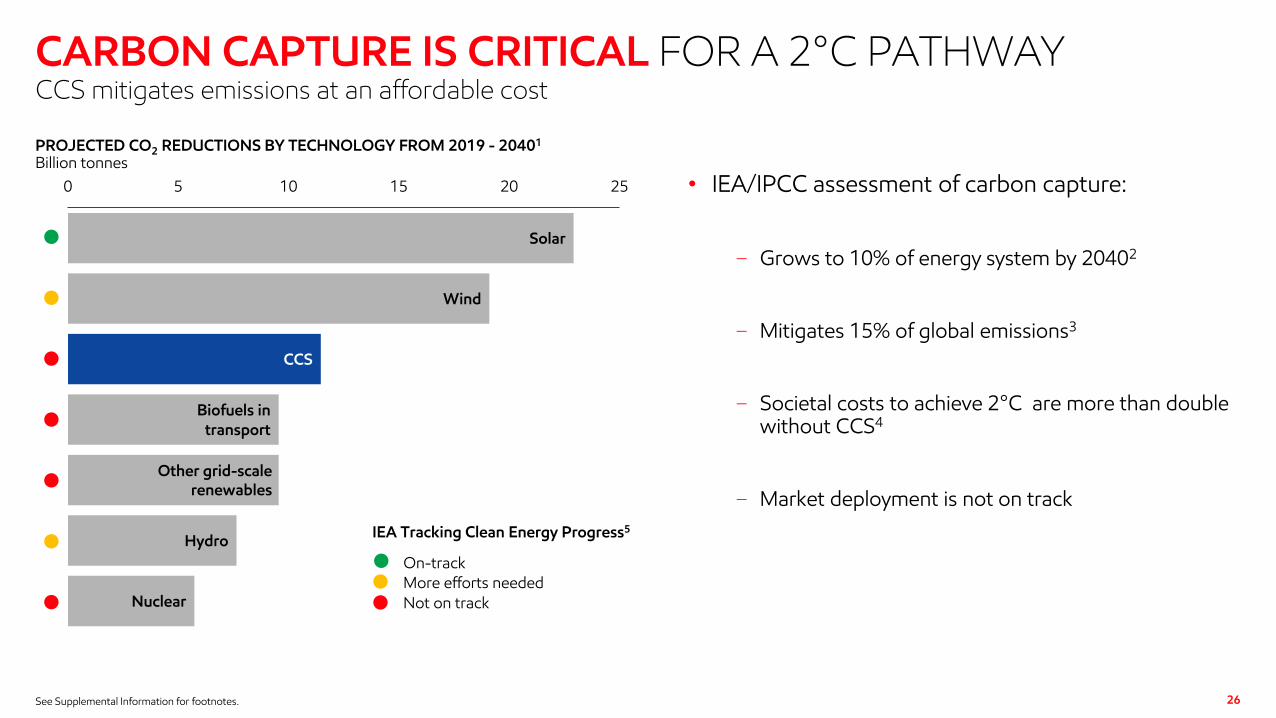
CARBON CAPTURE IS CRITICAL FOR A 2°C PATHWAY
• IEA/IPCC assessment of carbon capture:
− Grows to 10% of energy system by 20402
− Mitigates 15% of global emissions3
− Societal costs to achieve 2°C are more than double without CCS4
− Market deployment is not on track
See Supplemental Information for footnotes.
Solar
Wind
CCS
Biofuels in transport
Hydro
Nuclear
0 5 10 15 20 25
Other grid-scale renewables
PROJECTED CO2 REDUCTIONS BY TECHNOLOGY FROM 2019 - 20401
Billion tonnes
CCS mitigates emissions at an affordable cost
On-trackMore efforts needed
Not on track
IEA Tracking Clean Energy Progress5

EXXONMOBIL IS THE GLOBAL LEADER IN CCS
See Supplemental Information for footnotes.
• Leveraging ExxonMobil’s strengths to significantly advance CCS:
− 30+ years of operating experience
− Process innovation
− Project execution
− Subsurface / reservoir expertise
− Commercializing & scaling new technology
• Evaluating more than 20 new opportunities
− Potential to produce low-carbon Hydrogen
• Establishing Low Carbon Solutions Business to:
− Develop commercial opportunities at scale
− Advance regulatory and legal frameworks
− Commercialize other low-carbon technologies from R&D portfolio
More than 30 years of CCS experience
CUMULATIVE CO2 CAPTURE VOLUME SINCE 19701
Million tonnes
Company B
Remaining 44 companies
ExxonMobil120 MTcaptured
Company C
Company A
Company D
40%Of all CO2
captured since 1970
27

FOCUSED ON SHAREHOLDER VALUE
• Delivering world class safety and reliability
• Driving structural cost reductions
• Advancing flexible portfolio of high-return, cost-advantaged investments
• Maintaining strong dividend and fortified balance sheet
• Reducing emissions while developing needed technologies to support the Paris Agreement
28

Q&A
Mark your calendars for ExxonMobil Investor Day WebcastMarch 3, 2021 8:00 a.m. Central Time
30
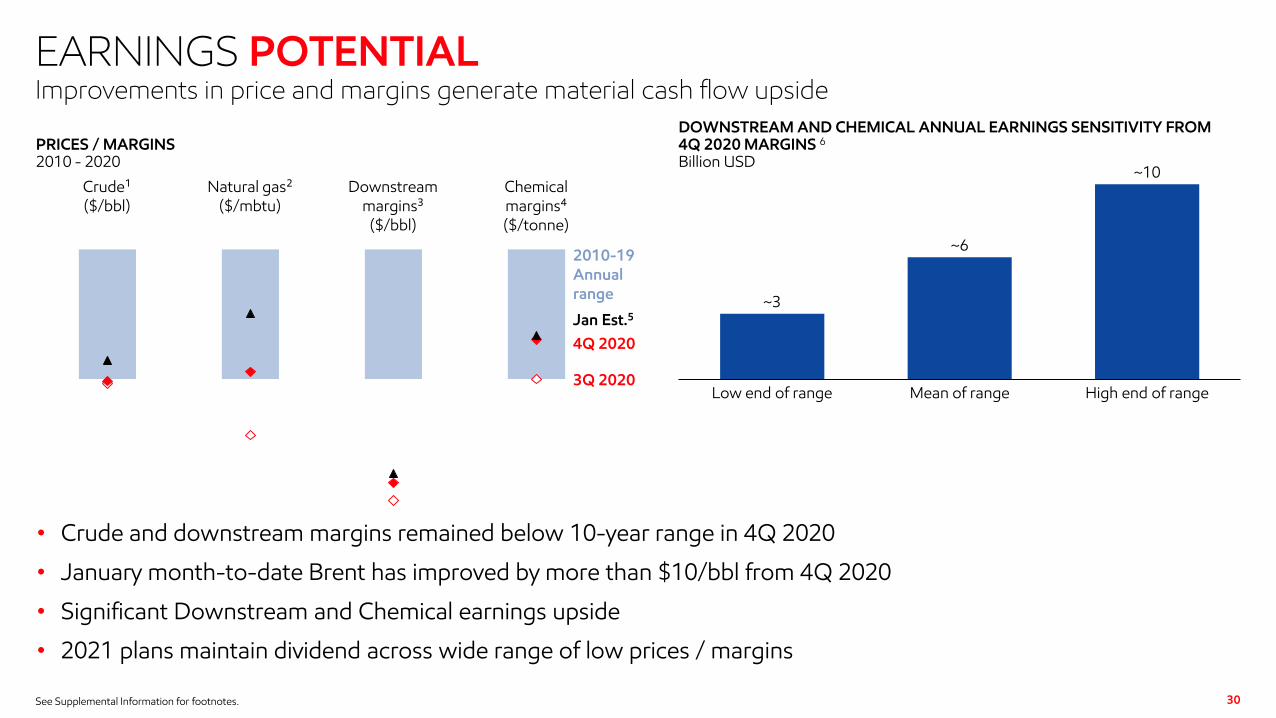
EARNINGS POTENTIAL
See Supplemental Information for footnotes.
• Crude and downstream margins remained below 10-year range in 4Q 2020
• January month-to-date Brent has improved by more than $10/bbl from 4Q 2020
• Significant Downstream and Chemical earnings upside
• 2021 plans maintain dividend across wide range of low prices / margins
Improvements in price and margins generate material cash flow upside
PRICES / MARGINS2010 - 2020
2010-19 Annual range
Crude¹($/bbl)
Natural gas²($/mbtu)
Downstream margins³
($/bbl)
Chemical margins⁴ ($/tonne)
4Q 2020
3Q 2020
~10
High end of range
DOWNSTREAM AND CHEMICAL ANNUAL EARNINGS SENSITIVITY FROM 4Q 2020 MARGINS 6
Billion USD
Mean of rangeLow end of range
~3
~6
Jan Est.5

31
UPSTREAM 4Q20 VS. 3Q20
• Captured benefits of improving gas and LNG markets
• Strategic investment in Guyana, reduced economic curtailments and lower maintenance increased earnings
• Higher expenses due to timing of exploration activity
• Favorable one-time tax items partially offset by unfavorable forex
745
Tax / Forex / other
CONTRIBUTING FACTORS TO CHANGE IN EARNINGSMillion USD
Volume3Q20 ex. Ident. Items
(90)
Price
650
160
Expenses
400
4Q20 ex. Ident. Items
(372)

32
UPSTREAM VOLUMES 4Q20 VS. 3Q20
See Supplemental Information for reconciliation of curtailments.
• Reduced economic curtailment offset by higher government-mandated curtailments
• Lower entitlements with higher prices
• Higher European seasonal gas demand
• Increased liquids production with lower maintenance and growth in Guyana and Abu Dhabi
• Higher gas planned maintenance and higher government limits on Groningen
60
3,672
4Q20Entitle-ments
CONTRIBUTING FACTORS TO CHANGE IN VOLUMESKoebd
3Q20 Curtail-ments
(90)
Demand
85
Liquids growth / other
Gas maint / other
(35)
3,689
(5)
Groningen Limits
33
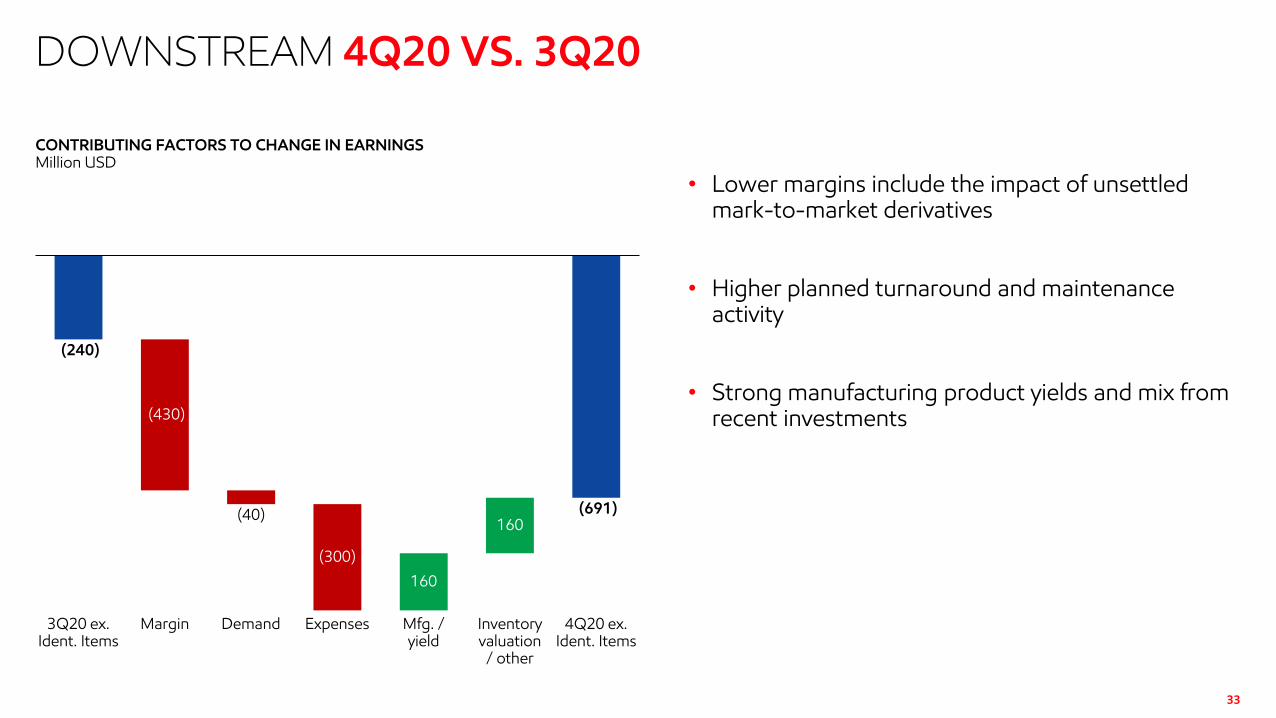
DOWNSTREAM 4Q20 VS. 3Q20
• Lower margins include the impact of unsettled mark-to-market derivatives
• Higher planned turnaround and maintenance activity
• Strong manufacturing product yields and mix from recent investments
CONTRIBUTING FACTORS TO CHANGE IN EARNINGSMillion USD
3Q20 ex. Ident. Items
(300)
(430)
Margin Demand
(40)
Expenses
160
4Q20 ex. Ident. Items
Mfg. /yield
160
Inventory valuation
/ other
(240)
(691)
34
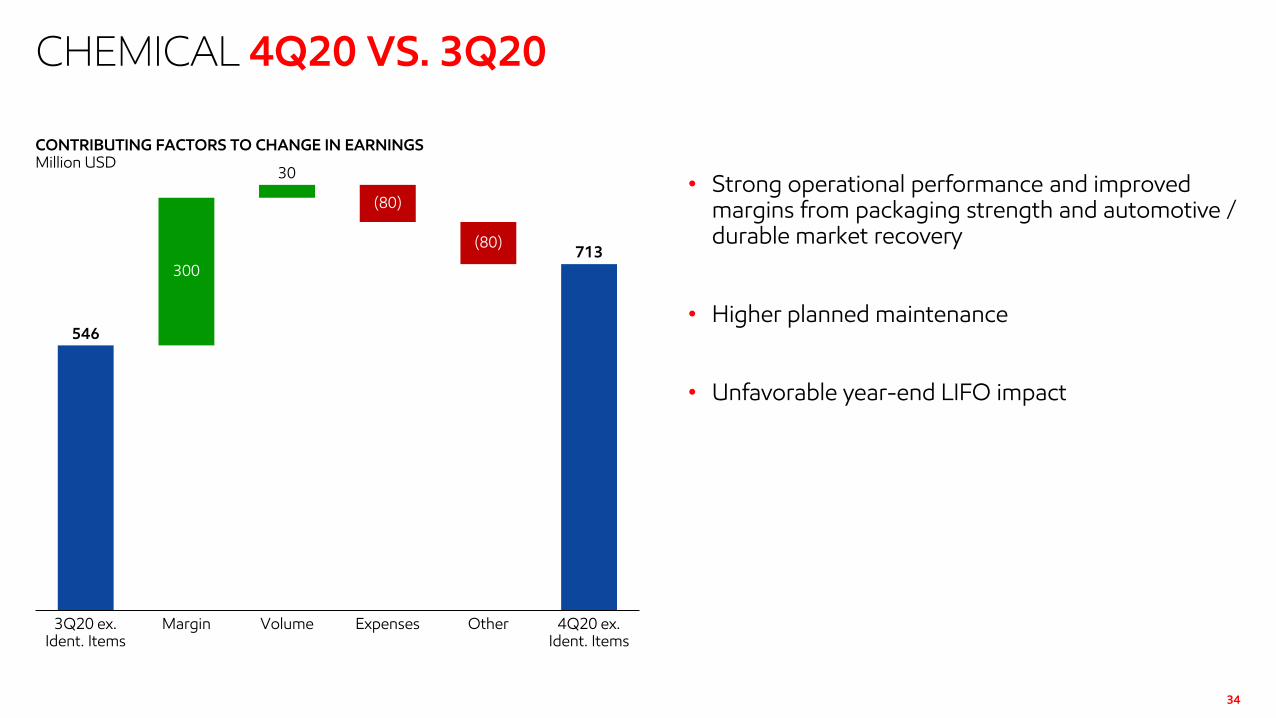
CHEMICAL 4Q20 VS. 3Q20
• Strong operational performance and improved margins from packaging strength and automotive / durable market recovery
• Higher planned maintenance
• Unfavorable year-end LIFO impact
546
CONTRIBUTING FACTORS TO CHANGE IN EARNINGSMillion USD
Volume3Q20 ex. Ident. Items
300
(80)
Margin Expenses
(80)
Other 4Q20 ex. Ident. Items
713
30

35
UPSTREAM 2020 VS. 2019
• Unprecedented demand destruction significantly impacted liquids and gas realizations
• High-return liquids growth in Permian and Guyana partially offset divestments, curtailments, and Groningen limits
• Structural opex reduction drove earnings benefits
• Favorable tax items and forex
10,008
(336)
2019 ex. Ident. Items
(11,210)
CONTRIBUTING FACTORS TO CHANGE IN EARNINGSMillion USD
Tax / otherPrice Volume Expenses
(300)
960
2020 ex. Ident. Items
210
36
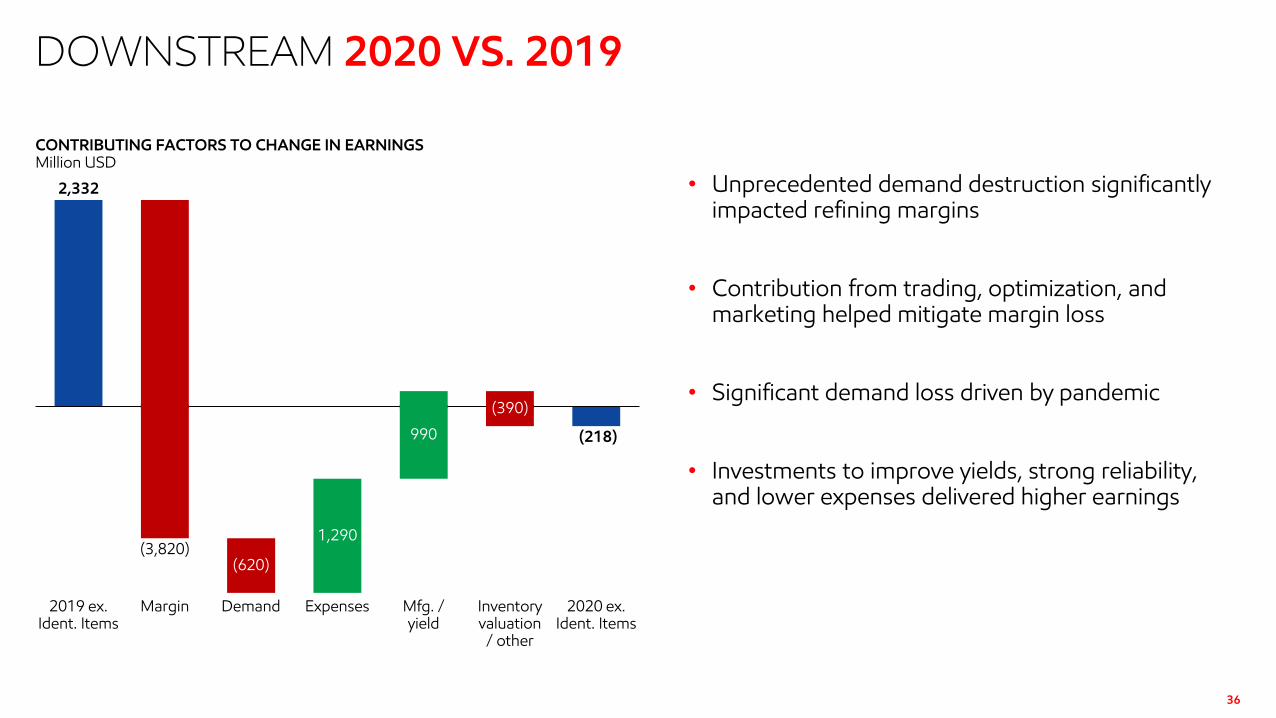
DOWNSTREAM 2020 VS. 2019
• Unprecedented demand destruction significantly impacted refining margins
• Contribution from trading, optimization, and marketing helped mitigate margin loss
• Significant demand loss driven by pandemic
• Investments to improve yields, strong reliability, and lower expenses delivered higher earnings
2,332
Mfg. /yield
CONTRIBUTING FACTORS TO CHANGE IN EARNINGSMillion USD
2019 ex. Ident. Items
Margin
(620)
Demand
1,290
Expenses
990
(390)
Inventory valuation
/ other
2020 ex. Ident. Items
(218)
(3,820)

37
CHEMICAL 2020 VS. 2019
• Strong reliability and lower feed costs improved margins
• COVID impacted sales volumes across multiple businesses
• Delivered aggressive cost reduction through supply chain efficiencies, contractor management, and activity pacing
590
2,077
Margin
710
2019 ex. Ident. Items
(150)
930
2020 ex. Ident. Items
Volume Expenses
CONTRIBUTING FACTORS TO CHANGE IN EARNINGSMillion USD

38
SUPPLEMENTAL INFORMATION
IDENTIFIED ITEMS RECONCILIATION FOURTH QUARTER THIRD QUARTER TWELVE MONTHS
2020 2019 2020 2020 2019
Earnings / (Loss) U.S. GAAP (20.1) 5.7 (0.7) (22.4) 14.3
Identified Items Included in Earnings / (Loss)
Noncash inventory valuation - lower of cost or market - - 0.1 (0.1) -
Impairment (19.3) - - (20.1) -
Tax and Other items (asset management, severance) (0.9) 3.9 - (0.9) 4.7
Corporate Total (20.2) 3.9 0.1 (21.0) 4.7
Earnings/(Loss) Excluding Identified Items 0.1 1.8 (0.8) (1.4) 9.6
Billions of dollars unless specified otherwise.Due to rounding, numbers presented above may not add up precisely to the totals indicated.

39
SUPPLEMENTAL INFORMATION
1 Koebd
“Curtailments,” as used on slides 7 and 32, includes both (1) government mandates and (2) economic curtailments. Government mandates are shown as a separate category below. Economic curtailments are included below as part of the “Demand / Other” category.
UPSTREAM VOLUME FACTOR ANALYSIS1 4Q20 vs. 3Q20 4Q20 vs. 4Q19 2020 vs. 2019
Prior Period 3,672 4,018 3,952
Downtime / Maintenance +34 +66 +50
Growth / Decline +46 +56 +92
Entitlement / Divestments -91 -180 -93
Government mandates -48 -188 -110
Demand / Other +76 -83 -130
Current Period 3,689 3,689 3,761

SUPPLEMENTAL INFORMATION
Slide 41) Period-to-period change in earnings as a result of fair value accounting for
unsettled derivatives.
Slide 91) Excludes impact of impairments classified as identified items.2) Includes PP&E Adds of ($3.6B) and net investments / advances of ($0.4B) in
4Q20.3) Ending debt is the sum of (1) Notes and loans payable and (2) Long-term debt as
reported in Form 10-K, at the end of the fourth quarter.
Slide 131) Lost-time injuries and illness rate (incidents per 200,000 work hours).2) Reduction is in Cash Operating Costs, comparing 2020 to 2019. See definitions
on page 43.3) Compared to 2016 levels based on assets operated by ExxonMobil. Preliminary
analysis assumes performance from OBO assets is similar to 2019.4) Gross recoverable resource.5) Global CCS Institute 2020 report and ExxonMobil analysis of 2020 facility data.
Car equivalency calculated with US EPA GHG equivalency calculator.
Slide 161) 2021 Available Cash from Operations assumes Downstream and Chemical
margins at 10-year annual lows from 2010 – 2019. See definitions on page 43. 2) Any decisions on future dividend levels is at the discretion of the Board of
Directors. This chart assumes dividends per share are held flat relative to 4Q20 levels.
40
Slide 171) 2025 Available Cash from Operations assumes Downstream and Chemical
at the average of the annual margins from 2010 – 2019. See definitions on page 43.
2) Any decisions on future dividend levels is at the discretion of the Board of Directors. This chart assumes dividends per share are held flat relative to 4Q20 levels.
Slide 181) Operating cash flow on this slide is earnings plus Depreciation, Depletion,
and Amortization. The chart indicates estimated operating cash flow for projects that are completed in years 2021 through 2025.
2) Based on 4Q/Dec 2020 IHS forecasts for Brent price and Downstream. IHS Fall 2020 margin forecast for Chemical margins where appropriate margin markers available, otherwise company estimates. Price and margins applied to ExxonMobil footprint.
Slide 191) Includes projects that bring on new volumes.2) Breakeven based on cost-of-supply to generate a minimum 10% return on
a money-forward basis.3) At IHS price forecast.
SUPPLEMENTAL INFORMATION
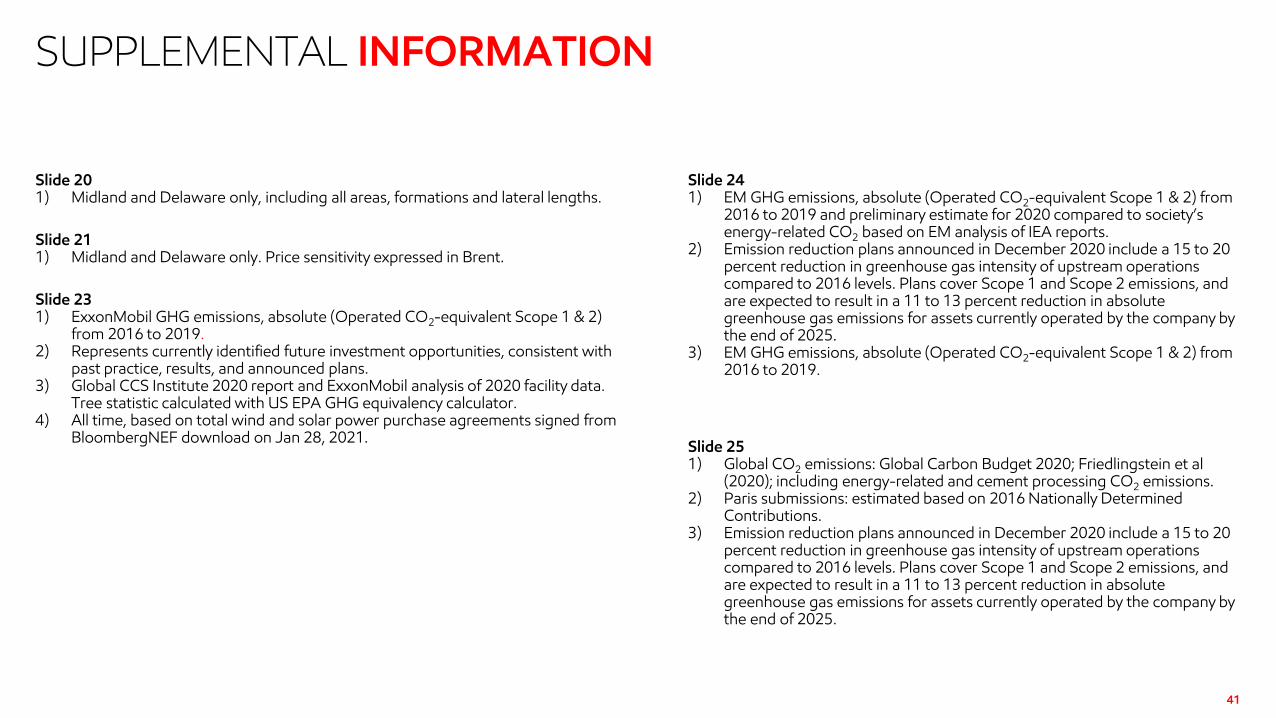
Slide 201) Midland and Delaware only, including all areas, formations and lateral lengths.
Slide 211) Midland and Delaware only. Price sensitivity expressed in Brent.
Slide 231) ExxonMobil GHG emissions, absolute (Operated CO2-equivalent Scope 1 & 2)
from 2016 to 2019.2) Represents currently identified future investment opportunities, consistent with
past practice, results, and announced plans.3) Global CCS Institute 2020 report and ExxonMobil analysis of 2020 facility data.
Tree statistic calculated with US EPA GHG equivalency calculator. 4) All time, based on total wind and solar power purchase agreements signed from
BloombergNEF download on Jan 28, 2021.
41
Slide 241) EM GHG emissions, absolute (Operated CO2-equivalent Scope 1 & 2) from
2016 to 2019 and preliminary estimate for 2020 compared to society’s energy-related CO2 based on EM analysis of IEA reports.
2) Emission reduction plans announced in December 2020 include a 15 to 20 percent reduction in greenhouse gas intensity of upstream operations compared to 2016 levels. Plans cover Scope 1 and Scope 2 emissions, and are expected to result in a 11 to 13 percent reduction in absolute greenhouse gas emissions for assets currently operated by the company by the end of 2025.
3) EM GHG emissions, absolute (Operated CO2-equivalent Scope 1 & 2) from 2016 to 2019.
Slide 251) Global CO2 emissions: Global Carbon Budget 2020; Friedlingstein et al
(2020); including energy-related and cement processing CO2 emissions.2) Paris submissions: estimated based on 2016 Nationally Determined
Contributions.3) Emission reduction plans announced in December 2020 include a 15 to 20
percent reduction in greenhouse gas intensity of upstream operations compared to 2016 levels. Plans cover Scope 1 and Scope 2 emissions, and are expected to result in a 11 to 13 percent reduction in absolute greenhouse gas emissions for assets currently operated by the company by the end of 2025.

SUPPLEMENTAL INFORMATION
Slide 261) IEA World Energy Outlook 2020. Comparison of IEA Sustainable Development
Scenario vs. IEA Stated Policies Scenario.2) Average across IPCC’s 74 Lower 2°C scenarios in IPCC SR1.5.3) IEA (2020) CCUS in Clean Energy Transitions.4) IPCC (5th Assessment) assessed increase in societal costs to achieve a 2°C
outcome.5) IEA (2020) Tracking Clean Energy Progress.
Slide 271) 40% of all anthropogenic CO2 captured since 1970. Global CCS Institute 2020
report and ExxonMobil analysis of 2020 facility data.
42
Slide 301) Source: S&P Global Platts.2) Source: ICE. Equal weighting of Henry Hub and NBP. 3) Source: S&P Global Platts and ExxonMobil analysis. Equal weighting of U.S.
Gulf Coast (Maya – Coking), Northwest Europe (Brent – Catalytic Cracking), and Singapore (Dubai – Catalytic Cracking) netted for industry average Opex and renewable identification numbers (RINS).
4) Source: IHS Markit, Platts, and company estimates. Weighting of polyethylene, polypropylene, and paraxylene based on ExxonMobil capacity.
5) Internal estimate based on available January 2021 data.6) Price/Margin basis consistent with supplemental notes 3 & 4 (above);
reflects annual earnings upside versus annualized 4Q20 margin basis.
43
SUPPLEMENTAL INFORMATION
Definitions
Available Cash from Operations provides an indication of cash flow available to fund shareholder distributions, capex, and debt reduction and is calculated as the sum of (1) net cash provided by operating activities and (2) net cash used in investing activities, both from the Consolidated Statement of Cash Flows, and (3) capital and exploration expenditures.
Cash Flow from Operations and Asset Sales. Cash flow from operations and asset sales is the sum of the net cash provided by operating activities and proceeds associated with sales of subsidiaries, property, plant and equipment, and sales and returns of investments from the Summary statement of cash flows. This cash flow reflects the total sources of cash from both operating the Corporation’s assets and from the divesting of assets.
Cash Operating Costs and Cash Opex. Cash operating costs consist of (1) Production and manufacturing expenses, (2) Selling, general and administrative expenses, and (3) Exploration expenses, including dry holes from ExxonMobil’s consolidated statement of income. The sums of these income statement lines serve as an indication of cash operating costs and do not reflect the total cash operating costs of the Corporation. This measure is useful in understanding the Corporation’s efforts to conserve cash on hand while progressing planned projects. Cash Opex as used on slides 6, 8, and 14 is a proxy for this measure that includes equity company cash expenses.
Flexible Capex. Flexible Capex includes those investments with minimal costs or value loss to defer expenditures, such as investments in short cycle businesses like unconventionals, projects that have not commenced or are early in construction and with limited penalty to pause.
Less flexible Capex includes projects conducted for safety, environmental and regulatory reasons, projects already in execution with penalties or loss of value associated with pausing, and investments made in order to retain rights or options for potential future investment.
Project. The term “project” as used in this presentation can refer to a variety of different activities and does not necessarily have the same meaning as in any government payment transparency reports.
Resources, resource base, and recoverable resources. Along with similar terms, these refer to the total remaining estimated quantities of oil and natural gas that are expected to be ultimately recoverable. ExxonMobil refers to new discoveries and acquisitions of discovered resources as resource additions. The resource base includes quantities of oil and natural gas classified as proved reserves, as well as, quantities that are not yet classified as proved reserves, but that are expected to be ultimately recoverable. The term “resource base” or similar terms is not intended to correspond to SEC definitions such as “probable” or “possible” reserves. The term “in-place” refers to those quantities of oil and natural gas estimated to be contained in known accumulations and includes recoverable and unrecoverable amounts. “Potential” resource amounts are not currently included in the resource base.
Returns, investment returns, project returns. Unless referring specifically to ROCE, references to returns, investment returns, project returns, and similar terms mean futurediscounted cash flow returns on future capital investments based on current company estimates. Investment returns exclude prior exploration and acquisition costs.
Recommended