Fourth Quarter 2017 Earnings Conference Call
November 7, 2017
Safe Harbor Statement Our commentary and responses to your questions may contain forward-looking statements, including our outlook for the next fiscal year, and Emerson undertakes no obligation to update any such statements to reflect later developments. Factors that could cause actual results to vary materially from those discussed today are provided in our most recent Annual Report on Form 10-K and subsequent reports as filed with the SEC.
Non-GAAP Measures In this call we will discuss some non-GAAP measures (denoted with *) in talking about our company’s performance, and the reconciliation of those measures to the most comparable GAAP measures is contained within this presentation or available at our website www.Emerson.com under Investors.
2
2016 2017
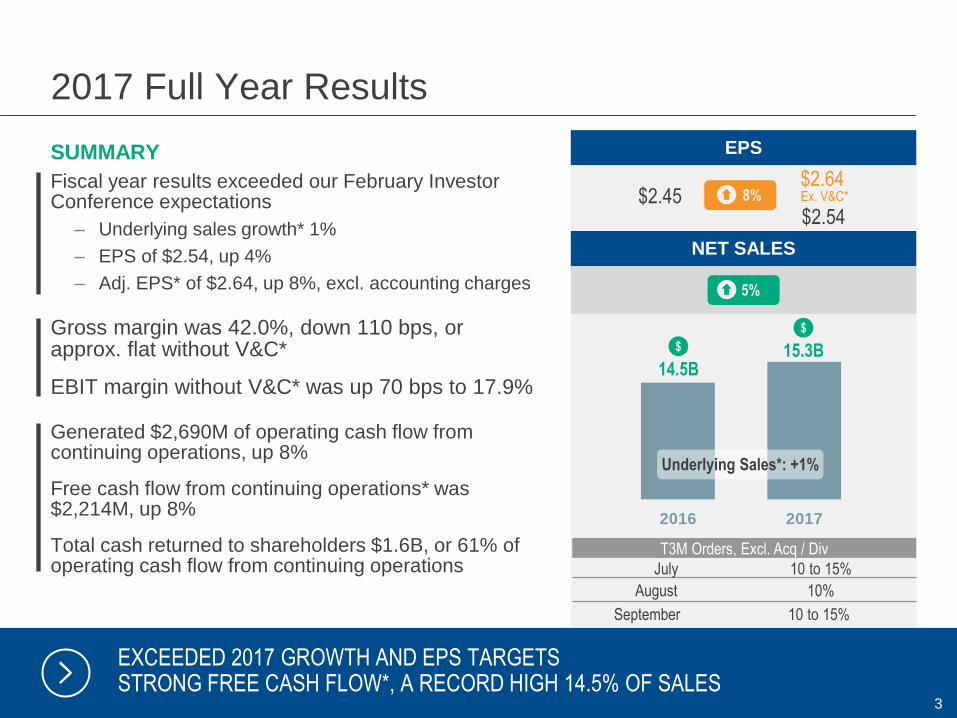
2017 Full Year Results
EXCEEDED 2017 GROWTH AND EPS TARGETS STRONG FREE CASH FLOW*, A RECORD HIGH 14.5% OF SALES
Fiscal year results exceeded our February Investor Conference expectations
– Underlying sales growth* 1%
– EPS of $2.54, up 4%
– Adj. EPS* of $2.64, up 8%, excl. accounting charges
Gross margin was 42.0%, down 110 bps, or approx. flat without V&C*
EBIT margin without V&C* was up 70 bps to 17.9%
Generated $2,690M of operating cash flow from continuing operations, up 8%
Free cash flow from continuing operations* was $2,214M, up 8%
Total cash returned to shareholders $1.6B, or 61% of operating cash flow from continuing operations
SUMMARY EPS
8%
14.5B
$ 15.3B
$
$2.45 $2.54
$2.64 Ex. V&C*
NET SALES
5%
T3M Orders, Excl. Acq / Div
July 10 to 15%
August 10%
September 10 to 15%
Underlying Sales*: +1%
3
2016 2017
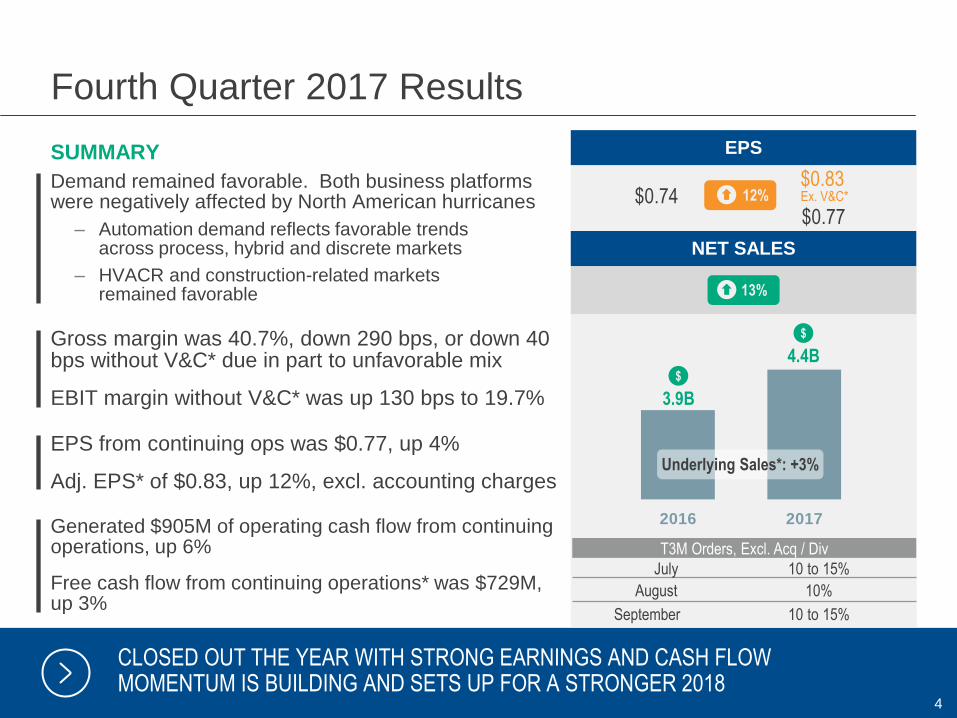
Fourth Quarter 2017 Results
CLOSED OUT THE YEAR WITH STRONG EARNINGS AND CASH FLOW MOMENTUM IS BUILDING AND SETS UP FOR A STRONGER 2018
Demand remained favorable. Both business platforms were negatively affected by North American hurricanes
– Automation demand reflects favorable trends across process, hybrid and discrete markets
– HVACR and construction-related markets remained favorable
Gross margin was 40.7%, down 290 bps, or down 40 bps without V&C* due in part to unfavorable mix
EBIT margin without V&C* was up 130 bps to 19.7%
EPS from continuing ops was $0.77, up 4%
Adj. EPS* of $0.83, up 12%, excl. accounting charges
Generated $905M of operating cash flow from continuing operations, up 6%
Free cash flow from continuing operations* was $729M, up 3%
SUMMARY EPS
12%
3.9B
$
4.4B
$
$0.74 $0.77
$0.83 Ex. V&C*
NET SALES
13%
Underlying Sales*: +3%
4
T3M Orders, Excl. Acq / Div
July 10 to 15%
August 10%
September 10 to 15%
Underlying sales* +3%
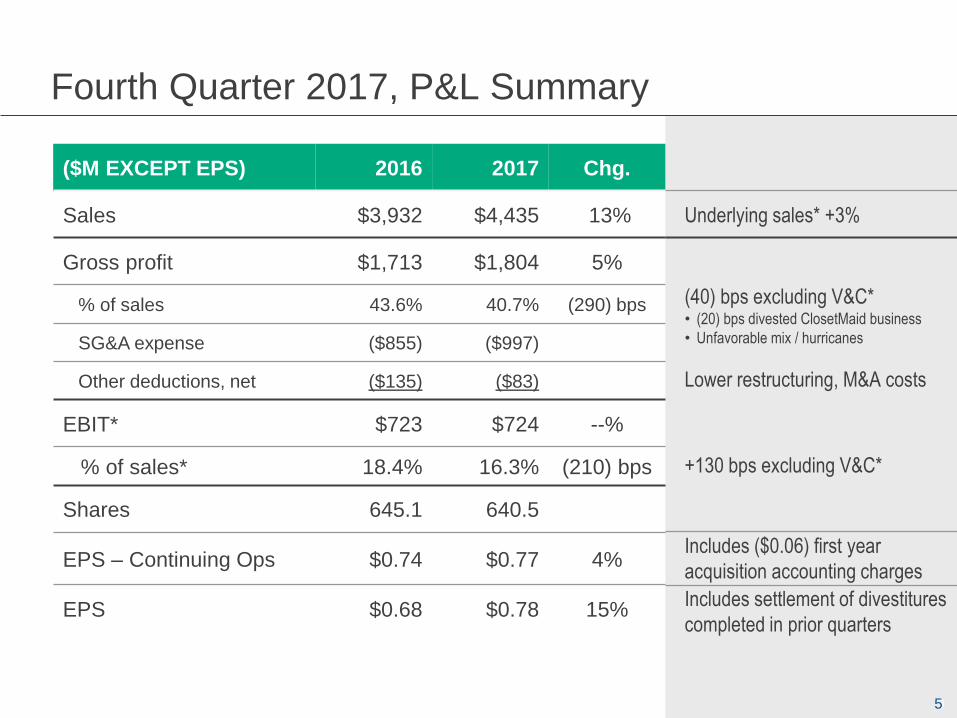
Fourth Quarter 2017, P&L Summary
($M EXCEPT EPS) 2016 2017 Chg.
Sales $3,932 $4,435 13%
Gross profit $1,713 $1,804 5%
% of sales 43.6% 40.7% (290) bps
SG&A expense ($855) ($997)
Other deductions, net ($135) ($83)
EBIT* $723 $724 --%
% of sales* 18.4% 16.3% (210) bps
Shares 645.1 640.5
EPS – Continuing Ops $0.74 $0.77 4%
EPS $0.68 $0.78 15%
3
(40) bps excluding V&C* • (20) bps divested ClosetMaid business
• Unfavorable mix / hurricanes
Lower restructuring, M&A costs
+130 bps excluding V&C*
Includes ($0.06) first year
acquisition accounting charges
5
Includes settlement of divestitures
completed in prior quarters
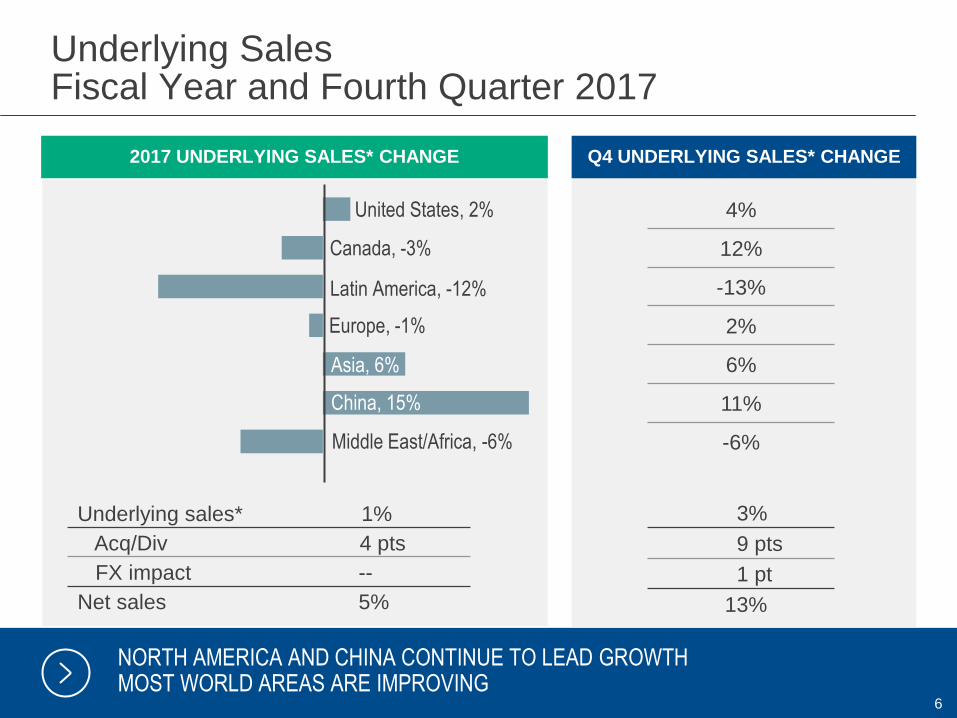
Underlying Sales Fiscal Year and Fourth Quarter 2017
NORTH AMERICA AND CHINA CONTINUE TO LEAD GROWTH MOST WORLD AREAS ARE IMPROVING
United States, 2%
Canada, -3%
Latin America, -12%
Europe, -1%
Asia, 6%
China, 15%
Middle East/Africa, -6%
Underlying sales* 1%
Acq/Div 4 pts
FX impact --
Net sales 5%
2017 UNDERLYING SALES* CHANGE Q4 UNDERLYING SALES* CHANGE
4%
12%
-13%
2%
6%
11%
-6%
3%
9 pts
1 pt
13%
6
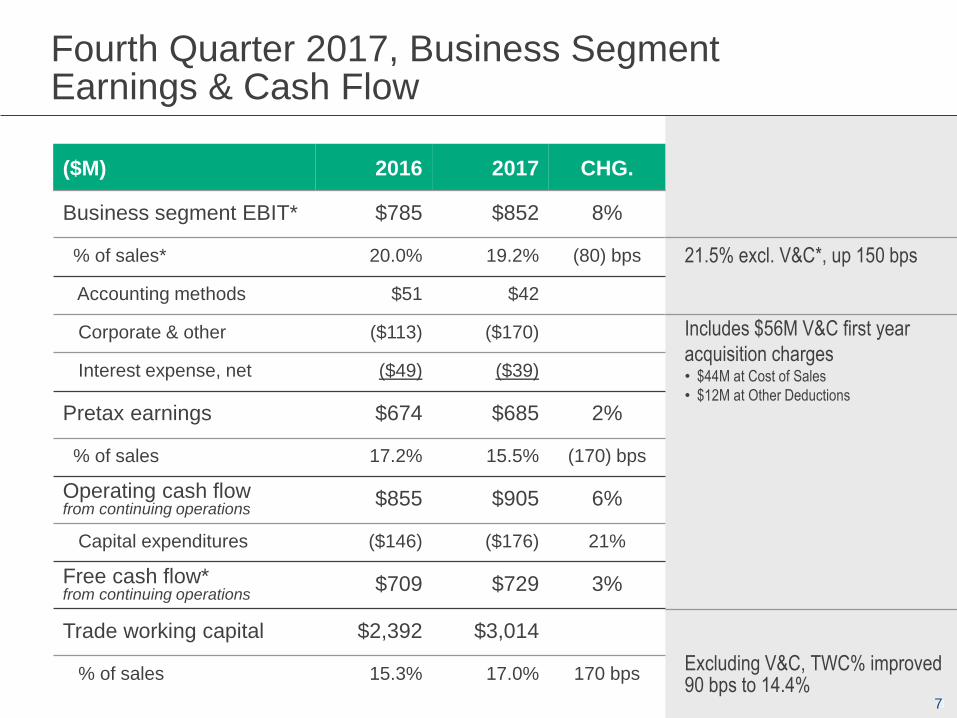
21.5% excl. V&C*, up 150 bps
Fourth Quarter 2017, Business Segment Earnings & Cash Flow
($M) 2016 2017 CHG.
Business segment EBIT* $785 $852 8%
% of sales* 20.0% 19.2% (80) bps
Accounting methods $51 $42
Corporate & other ($113) ($170)
Interest expense, net ($49) ($39)
Pretax earnings $674 $685 2%
% of sales 17.2% 15.5% (170) bps
Operating cash flow from continuing operations
$855 $905 6%
Capital expenditures ($146) ($176) 21%
Free cash flow* from continuing operations
$709 $729 3%
Trade working capital $2,392 $3,014
% of sales 15.3% 17.0% 170 bps
3
Includes $56M V&C first year
acquisition charges • $44M at Cost of Sales
• $12M at Other Deductions
Excluding V&C, TWC% improved 90 bps to 14.4%
7
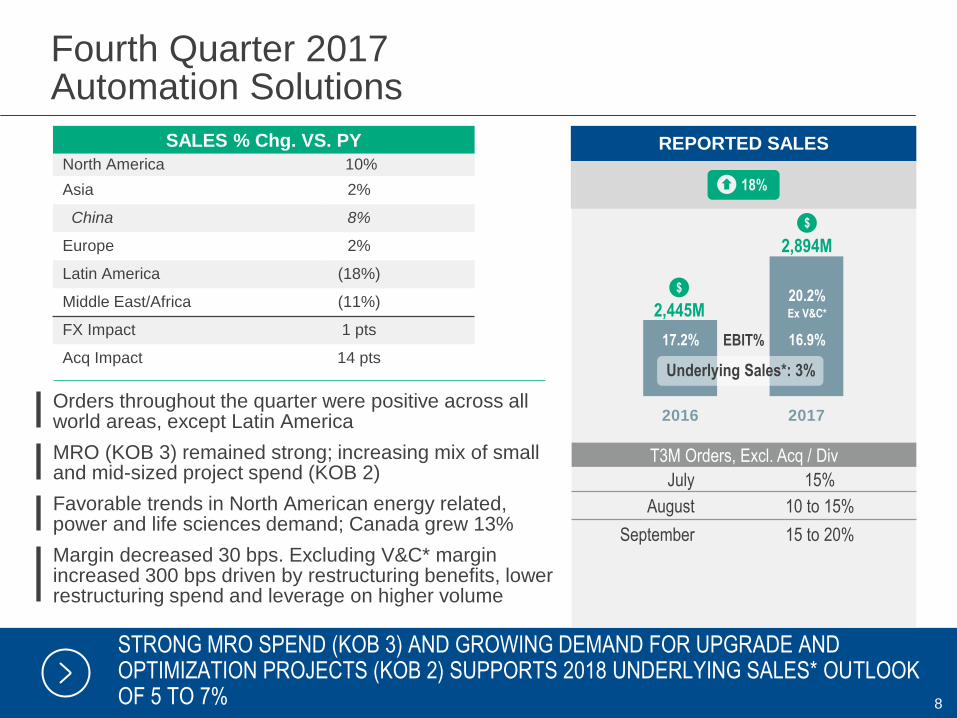
Fourth Quarter 2017 Automation Solutions
STRONG MRO SPEND (KOB 3) AND GROWING DEMAND FOR UPGRADE AND OPTIMIZATION PROJECTS (KOB 2) SUPPORTS 2018 UNDERLYING SALES* OUTLOOK OF 5 TO 7%
SALES % Chg. VS. PY
North America 10%
Asia 2%
China 8%
Europe 2%
Latin America (18%)
Middle East/Africa (11%)
FX Impact 1 pts
Acq Impact 14 pts
Orders throughout the quarter were positive across all world areas, except Latin America
MRO (KOB 3) remained strong; increasing mix of small and mid-sized project spend (KOB 2)
Favorable trends in North American energy related, power and life sciences demand; Canada grew 13%
Margin decreased 30 bps. Excluding V&C* margin increased 300 bps driven by restructuring benefits, lower restructuring spend and leverage on higher volume
REPORTED SALES
2016 2017
2,445M
2,894M
EBIT% 17.2% 16.9%
20.2% Ex V&C*
$
$
T3M Orders, Excl. Acq / Div
July 15%
August 10 to 15%
September 15 to 20%
18%
Underlying Sales*: 3%
8
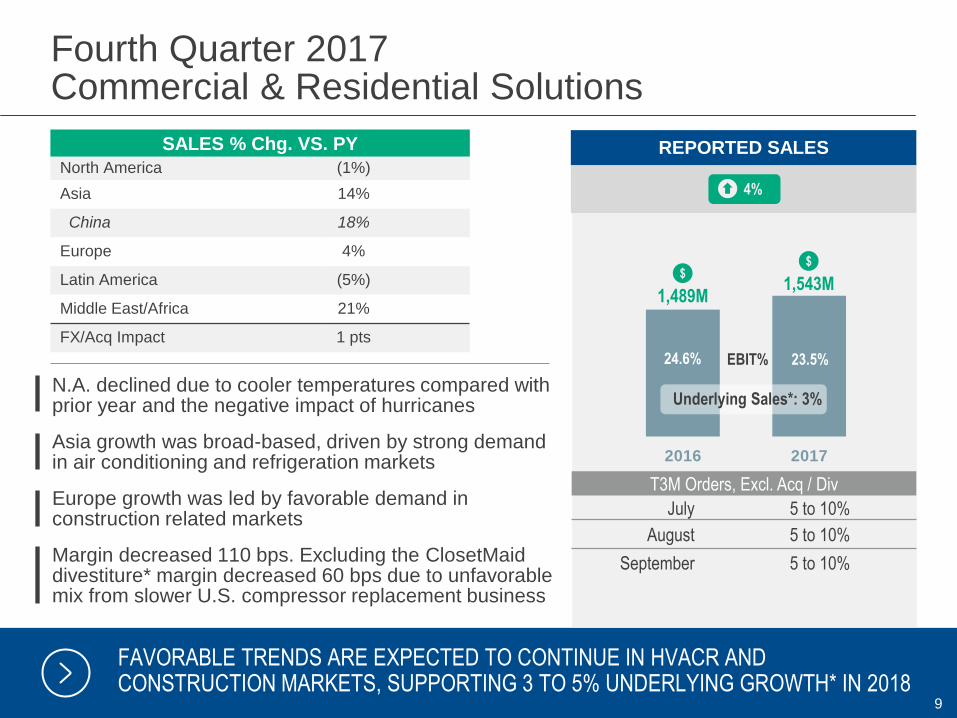
Fourth Quarter 2017 Commercial & Residential Solutions
FAVORABLE TRENDS ARE EXPECTED TO CONTINUE IN HVACR AND CONSTRUCTION MARKETS, SUPPORTING 3 TO 5% UNDERLYING GROWTH* IN 2018
SALES % Chg. VS. PY
North America (1%)
Asia 14%
China 18%
Europe 4%
Latin America (5%)
Middle East/Africa 21%
FX/Acq Impact 1 pts
N.A. declined due to cooler temperatures compared with prior year and the negative impact of hurricanes
Asia growth was broad-based, driven by strong demand in air conditioning and refrigeration markets
Europe growth was led by favorable demand in construction related markets
Margin decreased 110 bps. Excluding the ClosetMaid divestiture* margin decreased 60 bps due to unfavorable mix from slower U.S. compressor replacement business
REPORTED SALES
2016 2017
1,489M
$ 1,543M
$
EBIT% 24.6% 23.5%
Underlying Sales*: 3%
4%
9
T3M Orders, Excl. Acq / Div
July 5 to 10%
August 5 to 10%
September 5 to 10%
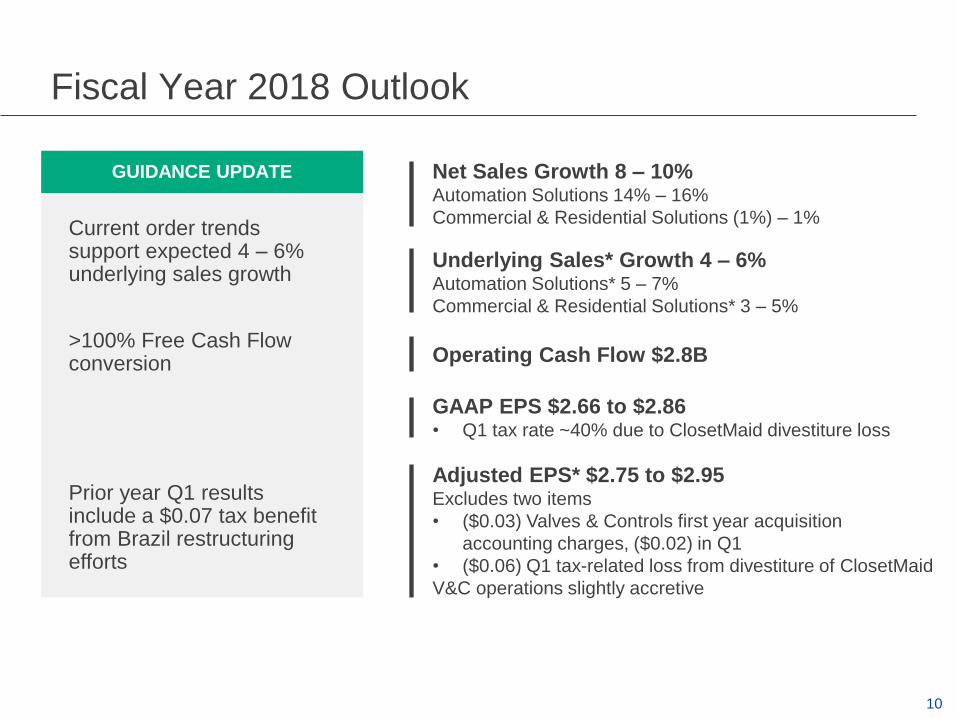
Fiscal Year 2018 Outlook
10
GUIDANCE UPDATE
Current order trends support expected 4 – 6% underlying sales growth
>100% Free Cash Flow conversion
Prior year Q1 results include a $0.07 tax benefit from Brazil restructuring efforts
Net Sales Growth 8 – 10% Automation Solutions 14% – 16%
Commercial & Residential Solutions (1%) – 1%
Underlying Sales* Growth 4 – 6% Automation Solutions* 5 – 7%
Commercial & Residential Solutions* 3 – 5%
Operating Cash Flow $2.8B
GAAP EPS $2.66 to $2.86 • Q1 tax rate ~40% due to ClosetMaid divestiture loss
Adjusted EPS* $2.75 to $2.95 Excludes two items
• ($0.03) Valves & Controls first year acquisition
accounting charges, ($0.02) in Q1
• ($0.06) Q1 tax-related loss from divestiture of ClosetMaid
V&C operations slightly accretive
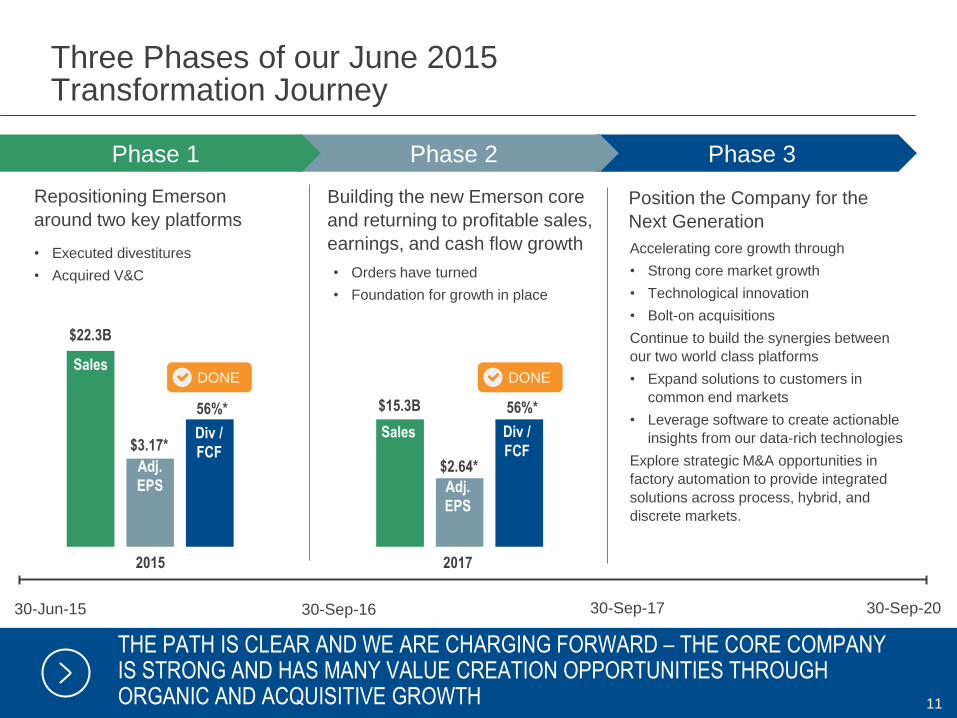
Phase 3 Phase 2
Three Phases of our June 2015 Transformation Journey
THE PATH IS CLEAR AND WE ARE CHARGING FORWARD – THE CORE COMPANY IS STRONG AND HAS MANY VALUE CREATION OPPORTUNITIES THROUGH ORGANIC AND ACQUISITIVE GROWTH 11
30-Sep-17
• Executed divestitures
• Acquired V&C
2015 2017
$22.3B
$3.17*
56%* $15.3B
$2.64*
56%*
Repositioning Emerson
around two key platforms
Building the new Emerson core
and returning to profitable sales,
earnings, and cash flow growth
30-Jun-15 30-Sep-16
Phase 1
• Orders have turned
• Foundation for growth in place
Position the Company for the
Next Generation
Accelerating core growth through
• Strong core market growth
• Technological innovation
• Bolt-on acquisitions
Continue to build the synergies between
our two world class platforms
• Expand solutions to customers in
common end markets
• Leverage software to create actionable
insights from our data-rich technologies
Explore strategic M&A opportunities in
factory automation to provide integrated
solutions across process, hybrid, and
discrete markets.
Sales
Div /
FCF Adj.
EPS
30-Sep-20
DONE DONE
Sales Div /
FCF
Adj.
EPS
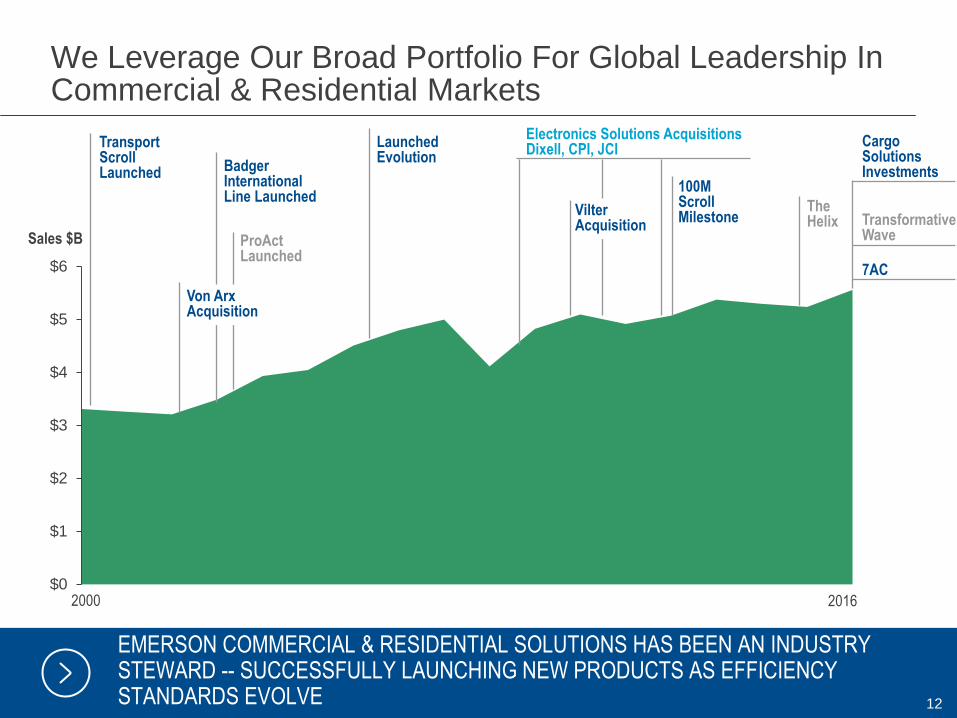
We Leverage Our Broad Portfolio For Global Leadership In Commercial & Residential Markets
EMERSON COMMERCIAL & RESIDENTIAL SOLUTIONS HAS BEEN AN INDUSTRY STEWARD -- SUCCESSFULLY LAUNCHING NEW PRODUCTS AS EFFICIENCY STANDARDS EVOLVE 12
$0
$1
$2
$3
$4
$5
$6
Transformative Wave Sales $B
Transport Scroll Launched
Electronics Solutions Acquisitions Dixell, CPI, JCI
ProAct Launched
Cargo Solutions Investments
Vilter Acquisition
100M Scroll Milestone
The Helix
7AC
Badger International Line Launched
Von Arx Acquisition
Launched Evolution
2000 2016
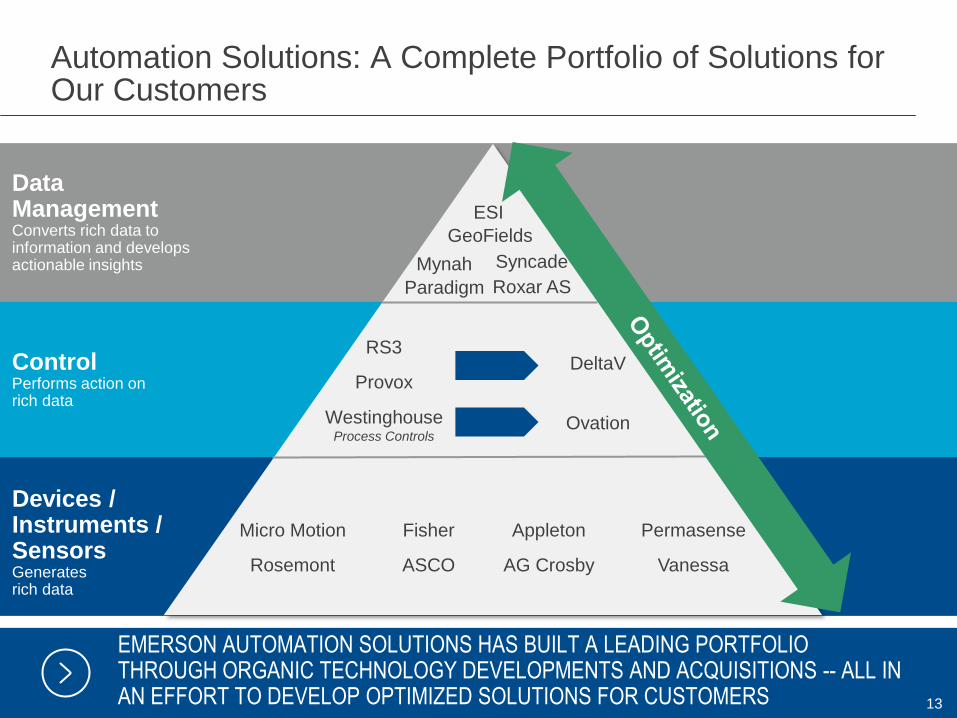
Automation Solutions: A Complete Portfolio of Solutions for Our Customers
EMERSON AUTOMATION SOLUTIONS HAS BUILT A LEADING PORTFOLIO THROUGH ORGANIC TECHNOLOGY DEVELOPMENTS AND ACQUISITIONS -- ALL IN AN EFFORT TO DEVELOP OPTIMIZED SOLUTIONS FOR CUSTOMERS 13
Control Performs action on rich data
Devices / Instruments / Sensors Generates rich data
Data Management Converts rich data to information and develops actionable insights Mynah
GeoFields
Paradigm
ESI
Syncade
Roxar AS
Westinghouse Process Controls
RS3
Provox
Ovation
DeltaV
Rosemont
Micro Motion
ASCO
Fisher
AG Crosby
Appleton
Vanessa
Permasense
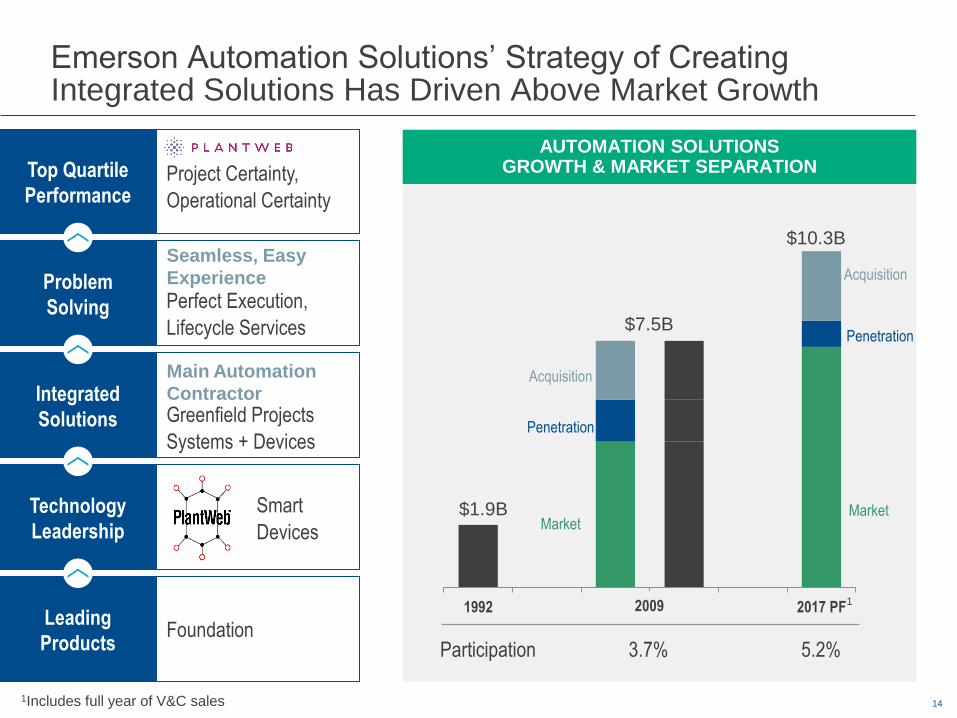
Emerson Automation Solutions’ Strategy of Creating Integrated Solutions Has Driven Above Market Growth
14
AUTOMATION SOLUTIONS GROWTH & MARKET SEPARATION
1992 2009 2009 2017 PF
$10.3B
$7.5B
$1.9B
3.7% 5.2% Participation
Project Certainty,
Operational Certainty
Seamless, Easy
Experience
Perfect Execution,
Lifecycle Services
Problem
Solving
Top Quartile
Performance
Main Automation
Contractor
Greenfield Projects
Systems + Devices
Integrated
Solutions
Smart
Devices
Technology
Leadership
Foundation Leading
Products
Market
Penetration
Acquisition
Market
Penetration
Acquisition
2009
1Includes full year of V&C sales
1
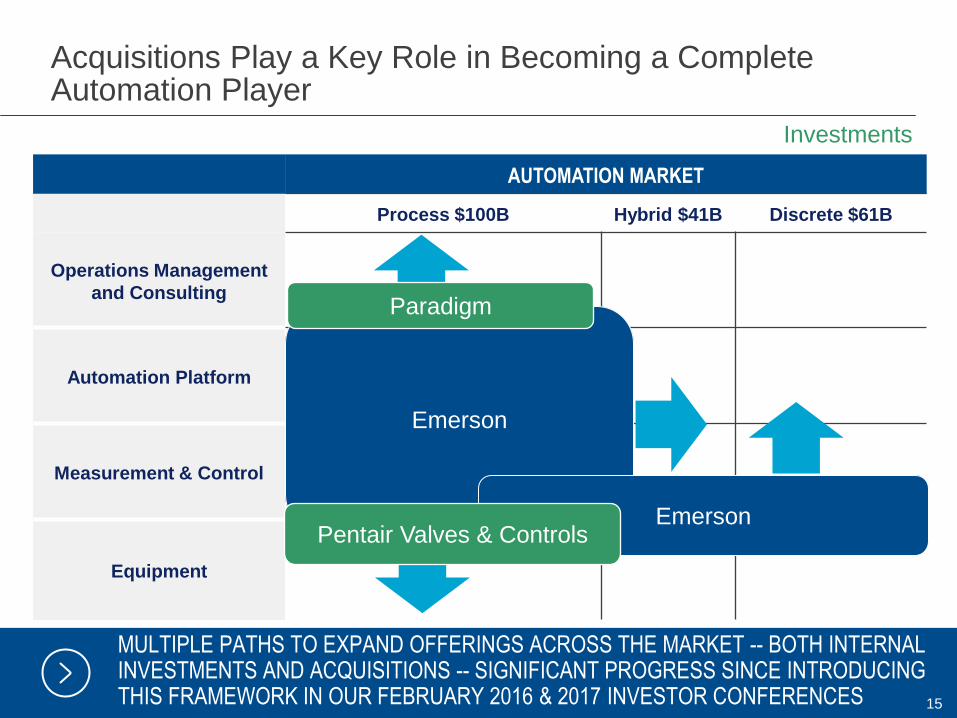
Acquisitions Play a Key Role in Becoming a Complete Automation Player
MULTIPLE PATHS TO EXPAND OFFERINGS ACROSS THE MARKET -- BOTH INTERNAL INVESTMENTS AND ACQUISITIONS -- SIGNIFICANT PROGRESS SINCE INTRODUCING THIS FRAMEWORK IN OUR FEBRUARY 2016 & 2017 INVESTOR CONFERENCES 15
AUTOMATION MARKET
Process $100B Hybrid $41B Discrete $61B
Operations Management
and Consulting
Automation Platform
Measurement & Control
Equipment
Emerson
Emerson Pentair Valves & Controls
Investments
Paradigm
(20%)
(15%)
(10%)
(5%)
0%
5%
10%
15%
20%
25%
Oct-
14
No
v-1
4
De
c-1
4
Ja
n-1
5
Feb
-15
Ma
r-1
5
Ap
r-1
5
Ma
y-1
5
Ju
n-1
5
Ju
l-1
5
Au
g-1
5
Se
p-1
5
Oct-
15
No
v-1
5
De
c-1
5
Ja
n-1
6
Feb
-16
Ma
r-1
6
Ap
r-1
6
Ma
y-1
6
Ju
n-1
6
Ju
l-1
6
Au
g-1
6
Se
p-1
6
Oct-
16
No
v-1
6
De
c-1
6
Ja
n-1
7
Feb
-17
Ma
r-1
7
Ap
r-1
7
Ma
y-1
7
Ju
n-1
7
Ju
l-1
7
Au
g-1
7
Se
p-1
7
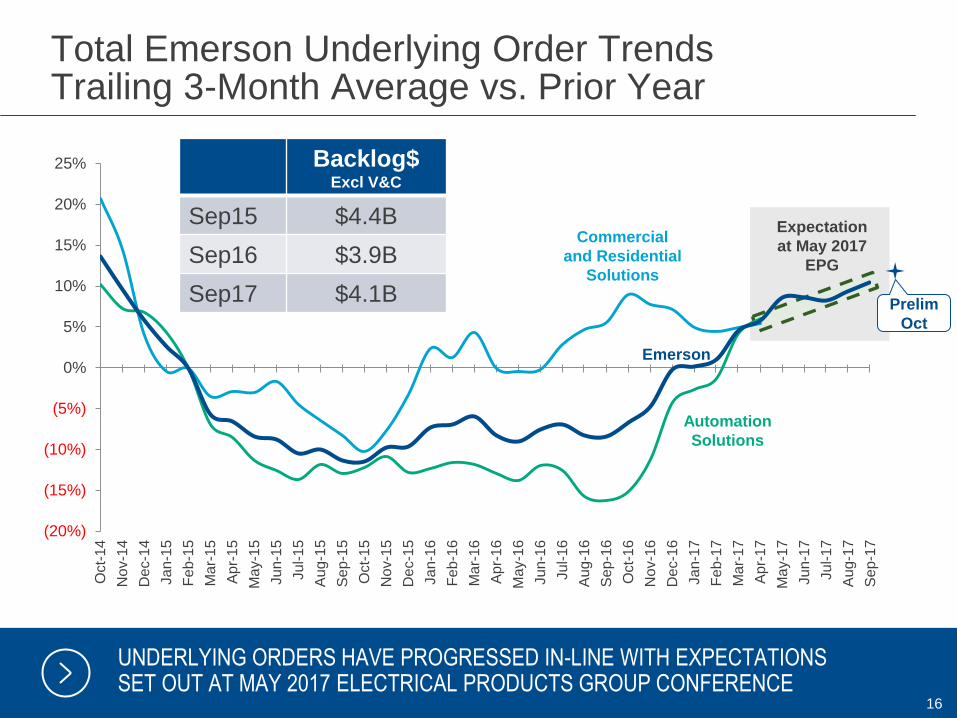
Total Emerson Underlying Order Trends Trailing 3-Month Average vs. Prior Year
UNDERLYING ORDERS HAVE PROGRESSED IN-LINE WITH EXPECTATIONS SET OUT AT MAY 2017 ELECTRICAL PRODUCTS GROUP CONFERENCE
Commercial
and Residential
Solutions
Automation
Solutions
Emerson
Expectation
at May 2017
EPG
16
Prelim
Oct
Backlog$ Excl V&C
Sep15 $4.4B
Sep16 $3.9B
Sep17 $4.1B
10%
(30.0%)
(20.0%)
(10.0%)
0.0%
10.0%
20.0%
Aug-16 Oct-16 Dec-16 Feb-17 Apr-17 Jun-17 Aug-17 Oct-17
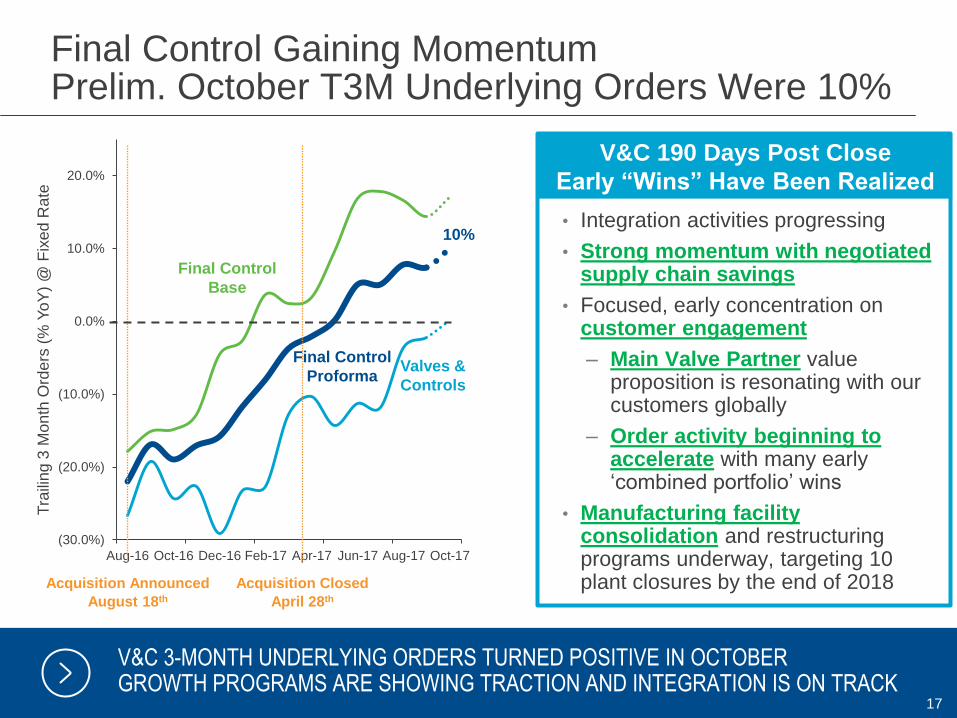
Acquisition Closed
April 28th
Acquisition Announced
August 18th
Final Control Gaining Momentum Prelim. October T3M Underlying Orders Were 10%
V&C 3-MONTH UNDERLYING ORDERS TURNED POSITIVE IN OCTOBER GROWTH PROGRAMS ARE SHOWING TRACTION AND INTEGRATION IS ON TRACK
17
14%
(2%)
7%
Tra
iling 3
Mon
th O
rde
rs (
% Y
oY
) @
Fix
ed
Rate
Valves &
Controls
Final Control
Base
Final Control
Proforma
20.8%
13%
6%
• Integration activities progressing
• Strong momentum with negotiated supply chain savings
• Focused, early concentration on customer engagement
– Main Valve Partner value proposition is resonating with our customers globally
– Order activity beginning to accelerate with many early ‘combined portfolio’ wins
• Manufacturing facility consolidation and restructuring programs underway, targeting 10 plant closures by the end of 2018
V&C 190 Days Post Close
Early “Wins” Have Been Realized
APPENDIX
18
Reconciliation of Non-GAAP Measures
19
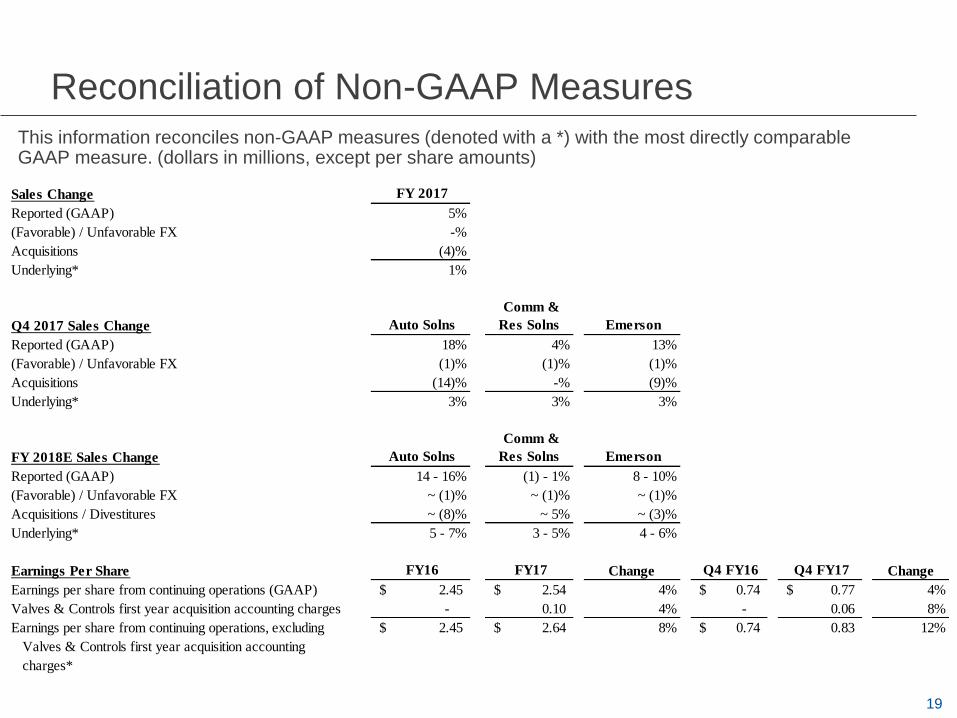
Sales Change FY 2017
Reported (GAAP) 5%
(Favorable) / Unfavorable FX -%
Acquisitions (4)%
Underlying* 1%
Q4 2017 Sales Change Auto Solns
Comm &
Res Solns Emerson
Reported (GAAP) 18% 4% 13%
(Favorable) / Unfavorable FX (1)% (1)% (1)%
Acquisitions (14)% -% (9)%
Underlying* 3% 3% 3%
FY 2018E Sales Change Auto Solns
Comm &
Res Solns Emerson
Reported (GAAP) 14 - 16% (1) - 1% 8 - 10%
(Favorable) / Unfavorable FX ~ (1)% ~ (1)% ~ (1)%
Acquisitions / Divestitures ~ (8)% ~ 5% ~ (3)%
Underlying* 5 - 7% 3 - 5% 4 - 6%
Earnings Per Share FY16 FY17 Change Q4 FY16 Q4 FY17 Change
Earnings per share from continuing operations (GAAP) 2.45$ 2.54$ 4% 0.74$ 0.77$ 4%
Valves & Controls first year acquisition accounting charges - 0.10 4% - 0.06 8%
Earnings per share from continuing operations, excluding
Valves & Controls first year acquisition accounting
charges*
2.45$ 2.64$ 8% 0.74$ 0.83 12%
This information reconciles non-GAAP measures (denoted with a *) with the most directly comparable GAAP measure. (dollars in millions, except per share amounts)
Reconciliation of Non-GAAP Measures
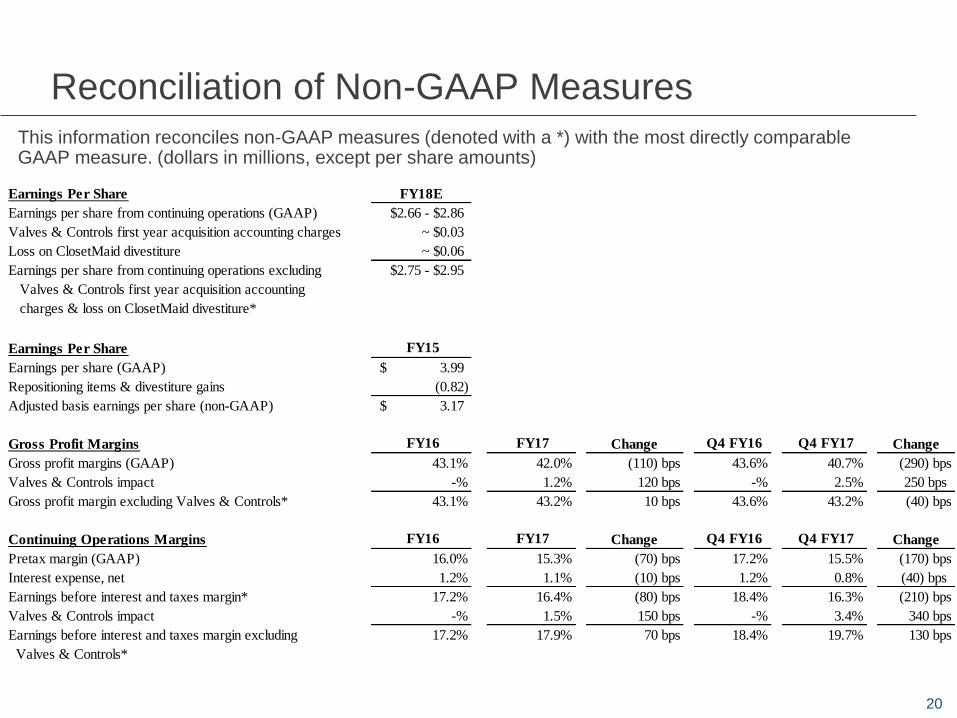
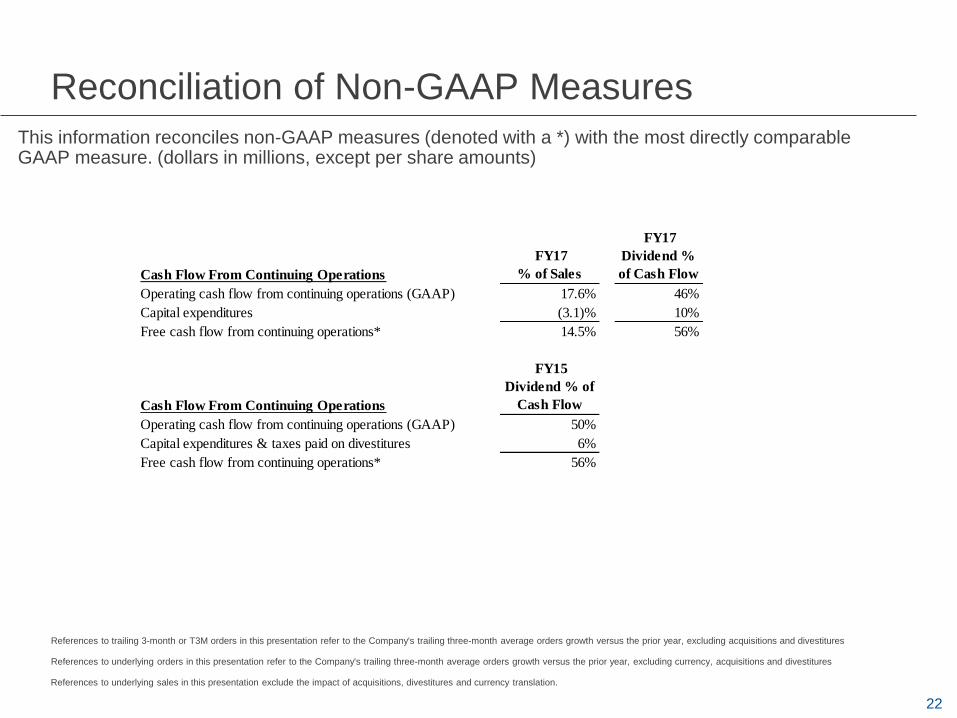
This information reconciles non-GAAP measures (denoted with a *) with the most directly comparable GAAP measure. (dollars in millions, except per share amounts)
20
Earnings Per Share FY18E
Earnings per share from continuing operations (GAAP) $2.66 - $2.86
Valves & Controls first year acquisition accounting charges ~ $0.03
Loss on ClosetMaid divestiture ~ $0.06
Earnings per share from continuing operations excluding
Valves & Controls first year acquisition accounting
charges & loss on ClosetMaid divestiture*
$2.75 - $2.95
Earnings Per Share FY15
Earnings per share (GAAP) 3.99$
Repositioning items & divestiture gains (0.82)
Adjusted basis earnings per share (non-GAAP) 3.17$
Gross Profit Margins FY16 FY17 Change Q4 FY16 Q4 FY17 Change
Gross profit margins (GAAP) 43.1% 42.0% (110) bps 43.6% 40.7% (290) bps
Valves & Controls impact -% 1.2% 120 bps -% 2.5% 250 bps
Gross profit margin excluding Valves & Controls* 43.1% 43.2% 10 bps 43.6% 43.2% (40) bps
Continuing Operations Margins FY16 FY17 Change Q4 FY16 Q4 FY17 Change
Pretax margin (GAAP) 16.0% 15.3% (70) bps 17.2% 15.5% (170) bps
Interest expense, net 1.2% 1.1% (10) bps 1.2% 0.8% (40) bps
Earnings before interest and taxes margin* 17.2% 16.4% (80) bps 18.4% 16.3% (210) bps
Valves & Controls impact -% 1.5% 150 bps -% 3.4% 340 bps
Earnings before interest and taxes margin excluding
Valves & Controls*
17.2% 17.9% 70 bps 18.4% 19.7% 130 bps
Reconciliation of Non-GAAP Measures
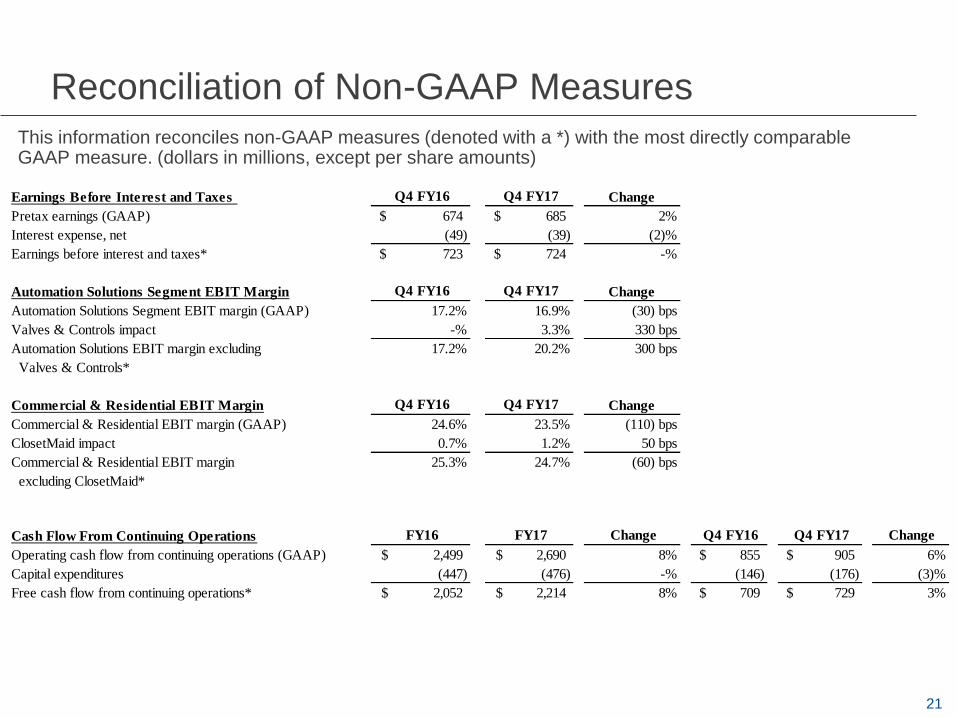
This information reconciles non-GAAP measures (denoted with a *) with the most directly comparable GAAP measure. (dollars in millions, except per share amounts)
21
Earnings Before Interest and Taxes Q4 FY16 Q4 FY17 Change
Pretax earnings (GAAP) 674$ 685$ 2%
Interest expense, net (49) (39) (2)%
Earnings before interest and taxes* 723$ 724$ -%
Automation Solutions Segment EBIT Margin Q4 FY16 Q4 FY17 Change
Automation Solutions Segment EBIT margin (GAAP) 17.2% 16.9% (30) bps
Valves & Controls impact -% 3.3% 330 bps
Automation Solutions EBIT margin excluding
Valves & Controls*
17.2% 20.2% 300 bps
Commercial & Residential EBIT Margin Q4 FY16 Q4 FY17 Change
Commercial & Residential EBIT margin (GAAP) 24.6% 23.5% (110) bps
ClosetMaid impact 0.7% 1.2% 50 bps
Commercial & Residential EBIT margin
excluding ClosetMaid*
25.3% 24.7% (60) bps
Cash Flow From Continuing Operations FY16 FY17 Change Q4 FY16 Q4 FY17 Change
Operating cash flow from continuing operations (GAAP) 2,499$ 2,690$ 8% 855$ 905$ 6%
Capital expenditures (447) (476) -% (146) (176) (3)%
Free cash flow from continuing operations* 2,052$ 2,214$ 8% 709$ 729$ 3%
Reconciliation of Non-GAAP Measures
This information reconciles non-GAAP measures (denoted with a *) with the most directly comparable GAAP measure. (dollars in millions, except per share amounts)
22
References to underlying orders in this presentation refer to the Company's trailing three-month average orders growth versus the prior year, excluding currency, acquisitions and divestitures
Cash Flow From Continuing Operations
FY17
% of Sales
FY17
Dividend %
of Cash Flow
Operating cash flow from continuing operations (GAAP) 17.6% 46%
Capital expenditures (3.1)% 10%
Free cash flow from continuing operations* 14.5% 56%
Cash Flow From Continuing Operations
FY15
Dividend % of
Cash Flow
Operating cash flow from continuing operations (GAAP) 50%
Capital expenditures & taxes paid on divestitures 6%
Free cash flow from continuing operations* 56%
References to underlying sales in this presentation exclude the impact of acquisitions, divestitures and currency translation.
References to trailing 3-month or T3M orders in this presentation refer to the Company's trailing three-month average orders growth versus the prior year, excluding acquisitions and divestitures
Recommended