Anil kumar V et al / Int. J. of Pharmacy and Analytical Research Vol-5(3) 2016 [388-399]
www.ijpar.com
~388~
IJPAR |Vol.5 | Issue 3 | July- Sep -2016 Journal Home page: www.ijpar.com
Research article Open Access
Formulation and evaluation of almotriptan chewable tablets
1V. Anil kumar*, K.L. Deepthi*,
1R. Kalyani,
1B. Padmasri,
2D.Prasanth
1Department of Pharmaceutical Technology, Sri Venkateswara College of Pharmacy, Etcherla,
Srikakulam. India. 2Department of Pharmacology, Sri Venkateswara College of Pharmacy, Etcherla, Srikakulam, India.
*Corresponding Author: V. Anil kumar Email: [email protected]
ABSTRACT In the present work, Almotriptan chewable tablets were prepared. All the tablets were subjected to weight variation,
drug content uniformity, lock length, dissolution, drug excipients interaction and short-term stability studies. There
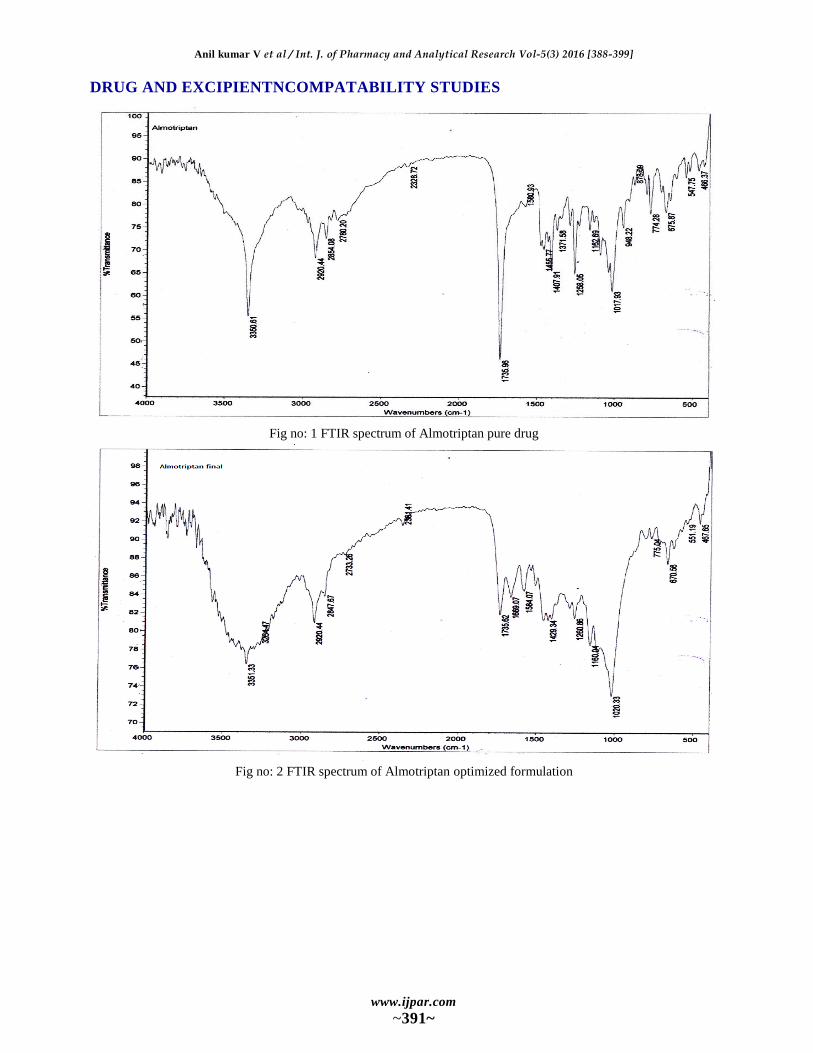
was no difference in the position of the absorption bands, hence providing evidence for the absence of any chemical
incompatibility between pure drugs with the excipients. The bulk density and tapped density for all formulation (F1 –
F9) varied from 0.423 - 0.485 gm/cm3 and 0.501 - 0.593 gm/cm
3 respectively. The results of carr’s consolidate index
or % compressibility index and hausner’s ratio for the entire formulation (F1 – F9) blend range from 15.5- 19.1 and
1.10-1.28 respectively, shows fair flow properties. All the tablets show similar color, odour, taste and physical
appearance. There is no impact of different in their organoleptic properties. By using the different excipient, the
hardness values ranged from 3.0-3.5 kg/cm2 for formulations (F1-F9) .The entire tablet passes weight variation test,
as the average % weight variation was within the Pharmacopeial limit - 7.5%. It was found to be 149mg - 152 mg.
The weight of all the tablets was found to be uniform with less deviation. The concentration of the drug in all the
formulations with different polymers was found to be 97.35 – 99.58%. It was within the IP limits.
Keywords: Almotriptan, Direct compression.
INTRODUCTION
Chewable release tablets [5, 6]
The need for new oral drug delivery system
continues, due to poor patient acceptance for
invasive methods, need for exploration of new
market for drugs and coupled with high cost of
disease management. Developing new drug
delivery techniques and utilizing them in product
development is critical for pharmaceutical
companies to survive this century [5].
The oral route of drug administration is the
most important method of administering drugs for
systemic effects. Tablets are single-dose
preparations intended for oral administration. Some
are intended to be swallowed whole, some after
being chewed and some after being crushed, some
are intended to be dissolved or dispersed in water
ISSN:2320-2831
Anil kumar V et al / Int. J. of Pharmacy and Analytical Research Vol-5(3) 2016 [388-399]
www.ijpar.com
~389~
before being taken and some are intended to be
retained in the mouth where the active ingredient(s)
is/are liberated. Administration of drugs through
oral route is the most common and the easiest way
to administer a drug. But it is a challenge in
children who have not yet learned to swallow
tablets. Hence chewable tablets are formulated to
improve the compliance in children [1].
Chewable tablets are the tablets which are
required to be broken and chewed in between the
teeth before ingestion. Chewable tablets are
usually uncoated .These are intended to be chewed
in the mouth prior to swallowing and are not
intended to be swallowed intact. Chewable tablets
are designed for use by the children and such
persons who may have difficulty in swallowing the
tablets [2].
Additionally, chewable tablets facilitate more
rapid release and hence more rapid absorption of
active ingredients and provide quick onset of action
[4]. A non-dissolving polymer matrix modified
release dosage form containing the drug and other
excipients that must be chewed but not swallowed
to promote release of the drug from the dosage
form in the oral cavity.
In the manufacture of chewable tablets,
measures are taken to: ensure that the tablets are
easily crushed by chewing; ensure that the tablets
are palatable [3].
Chewable tablets disintegrate slowly when chewed or
allowed to dissolve in the mouth for local action
.Chewable tablets are especially useful in the tablet
formulations for children and are commonly
employed in the preparation of multiple vitamin
tablets .Wherever feasible and practical, the first step
in the formulation of a chewable tablet is to obtain a
complete profile of the active drug. This usually leads
to the most efficient formulation of a stable and
quality product as the drug usually dictates the choice
of fillers, carriers, sweeteners, flavor compounds, and
other product modifiers. Many of the excipients
commonly used in tablet formulation are especially
applicable for use in chewable tablets due to their
ability to provide the necessary properties of
sweetness and chew ability. In general, these fall into
the sugar category [6], although a combination of
bland excipients with artificial sweeteners may
provide a satisfactory alternative .Important aspects of
chewable tablet manufacture are the proper
incorporation of the coloring agent, assurance of
necessary particle size distribution) maintenance of
correct moisture content, and achievement of proper
tablet hardness. All of these are the routine
responsibility of the manufacturing department once
the parameters have been established during
development [7]. Two common approaches are the
use of low concentrations of light colors and the use
of high-intensity mixing of reduced particle size
materials in order to assure thorough blending.
Mannitol is widely used as excipients in chewable
tablets for its non-hygroscopic nature of moisture
sensitive drugs [8]. Chewable tablet formulation,
particularly those containing pharmaceutically active
agents, present issue of the organoleptic
characteristics of odor, taste, appearance and mouth
feel. The formula ingredients and manufacturing
process both play a role in obtaining the desired
organoleptic properties [9].
AIM AND OBJECTIVE Aim
To formulate and evaluate tablets Almotriptan
chewable tablets using different excipients and
selecting best of them.
Objective
To design the formula for chewable Release tablet.
To carry out compatibility studies of drug and
disintegrants
To incorporate selected model drug candidates in
the formula and prepare tablets.
To evaluate the formulated tablets.
By physical parameters and
By in-vitro dissolution profile of prepared tablets.
METHODOLOGY Formulation of different batches
The main aim of the present study was to
formulate different batches using three various
superdisintegrants and other ingredients in varying
concentrations [10]. So, different batches of
formulations were planned accordingly. According
to that F1, F2, F3 (with Crospovidone-3%, 5%,
7.5%), F4, F5, F6 (with Crosscaramellose-3%, 5%,
7.5%), F7, F8, F9 (with Sodium starch glycollate-
3%, 5%, 7.5%).
Table: 1 Formulation of Different Batches (F1-F9)
Anil kumar V et al / Int. J. of Pharmacy and Analytical Research Vol-5(3) 2016 [388-399]
www.ijpar.com
~390~
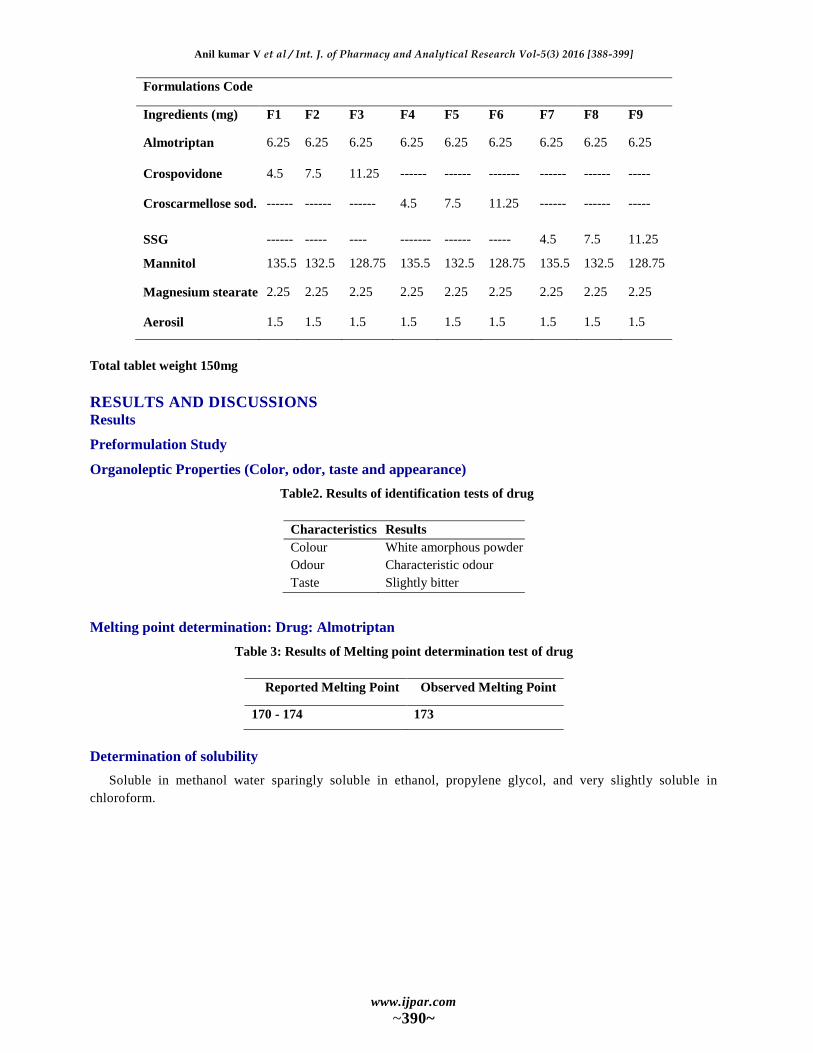
Formulations Code
Ingredients (mg) F1 F2 F3 F4 F5 F6 F7 F8 F9
Almotriptan 6.25 6.25 6.25 6.25 6.25 6.25 6.25 6.25 6.25
Crospovidone 4.5 7.5 11.25 ------ ------ ------- ------ ------ -----
Croscarmellose sod. ------ ------ ------ 4.5 7.5 11.25 ------ ------ -----
SSG ------ ----- ---- ------- ------ ----- 4.5 7.5 11.25
Mannitol 135.5 132.5 128.75 135.5 132.5 128.75 135.5 132.5 128.75
Magnesium stearate 2.25 2.25 2.25 2.25 2.25 2.25 2.25 2.25 2.25
Aerosil 1.5 1.5 1.5 1.5 1.5 1.5 1.5 1.5 1.5
Total tablet weight 150mg
RESULTS AND DISCUSSIONS Results
Preformulation Study
Organoleptic Properties (Color, odor, taste and appearance)
Table2. Results of identification tests of drug
Characteristics Results
Colour White amorphous powder
Odour Characteristic odour
Taste Slightly bitter
Melting point determination: Drug: Almotriptan
Table 3: Results of Melting point determination test of drug
Reported Melting Point Observed Melting Point
170 - 174 173
Determination of solubility
Soluble in methanol water sparingly soluble in ethanol, propylene glycol, and very slightly soluble in
chloroform.
Anil kumar V et al / Int. J. of Pharmacy and Analytical Research Vol-5(3) 2016 [388-399]
www.ijpar.com
~391~
DRUG AND EXCIPIENTNCOMPATABILITY STUDIES
Fig no: 1 FTIR spectrum of Almotriptan pure drug
Fig no: 2 FTIR spectrum of Almotriptan optimized formulation
Anil kumar V et al / Int. J. of Pharmacy and Analytical Research Vol-5(3) 2016 [388-399]
www.ijpar.com
~392~
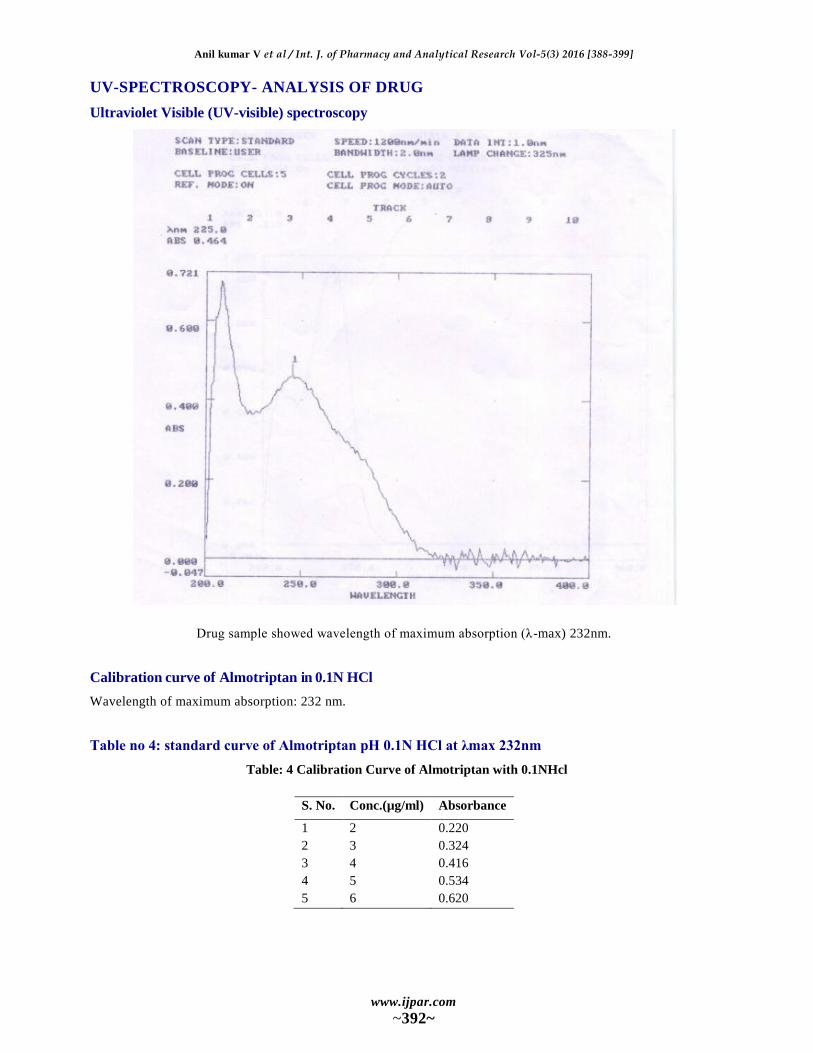
UV-SPECTROSCOPY- ANALYSIS OF DRUG
Ultraviolet Visible (UV-visible) spectroscopy
Drug sample showed wavelength of maximum absorption (λ-max) 232nm.
Calibration curve of Almotriptan in 0.1N HCl
Wavelength of maximum absorption: 232 nm.
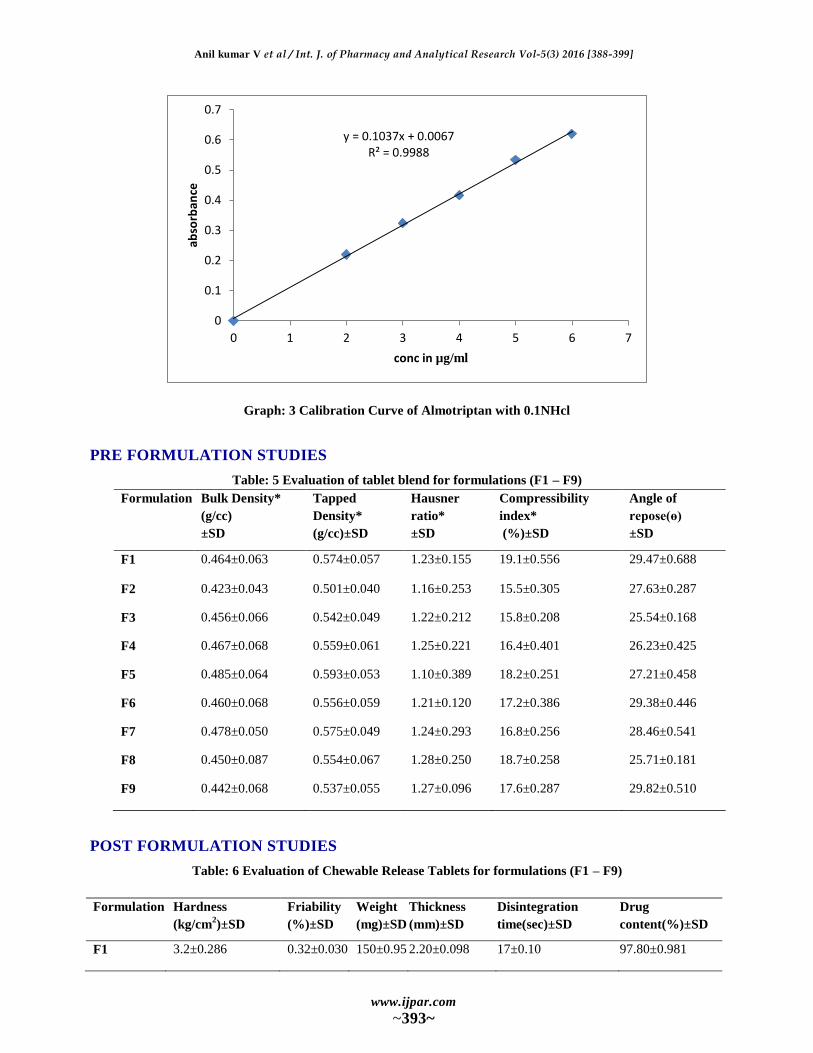
Table no 4: standard curve of Almotriptan pH 0.1N HCl at λmax 232nm
Table: 4 Calibration Curve of Almotriptan with 0.1NHcl
S. No. Conc.(µg/ml) Absorbance
1 2 0.220
2 3 0.324
3 4 0.416
4 5 0.534
5 6 0.620
Anil kumar V et al / Int. J. of Pharmacy and Analytical Research Vol-5(3) 2016 [388-399]
www.ijpar.com
~393~
Graph: 3 Calibration Curve of Almotriptan with 0.1NHcl
PRE FORMULATION STUDIES
Table: 5 Evaluation of tablet blend for formulations (F1 – F9)
Formulation Bulk Density*
(g/cc)
±SD
Tapped
Density*
(g/cc)±SD
Hausner
ratio*
±SD
Compressibility
index*
(%)±SD
Angle of
repose(ɵ)
±SD
F1 0.464±0.063 0.574±0.057 1.23±0.155 19.1±0.556 29.47±0.688
F2 0.423±0.043 0.501±0.040 1.16±0.253 15.5±0.305 27.63±0.287
F3 0.456±0.066 0.542±0.049 1.22±0.212 15.8±0.208 25.54±0.168
F4 0.467±0.068 0.559±0.061 1.25±0.221 16.4±0.401 26.23±0.425
F5 0.485±0.064 0.593±0.053 1.10±0.389 18.2±0.251 27.21±0.458
F6 0.460±0.068 0.556±0.059 1.21±0.120 17.2±0.386 29.38±0.446
F7 0.478±0.050 0.575±0.049 1.24±0.293 16.8±0.256 28.46±0.541
F8 0.450±0.087 0.554±0.067 1.28±0.250 18.7±0.258 25.71±0.181
F9 0.442±0.068 0.537±0.055 1.27±0.096 17.6±0.287 29.82±0.510
POST FORMULATION STUDIES
Table: 6 Evaluation of Chewable Release Tablets for formulations (F1 – F9)
Formulation Hardness
(kg/cm2)±SD
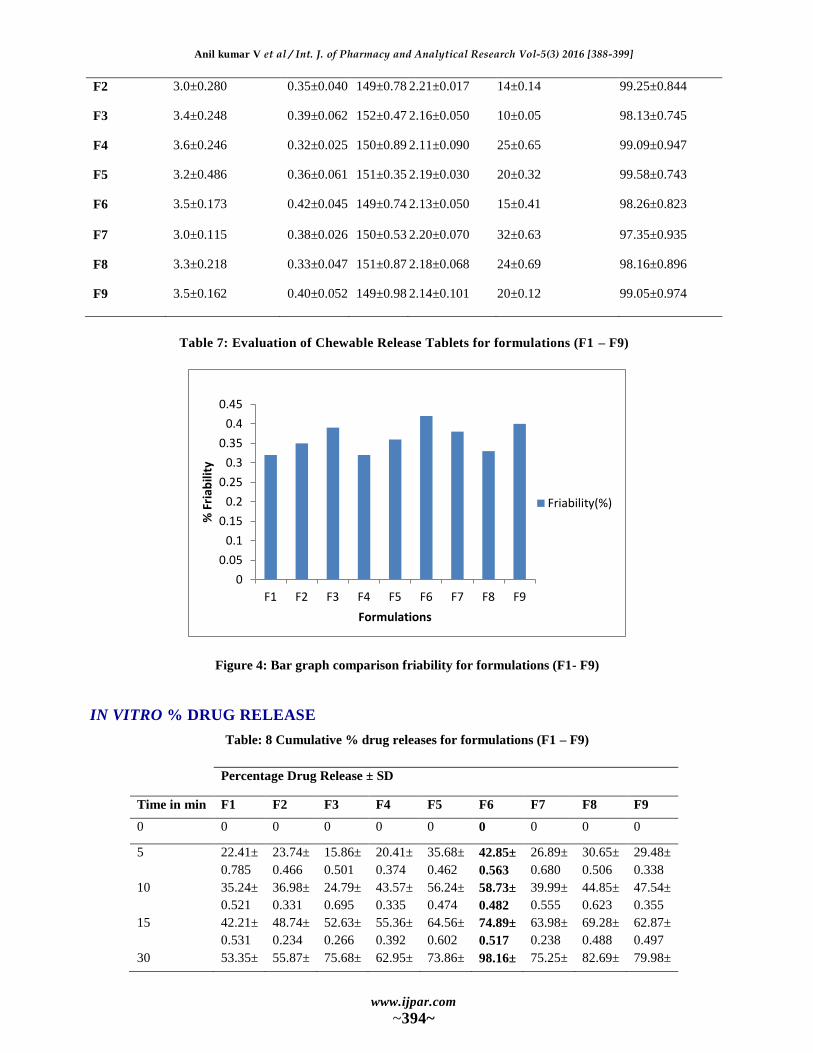
Friability
(%)±SD
Weight
(mg)±SD
Thickness
(mm)±SD
Disintegration
time(sec)±SD
Drug
content(%)±SD
F1 3.2±0.286 0.32±0.030 150±0.95 2.20±0.098 17±0.10 97.80±0.981
y = 0.1037x + 0.0067 R² = 0.9988
0
0.1
0.2
0.3
0.4
0.5
0.6
0.7
0 1 2 3 4 5 6 7
abso
rban
ce
conc in µg/ml
Anil kumar V et al / Int. J. of Pharmacy and Analytical Research Vol-5(3) 2016 [388-399]
www.ijpar.com
~394~
F2 3.0±0.280 0.35±0.040 149±0.78 2.21±0.017 14±0.14 99.25±0.844
F3 3.4±0.248 0.39±0.062 152±0.47 2.16±0.050 10±0.05 98.13±0.745
F4 3.6±0.246 0.32±0.025 150±0.89 2.11±0.090 25±0.65 99.09±0.947
F5 3.2±0.486 0.36±0.061 151±0.35 2.19±0.030 20±0.32 99.58±0.743
F6 3.5±0.173 0.42±0.045 149±0.74 2.13±0.050 15±0.41 98.26±0.823
F7 3.0±0.115 0.38±0.026 150±0.53 2.20±0.070 32±0.63 97.35±0.935
F8 3.3±0.218 0.33±0.047 151±0.87 2.18±0.068 24±0.69 98.16±0.896
F9 3.5±0.162 0.40±0.052 149±0.98 2.14±0.101 20±0.12 99.05±0.974
Table 7: Evaluation of Chewable Release Tablets for formulations (F1 – F9)
Figure 4: Bar graph comparison friability for formulations (F1- F9)
IN VITRO % DRUG RELEASE
Table: 8 Cumulative % drug releases for formulations (F1 – F9)
Percentage Drug Release ± SD
Time in min F1 F2 F3 F4 F5 F6 F7 F8 F9
0 0 0 0 0 0 0 0 0 0
5 22.41±
0.785
23.74±
0.466
15.86±
0.501
20.41±
0.374
35.68±
0.462
42.85±
0.563
26.89±
0.680
30.65±
0.506
29.48±
0.338
10 35.24±
0.521
36.98±
0.331
24.79±
0.695
43.57±
0.335
56.24±
0.474
58.73±
0.482
39.99±
0.555
44.85±
0.623
47.54±
0.355
15 42.21±
0.531
48.74±
0.234
52.63±
0.266
55.36±
0.392
64.56±
0.602
74.89±
0.517
63.98±
0.238
69.28±
0.488
62.87±
0.497
30 53.35± 55.87± 75.68± 62.95± 73.86± 98.16± 75.25± 82.69± 79.98±
0
0.05
0.1
0.15
0.2
0.25
0.3
0.35
0.4
0.45
F1 F2 F3 F4 F5 F6 F7 F8 F9
% F
riab
ility
Formulations
Friability(%)
Anil kumar V et al / Int. J. of Pharmacy and Analytical Research Vol-5(3) 2016 [388-399]
www.ijpar.com
~395~
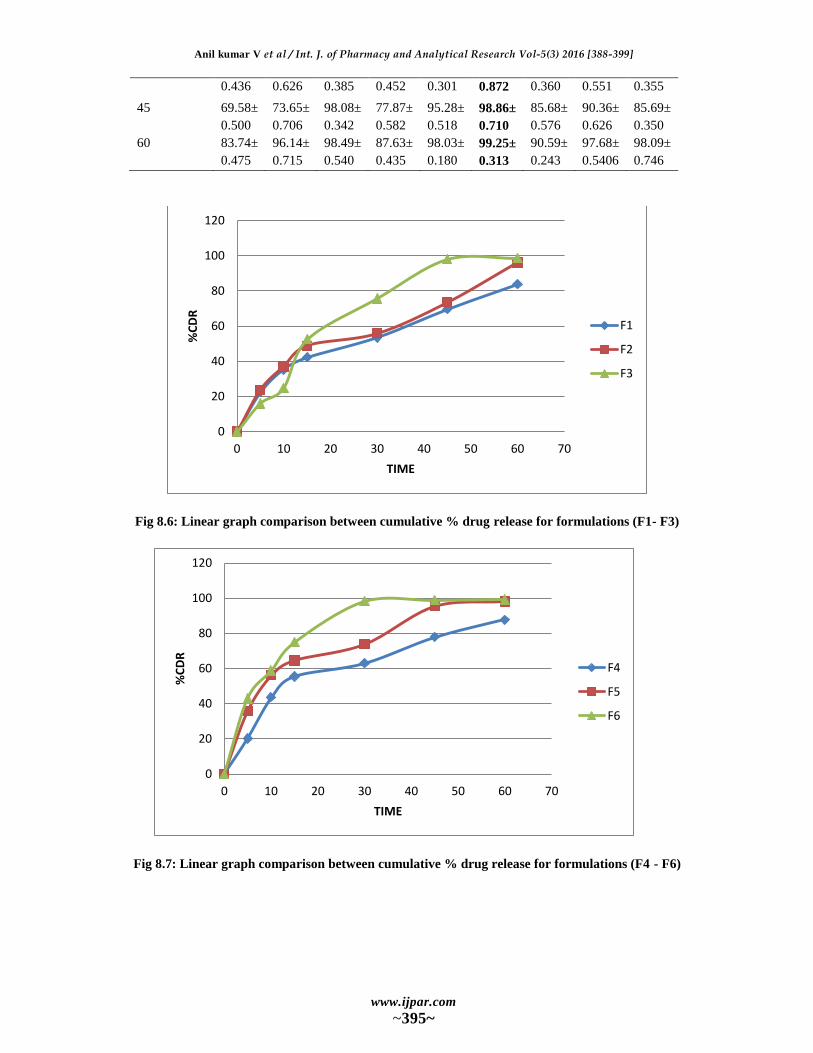
0.436 0.626 0.385 0.452 0.301 0.872 0.360 0.551 0.355
45 69.58±
0.500
73.65±
0.706
98.08±
0.342
77.87±
0.582
95.28±
0.518
98.86±
0.710
85.68±
0.576
90.36±
0.626
85.69±
0.350
60 83.74±
0.475
96.14±
0.715
98.49±
0.540
87.63±
0.435
98.03±
0.180
99.25±
0.313
90.59±
0.243
97.68±
0.5406
98.09±
0.746
Fig 8.6: Linear graph comparison between cumulative % drug release for formulations (F1- F3)
Fig 8.7: Linear graph comparison between cumulative % drug release for formulations (F4 - F6)
0
20
40
60
80
100
120
0 10 20 30 40 50 60 70
%C
DR
TIME
F1
F2
F3
0
20
40
60
80
100
120
0 10 20 30 40 50 60 70
%C
DR
TIME
F4
F5
F6
Anil kumar V et al / Int. J. of Pharmacy and Analytical Research Vol-5(3) 2016 [388-399]
www.ijpar.com
~396~
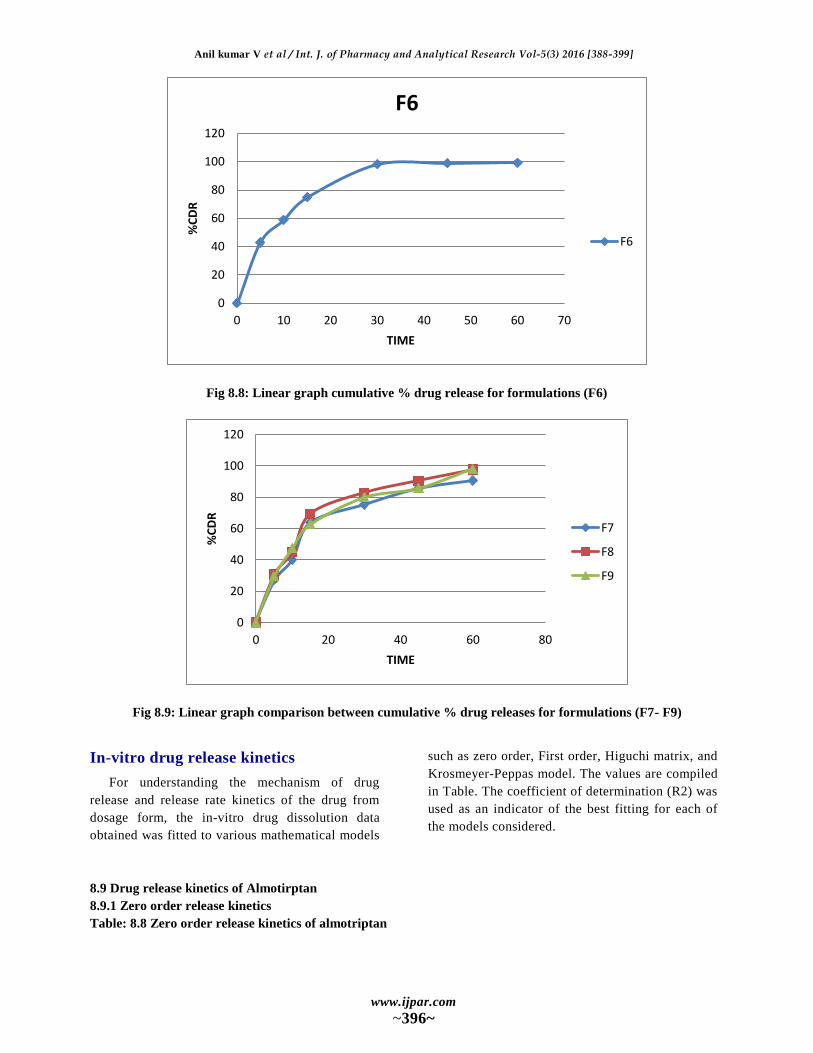
Fig 8.8: Linear graph cumulative % drug release for formulations (F6)
Fig 8.9: Linear graph comparison between cumulative % drug releases for formulations (F7- F9)
In-vitro drug release kinetics
For understanding the mechanism of drug
release and release rate kinetics of the drug from
dosage form, the in-vitro drug dissolution data
obtained was fitted to various mathematical models
such as zero order, First order, Higuchi matrix, and
Krosmeyer-Peppas model. The values are compiled
in Table. The coefficient of determination (R2) was
used as an indicator of the best fitting for each of
the models considered.
8.9 Drug release kinetics of Almotirptan
8.9.1 Zero order release kinetics
Table: 8.8 Zero order release kinetics of almotriptan
0
20
40
60
80
100
120
0 10 20 30 40 50 60 70
%C
DR
TIME
F6
F6
0
20
40
60
80
100
120
0 20 40 60 80
%C
DR
TIME
F7
F8
F9
Anil kumar V et al / Int. J. of Pharmacy and Analytical Research Vol-5(3) 2016 [388-399]
www.ijpar.com
~397~
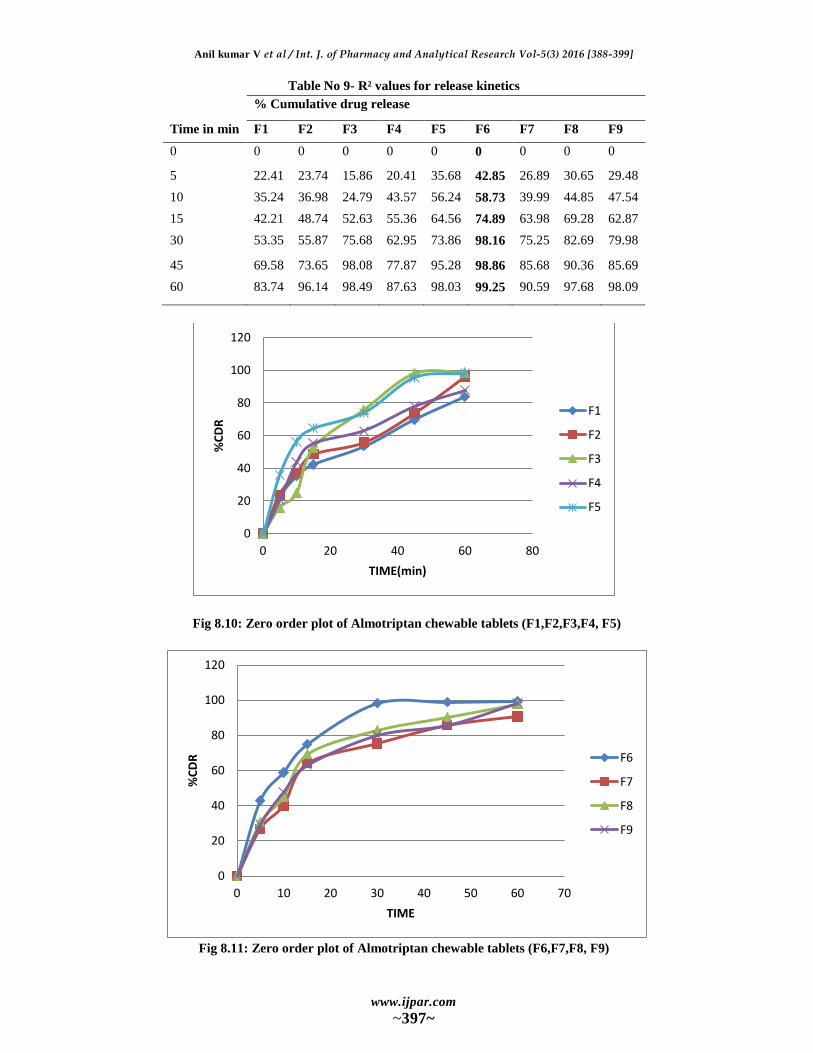
Table No 9- R² values for release kinetics
% Cumulative drug release
Time in min F1 F2 F3 F4 F5 F6 F7 F8 F9
0 0 0 0 0 0 0 0 0 0
5 22.41 23.74 15.86 20.41 35.68 42.85 26.89 30.65 29.48
10 35.24 36.98 24.79 43.57 56.24 58.73 39.99 44.85 47.54
15 42.21 48.74 52.63 55.36 64.56 74.89 63.98 69.28 62.87
30 53.35 55.87 75.68 62.95 73.86 98.16 75.25 82.69 79.98
45 69.58 73.65 98.08 77.87 95.28 98.86 85.68 90.36 85.69
60 83.74 96.14 98.49 87.63 98.03 99.25 90.59 97.68 98.09
Fig 8.10: Zero order plot of Almotriptan chewable tablets (F1,F2,F3,F4, F5)
Fig 8.11: Zero order plot of Almotriptan chewable tablets (F6,F7,F8, F9)
0
20
40
60
80
100
120
0 20 40 60 80
%C
DR
TIME(min)
F1
F2
F3
F4
F5
0
20
40
60
80
100
120
0 10 20 30 40 50 60 70
%C
DR
TIME
F6
F7
F8
F9
Anil kumar V et al / Int. J. of Pharmacy and Analytical Research Vol-5(3) 2016 [388-399]
www.ijpar.com
~398~
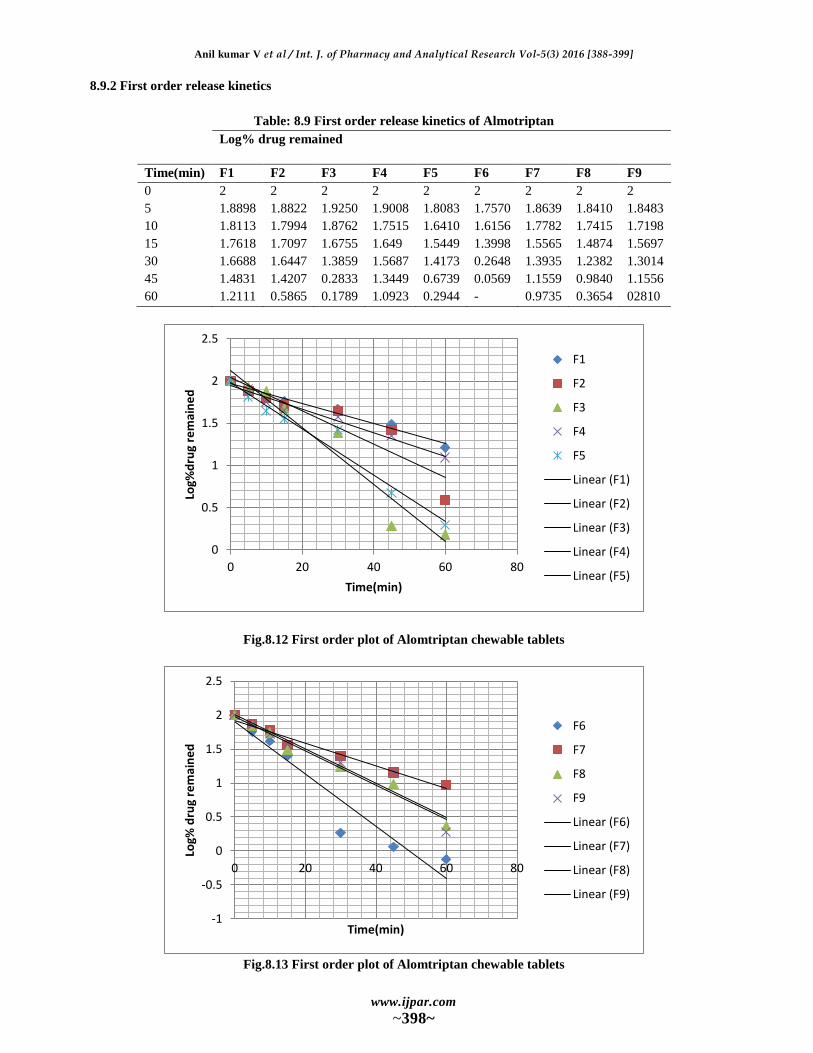
8.9.2 First order release kinetics
Table: 8.9 First order release kinetics of Almotriptan
Log% drug remained
Time(min) F1 F2 F3 F4 F5 F6 F7 F8 F9
0 2 2 2 2 2 2 2 2 2
5 1.8898 1.8822 1.9250 1.9008 1.8083 1.7570 1.8639 1.8410 1.8483
10 1.8113 1.7994 1.8762 1.7515 1.6410 1.6156 1.7782 1.7415 1.7198
15 1.7618 1.7097 1.6755 1.649 1.5449 1.3998 1.5565 1.4874 1.5697
30 1.6688 1.6447 1.3859 1.5687 1.4173 0.2648 1.3935 1.2382 1.3014
45 1.4831 1.4207 0.2833 1.3449 0.6739 0.0569 1.1559 0.9840 1.1556
60 1.2111 0.5865 0.1789 1.0923 0.2944 - 0.9735 0.3654 02810
Fig.8.12 First order plot of Alomtriptan chewable tablets
Fig.8.13 First order plot of Alomtriptan chewable tablets
0
0.5
1
1.5
2
2.5
0 20 40 60 80
Log%
dru
g re
mai
ne
d
Time(min)
F1
F2
F3
F4
F5
Linear (F1)
Linear (F2)
Linear (F3)
Linear (F4)
Linear (F5)
-1
-0.5
0
0.5
1
1.5
2
2.5
0 20 40 60 80
Log%
dru
g re
mai
ne
d
Time(min)
F6
F7
F8
F9
Linear (F6)
Linear (F7)
Linear (F8)
Linear (F9)
Anil kumar V et al / Int. J. of Pharmacy and Analytical Research Vol-5(3) 2016 [388-399]
www.ijpar.com
~399~
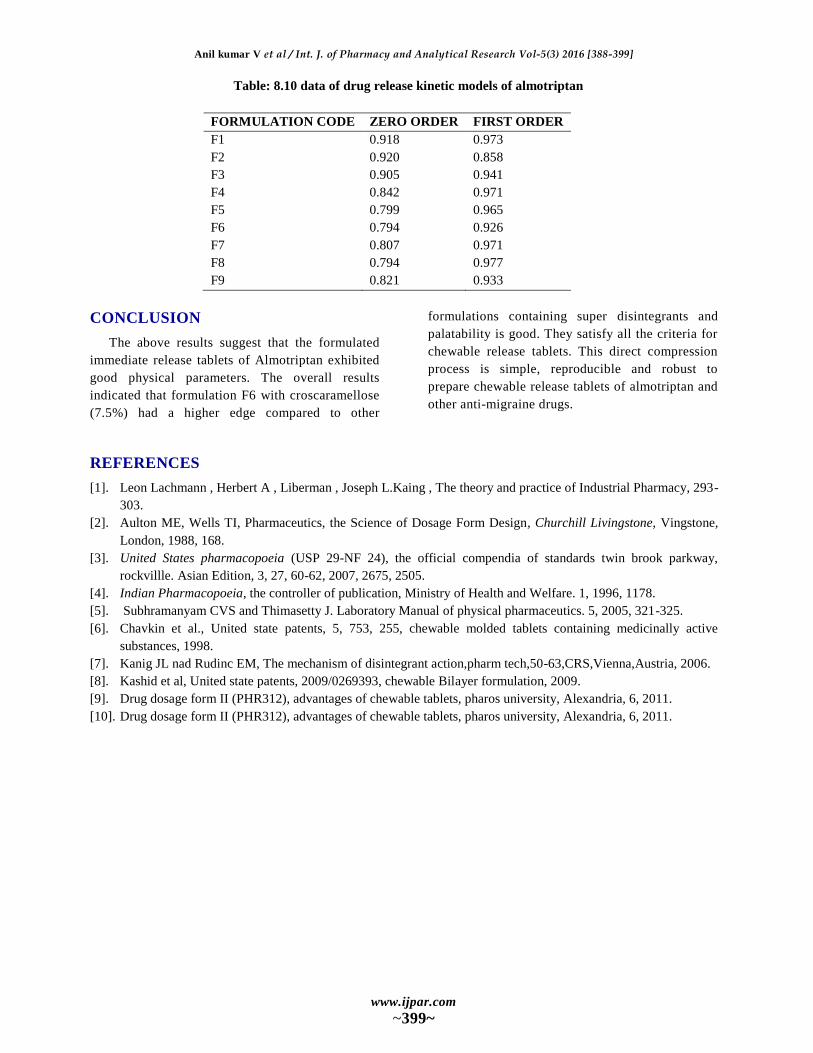
Table: 8.10 data of drug release kinetic models of almotriptan
FORMULATION CODE ZERO ORDER FIRST ORDER
F1 0.918 0.973
F2 0.920 0.858
F3 0.905 0.941
F4 0.842 0.971
F5 0.799 0.965
F6 0.794 0.926
F7 0.807 0.971
F8 0.794 0.977
F9 0.821 0.933
CONCLUSION
The above results suggest that the formulated
immediate release tablets of Almotriptan exhibited
good physical parameters. The overall results
indicated that formulation F6 with croscaramellose
(7.5%) had a higher edge compared to other
formulations containing super disintegrants and
palatability is good. They satisfy all the criteria for
chewable release tablets. This direct compression
process is simple, reproducible and robust to
prepare chewable release tablets of almotriptan and
other anti-migraine drugs.
REFERENCES
[1]. Leon Lachmann , Herbert A , Liberman , Joseph L.Kaing , The theory and practice of Industrial Pharmacy, 293-
303.
[2]. Aulton ME, Wells TI, Pharmaceutics, the Science of Dosage Form Design, Churchill Livingstone, Vingstone,
London, 1988, 168.
[3]. United States pharmacopoeia (USP 29-NF 24), the official compendia of standards twin brook parkway,
rockvillle. Asian Edition, 3, 27, 60-62, 2007, 2675, 2505.
[4]. Indian Pharmacopoeia, the controller of publication, Ministry of Health and Welfare. 1, 1996, 1178.
[5]. Subhramanyam CVS and Thimasetty J. Laboratory Manual of physical pharmaceutics. 5, 2005, 321-325.
[6]. Chavkin et al., United state patents, 5, 753, 255, chewable molded tablets containing medicinally active
substances, 1998.
[7]. Kanig JL nad Rudinc EM, The mechanism of disintegrant action,pharm tech,50-63,CRS,Vienna,Austria, 2006.
[8]. Kashid et al, United state patents, 2009/0269393, chewable Bilayer formulation, 2009.
[9]. Drug dosage form II (PHR312), advantages of chewable tablets, pharos university, Alexandria, 6, 2011.
[10]. Drug dosage form II (PHR312), advantages of chewable tablets, pharos university, Alexandria, 6, 2011.
Recommended


![Deepthi PPT on 5G[1]](https://img.pdfslide.us/doc/110x75/54f4bf454a7959ab318b4ad8/deepthi-ppt-on-5g1.jpg)