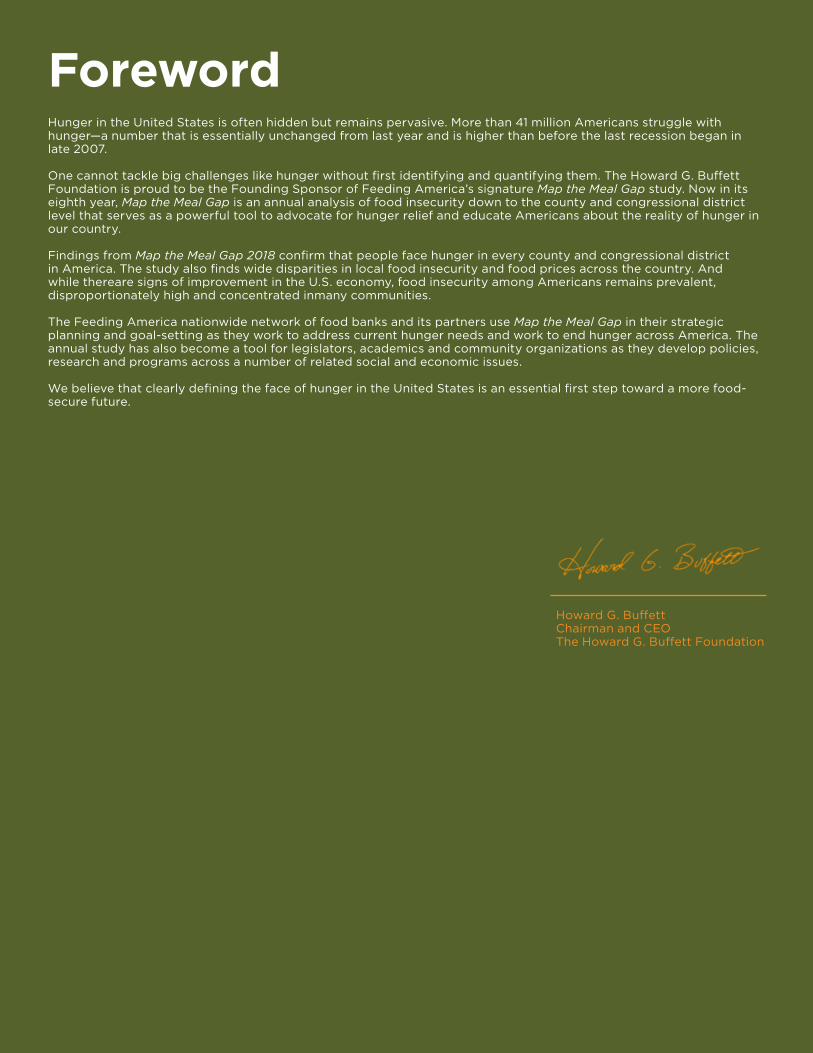
ForewordHunger in the United States is often hidden but remains pervasive. More than 41 million Americans struggle with hunger—a number that is essentially unchanged from last year and is higher than before the last recession began in late 2007. One cannot tackle big challenges like hunger without first identifying and quantifying them. The Howard G. Buffett Foundation is proud to be the Founding Sponsor of Feeding America’s signature Map the Meal Gap study. Now in its eighth year, Map the Meal Gap is an annual analysis of food insecurity down to the county and congressional district level that serves as a powerful tool to advocate for hunger relief and educate Americans about the reality of hunger in our country.
Findings from Map the Meal Gap 2018 confirm that people face hunger in every county and congressional district in America. The study also finds wide disparities in local food insecurity and food prices across the country. And while there are signs of improvement in the U.S. economy, food insecurity among Americans remains prevalent, disproportionately high and concentrated in many communities.
The Feeding America nationwide network of food banks and its partners use Map the Meal Gap in their strategic planning and goal-setting as they work to address current hunger needs and work to end hunger across America. The annual study has also become a tool for legislators, academics and community organizations as they develop policies, research and programs across a number of related social and economic issues.
We believe that clearly defining the face of hunger in the United States is an essential first step toward a more food-secure future.
Howard G. Buffett Chairman and CEO The Howard G. Buffett Foundation
Using Data and Evidence to Set a Bold Strategic Direction
In order to end hunger in America, we must first deeply understand the problem. For nearly 25 years, Feeding America has been a leader in developing and conducting innovative research about food insecurity in America, its prevalence, and the impact it has on the people we serve. The data and understanding we derive from our studies allow us to make informed decisions about programs and policies that help feed people facing hunger today, while setting the course of our efforts to end hunger tomorrow by improving long-term food security.
One of the most instrumental studies in supporting this important and daunting work is Map the Meal Gap. Since 2011, Map the Meal Gap provides insight into the number of food-insecure individuals in every state, county and congressional district across the United States. This critical knowledge enables us to dynamically integrate research and practice and develop effective, evidence-based programmatic solutions to food insecurity.
We are grateful for the vision and partnership of the Howard G. Buffett Foundation, a founding sponsor of this study, which has enabled Feeding America to be at the leading edge of research and evidence, driving policy and programmatic change at national and local levels. The ongoing, generous commitment from all our Map the Meal Gap 2018 funders and supporters, including the Howard G. Buffett Foundation, Conagra Brands Foundation and Nielsen, has provided Feeding America with the foundation we need to build our bold organizational direction. We thank all our advisors and thought partners who contributed to the development of the analysis and insights that constitute Map the Meal Gap.
Carol Medlin, PhD, MPAChief Program Officer
Erin McDonald, PhD, MPPVice President, Research
Acknowledgements & CreditsWe appreciate the contributions of the following people for their work on Map the Meal Gap 2018. Craig Gundersen, Lead Researcher University of Illinois at Champaign-Urbana
Adam Dewey, Co-Investigator Feeding America
Amy S. Crumbaugh, Co-Investigator Feeding America
Michael Kato, Co-Investigator Feeding America
Emily Engelhard, Co-Investigator Feeding America
Brian Odeen Nielsen
Mitch Kriss Nielsen
Patricia Ratulangi Nielsen
Technical Advisory Group of Feeding America Craig Gundersen University of Illinois at Champaign-Urbana
Alison Jacknowitz American University School of Public Affairs
Robert Santos The Urban Institute
Hilary Seligman University of California San Francisco
Elaine Waxman The Urban Institute
Feeding America National Office Staff Jadi Chapman Angela DePaulChristina DialynasScott FerryMonica HakeLisa JerichoKayla HanleyZach HermanMollie KoplinFredi KoltesErin McDonaldCarol Medlin
Research for Map the Meal Gap 2018 was generously supported by The Howard G. Buffett Foundation, Conagra Brands Foundation and Nielsen. Feeding America would also like to thank Futureman Digital and Column Five for their technical assistance. For more information about Feeding America, please visit www.feedingamerica.org.
Elizabeth NielsenStacey O’MalleyFrances PanganibanSophie ReedsDanielle RubinJanine StinesJoe Tiemeyer Zuani VillarrealMegan Vincenti Kelli WalkerStephanie Zidek
Carol Medlin, PhD, MPA. Chief Program Officer Carol Medlin is Chief Program Officer at Feeding America. Carol oversees the design, development and execution of Feeding America programs and partnerships that help improve access to a variety of nutritious food through our network and improve outcomes for the people we serve, with the goal of ending hunger. She guides the organization’s strategic research agenda to shape polices and strategies for advancing a hunger free America.
Carol possesses more than twenty years of experience implementing strategy, and leveraging research, data, and analytics to maximize social impact and improve organizational performance. She has worked with leading think tanks and philanthropic organizations, including The Bill and Melinda Gates Foundation and, most recently, the Children’s Investment Fund Foundation (CIFF) in London. Carol has served on the Board of Commissioners of the International Initiative on Impact Evaluation (3IE) and on the advisory committee of the Global Health Investment Fund (GHIF), an innovative social impact fund. She is Founder and Principal of Praxis Social Impact Consulting.
Carol holds a doctorate in Political Science from the University of California, Berkeley and a master’s in Public Administration from the Woodrow Wilson School of Public and International Affairs at Princeton University.
Erin McDonald, PhD, MPP. Vice President of Research Erin McDonald is Vice President of Research at Feeding America. She leads the research and evaluation strategy for the organization, focusing on the prevalence and root causes of food insecurity and assessing solution efficacy. In addition, she is responsible for analytic and flexible learning resources for both internal and external Feeding America audiences. Erin brings a wealth of methodological and social science expertise to Feeding America from intersecting fields, including social justice, financial security, poverty alleviation and workforce development. Previously, she was Director of Research, Evaluation and Monitoring at Women’s World Banking, where she led a global research team focused on developing and directly delivering mixed-methods research and evaluation efforts. She created and implemented innovative approaches to international market intelligence and led the organization’s strategic agenda development. Earlier, Erin served as Director of Research and Strategic Learning at The New York Women’s Foundation, where she led a team that developed organizational research and analytic content, focused on applied research, to support economic development among non-profit organizations serving low-income women. Prior to this effort, she held lead researcher positions at The Urban Institute and senior strategy roles within the government, leading systems change efforts. Erin holds a doctorate in public health and research from Johns Hopkins Bloomberg School of Public Health and a master’s in public policy and evaluation from Johns Hopkins Policy Studies Institute. She is a trained bioethicist.
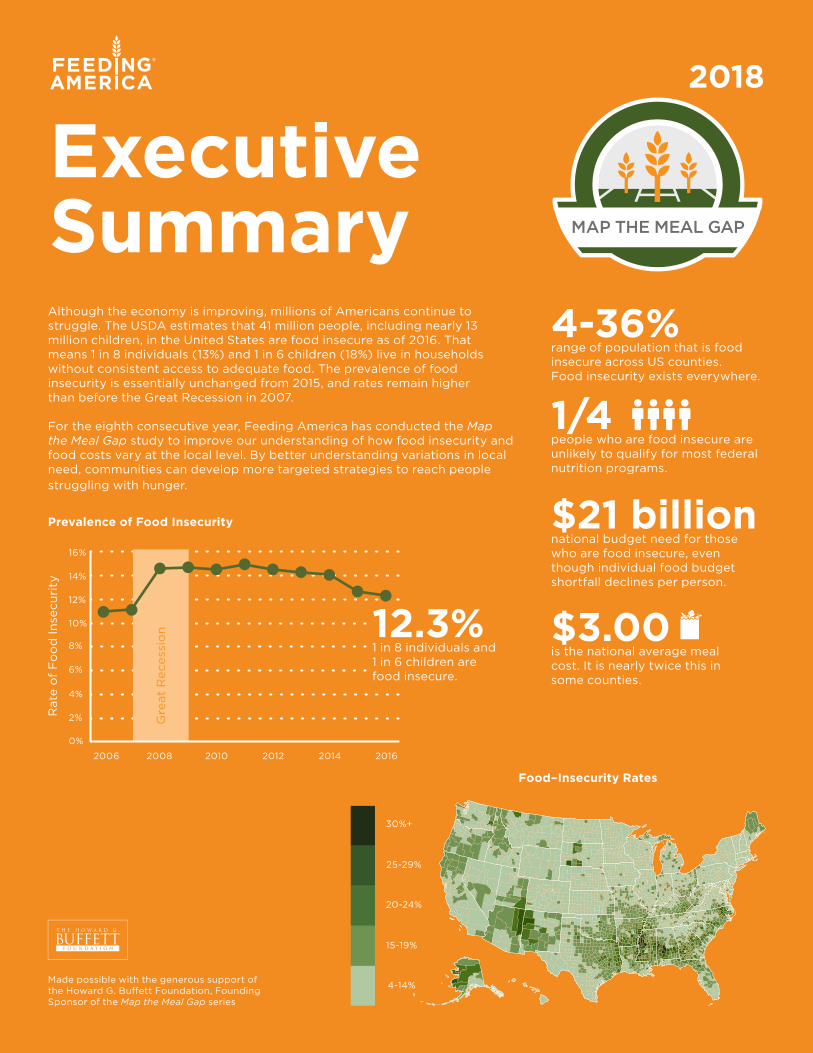
Executive SummaryAlthough the economy is improving, millions of Americans continue to struggle. The USDA estimates that 41 million people, including nearly 13 million children, in the United States are food insecure as of 2016. That means 1 in 8 individuals (13%) and 1 in 6 children (18%) live in households without consistent access to adequate food. The prevalence of food insecurity is essentially unchanged from 2015, and rates remain higher than before the Great Recession in 2007. For the eighth consecutive year, Feeding America has conducted the Map the Meal Gap study to improve our understanding of how food insecurity and food costs vary at the local level. By better understanding variations in local need, communities can develop more targeted strategies to reach people struggling with hunger.
Prevalence of Food Insecurity
0%
2%
2006 2008 2010 2012 2014 2016
4%
6%
8%
10%
12%
14%
16%
Rat
e o
f F
oo
d In
secu
rity
12.3% 1 in 8 individuals and 1 in 6 children are food insecure.
1/4 people who are food insecure are unlikely to qualify for most federal nutrition programs.
$3.00 is the national average meal cost. It is nearly twice this in some counties.
$21 billion national budget need for those who are food insecure, even though individual food budget shortfall declines per person.
4-36% range of population that is food insecure across US counties. Food insecurity exists everywhere.
Gre
at R
eces
sio
n
Made possible with the generous support of the Howard G. Buffett Foundation, Founding Sponsor of the Map the Meal Gap series
2018
4-14%
15-19%
20-24%
25-29%
30%+
Food–Insecurity Rates
Key Findings
High Food Insecurity counties are the counties with the top 10% of food–insecurity rates.
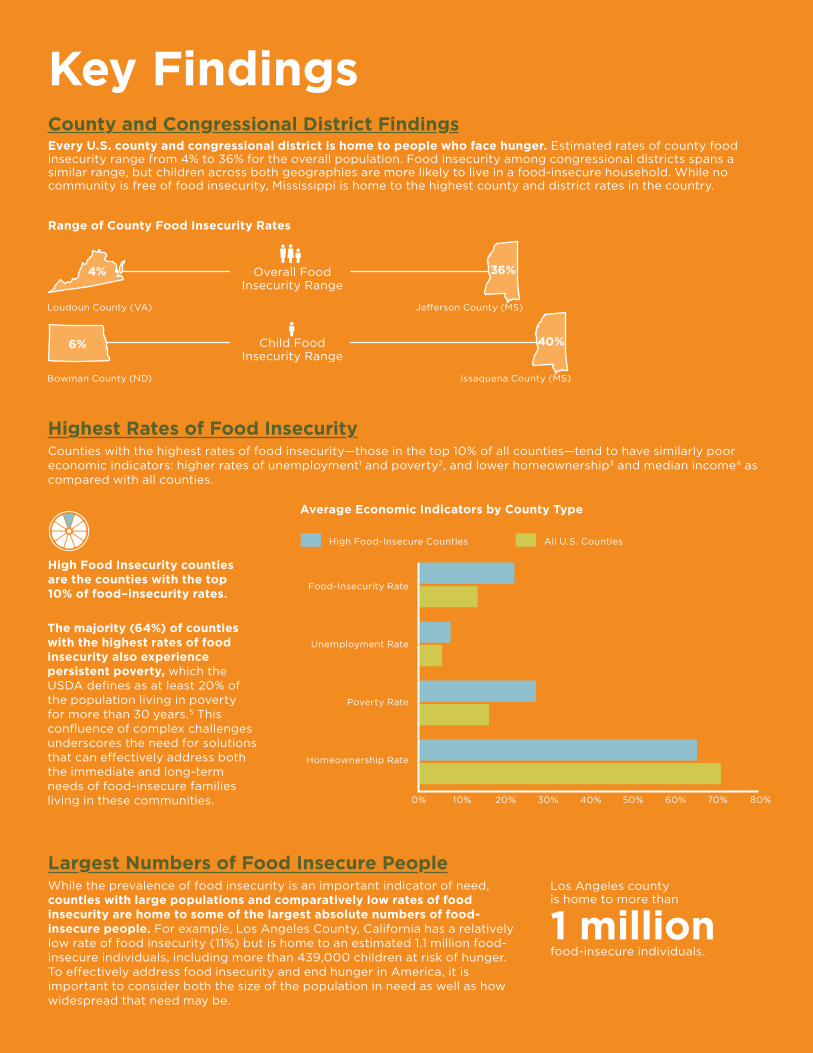
County and Congressional District FindingsEvery U.S. county and congressional district is home to people who face hunger. Estimated rates of county food insecurity range from 4% to 36% for the overall population. Food insecurity among congressional districts spans a similar range, but children across both geographies are more likely to live in a food-insecure household. While no community is free of food insecurity, Mississippi is home to the highest county and district rates in the country.
Range of County Food Insecurity Rates
Highest Rates of Food InsecurityCounties with the highest rates of food insecurity—those in the top 10% of all counties—tend to have similarly poor economic indicators: higher rates of unemployment1 and poverty2, and lower homeownership3 and median income4 as compared with all counties.
Largest Numbers of Food Insecure PeopleWhile the prevalence of food insecurity is an important indicator of need, counties with large populations and comparatively low rates of food insecurity are home to some of the largest absolute numbers of food-insecure people. For example, Los Angeles County, California has a relatively low rate of food insecurity (11%) but is home to an estimated 1.1 million food-insecure individuals, including more than 439,000 children at risk of hunger. To effectively address food insecurity and end hunger in America, it is important to consider both the size of the population in need as well as how widespread that need may be.
Child Food Insecurity Range
Overall Food Insecurity Range
Loudoun County (VA)
Bowman County (ND)
Jefferson County (MS)
Issaquena County (MS)
4%
6%
36%
40%
All U.S. CountiesHigh Food-Insecure Counties
Food-Insecurity Rate
Unemployment Rate
Poverty Rate
Homeownership Rate
Average Economic Indicators by County Type
0% 10% 20% 30% 40% 50% 60% 70% 80%
The majority (64%) of counties with the highest rates of food insecurity also experience persistent poverty, which the USDA defines as at least 20% of the population living in poverty for more than 30 years.5 This confluence of complex challenges underscores the need for solutions that can effectively address both the immediate and long-term needs of food-insecure families living in these communities.
Los Angeles county is home to more than
1 million food-insecure individuals.
However, with average meal costs nearly twice as high as the national average ($3.00) in some areas like New York County, the additional burden of high food prices can make it difficult for food-insecure households to make ends meet. This is especially true if they also struggle to afford housing, utilities, transportation, and other basic necessities.
41 Million Food Insecure Persons
(USDA)
$63 Spent Per Week
(CPS)
21 (3 Meals Per Day, 7 Days Per Week)
$16.90 Weekly Food
Budget Shortfall (CPS)
52 Weeks
7 of 12 Months (USDA)
$21 billion Food Budget Shortfall
$3.00 Average Cost Per Meal
All U.S. Counties
Rural South0% 0%
20% 20%
40% 40%
60% 60%
80% 80%
100% 100%
Urban West Midwest Northeast
High Food-Insecure Counties
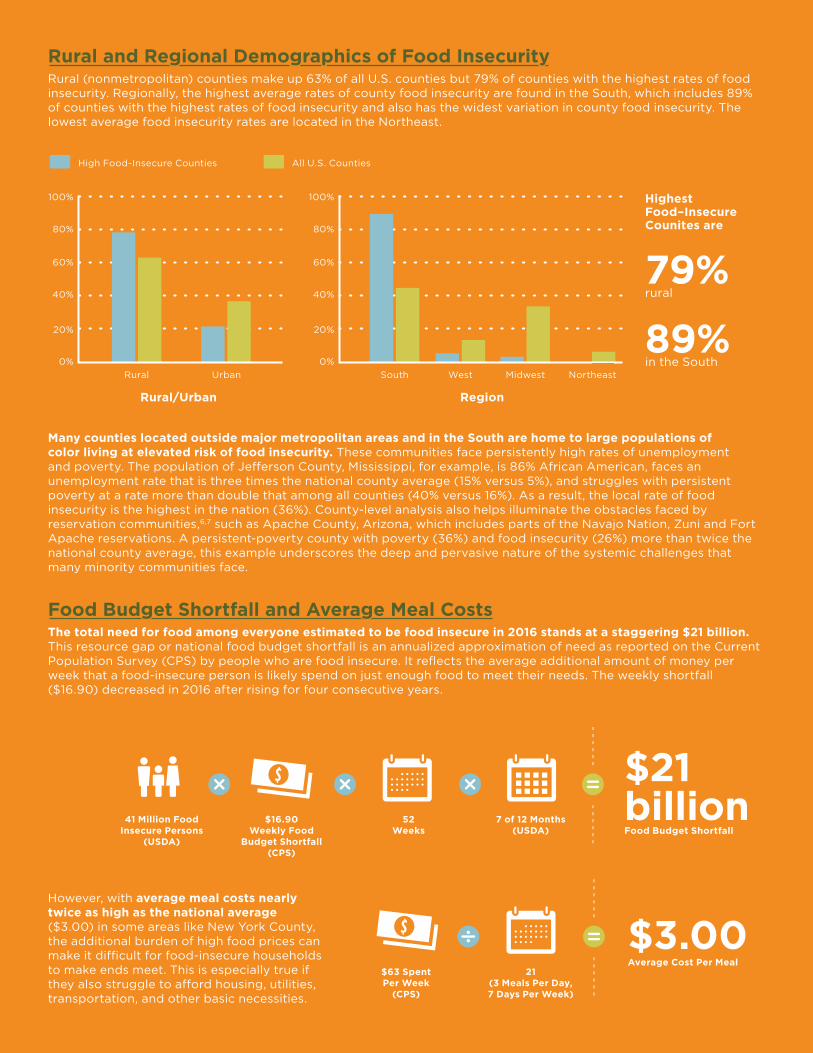
Rural and Regional Demographics of Food Insecurity Rural (nonmetropolitan) counties make up 63% of all U.S. counties but 79% of counties with the highest rates of food insecurity. Regionally, the highest average rates of county food insecurity are found in the South, which includes 89% of counties with the highest rates of food insecurity and also has the widest variation in county food insecurity. The lowest average food insecurity rates are located in the Northeast.
Many counties located outside major metropolitan areas and in the South are home to large populations of color living at elevated risk of food insecurity. These communities face persistently high rates of unemployment and poverty. The population of Jefferson County, Mississippi, for example, is 86% African American, faces an unemployment rate that is three times the national county average (15% versus 5%), and struggles with persistent poverty at a rate more than double that among all counties (40% versus 16%). As a result, the local rate of food insecurity is the highest in the nation (36%). County-level analysis also helps illuminate the obstacles faced by reservation communities,6,7 such as Apache County, Arizona, which includes parts of the Navajo Nation, Zuni and Fort Apache reservations. A persistent-poverty county with poverty (36%) and food insecurity (26%) more than twice the national county average, this example underscores the deep and pervasive nature of the systemic challenges that many minority communities face.
Food Budget Shortfall and Average Meal CostsThe total need for food among everyone estimated to be food insecure in 2016 stands at a staggering $21 billion. This resource gap or national food budget shortfall is an annualized approximation of need as reported on the Current Population Survey (CPS) by people who are food insecure. It reflects the average additional amount of money per week that a food-insecure person is likely spend on just enough food to meet their needs. The weekly shortfall ($16.90) decreased in 2016 after rising for four consecutive years.
Rural/Urban Region
79% rural
89% in the South
Highest Food–Insecure Counites are
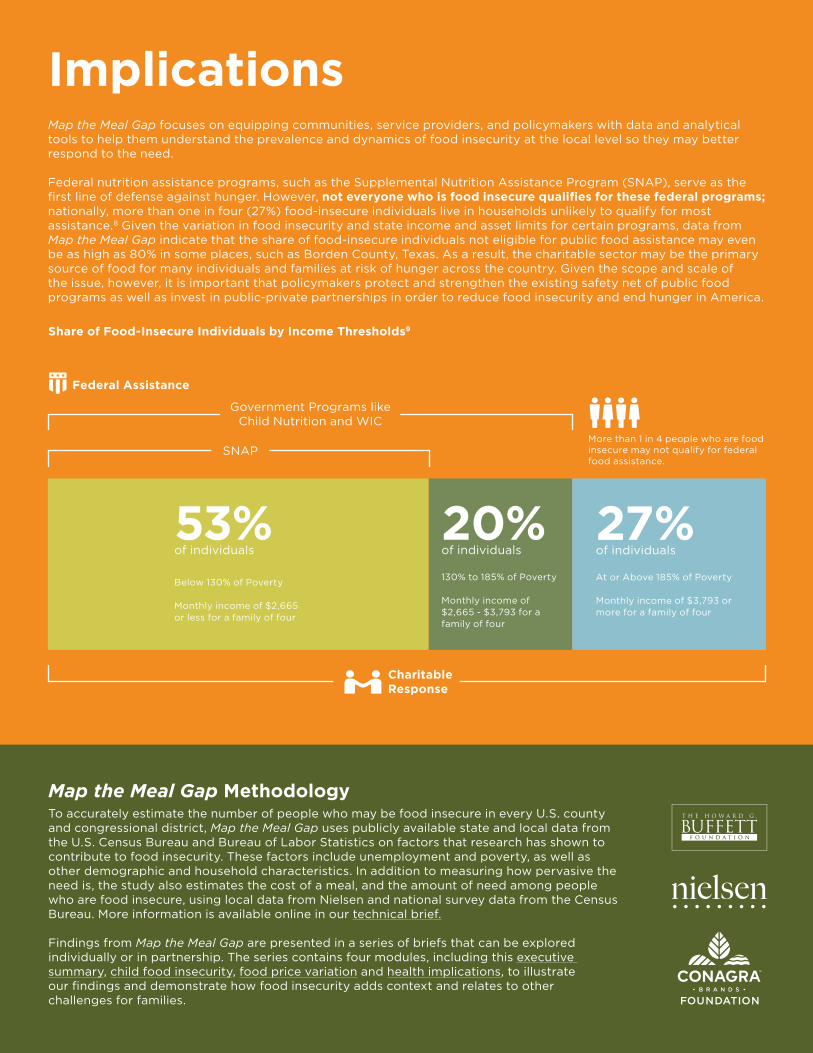
Implications
Map the Meal Gap focuses on equipping communities, service providers, and policymakers with data and analytical tools to help them understand the prevalence and dynamics of food insecurity at the local level so they may better respond to the need. Federal nutrition assistance programs, such as the Supplemental Nutrition Assistance Program (SNAP), serve as the first line of defense against hunger. However, not everyone who is food insecure qualifies for these federal programs;nationally, more than one in four (27%) food-insecure individuals live in households unlikely to qualify for most assistance.8 Given the variation in food insecurity and state income and asset limits for certain programs, data from Map the Meal Gap indicate that the share of food-insecure individuals not eligible for public food assistance may even be as high as 80% in some places, such as Borden County, Texas. As a result, the charitable sector may be the primary source of food for many individuals and families at risk of hunger across the country. Given the scope and scale of the issue, however, it is important that policymakers protect and strengthen the existing safety net of public food programs as well as invest in public-private partnerships in order to reduce food insecurity and end hunger in America.
Map the Meal Gap Methodology
To accurately estimate the number of people who may be food insecure in every U.S. county and congressional district, Map the Meal Gap uses publicly available state and local data from the U.S. Census Bureau and Bureau of Labor Statistics on factors that research has shown to contribute to food insecurity. These factors include unemployment and poverty, as well as other demographic and household characteristics. In addition to measuring how pervasive the need is, the study also estimates the cost of a meal, and the amount of need among people who are food insecure, using local data from Nielsen and national survey data from the Census Bureau. More information is available online in our technical brief.
Findings from Map the Meal Gap are presented in a series of briefs that can be explored individually or in partnership. The series contains four modules, including this executive summary, child food insecurity, food price variation and health implications, to illustrate our findings and demonstrate how food insecurity adds context and relates to other challenges for families.
SNAP
Government Programs like Child Nutrition and WIC
53% of individuals
Below 130% of Poverty Monthly income of $2,665 or less for a family of four
20%of individuals
130% to 185% of Poverty
Monthly income of $2,665 - $3,793 for a family of four
27%of individuals
At or Above 185% of Poverty
Monthly income of $3,793 or more for a family of four
More than 1 in 4 people who are food insecure may not qualify for federal food assistance.
Share of Food-Insecure Individuals by Income Thresholds9
Federal Assistance
Charitable Response
Key Findings
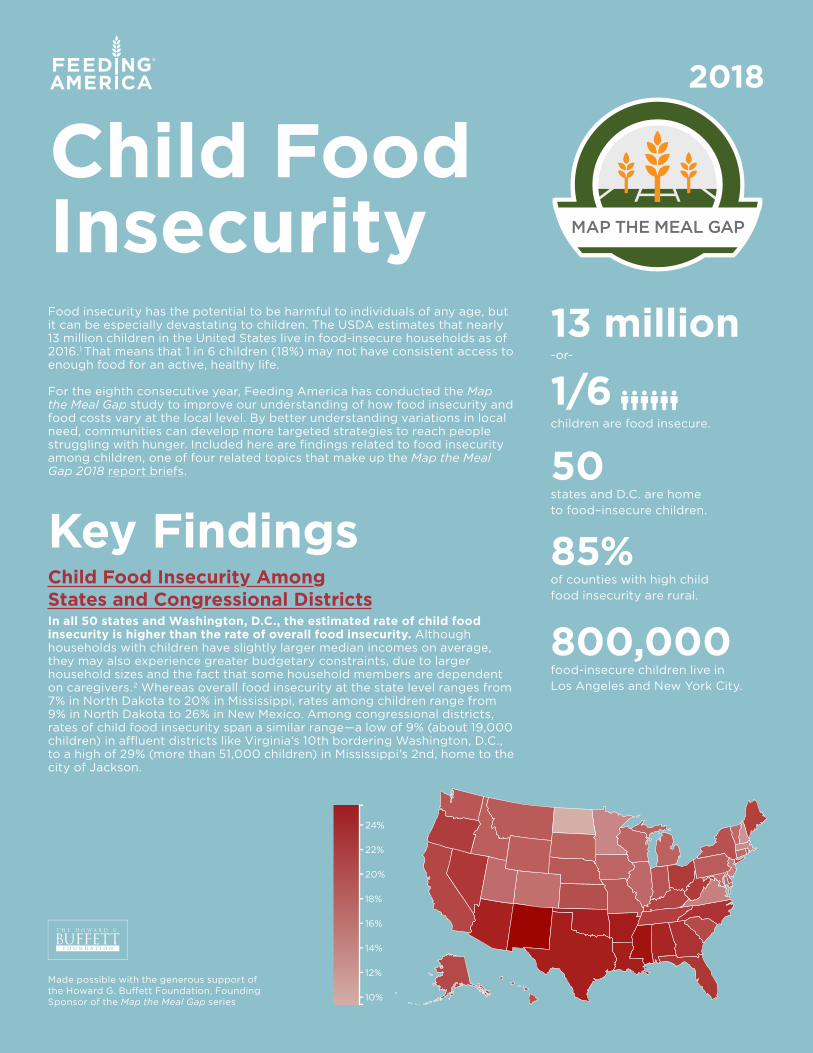
1/6children are food insecure.
50states and D.C. are home to food–insecure children.
85%of counties with high child food insecurity are rural.
800,000food-insecure children live in Los Angeles and New York City.
-or-
Child Food Insecurity Among States and Congressional DistrictsIn all 50 states and Washington, D.C., the estimated rate of child food insecurity is higher than the rate of overall food insecurity. Although households with children have slightly larger median incomes on average, they may also experience greater budgetary constraints, due to larger household sizes and the fact that some household members are dependent on caregivers.2 Whereas overall food insecurity at the state level ranges from 7% in North Dakota to 20% in Mississippi, rates among children range from 9% in North Dakota to 26% in New Mexico. Among congressional districts, rates of child food insecurity span a similar range—a low of 9% (about 19,000 children) in affluent districts like Virginia’s 10th bordering Washington, D.C., to a high of 29% (more than 51,000 children) in Mississippi’s 2nd, home to the city of Jackson.
Child Food Insecurity Food insecurity has the potential to be harmful to individuals of any age, but it can be especially devastating to children. The USDA estimates that nearly 13 million children in the United States live in food-insecure households as of 2016.1 That means that 1 in 6 children (18%) may not have consistent access to enough food for an active, healthy life.
For the eighth consecutive year, Feeding America has conducted the Map the Meal Gap study to improve our understanding of how food insecurity and food costs vary at the local level. By better understanding variations in local need, communities can develop more targeted strategies to reach people struggling with hunger. Included here are findings related to food insecurity among children, one of four related topics that make up the Map the Meal Gap 2018 report briefs.
Made possible with the generous support of the Howard G. Buffett Foundation, Founding Sponsor of the Map the Meal Gap series
13 million
2018
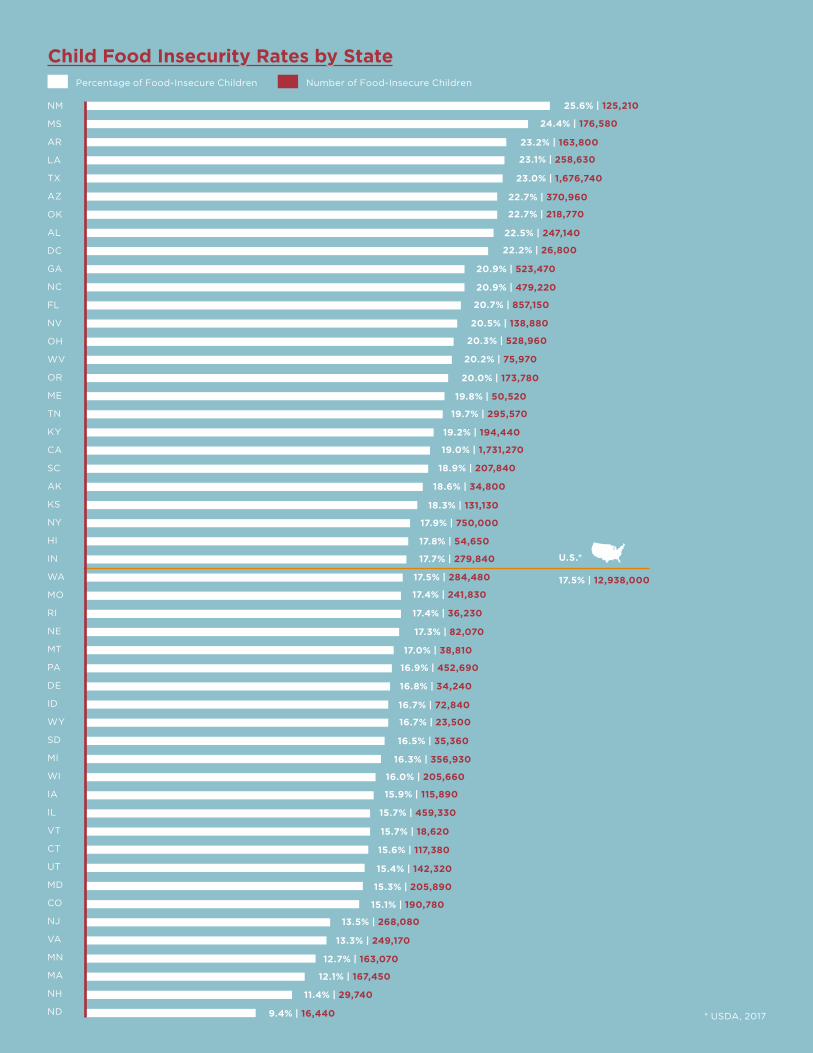
Child Food Insecurity by StatePercentage of Food-Insecure Children Number of Food-Insecure Children
NM 25.6% | 125,210
24.4% | 176,580
23.2% | 163,800
23.1% | 258,630
23.0% | 1,676,740
22.7% | 370,960
22.7% | 218,770
22.5% | 247,140
22.2% | 26,800
20.9% | 523,470
20.9% | 479,220
20.7% | 857,150
20.5% | 138,880
20.3% | 528,960
20.2% | 75,970
20.0% | 173,780
19.8% | 50,520
19.7% | 295,570
19.2% | 194,440
19.0% | 1,731,270
18.9% | 207,840
18.6% | 34,800
18.3% | 131,130
17.9% | 750,000
17.8% | 54,650
17.7% | 279,840
17.5% | 284,480 17.5% | 12,938,000
U.S.*
* USDA, 2017
17.4% | 241,830
17.4% | 36,230
17.3% | 82,070
17.0% | 38,810
16.9% | 452,690
16.8% | 34,240
16.7% | 72,840
16.7% | 23,500
16.5% | 35,360
16.3% | 356,930
16.0% | 205,660
15.9% | 115,890
15.7% | 459,330
15.7% | 18,620
15.6% | 117,380
15.4% | 142,320
15.3% | 205,890
15.1% | 190,780
13.5% | 268,080
13.3% | 249,170
12.7% | 163,070
12.1% | 167,450
11.4% | 29,740
9.4% | 16,440
MS
AR
LA
TX
AZ
OK
AL
DC
GA
NC
FL
NV
OH
WV
OR
ME
TN
KY
CA
SC
AK
KS
NY
HI
IN
WA
MO
RI
NE
MT
PA
DE
ID
WY
SD
MI
WI
IA
IL
VT
CT
UT
MD
CO
NJ
VA
MN
MA
NH
ND
Child Food Insecurity Rates by State
Higher unemployment
28% of children are food insecure
Higher poverty
Lower median income
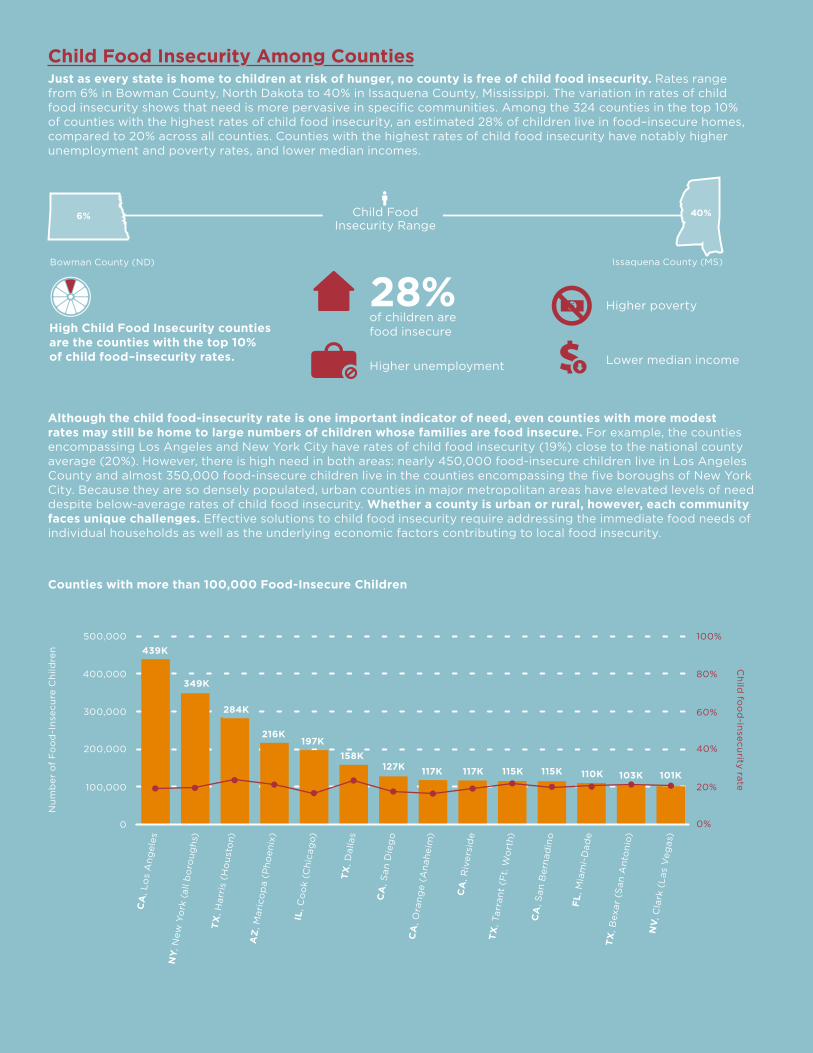
Although the child food-insecurity rate is one important indicator of need, even counties with more modest rates may still be home to large numbers of children whose families are food insecure. For example, the counties encompassing Los Angeles and New York City have rates of child food insecurity (19%) close to the national county average (20%). However, there is high need in both areas: nearly 450,000 food-insecure children live in Los Angeles County and almost 350,000 food-insecure children live in the counties encompassing the five boroughs of New York City. Because they are so densely populated, urban counties in major metropolitan areas have elevated levels of need despite below-average rates of child food insecurity. Whether a county is urban or rural, however, each community faces unique challenges. Effective solutions to child food insecurity require addressing the immediate food needs of individual households as well as the underlying economic factors contributing to local food insecurity.
Child Food Insecurity Among CountiesJust as every state is home to children at risk of hunger, no county is free of child food insecurity. Rates range from 6% in Bowman County, North Dakota to 40% in Issaquena County, Mississippi. The variation in rates of child food insecurity shows that need is more pervasive in specific communities. Among the 324 counties in the top 10% of counties with the highest rates of child food insecurity, an estimated 28% of children live in food–insecure homes, compared to 20% across all counties. Counties with the highest rates of child food insecurity have notably higher unemployment and poverty rates, and lower median incomes.
Nu
mb
er o
f F
oo
d-I
nse
cure
Ch
ildre
n
Ch
ild fo
od
-insecu
rity rate
Counties with more than 100,000 Food-Insecure Children
439K
349K
216K197K
158K127K 117K 117K 115K 115K 110K 103K 101K
500,000
400,000
300,000
200,000
100,000
0
100%
80%
60%
40%
20%
0%
CA
, Lo
s A
ng
eles
NY,
New
Yo
rk (
all b
oro
ug
hs)
TX
, Har
ris
(Ho
ust
on)
AZ
, Mar
ico
pa
(Ph
oen
ix)
IL, C
oo
k (C
hic
ago)
TX
, Dal
las
CA
, San
Die
go
CA
, Ora
ng
e (A
nah
eim
)
CA
, Riv
ersi
de
TX
, Tar
rant
(F
t. W
ort
h)
CA
, San
Ber
nad
ino
FL,
Mia
mi-
Dad
e
TX
, Bex
ar (
San
Ant
on
io)
NV
, Cla
rk (
Las
Veg
as)
Child Food Insecurity Range
Bowman County (ND) Issaquena County (MS)
6% 40%
High Child Food Insecurity counties are the counties with the top 10% of child food–insecurity rates.
284K
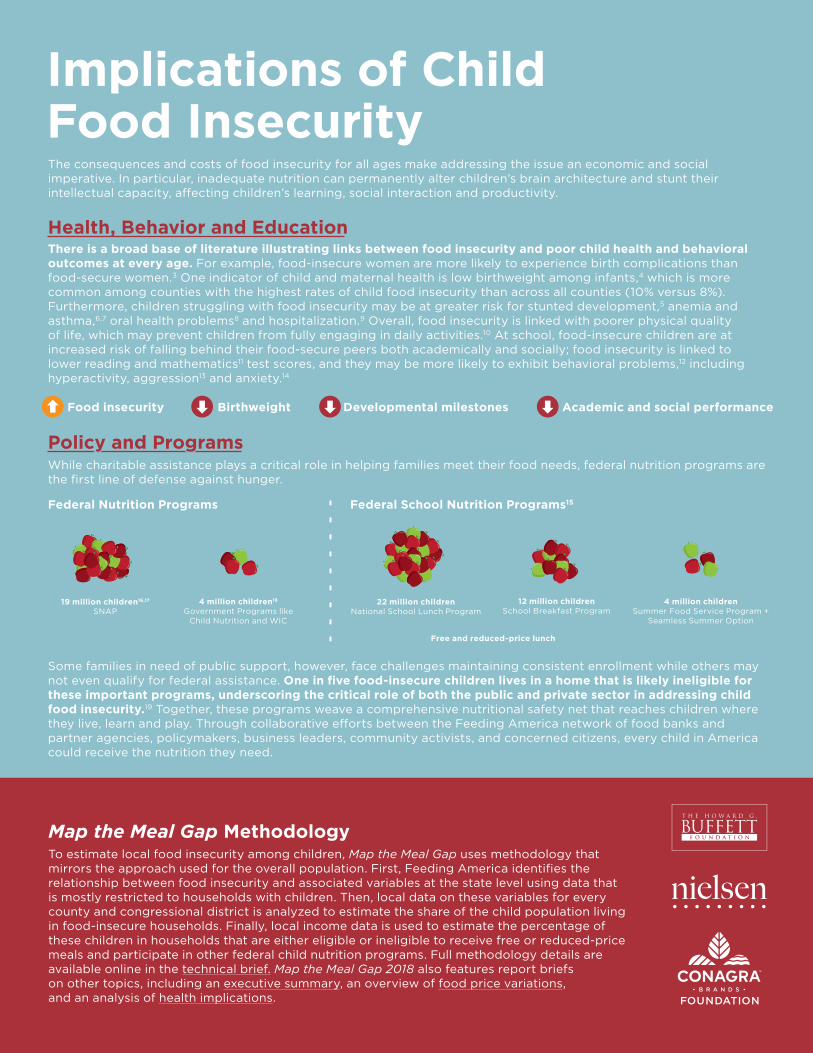
Implications of Child Food Insecurity The consequences and costs of food insecurity for all ages make addressing the issue an economic and social imperative. In particular, inadequate nutrition can permanently alter children’s brain architecture and stunt their intellectual capacity, affecting children’s learning, social interaction and productivity.
Health, Behavior and Education
Policy and ProgramsWhile charitable assistance plays a critical role in helping families meet their food needs, federal nutrition programs are the first line of defense against hunger.
Some families in need of public support, however, face challenges maintaining consistent enrollment while others may not even qualify for federal assistance. One in five food-insecure children lives in a home that is likely ineligible for these important programs, underscoring the critical role of both the public and private sector in addressing child food insecurity.19 Together, these programs weave a comprehensive nutritional safety net that reaches children where they live, learn and play. Through collaborative efforts between the Feeding America network of food banks and partner agencies, policymakers, business leaders, community activists, and concerned citizens, every child in America could receive the nutrition they need.
22 million childrenNational School Lunch Program
Free and reduced-price lunch
19 million children16,17
SNAP12 million children
School Breakfast Program 4 million children18
Government Programs like Child Nutrition and WIC
4 million childrenSummer Food Service Program +
Seamless Summer Option
Map the Meal Gap Methodology
To estimate local food insecurity among children, Map the Meal Gap uses methodology that mirrors the approach used for the overall population. First, Feeding America identifies the relationship between food insecurity and associated variables at the state level using data that is mostly restricted to households with children. Then, local data on these variables for every county and congressional district is analyzed to estimate the share of the child population living in food-insecure households. Finally, local income data is used to estimate the percentage of these children in households that are either eligible or ineligible to receive free or reduced-price meals and participate in other federal child nutrition programs. Full methodology details are available online in the technical brief. Map the Meal Gap 2018 also features report briefs on other topics, including an executive summary, an overview of food price variations, and an analysis of health implications.
There is a broad base of literature illustrating links between food insecurity and poor child health and behavioral outcomes at every age. For example, food-insecure women are more likely to experience birth complications than food-secure women.3 One indicator of child and maternal health is low birthweight among infants,4 which is more common among counties with the highest rates of child food insecurity than across all counties (10% versus 8%). Furthermore, children struggling with food insecurity may be at greater risk for stunted development,5 anemia and asthma,6,7 oral health problems8 and hospitalization.9 Overall, food insecurity is linked with poorer physical quality of life, which may prevent children from fully engaging in daily activities.10 At school, food-insecure children are at increased risk of falling behind their food-secure peers both academically and socially; food insecurity is linked to lower reading and mathematics11 test scores, and they may be more likely to exhibit behavioral problems,12 including hyperactivity, aggression13 and anxiety.14
Food insecurity Birthweight Developmental milestones Academic and social performance
Federal Nutrition Programs Federal School Nutrition Programs15
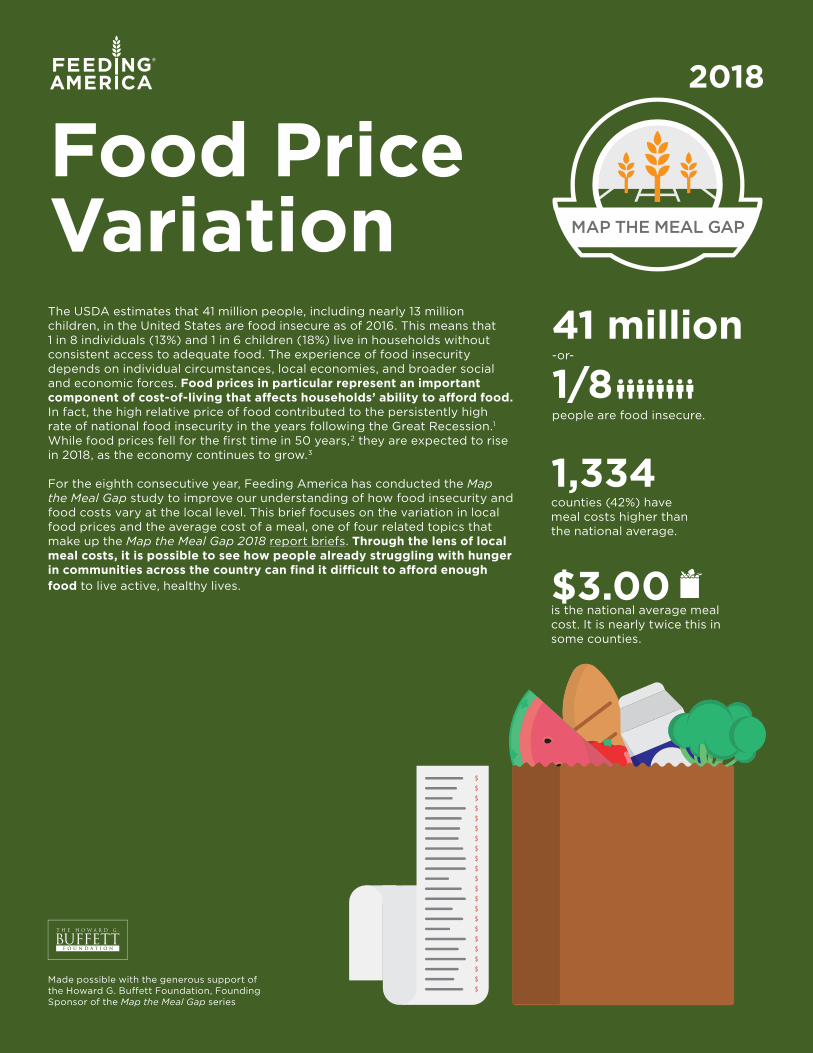
Food Price VariationThe USDA estimates that 41 million people, including nearly 13 million children, in the United States are food insecure as of 2016. This means that 1 in 8 individuals (13%) and 1 in 6 children (18%) live in households without consistent access to adequate food. The experience of food insecurity depends on individual circumstances, local economies, and broader social and economic forces. Food prices in particular represent an important component of cost-of-living that affects households’ ability to afford food. In fact, the high relative price of food contributed to the persistently high rate of national food insecurity in the years following the Great Recession.1 While food prices fell for the first time in 50 years,2 they are expected to rise in 2018, as the economy continues to grow.3 For the eighth consecutive year, Feeding America has conducted the Map the Meal Gap study to improve our understanding of how food insecurity and food costs vary at the local level. This brief focuses on the variation in local food prices and the average cost of a meal, one of four related topics that make up the Map the Meal Gap 2018 report briefs. Through the lens of local meal costs, it is possible to see how people already struggling with hunger in communities across the country can find it difficult to afford enough food to live active, healthy lives.
-or-
41 million1/8people are food insecure.
1,334 counties (42%) have meal costs higher than the national average.
Made possible with the generous support of the Howard G. Buffett Foundation, Founding Sponsor of the Map the Meal Gap series
2018
$3.00 is the national average meal cost. It is nearly twice this in some counties.
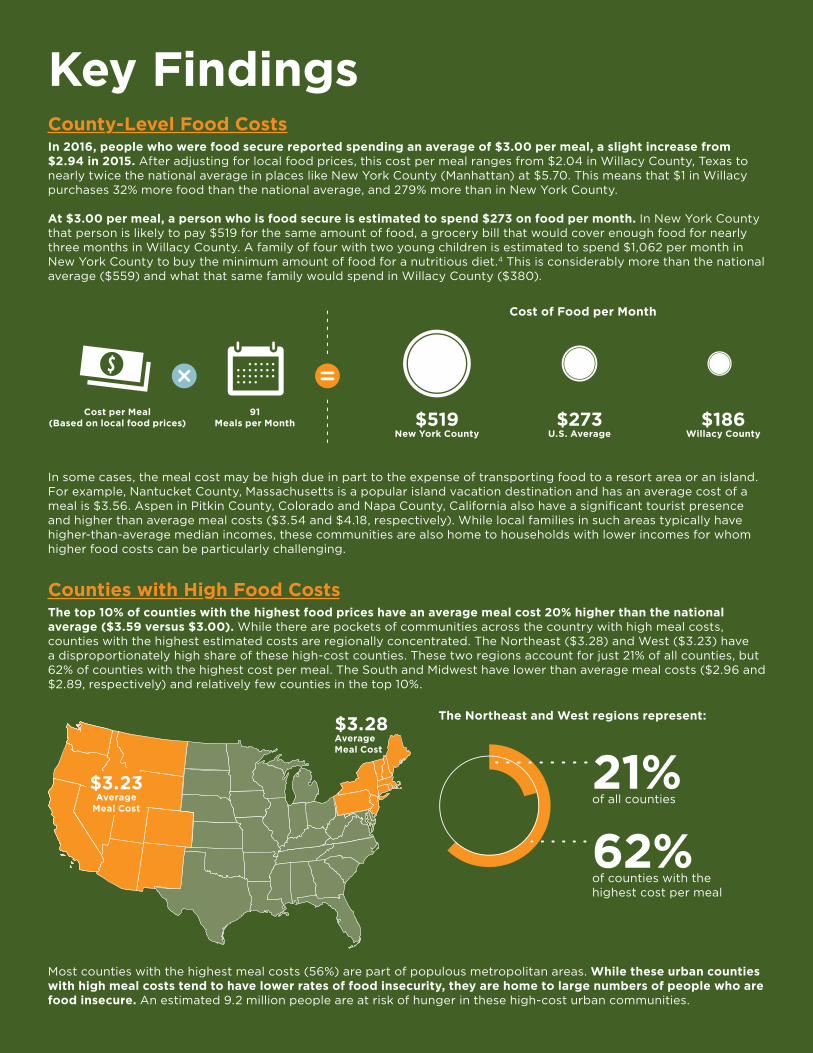
Key FindingsCounty-Level Food CostsIn 2016, people who were food secure reported spending an average of $3.00 per meal, a slight increase from $2.94 in 2015. After adjusting for local food prices, this cost per meal ranges from $2.04 in Willacy County, Texas to nearly twice the national average in places like New York County (Manhattan) at $5.70. This means that $1 in Willacy purchases 32% more food than the national average, and 279% more than in New York County. At $3.00 per meal, a person who is food secure is estimated to spend $273 on food per month. In New York County that person is likely to pay $519 for the same amount of food, a grocery bill that would cover enough food for nearly three months in Willacy County. A family of four with two young children is estimated to spend $1,062 per month in New York County to buy the minimum amount of food for a nutritious diet.4 This is considerably more than the national average ($559) and what that same family would spend in Willacy County ($380).
In some cases, the meal cost may be high due in part to the expense of transporting food to a resort area or an island. For example, Nantucket County, Massachusetts is a popular island vacation destination and has an average cost of a meal is $3.56. Aspen in Pitkin County, Colorado and Napa County, California also have a significant tourist presence and higher than average meal costs ($3.54 and $4.18, respectively). While local families in such areas typically have higher-than-average median incomes, these communities are also home to households with lower incomes for whom higher food costs can be particularly challenging.
Counties with High Food CostsThe top 10% of counties with the highest food prices have an average meal cost 20% higher than the national average ($3.59 versus $3.00). While there are pockets of communities across the country with high meal costs, counties with the highest estimated costs are regionally concentrated. The Northeast ($3.28) and West ($3.23) have a disproportionately high share of these high-cost counties. These two regions account for just 21% of all counties, but 62% of counties with the highest cost per meal. The South and Midwest have lower than average meal costs ($2.96 and $2.89, respectively) and relatively few counties in the top 10%.
Most counties with the highest meal costs (56%) are part of populous metropolitan areas. While these urban counties with high meal costs tend to have lower rates of food insecurity, they are home to large numbers of people who are food insecure. An estimated 9.2 million people are at risk of hunger in these high-cost urban communities.
Price per meal Meals per month $519 New York County
Cost of Food per Month
Cost per Meal(Based on local food prices)
91Meals per Month
21%of all counties
62%of counties with the highest cost per meal
$186 Willacy County
$273 U.S. Average
$3.23 Average
Meal Cost
$3.28 Average Meal Cost
The Northeast and West regions represent:
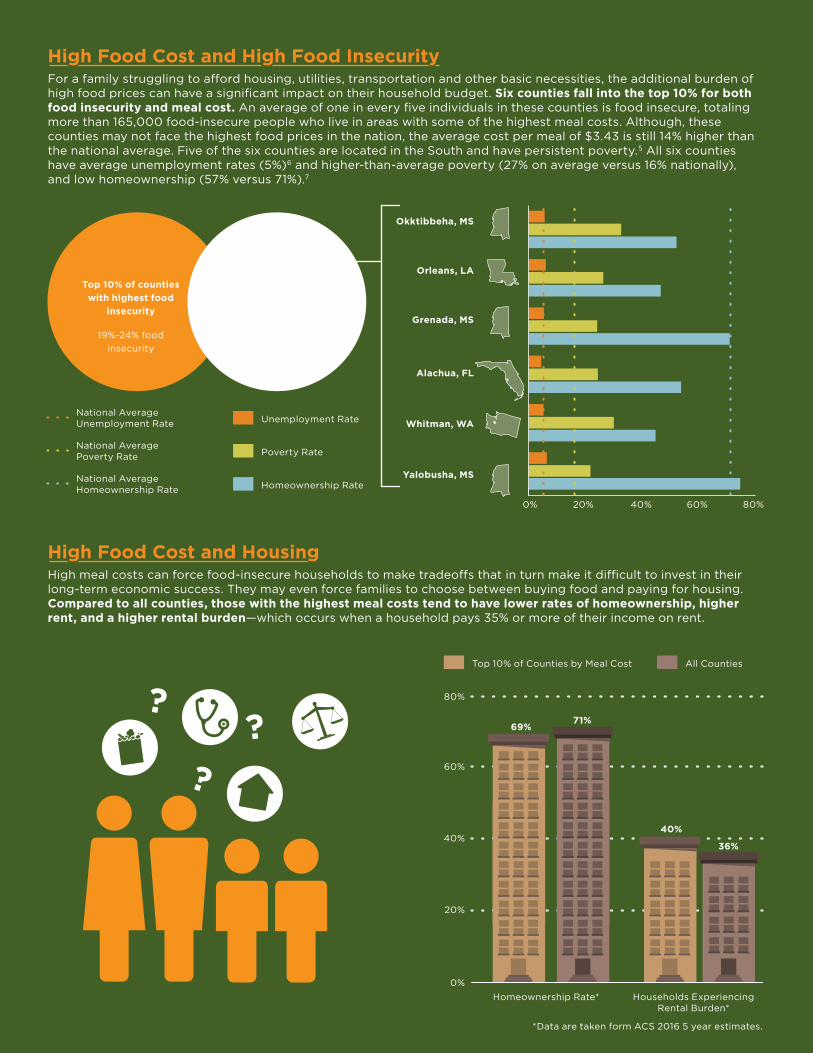
High Food Cost and High Food Insecurity For a family struggling to afford housing, utilities, transportation and other basic necessities, the additional burden of high food prices can have a significant impact on their household budget. Six counties fall into the top 10% for both food insecurity and meal cost. An average of one in every five individuals in these counties is food insecure, totaling more than 165,000 food-insecure people who live in areas with some of the highest meal costs. Although, these counties may not face the highest food prices in the nation, the average cost per meal of $3.43 is still 14% higher than the national average. Five of the six counties are located in the South and have persistent poverty.5 All six counties have average unemployment rates (5%)6 and higher-than-average poverty (27% on average versus 16% nationally), and low homeownership (57% versus 71%).7
High Food Cost and Housing
High meal costs can force food-insecure households to make tradeoffs that in turn make it difficult to invest in their long-term economic success. They may even force families to choose between buying food and paying for housing. Compared to all counties, those with the highest meal costs tend to have lower rates of homeownership, higher rent, and a higher rental burden—which occurs when a household pays 35% or more of their income on rent.
?
??
Top 10% of counties with highest food
insecurity
19%-24% food insecurity
Top 10% of counties with highest
food cost
$3.31-$3.53
Okktibbeha, MS
Orleans, LA
Grenada, MS
Alachua, FL
Whitman, WA
Yalobusha, MS
0% 20% 40% 60% 80%
Homeownership RateNational Average Homeownership Rate
Poverty RateNational Average Poverty Rate
Top 10% of Counties by Meal Cost
*Data are taken form ACS 2016 5 year estimates.
All Counties
Homeownership Rate*0%
20%
40%
60%
80%
69%71%
Households Experiencing Rental Burden*
Unemployment RateNational Average Unemployment Rate
40%
36%
Implications
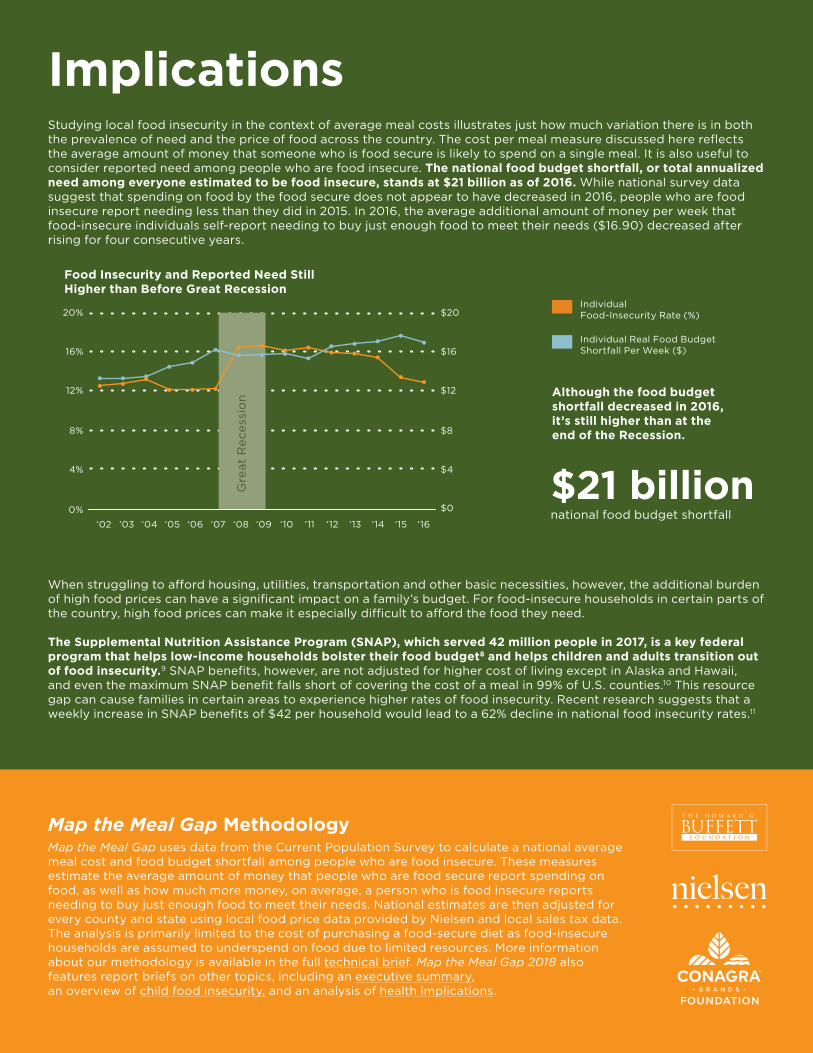
Studying local food insecurity in the context of average meal costs illustrates just how much variation there is in both the prevalence of need and the price of food across the country. The cost per meal measure discussed here reflects the average amount of money that someone who is food secure is likely to spend on a single meal. It is also useful to consider reported need among people who are food insecure. The national food budget shortfall, or total annualized need among everyone estimated to be food insecure, stands at $21 billion as of 2016. While national survey data suggest that spending on food by the food secure does not appear to have decreased in 2016, people who are food insecure report needing less than they did in 2015. In 2016, the average additional amount of money per week that food-insecure individuals self-report needing to buy just enough food to meet their needs ($16.90) decreased after rising for four consecutive years.
When struggling to afford housing, utilities, transportation and other basic necessities, however, the additional burden of high food prices can have a significant impact on a family’s budget. For food-insecure households in certain parts of the country, high food prices can make it especially difficult to afford the food they need.
The Supplemental Nutrition Assistance Program (SNAP), which served 42 million people in 2017, is a key federal program that helps low-income households bolster their food budget8 and helps children and adults transition out of food insecurity.9 SNAP benefits, however, are not adjusted for higher cost of living except in Alaska and Hawaii, and even the maximum SNAP benefit falls short of covering the cost of a meal in 99% of U.S. counties.10 This resource gap can cause families in certain areas to experience higher rates of food insecurity. Recent research suggests that a weekly increase in SNAP benefits of $42 per household would lead to a 62% decline in national food insecurity rates.11
Although the food budget shortfall decreased in 2016, it’s still higher than at the end of the Recession.
0%
4% $4
$0
8% $8
12% $12
16% $16
20% $20
Food Insecurity and Reported Need Still Higher than Before Great Recession
Individual Real Food Budget Shortfall Per Week ($)
Individual Food-Insecurity Rate (%)
‘16‘15‘14‘13‘12‘11‘10‘09‘08‘07‘06‘05‘04‘03‘02
Map the Meal Gap Methodology
Map the Meal Gap uses data from the Current Population Survey to calculate a national average meal cost and food budget shortfall among people who are food insecure. These measures estimate the average amount of money that people who are food secure report spending on food, as well as how much more money, on average, a person who is food insecure reports needing to buy just enough food to meet their needs. National estimates are then adjusted for every county and state using local food price data provided by Nielsen and local sales tax data. The analysis is primarily limited to the cost of purchasing a food-secure diet as food-insecure households are assumed to underspend on food due to limited resources. More information about our methodology is available in the full technical brief. Map the Meal Gap 2018 also features report briefs on other topics, including an executive summary, an overview of child food insecurity, and an analysis of health implications.
$21 billionnational food budget shortfall
Gre
at R
eces
sio
n
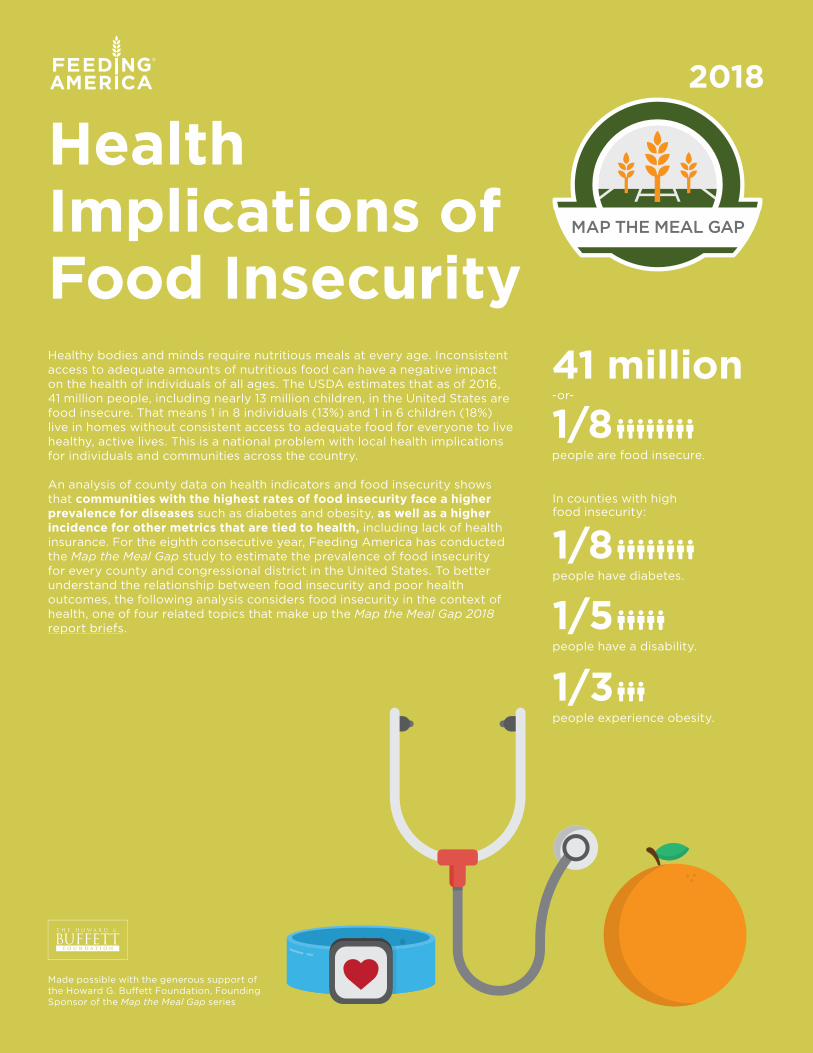
Health Implications of Food InsecurityHealthy bodies and minds require nutritious meals at every age. Inconsistent access to adequate amounts of nutritious food can have a negative impact on the health of individuals of all ages. The USDA estimates that as of 2016, 41 million people, including nearly 13 million children, in the United States are food insecure. That means 1 in 8 individuals (13%) and 1 in 6 children (18%) live in homes without consistent access to adequate food for everyone to live healthy, active lives. This is a national problem with local health implications for individuals and communities across the country. An analysis of county data on health indicators and food insecurity shows that communities with the highest rates of food insecurity face a higher prevalence for diseases such as diabetes and obesity, as well as a higher incidence for other metrics that are tied to health, including lack of health insurance. For the eighth consecutive year, Feeding America has conducted the Map the Meal Gap study to estimate the prevalence of food insecurity for every county and congressional district in the United States. To better understand the relationship between food insecurity and poor health outcomes, the following analysis considers food insecurity in the context of health, one of four related topics that make up the Map the Meal Gap 2018 report briefs.
-or-
41 million1/8people are food insecure.
In counties with high food insecurity:
1/8people have diabetes.
Made possible with the generous support of the Howard G. Buffett Foundation, Founding Sponsor of the Map the Meal Gap series
2018
1/5people have a disability.
1/3people experience obesity.
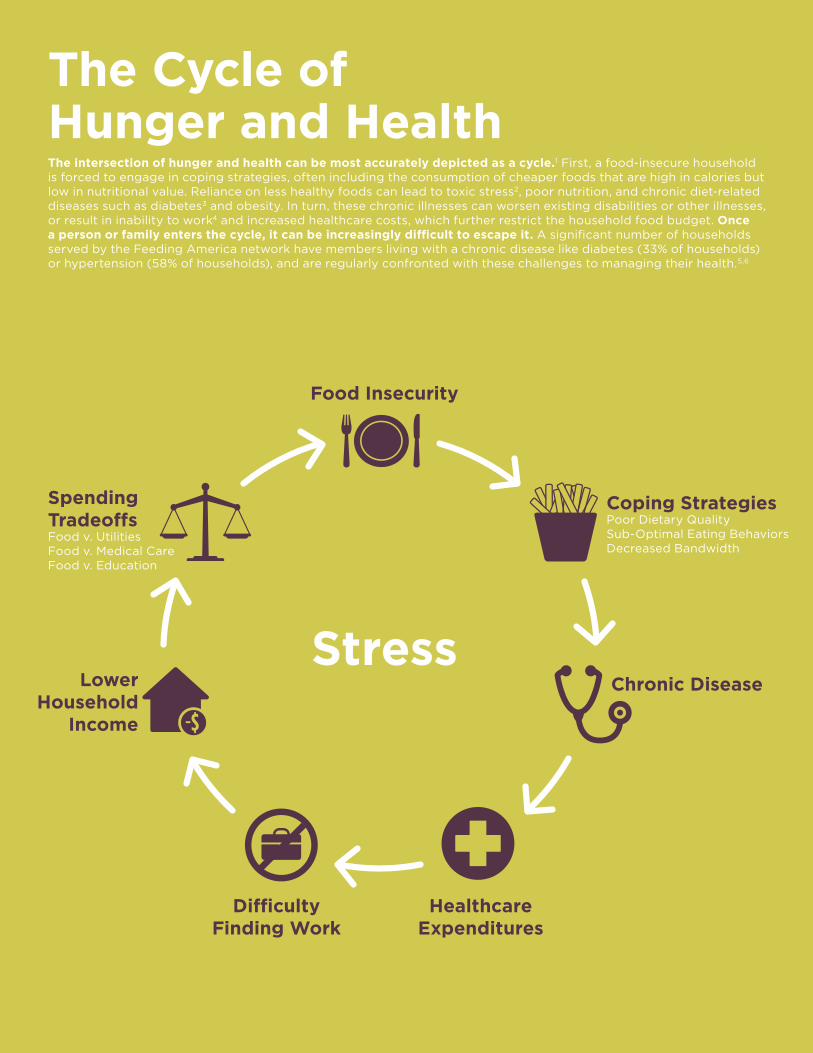
The Cycle of Hunger and Health The intersection of hunger and health can be most accurately depicted as a cycle.1 First, a food-insecure household is forced to engage in coping strategies, often including the consumption of cheaper foods that are high in calories but low in nutritional value. Reliance on less healthy foods can lead to toxic stress2, poor nutrition, and chronic diet-related diseases such as diabetes3 and obesity. In turn, these chronic illnesses can worsen existing disabilities or other illnesses, or result in inability to work4 and increased healthcare costs, which further restrict the household food budget. Once a person or family enters the cycle, it can be increasingly difficult to escape it. A significant number of households served by the Feeding America network have members living with a chronic disease like diabetes (33% of households) or hypertension (58% of households), and are regularly confronted with these challenges to managing their health.5,6
Chronic Disease
Healthcare Expenditures
Difficulty Finding Work
Spending Tradeoffs Food v. UtilitiesFood v. Medical CareFood v. Education
Food Insecurity
StressLower
Household Income
Coping StrategiesPoor Dietary QualitySub-Optimal Eating Behaviors Decreased Bandwidth
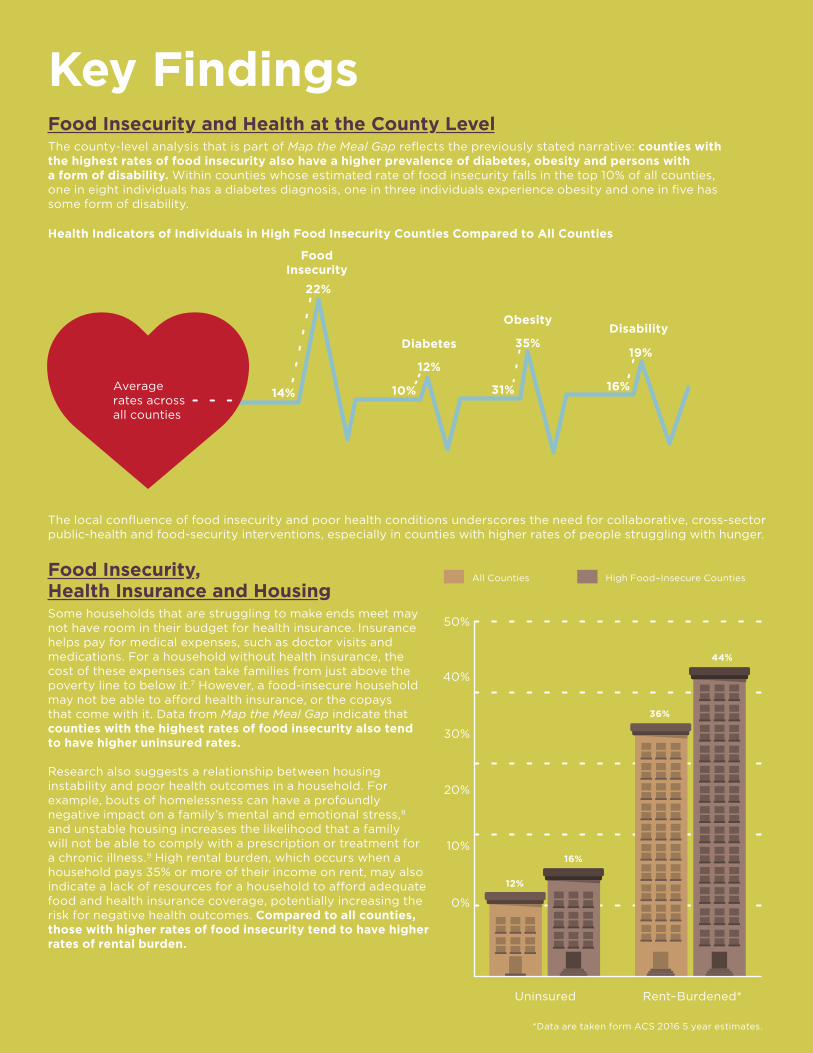
Key FindingsFood Insecurity and Health at the County LevelThe county-level analysis that is part of Map the Meal Gap reflects the previously stated narrative: counties with the highest rates of food insecurity also have a higher prevalence of diabetes, obesity and persons with a form of disability. Within counties whose estimated rate of food insecurity falls in the top 10% of all counties, one in eight individuals has a diabetes diagnosis, one in three individuals experience obesity and one in five has some form of disability.
The local confluence of food insecurity and poor health conditions underscores the need for collaborative, cross-sector public-health and food-security interventions, especially in counties with higher rates of people struggling with hunger.
Food Insecurity, Health Insurance and HousingSome households that are struggling to make ends meet may not have room in their budget for health insurance. Insurance helps pay for medical expenses, such as doctor visits and medications. For a household without health insurance, the cost of these expenses can take families from just above the poverty line to below it.7 However, a food-insecure household may not be able to afford health insurance, or the copays that come with it. Data from Map the Meal Gap indicate that counties with the highest rates of food insecurity also tend to have higher uninsured rates.
Research also suggests a relationship between housing instability and poor health outcomes in a household. For example, bouts of homelessness can have a profoundly negative impact on a family’s mental and emotional stress,8 and unstable housing increases the likelihood that a family will not be able to comply with a prescription or treatment for a chronic illness.9 High rental burden, which occurs when a household pays 35% or more of their income on rent, may also indicate a lack of resources for a household to afford adequate food and health insurance coverage, potentially increasing the risk for negative health outcomes. Compared to all counties, those with higher rates of food insecurity tend to have higher rates of rental burden.
Uninsured Rent–Burdened*
0%
10%
20%
30%
40%
50%
Health Indicators of Individuals in High Food Insecurity Counties Compared to All Counties
Food Insecurity
Diabetes
ObesityDisability
22%
14% 31% 16%
19%35%
12%
All Counties High Food–Insecure Counties
Average rates across all counties
12%
36%
16%
44%
10%
*Data are taken form ACS 2016 5 year estimates.
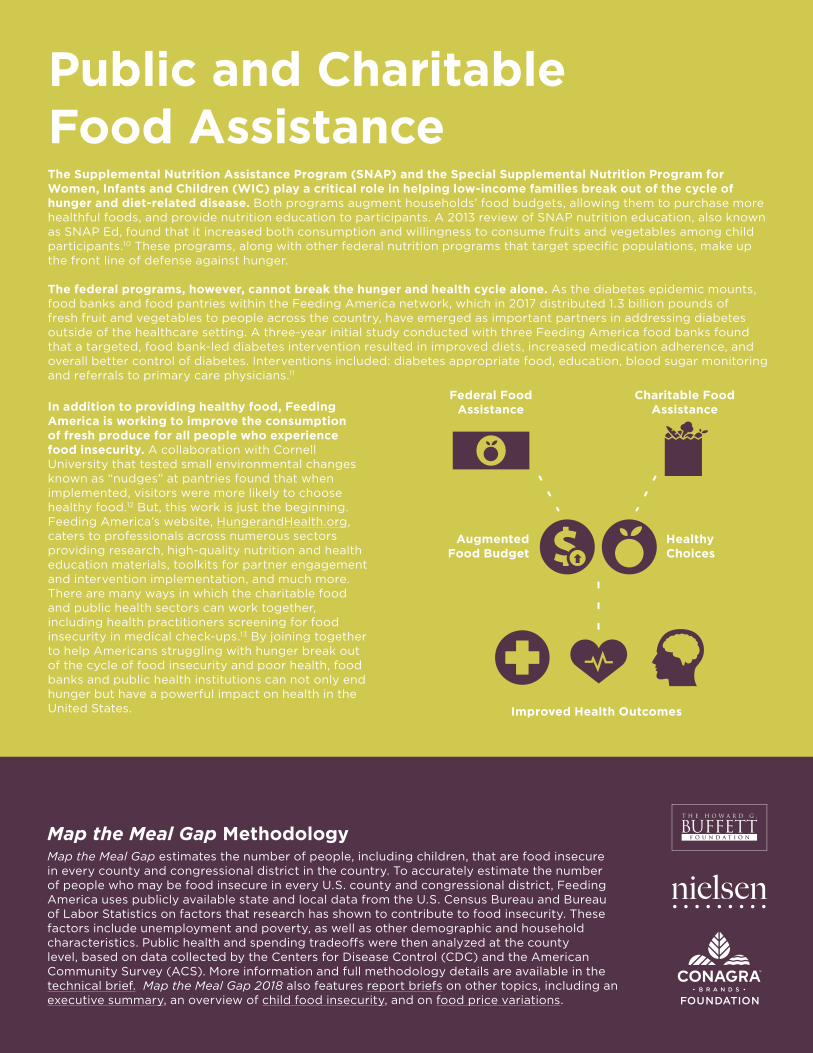
Public and Charitable Food AssistanceThe Supplemental Nutrition Assistance Program (SNAP) and the Special Supplemental Nutrition Program for Women, Infants and Children (WIC) play a critical role in helping low-income families break out of the cycle of hunger and diet-related disease. Both programs augment households’ food budgets, allowing them to purchase more healthful foods, and provide nutrition education to participants. A 2013 review of SNAP nutrition education, also known as SNAP Ed, found that it increased both consumption and willingness to consume fruits and vegetables among child participants.10 These programs, along with other federal nutrition programs that target specific populations, make up the front line of defense against hunger.
The federal programs, however, cannot break the hunger and health cycle alone. As the diabetes epidemic mounts, food banks and food pantries within the Feeding America network, which in 2017 distributed 1.3 billion pounds of fresh fruit and vegetables to people across the country, have emerged as important partners in addressing diabetes outside of the healthcare setting. A three-year initial study conducted with three Feeding America food banks found that a targeted, food bank-led diabetes intervention resulted in improved diets, increased medication adherence, and overall better control of diabetes. Interventions included: diabetes appropriate food, education, blood sugar monitoring and referrals to primary care physicians.11
In addition to providing healthy food, Feeding America is working to improve the consumption of fresh produce for all people who experience food insecurity. A collaboration with Cornell University that tested small environmental changes known as “nudges” at pantries found that when implemented, visitors were more likely to choose healthy food.12 But, this work is just the beginning. Feeding America’s website, HungerandHealth.org, caters to professionals across numerous sectors providing research, high-quality nutrition and health education materials, toolkits for partner engagement and intervention implementation, and much more. There are many ways in which the charitable food and public health sectors can work together, including health practitioners screening for food insecurity in medical check-ups.13 By joining together to help Americans struggling with hunger break out of the cycle of food insecurity and poor health, food banks and public health institutions can not only end hunger but have a powerful impact on health in the United States.
Federal Food Assistance
Charitable Food Assistance
Healthy Choices
Improved Health Outcomes
Augmented Food Budget
Map the Meal Gap Methodology
Map the Meal Gap estimates the number of people, including children, that are food insecure in every county and congressional district in the country. To accurately estimate the number of people who may be food insecure in every U.S. county and congressional district, Feeding America uses publicly available state and local data from the U.S. Census Bureau and Bureau of Labor Statistics on factors that research has shown to contribute to food insecurity. These factors include unemployment and poverty, as well as other demographic and household characteristics. Public health and spending tradeoffs were then analyzed at the county level, based on data collected by the Centers for Disease Control (CDC) and the American Community Survey (ACS). More information and full methodology details are available in the technical brief. Map the Meal Gap 2018 also features report briefs on other topics, including an executive summary, an overview of child food insecurity, and on food price variations.
ReferencesExecutive Summary
1. Bureau of Labor Statistics. (2017).
2. United States Department of Agriculture, Economic Research Service. (2017).
3. United States Department of Agriculture, Economic Research Service. (2017).
4. 4. United States Census Bureau (2017). Income and poverty in the United States: 2016. Washington, D.C.: Semega, J. L, Fontenot, K. R., & Kollar, M. A.
5. United States Department of Agriculture, Economic Research Service. (2017).
6. Mathematica Policy Research. (2012). Gordon, A., Oddo, V. Addressing child hunger and obesity in Indian Country: Report to Congress. Alexandria, VA: Gordon, A., & Oddo, V.
7. Gundersen, C. (2008). Measuring the extent, depth, and severity of food insecurity: An application to American Indians in the United States. Journal of Population Economics, 21(1), 191-215.
8. United States Department of Agriculture, Economic Research Service. (2017). Household food security in the United States in 2016. Washington, D.C.: Coleman-Jensen, A., Rabbitt, M. P., Gregory, C. A., & Singh, A.
9. United States Department of Agriculture, Economic Research Service. (2017). Statistical supplement to household food security in the United States in 2016. Washington: D.C.: Coleman-Jensen, A., Rabbitt, M., Gregory, C., & Singh, A.
Child Food Insecurity1. United States Department of Agriculture, Economic Research Service. (2017). Household food security in the United States in
2016. Washington, D.C.: Coleman-Jensen, A., Rabbitt, M. P., Gregory, C. A., & Singh, A.
2. Coleman-Jensen, A., McFall, W., & Nord, M. Food insecurity in households with children: Prevalence, severity and household characteristics, 2010 -2011, EIB-113, U.S. Department of Agriculture, Economic Research Service, May 2013.
3. Laraia, B. A., Siega-Riz, A., & Gundersen, C. (2010). Household food insecurity is associated with self-reported pregravid weight status, gestational weight gain and pregnancy complications. Journal of the American Dietetic Association, 110(5), 692-701.
4. Robert Wood Johnson Foundation. (2018). 2018 county health rankings.
5. Kirkpatrick, S. I., McIntyre, L., & Potestio, M. L. (2010). Child hunger and long-term adverse consequences for health. Archive of Pediatric Adolescent Medicine, 164(8), 754-762.
6. Eicher-Miller, H. A., Mason, A. C., Weaver, C. M., McCabe, G. P., & Boushey, C. J. (2009). Food insecurity is associated with iron deficiency anemia in US adolescents. American Journal of Clinical Nutrition, 90(5), 1358-1371.
7. Skalicky, A., Meyers, A. F., Adams, W. G., Yang, Z., Cook, J. T., & Frank, D. A. (2006). Child food insecurity and iron deficiency anemia in low-income infants and toddlers in the United States. Maternal and Child Health Journal, 10(2), 177-185.
8. Muirhead, V., Quiñonez, C., Figueiredo, R., & Locker, D. (2009). Oral health disparities and food insecurity in working poor Canadians. Community Dentistry and Oral Epidemiology, 37(4), 294-304.
9. Cook, P. H., Frank, D. A., Leveson, S. M., Neault, N. B., Heeren, T. C., Black, M. M., Berkowitz, C., Casey, P. H., Meyers, A. F., Cutts, D. B., & Chilton, M. (2006). Child food insecurity increases risks posed by household food insecurity to young children’s health. Journal of Nutrition, 136(4), 1073-1076.
10. Casey, P. H., Szeto, K. L., Robbins, J. M., Stuff, J. E., Connell, C., Gossett, J. M., & Simpson, P. M. (2005). Child health-related quality of life and household food security. Archives Pediatric and Adolescent Medicine, 15, 51-56.
11. Jyoti, D.F., Frongillo, E.A., & Jones, S.J. (2005). Food insecurity affects school children’s academic performance, weight gain, and social skills. Journal of Nutrition, 135(12), 2831-9.
12. Slack, K.S., & Yoo, J. (2005). Food hardship and child behavior problems among low-income children. Social Service Review, 75, 511–536.
13. Whitaker, R. C., Phillips, S. M., & Orzol, S. (2006). Food insecurity and the risks of depression and anxiety in mothers and behavior problems in their pre-school-aged children. Pediatrics, 118, e859–e868.
14. Slopen, N., Fitzmaurice, G., Williams, D. R., & Gilman, S. E. (2010). Poverty, food insecurity, and the behavior of childhood internalizing and externalizing disorders. Journal of the American Academy of Child and Adolescent Psychiatry, 49, 444-452.
15. United States Department of Agriculture. (2018) Child Nutrition Tables.
16. U.S. Department of Agriculture, Food and Nutrition Service, Office of Policy Support. (2017). Characteristics of Supplemental Nutrition Assistance Program Households: Fiscal Year 2016. Alexandria, V.A.: Sarah Lauffer & Jenny Genser.
17. Rosenbaum, D. (2013). SNAP is effective and efficient. Center on Budget and Policy Priorities.
18. United States Department of Agriculture, Food and Nutrition Service (2018). WIC program participation and costs.
19. United States Department of Agriculture, Economic Research Service. (2017). Household food security in the United States in 2016. Washington, D.C.: Coleman-Jensen, A., Rabbitt, M. P., Gregory, C. A., & Singh, A.
Food Price Variation
1. United States Department of Agriculture, Economic Research Service. (2014). Prevalence of U.S. food insecurity is related to changes in unemployment, inflation, and the price of food. Washington, D.C.: Nord, M., Coleman-Jensen, A., & Gregory, C.
2. United States Department of Agriculture, Economic Research Service. (2017). Consumers paid less for grocery store foods in 2016 than in 2015. Kuhns, A. & Levin, D.
3. United States Department of Agriculture, Economic Research Service. (2018). Summary findings: Food price outlook, 2018. Kuhns, A. & Levin, D.
4. United States Department of Agriculture, Economic Research Service. (2017). Official USDA food plans: Cost of food at home at four levels, U.S. average, September 2016.United States Department of Agriculture, Economic Research Service. (2017).
5. Bureau of Labor Statistics. (2017).
6. United States Census Bureau. (2017). 2016 ACS 5-year estimates.
7. United States Department of Agriculture Food and Nutrition Service. (2018). Supplemental Nutrition Assistance Program (SNAP) Participation and Costs, 1969-2017.
8. United States Department of Agriculture Food and Nutrition Service. (2018). Supplemental Nutrition Assistance Program (SNAP) participation and costs, 1969-2017.
9. Gundersen, C., Kreider, B. & Pepper, J. V. (2017). Partial identification methods for evaluating food assistance programs: A case study of the causal impact of SNAP on food insecurity. American Journal of Agricultural Economics, 99(1), 875–93.
10. Gundersen, Craig, Brent Kreider, and John V. Pepper. (2018). Reconstructing the Supplemental Nutrition Assistance Program to More Effectively Alleviate Food Insecurity in the United States. Russell Sage Foundation Journal for Social Sciences, 4(2): 113–20.
11. Gundersen, C., Kreider, B. & Pepper, J. V. (2018). Reconstructing the Supplemental Nutrition Assistance Program to more effectively alleviate food insecurity in the United States. Russell Sage Foundation Journal for Social Sciences, 4(2): 113–20.
Health Implications of Food Insecurity1. Seligman, H. K. and Schillinger, D. (2010). Hunger and socioeconomic disparities in chronic disease. The New England Journal of
Medicine, 363(1), 6-9.
2. Bhattacharya, J., Currie, J., & Haider, S. (2004). Poverty, food insecurity, and nutritional outcomes in children and adults. Journal of Health Economics, 23(4), 839–862.
3. Seligman, H. K. Bindman, A. B., Vittinghoff, E., Kanaya, A. M., & Kushel, M. B. (2007). Food insecurity is associated with diabetes mellitus: Results from the National Health Examination and Nutrition Examination Survey (NHANES) 1999–2002. Journal of General Internal Medicine, 22(7), 1018–1023.
4. American Diabetes Association. (2013). Economic costs of diabetes in the U.S. in 2012. Diabetes Care, 36(4), 1033-46.
5. Hunger in America 2014 asked about diabetes in its survey of people receiving food assistance, but it did not specifically ask if the member of the household had Type 1, Type 2, or some other kind.
6. Feeding America. (2014). Hunger in America 2014: National report.
7. United States Census Bureau. (2017). The supplemental poverty measure: 2016. Washington, D.C.: Liana, F.
8. Kushel, M. B., Gupta, R., Gee, L., & Haas, J. S. (2006). Housing instability and food insecurity as barriers to health care among low-income Americans. Journal of General Internal Medicine, 21(1), 71-77.
9. Hwang, S. W. (2001). Homelessness and health. Canadian Medical Association Journal, 164(2), 229-233.
10. U.S. Department of Agriculture, Food and Nutrition Service. (2013). Supplemental Nutrition Assistance Program education and evaluation study (Wave II). Prepared by Altarum Institute.
11. Seligman, H. K., Lyles, C., Marshall, M. B., Prendergast, K., Smith, M. C., Headings, A., Bradshaw, G., Rosenmoss, S., & Waxman, E. (2015). A pilot food bank intervention featuring diabetes-appropriate food improved glycemic control among clients in three states. Health Affairs, 34(11).
12. Feeding America and Cornell University. (2016). The power of nudges: Making the healthy choice the easy choice in food pantries.
13. American Academy of Pediatrics. (2015) Promoting food security for all children.
Recommended