ORNL is managed by UT-Battelle for the US Department of Energy
Forecasting Water Quality & Biodiversity
US Department of Energy (DOE) Bioenergy Technologies Office (BETO) 2017 Project Peer Review
March 6, 2017
Cross-cutting Sustainability Platform
Principal Investigator: Dr. Henriette Jager, Oak Ridge National Laboratory
This presentation does not contain any proprietary, confidential, or otherwise restricted information
2 Forecasting Water Quality and Biodiversity
Goal Statement
What: Illuminate paths leading toward co-production of 1) biomass, 2) clean water, and 3) utility derived from biodiversity Why: Society needs renewable energy and clean water and ecosystem goods & services1 derived from wildlife. How: Develop models linking choice and management of biomass feedstocks to consequences for wildlife and downstream water quality at different spatial scales. Use these to guide implementation of sustainable bioenergy systems.
1Benefits or economic utility provided to society, some of which can be assigned monetary value through markets
3 Forecasting Water Quality and Biodiversity
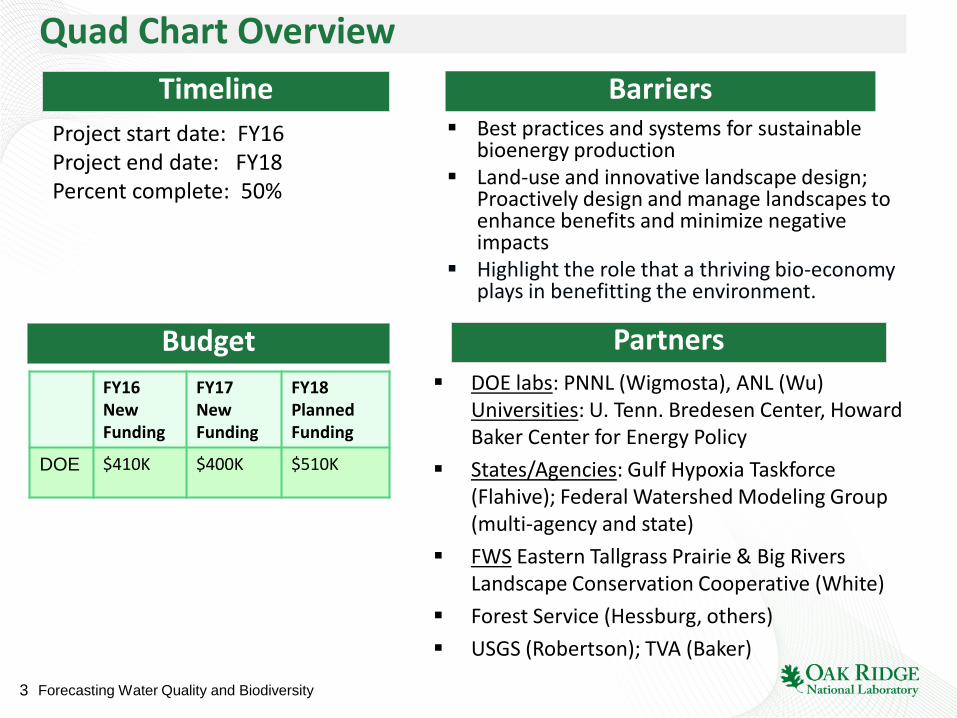
Quad Chart Overview Timeline
Budget
Barriers
Partners
Project start date: FY16 Project end date: FY18 Percent complete: 50%
DOE labs: PNNL (Wigmosta), ANL (Wu) Universities: U. Tenn. Bredesen Center, Howard Baker Center for Energy Policy
States/Agencies: Gulf Hypoxia Taskforce (Flahive); Federal Watershed Modeling Group (multi-agency and state)
FWS Eastern Tallgrass Prairie & Big Rivers Landscape Conservation Cooperative (White)
Forest Service (Hessburg, others) USGS (Robertson); TVA (Baker)
Best practices and systems for sustainable bioenergy production
Land-use and innovative landscape design; Proactively design and manage landscapes to enhance benefits and minimize negative impacts
Highlight the role that a thriving bio-economy plays in benefitting the environment.
FY16 New Funding
FY17 New Funding
FY18 Planned Funding
DOE $410K $400K $510K
4 Forecasting Water Quality and Biodiversity
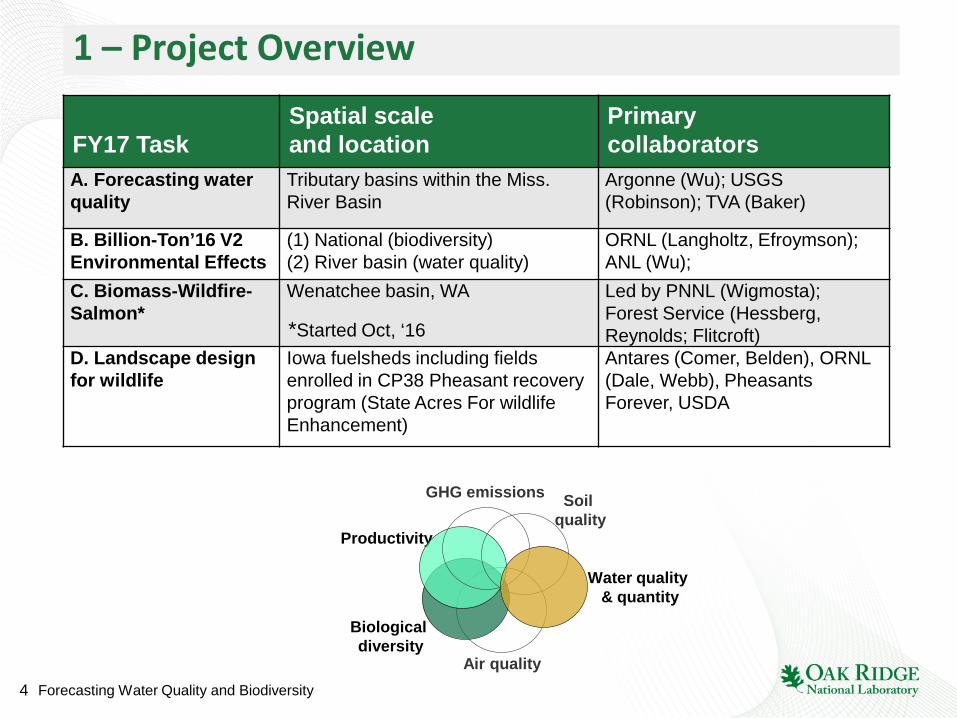
1 – Project Overview
FY17 Task
Spatial scale and location
Primary collaborators
A. Forecasting water quality
Tributary basins within the Miss. River Basin
Argonne (Wu); USGS (Robinson); TVA (Baker)
B. Billion-Ton’16 V2 Environmental Effects
(1) National (biodiversity) (2) River basin (water quality)
ORNL (Langholtz, Efroymson); ANL (Wu);
C. Biomass-Wildfire-Salmon*
Wenatchee basin, WA Led by PNNL (Wigmosta); Forest Service (Hessberg, Reynolds; Flitcroft)
D. Landscape design for wildlife
Iowa fuelsheds including fields enrolled in CP38 Pheasant recovery program (State Acres For wildlife Enhancement)
Antares (Comer, Belden), ORNL (Dale, Webb), Pheasants Forever, USDA
GHG emissions Soil quality
Air quality
Biological diversity
Productivity
Water quality & quantity
*Started Oct, ‘16
5 Forecasting Water Quality and Biodiversity
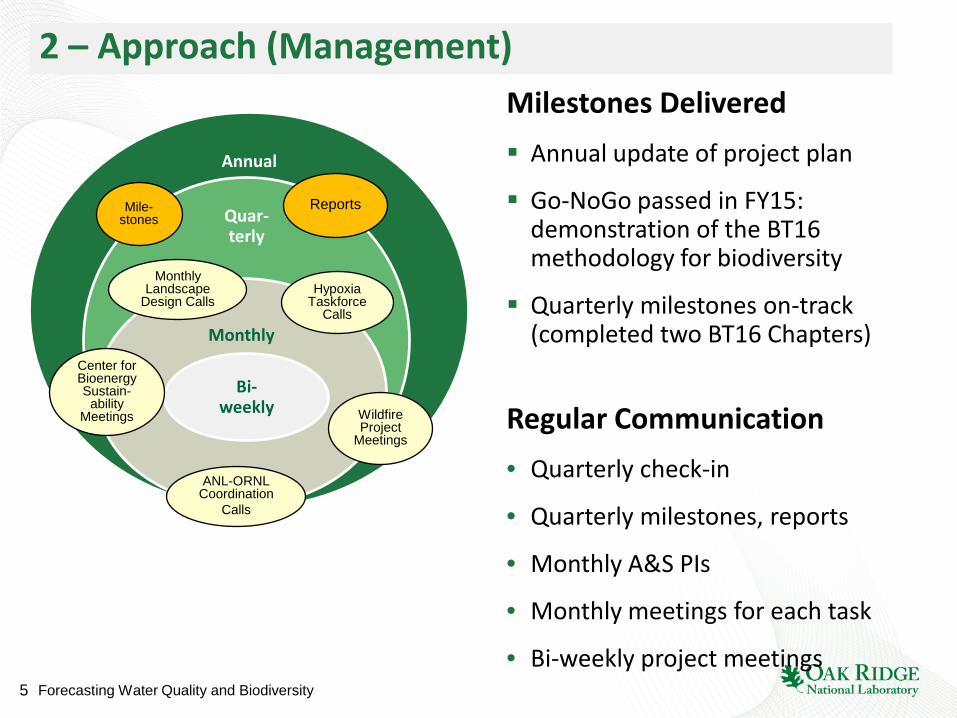
2 – Approach (Management) Milestones Delivered Annual update of project plan
Go-NoGo passed in FY15: demonstration of the BT16 methodology for biodiversity
Quarterly milestones on-track (completed two BT16 Chapters)
Regular Communication • Quarterly check-in
• Quarterly milestones, reports
• Monthly A&S PIs
• Monthly meetings for each task
• Bi-weekly project meetings
Annual
Quar-terly
Monthly
Bi-weekly
Hypoxia Taskforce
Calls
Monthly Landscape
Design Calls
Center for Bioenergy Sustain-
ability Meetings Wildfire
Project Meetings
ANL-ORNL Coordination
Calls
Mile-stones
Reports
6 Forecasting Water Quality and Biodiversity
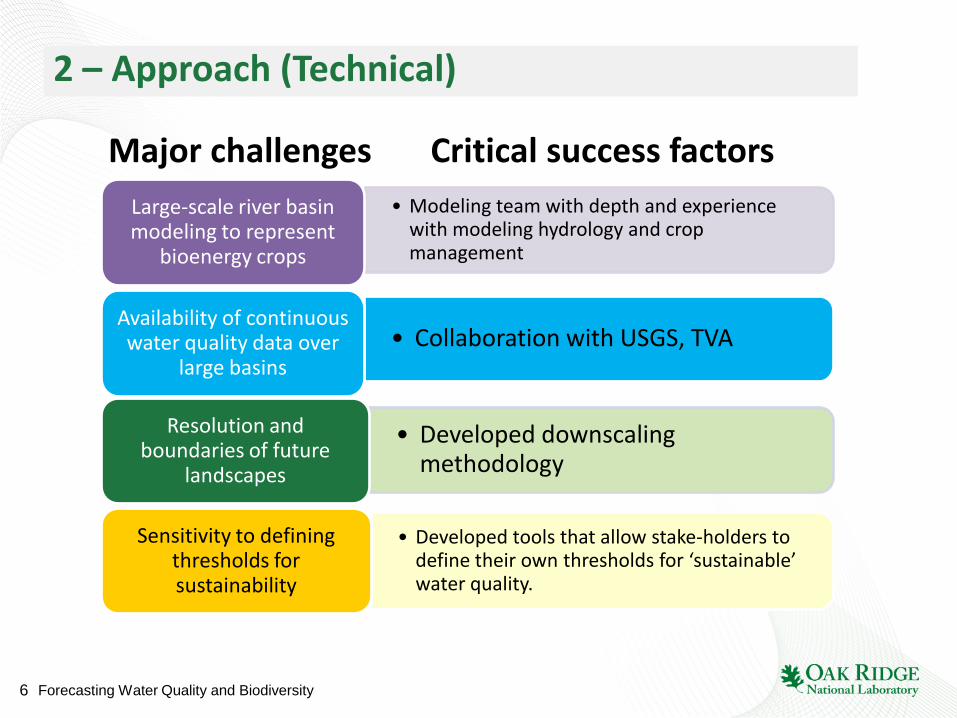
2 – Approach (Technical)
Major challenges Critical success factors • Modeling team with depth and experience
with modeling hydrology and crop management
Large-scale river basin modeling to represent
bioenergy crops
• Collaboration with USGS, TVA Availability of continuous water quality data over
large basins
• Developed downscaling methodology
Resolution and boundaries of future
landscapes
• Developed tools that allow stake-holders to define their own thresholds for ‘sustainable’ water quality.
Sensitivity to defining thresholds for sustainability
7 Forecasting Water Quality and Biodiversity
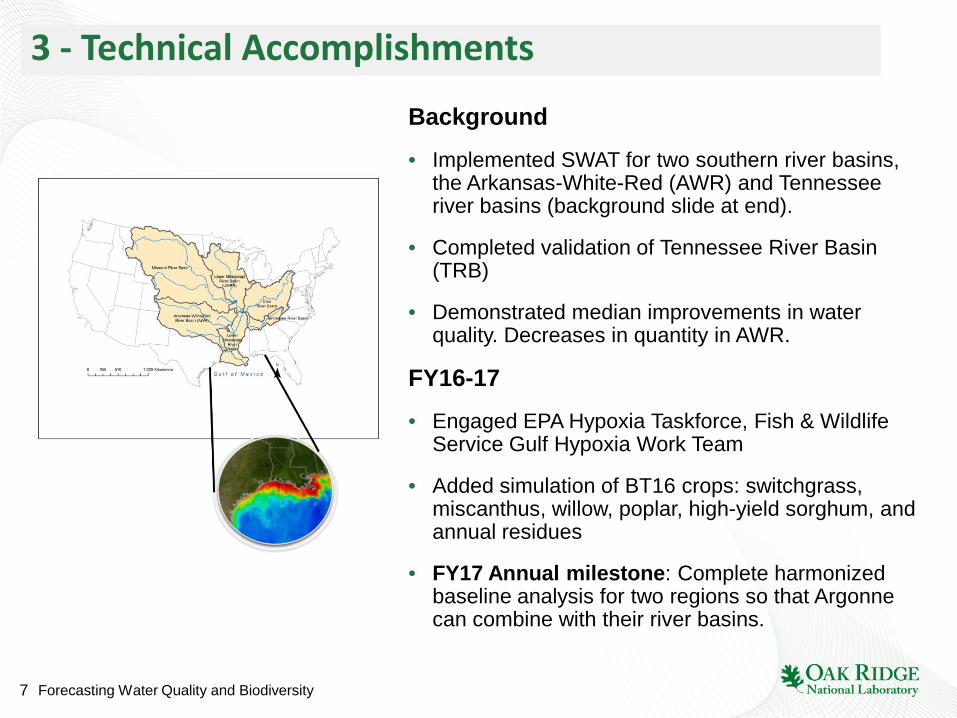
3 - Technical Accomplishments
Background
• Implemented SWAT for two southern river basins, the Arkansas-White-Red (AWR) and Tennessee river basins (background slide at end).
• Completed validation of Tennessee River Basin (TRB)
• Demonstrated median improvements in water quality. Decreases in quantity in AWR.
FY16-17
• Engaged EPA Hypoxia Taskforce, Fish & Wildlife Service Gulf Hypoxia Work Team
• Added simulation of BT16 crops: switchgrass, miscanthus, willow, poplar, high-yield sorghum, and annual residues
• FY17 Annual milestone: Complete harmonized baseline analysis for two regions so that Argonne can combine with their river basins.
8 Forecasting Water Quality and Biodiversity
3 - Technical Accomplishments
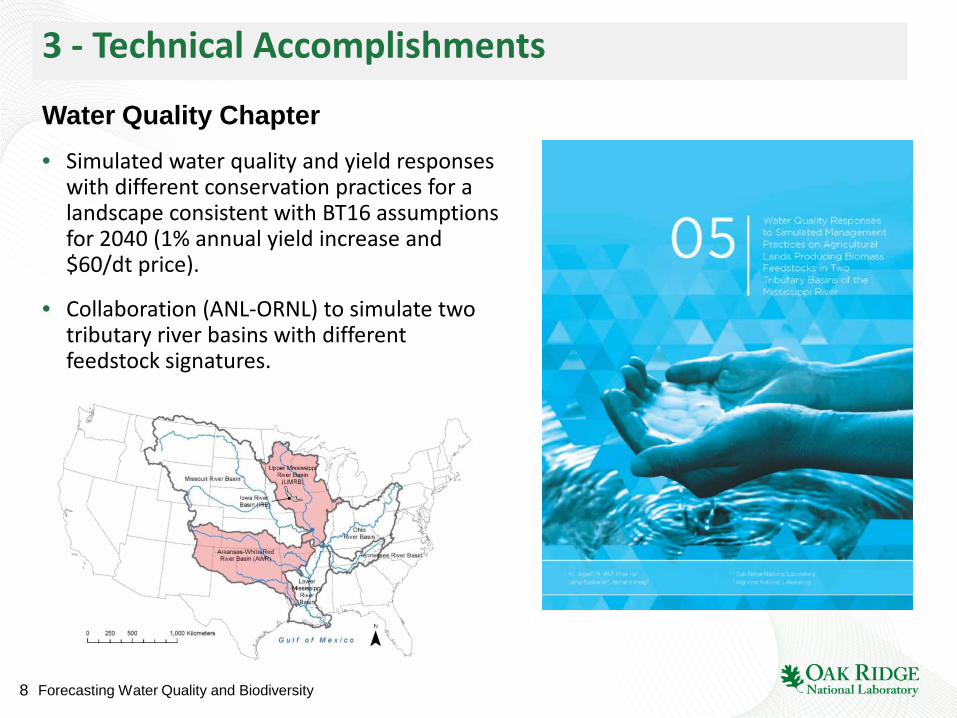
Water Quality Chapter • Simulated water quality and yield responses
with different conservation practices for a landscape consistent with BT16 assumptions for 2040 (1% annual yield increase and $60/dt price).
• Collaboration (ANL-ORNL) to simulate two tributary river basins with different feedstock signatures.
9 Forecasting Water Quality and Biodiversity
3 - Technical Accomplishments
• Created webinars for both the water quality and biodiversity chapters that provide more detail.
• Created visualization tools, especially for water quality, to allow users to explore the simulated data showing how different management practices influence trade-offs between loadings and yield.
Key Results – Benefits from filter strips and buffers were demonstrated (highlighted a
need for research on sustainable harvest of buffers). – Tile drainage provided no benefit on lands > 1% slope. – No-till reduced TP and TSS but not nitrate.
10 Forecasting Water Quality and Biodiversity
3 - Technical Accomplishments
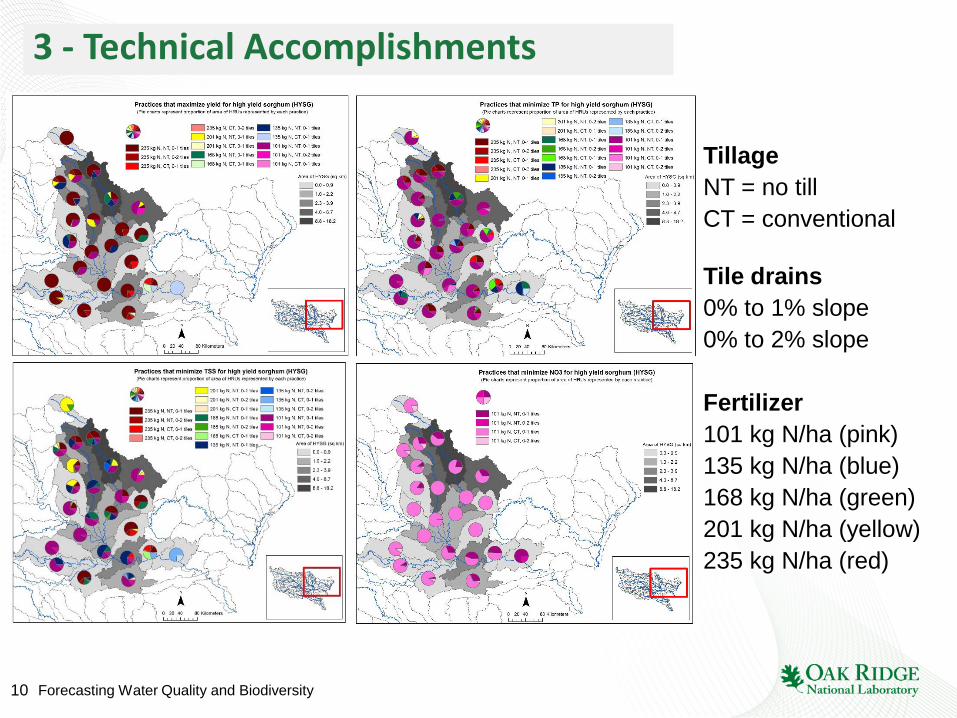
Tillage NT = no till CT = conventional Tile drains 0% to 1% slope 0% to 2% slope
Fertilizer 101 kg N/ha (pink) 135 kg N/ha (blue) 168 kg N/ha (green) 201 kg N/ha (yellow) 235 kg N/ha (red)
11 Forecasting Water Quality and Biodiversity
3 - Technical Accomplishments
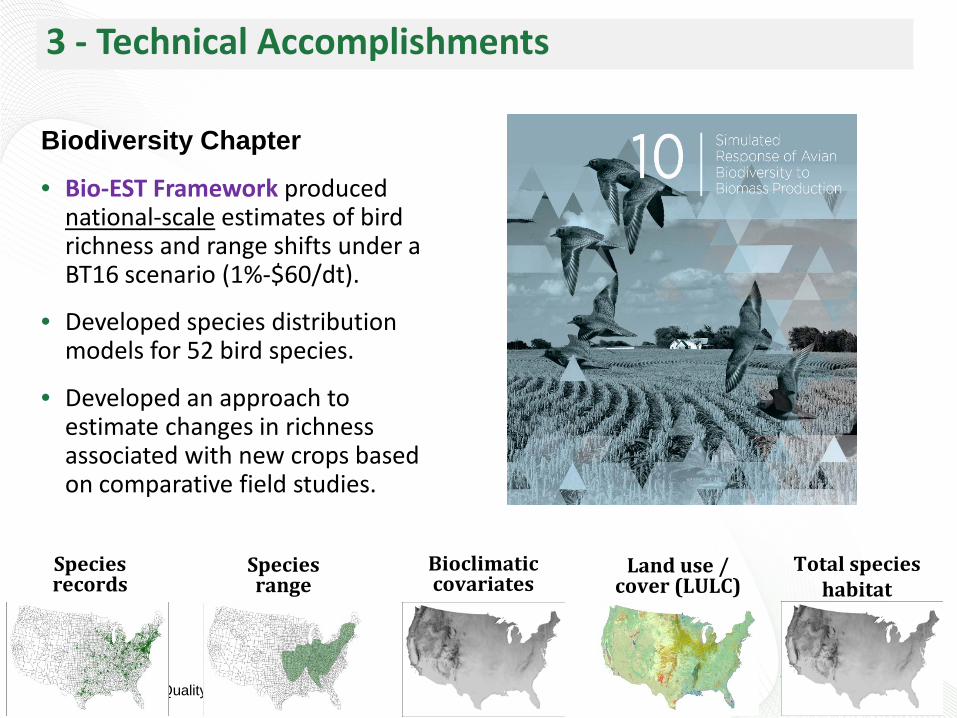
Biodiversity Chapter
• Bio-EST Framework produced national-scale estimates of bird richness and range shifts under a BT16 scenario (1%-$60/dt).
• Developed species distribution models for 52 bird species.
• Developed an approach to estimate changes in richness associated with new crops based on comparative field studies.
Species records
Bioclimatic covariates
Species range
Total species habitat
Land use / cover (LULC)
12 Forecasting Water Quality and Biodiversity
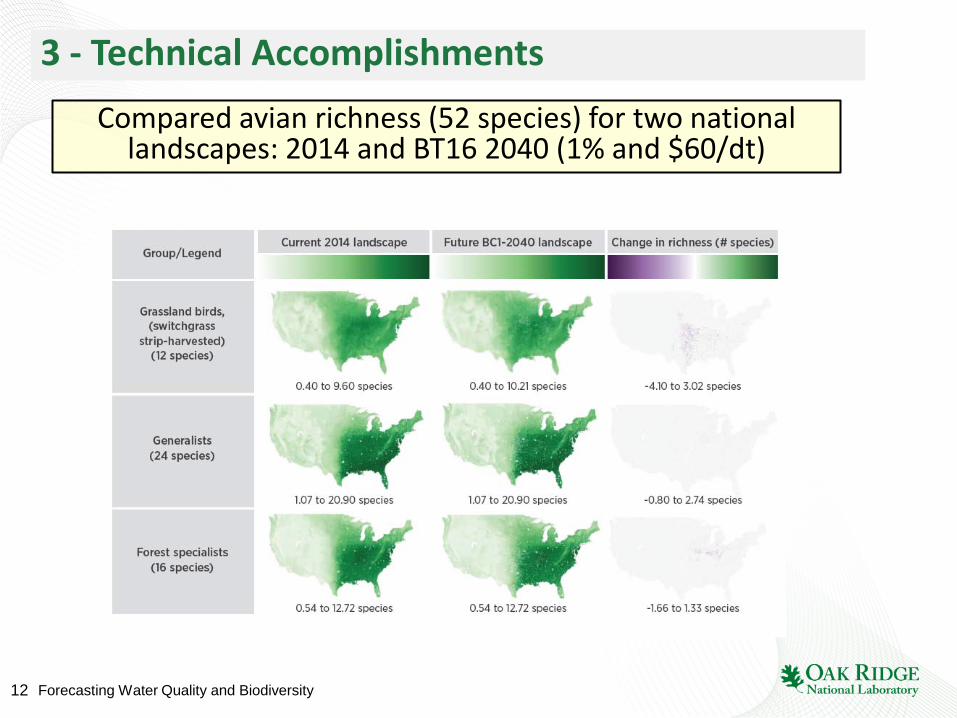
3 - Technical Accomplishments Compared avian richness (52 species) for two national
landscapes: 2014 and BT16 2040 (1% and $60/dt)
13 Forecasting Water Quality and Biodiversity
• Task C Billion Ton 201
• 6
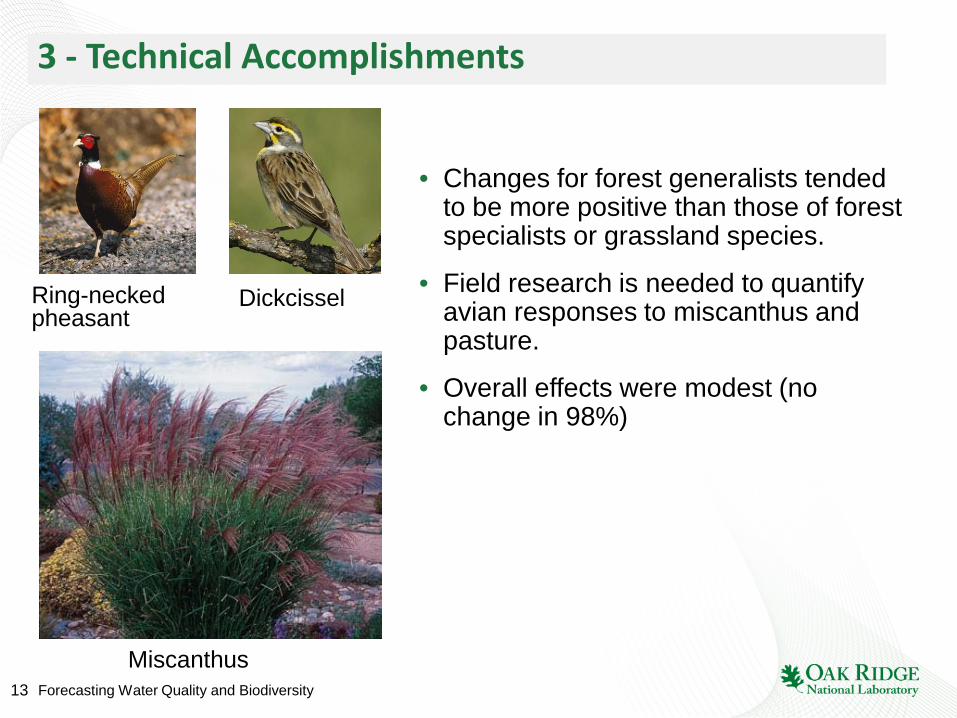
• Changes for forest generalists tended to be more positive than those of forest specialists or grassland species.
• Field research is needed to quantify avian responses to miscanthus and pasture.
• Overall effects were modest (no change in 98%)
Ring-necked pheasant
Dickcissel
Miscanthus
3 - Technical Accomplishments
14 Forecasting Water Quality and Biodiversity
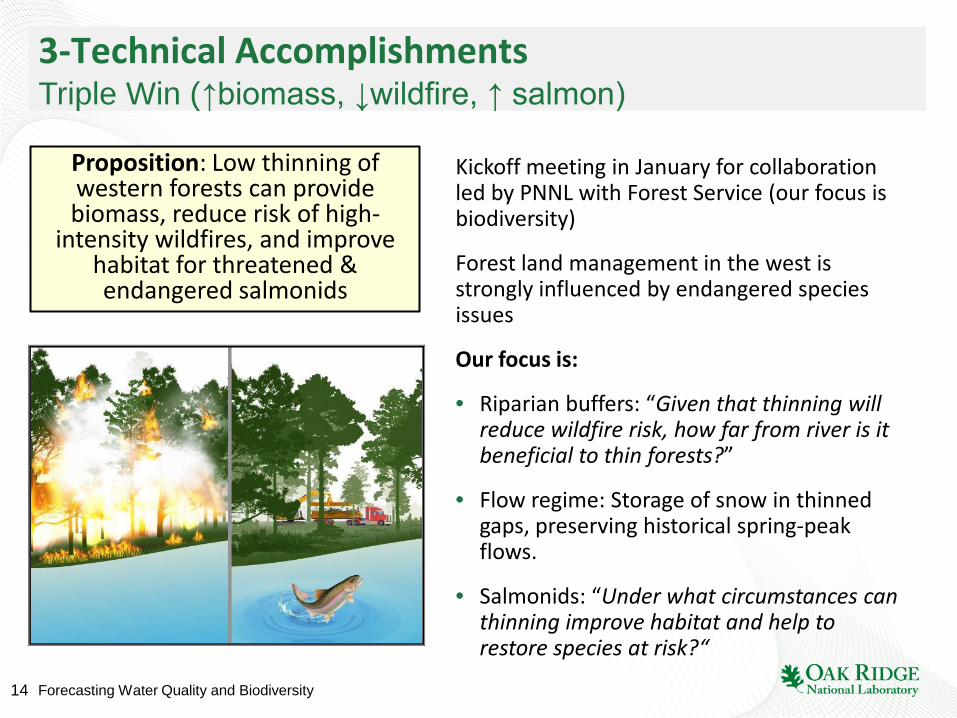
3-Technical Accomplishments Triple Win (↑biomass, ↓wildfire, ↑ salmon)
Kickoff meeting in January for collaboration led by PNNL with Forest Service (our focus is biodiversity)
Forest land management in the west is strongly influenced by endangered species issues
Our focus is:
• Riparian buffers: “Given that thinning will reduce wildfire risk, how far from river is it beneficial to thin forests?”
• Flow regime: Storage of snow in thinned gaps, preserving historical spring-peak flows.
• Salmonids: “Under what circumstances can thinning improve habitat and help to restore species at risk?“
Proposition: Low thinning of western forests can provide biomass, reduce risk of high-
intensity wildfires, and improve habitat for threatened & endangered salmonids
15 Forecasting Water Quality and Biodiversity
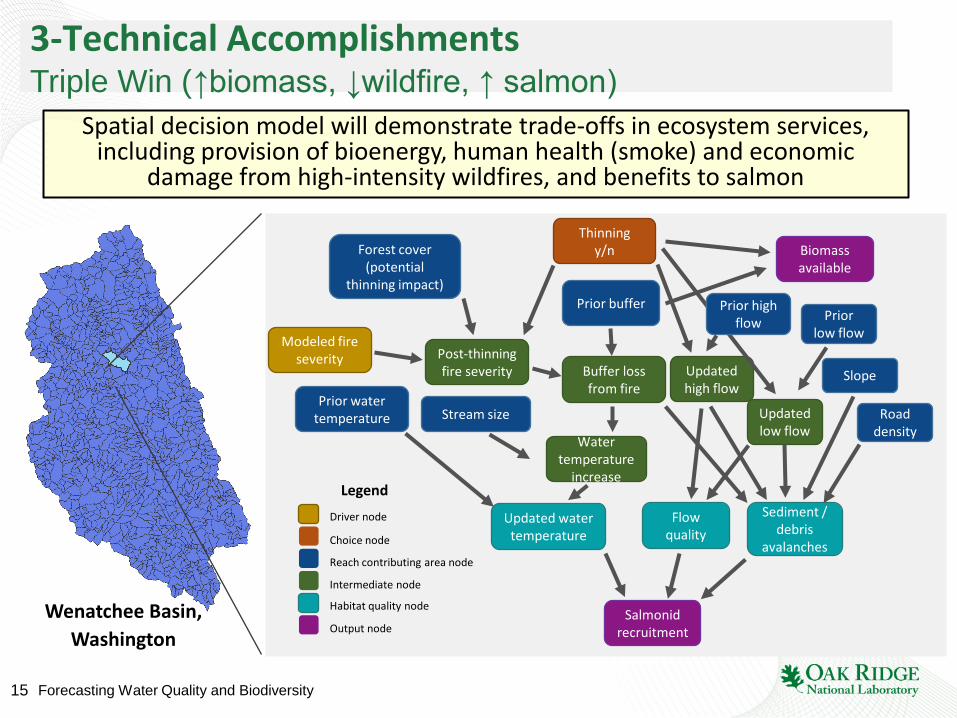
3-Technical Accomplishments Triple Win (↑biomass, ↓wildfire, ↑ salmon)
Salmonid recruitment
Updated water temperature
Prior water temperature
Water temperature
increase
Stream size
Buffer loss from fire
Post-thinning fire severity
Modeled fire severity
Forest cover (potential
thinning impact)
Thinning y/n
Prior buffer
Biomass available
Sediment / debris
avalanches
Flow quality
Slope
Road density
Updated low flow
Updated high flow
Choice node
Intermediate node
Output node
Legend
Driver node
Reach contributing area node
Prior high flow Prior
low flow
Habitat quality node Wenatchee Basin, Washington
Spatial decision model will demonstrate trade-offs in ecosystem services, including provision of bioenergy, human health (smoke) and economic
damage from high-intensity wildfires, and benefits to salmon
16 Forecasting Water Quality and Biodiversity
3-Technical Accomplishments
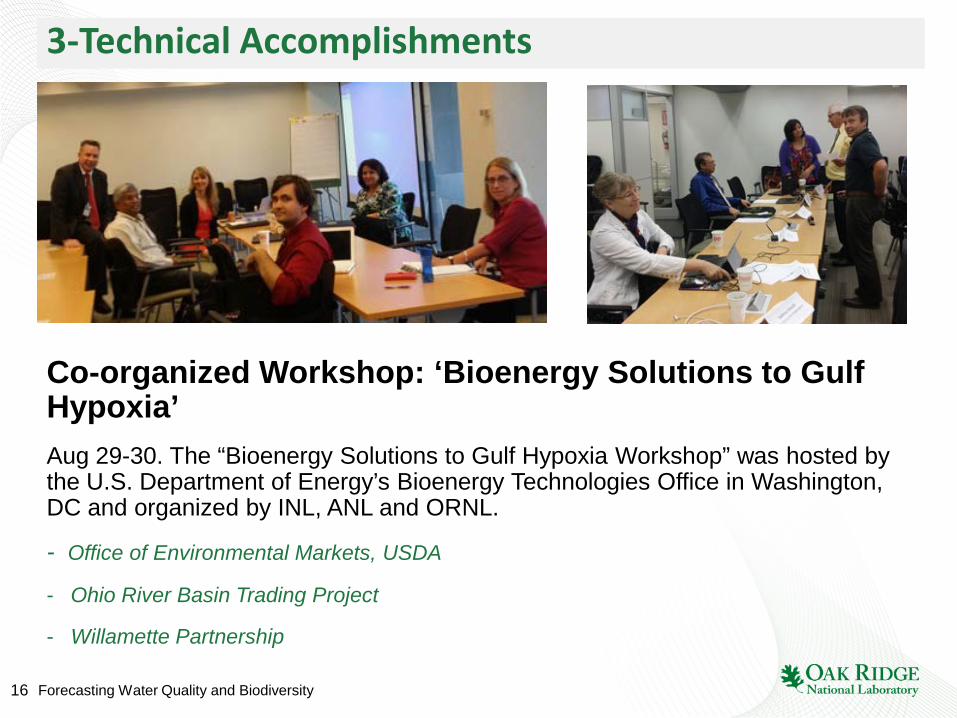
Co-organized Workshop: ‘Bioenergy Solutions to Gulf Hypoxia’ Aug 29-30. The “Bioenergy Solutions to Gulf Hypoxia Workshop” was hosted by the U.S. Department of Energy’s Bioenergy Technologies Office in Washington, DC and organized by INL, ANL and ORNL.
- Office of Environmental Markets, USDA
- Ohio River Basin Trading Project
- Willamette Partnership
17 Forecasting Water Quality and Biodiversity
3-Technical Accomplishments
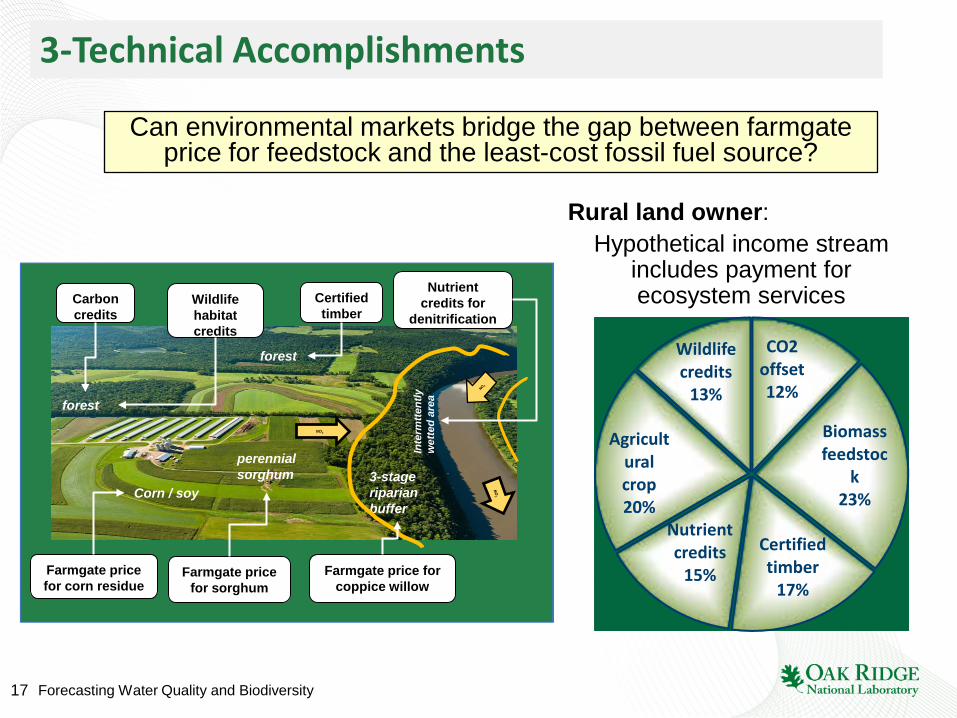
Can environmental markets bridge the gap between farmgate price for feedstock and the least-cost fossil fuel source?
CO2 offset 12%
Biomass feedstoc
k 23%
Certified timber
17%
Nutrient credits
15%
Agricultural crop 20%
Wildlife credits
13%
Carbon credits
Farmgate price for sorghum
forest
3-stage riparian buffer
perennial sorghum
Certified timber
Wildlife habitat credits
Inte
rmtte
ntly
w
ette
d ar
ea
forest
NO3
Farmgate price for coppice willow
Nutrient credits for
denitrification
Corn / soy
Farmgate price for corn residue
Rural land owner: Hypothetical income stream
includes payment for ecosystem services
18 Forecasting Water Quality and Biodiversity
4 - Next Steps
• Complete joint SWAT-MARB assessment with Argonne to quantify bioenergy influences on nutrient exports and the Dead zone.*
• Jointly implement decision support for thinning of Western forest to promote biofuel and salmon production with PNNL, Forest Service. FY17 Q3 milestone: Causal diagram of relationships between salmonids & flow, temp., debris avalanches, which will be mediated by wildfire.
• Landscape design guidelines for water quality and biodiversity (two manuscripts), including trait-based guidance.
• Meet milestones on modeling to evaluate designs for USDA lands designated to recover pheasants (CP38).*
• Disseminate augmented results from BT16-V2 chapters via publication.
• Advance the development of ‘Sustainable’ Feedstock Supply Curves and contribute to a joint publication (next slide).* A webinar on this tool will be available soon.
*More detail provided in later slides
19 Forecasting Water Quality and Biodiversity
4 - Next Steps
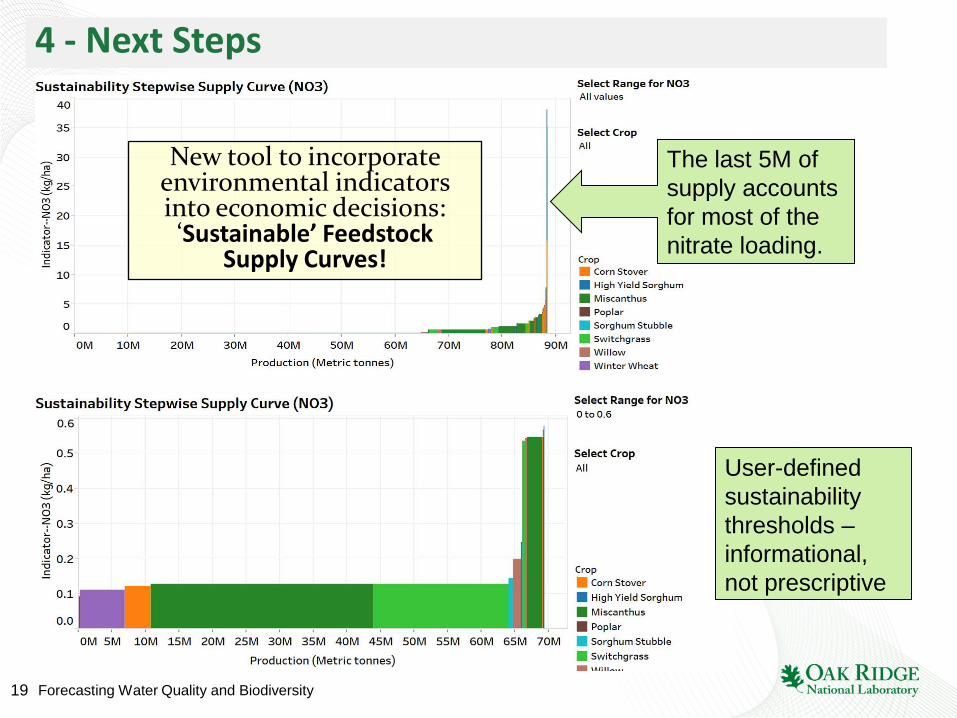
New tool to incorporate environmental indicators into economic decisions: ‘Sustainable’ Feedstock
Supply Curves!
User-defined sustainability thresholds – informational, not prescriptive
The last 5M of supply accounts for most of the nitrate loading.
20 Forecasting Water Quality and Biodiversity
4 - Next Steps
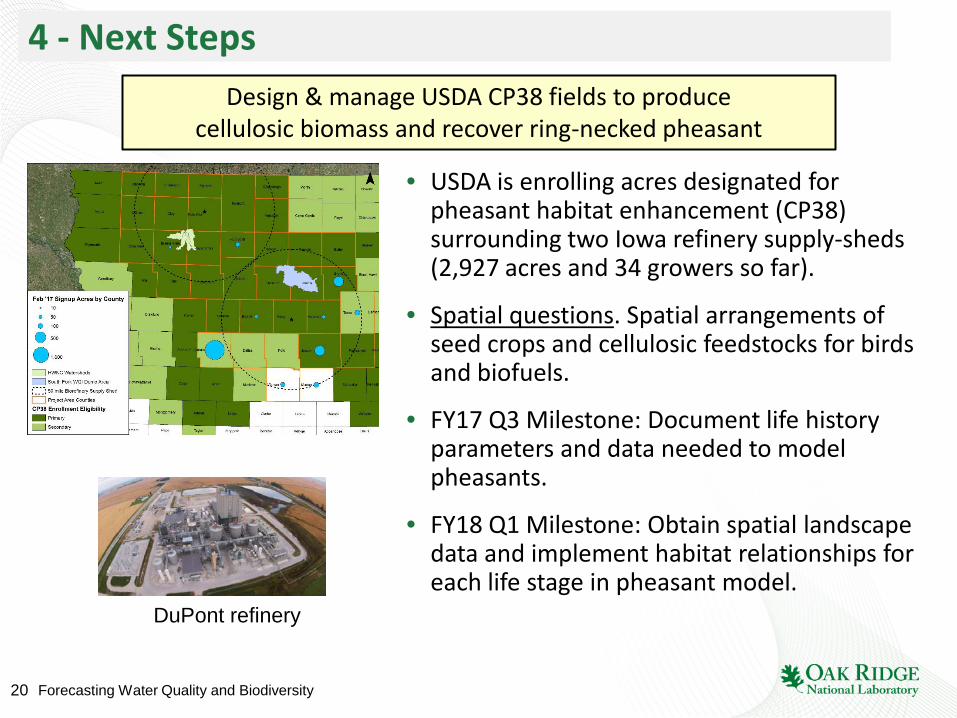
• USDA is enrolling acres designated for pheasant habitat enhancement (CP38) surrounding two Iowa refinery supply-sheds (2,927 acres and 34 growers so far).
• Spatial questions. Spatial arrangements of seed crops and cellulosic feedstocks for birds and biofuels.
• FY17 Q3 Milestone: Document life history parameters and data needed to model pheasants.
• FY18 Q1 Milestone: Obtain spatial landscape data and implement habitat relationships for each life stage in pheasant model.
Design & manage USDA CP38 fields to produce cellulosic biomass and recover ring-necked pheasant
DuPont refinery
21 Forecasting Water Quality and Biodiversity
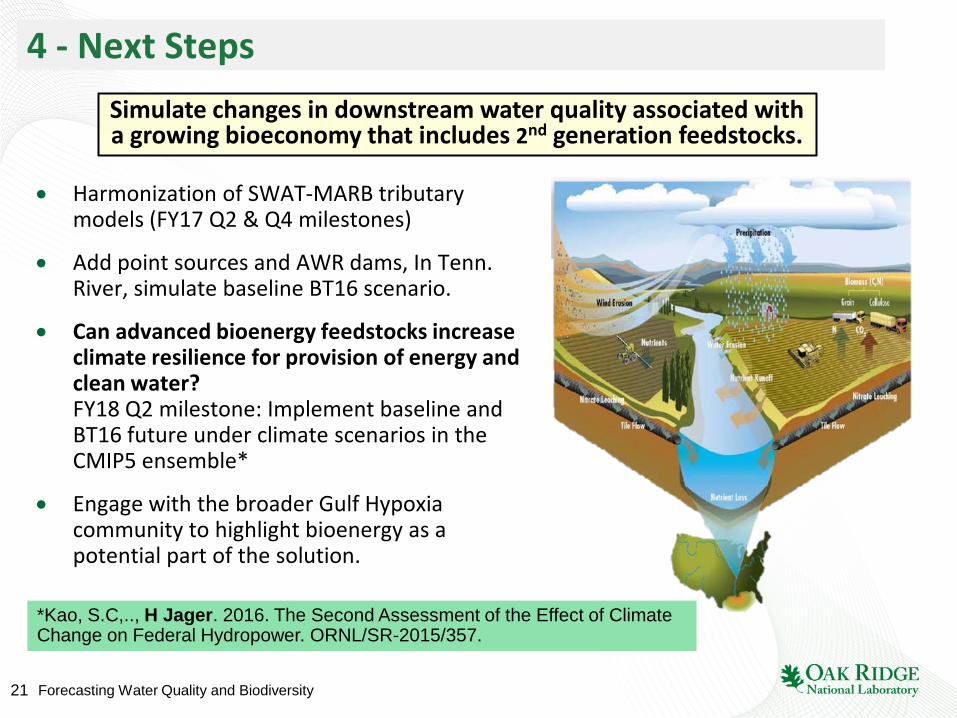
4 - Next Steps Simulate changes in downstream water quality associated with a growing bioeconomy that includes 2nd generation feedstocks.
• Harmonization of SWAT-MARB tributary models (FY17 Q2 & Q4 milestones)
• Add point sources and AWR dams, In Tenn. River, simulate baseline BT16 scenario.
• Can advanced bioenergy feedstocks increase climate resilience for provision of energy and clean water? FY18 Q2 milestone: Implement baseline and BT16 future under climate scenarios in the CMIP5 ensemble*
• Engage with the broader Gulf Hypoxia community to highlight bioenergy as a potential part of the solution.
*Kao, S.C,.., H Jager. 2016. The Second Assessment of the Effect of Climate Change on Federal Hydropower. ORNL/SR-2015/357.
22 Forecasting Water Quality and Biodiversity
5 – Project Relevance
Our project addresses the following BETO MYPP goals: Advance scientific methods and models for measuring and understanding
bioenergy sustainability [across the supply chain]. Develop landscape design approaches that increase bioenergy production
while maintaining or enhancing ecosystem and social benefits. Understand and promote the positive economic and environmental effects
of biofuels production activities and reduce potential negative impacts. Assess current and future environmentally sustainable biomass availability. Increase the volume of sustainable, quality feedstock available. Highlight the role that a thriving bioeconomy plays in benefitting the
environment.
Research to illuminate pathways toward provisioning biomass, clean water, and biodiversity
23 Forecasting Water Quality and Biodiversity
5-Project Relevance
Project addresses the following BETO MYPP goals:
1. Advance scientific methods and models for measuring and understanding bioenergy sustainability [across the supply chain].
• Developed regional-scale modeling methods for understanding trade-offs and complementarities between cellulosic feedstock production and water quality indicators.
• Developed methods for assessing biodiversity endpoints of interest to the public at national scales (Bio-EST)
• Will be developing tools for river-basin scales (BBN salmon), and field/fuel-shed scales (pheasant IBM).
2. Understand and promote the positive economic and environmental effects of biofuels production activities.
• Identified spatial win-win opportunities to improve water quality where cellulosic crop will become economically viable in AWR region, examining Tennessee basin.
• Will conduct research on triple win for thinning forests at severe risk of wildfire.
5 – Project Relevance
24 Forecasting Water Quality and Biodiversity
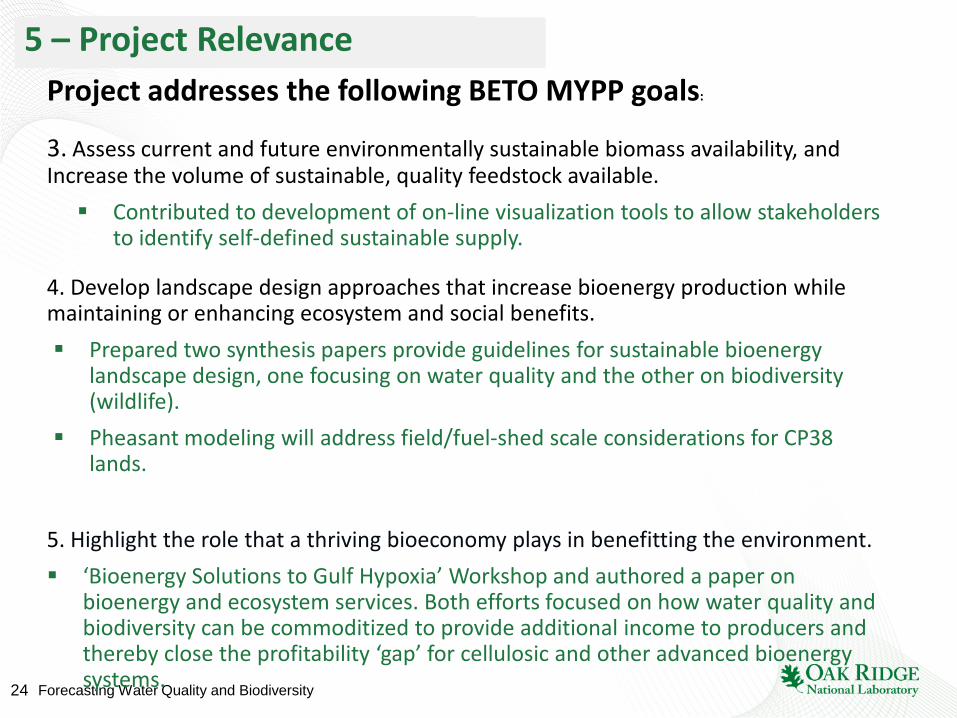
5-Project Relevance Project addresses the following BETO MYPP goals:
3. Assess current and future environmentally sustainable biomass availability, and Increase the volume of sustainable, quality feedstock available. Contributed to development of on-line visualization tools to allow stakeholders
to identify self-defined sustainable supply.
4. Develop landscape design approaches that increase bioenergy production while maintaining or enhancing ecosystem and social benefits. Prepared two synthesis papers provide guidelines for sustainable bioenergy
landscape design, one focusing on water quality and the other on biodiversity (wildlife).
Pheasant modeling will address field/fuel-shed scale considerations for CP38 lands.
5. Highlight the role that a thriving bioeconomy plays in benefitting the environment. ‘Bioenergy Solutions to Gulf Hypoxia’ Workshop and authored a paper on
bioenergy and ecosystem services. Both efforts focused on how water quality and biodiversity can be commoditized to provide additional income to producers and thereby close the profitability ‘gap’ for cellulosic and other advanced bioenergy systems.
5 – Project Relevance
25 Forecasting Water Quality and Biodiversity
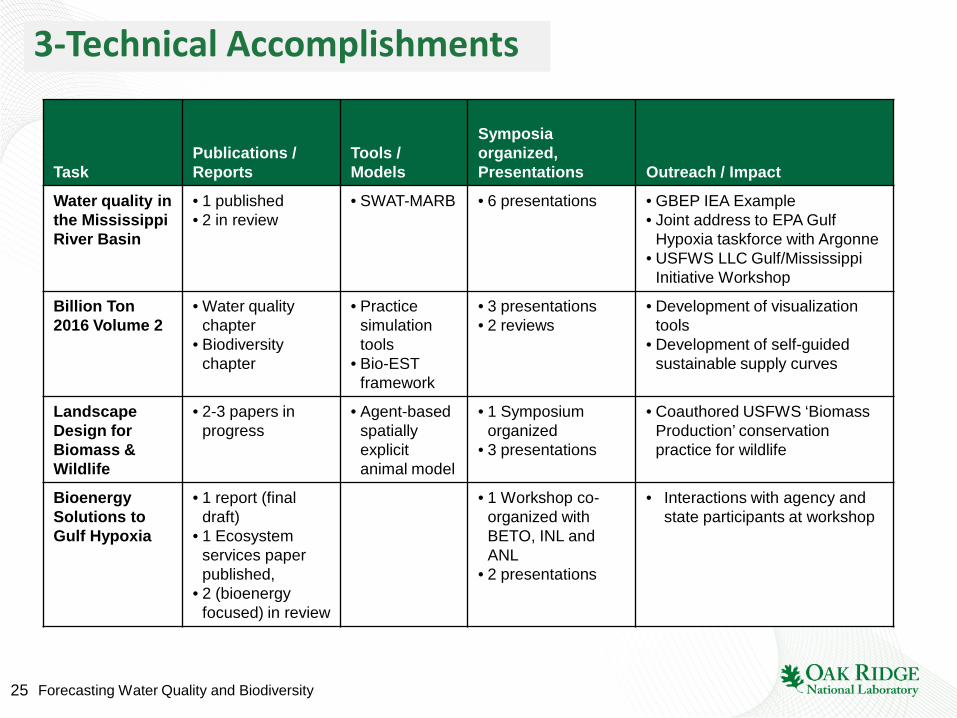
3-Technical Accomplishments
Task
Publications / Reports
Tools / Models
Symposia organized, Presentations
Outreach / Impact
Water quality in the Mississippi River Basin
• 1 published • 2 in review
• SWAT-MARB • 6 presentations • GBEP IEA Example • Joint address to EPA Gulf
Hypoxia taskforce with Argonne • USFWS LLC Gulf/Mississippi
Initiative Workshop
Billion Ton 2016 Volume 2
• Water quality chapter
• Biodiversity chapter
• Practice simulation tools
• Bio-EST framework
• 3 presentations • 2 reviews
• Development of visualization tools
• Development of self-guided sustainable supply curves
Landscape Design for Biomass & Wildlife
• 2-3 papers in progress
• Agent-based spatially explicit animal model
• 1 Symposium organized
• 3 presentations
• Coauthored USFWS ‘Biomass Production’ conservation practice for wildlife
Bioenergy Solutions to Gulf Hypoxia
• 1 report (final draft)
• 1 Ecosystem services paper published,
• 2 (bioenergy focused) in review
• 1 Workshop co-organized with BETO, INL and ANL
• 2 presentations
• Interactions with agency and state participants at workshop
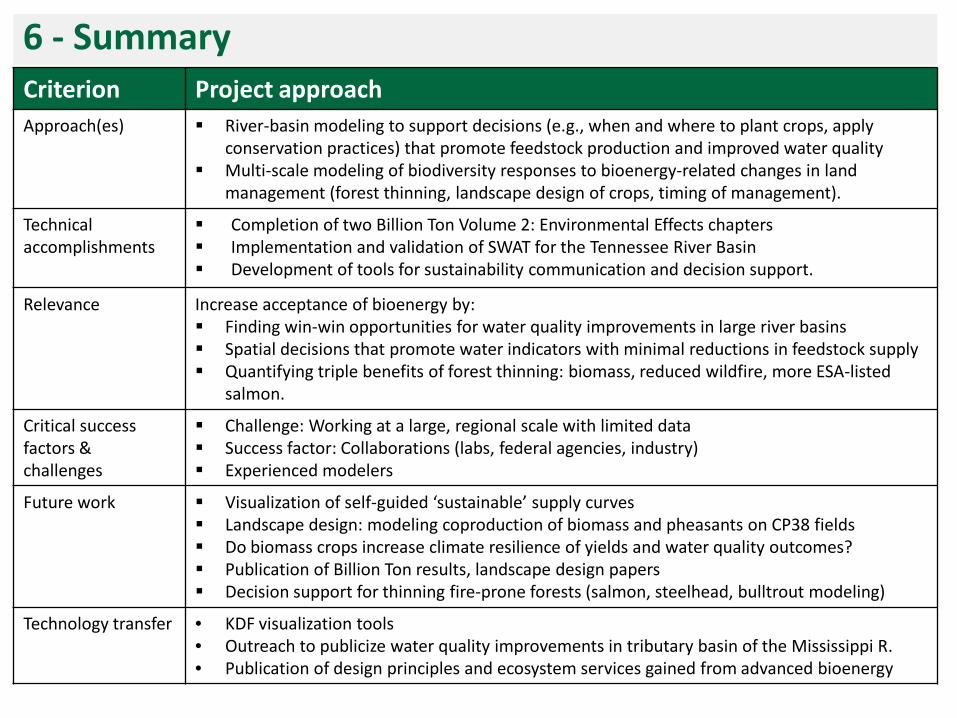
6 - Summary Criterion Project approach Approach(es) River-basin modeling to support decisions (e.g., when and where to plant crops, apply
conservation practices) that promote feedstock production and improved water quality Multi-scale modeling of biodiversity responses to bioenergy-related changes in land
management (forest thinning, landscape design of crops, timing of management).
Technical accomplishments
Completion of two Billion Ton Volume 2: Environmental Effects chapters Implementation and validation of SWAT for the Tennessee River Basin Development of tools for sustainability communication and decision support.
Relevance Increase acceptance of bioenergy by: Finding win-win opportunities for water quality improvements in large river basins Spatial decisions that promote water indicators with minimal reductions in feedstock supply Quantifying triple benefits of forest thinning: biomass, reduced wildfire, more ESA-listed
salmon.
Critical success factors & challenges
Challenge: Working at a large, regional scale with limited data Success factor: Collaborations (labs, federal agencies, industry) Experienced modelers
Future work Visualization of self-guided ‘sustainable’ supply curves Landscape design: modeling coproduction of biomass and pheasants on CP38 fields Do biomass crops increase climate resilience of yields and water quality outcomes? Publication of Billion Ton results, landscape design papers Decision support for thinning fire-prone forests (salmon, steelhead, bulltrout modeling)
Technology transfer • KDF visualization tools • Outreach to publicize water quality improvements in tributary basin of the Mississippi R. • Publication of design principles and ecosystem services gained from advanced bioenergy
Additional Slides
28 Forecasting Water Quality and Biodiversity
Response to reviews
Project Overview
Most-positive comment: “The best of all PIs in terms of clarity of slides, and laying out history, objectives, and context….”
Most-negative comment: “Project history, goals and objectives were covered very quickly. The context for how the project fits into the BETO portfolio were only generally stated.”
Response: We agree that presenting the background, history and context is important, as is understanding how we fit into BETO's strategic vision for informing policy. We have a strong central theme, but the breadth of the project makes it difficult to provide context for every aspect.
Project Approach – 4 out of 5 reviews only positive
Most-positive comments: “The basin-level assessment of water quality impacts that was performed in this project was thorough and produced high quality results.”, “The project has brought together a solid team of modelers with expertise in [several areas]”, “Love the concept of land sparing versus sharing, collaboration to address landscape management…super“, “Pragmatic and focused”, “Good coordination”
Most-negative comment: “Specific technical approach was less clear.”, “lacked clear milestones”
Response: Thank you for appreciating the depth of our modeling expertise and integration with other watershed modeling efforts through regular meetings and joint papers. We should have been clearer that the project uses modeling, not fieldwork. We have made an effort to emphasize milestones in this year’s presentation.
29 Forecasting Water Quality and Biodiversity
Response to reviews
Technical progress and achievements Most-positive comments: ”The basin-level assessment of water quality impacts that was performed in this project was thorough and produced high quality results. This work should provide great value to the BTS.”, “This is an audacious project in terms of its ambitious goals and scope.”,“The hydrology modeling has progressed to where it can inform other watershed efforts to quantify changes in water quality.”,”Analysis identifying optimal fertilization rates is very useful. Field coordination work (e.g., in Iowa) is very valuable.”,”Several key accomplishments included documenting how bioenergy crops influence wildlife and identifying positive wildlife management practices.”
Most-negative comment: Further investigation / explanation into the reason for forecast differences between the AWR and TRB (e.g., water yield, N03) is needed.
Response:. Thank you for appreciating the value of our research on water quality benefits of perennial bioenergy crops in two large river basins. The differences that we observed between the two regions will be explored further through harmon-ization, which is next on our agenda now that the BT16 is mostly in the rear-view mirror. The biodiversity/wildlife work is a new effort initiated this FY. We will develop this more fully, as suggested through the collaborative Antares and wildfire tasks.
30 Forecasting Water Quality and Biodiversity
Project relevance Most-positive comments: “The thorough basin-level assessment of water quality impacts…is very relevant to BETO’s goals”, ”A comprehensive understanding of impacts of bioenergy on water is critical to the success of the program overall.”, ”No question about relevance. Super..there is a vacuum in the research space..so this work will be key. This has the ability to translate to policy space by valuing ecosystem services and incentivizing perennialization…”” I liked the idea of being able to use the data to project forward what the kind of biodiversity you could expect.This would have a great impact on understanding the effects producing large scale bioenergy crops would have. It could also inform how best to optimize the land to achieve both bioenergy and biodiversity.The project is well connected to others..”
Most-negative comments: None
Response: “Thank you for highlighting the value and relevance of our efforts to BETO sustainability goals and future Billion Ton work and the importance of our collaborations. We are pleased with the response to our efforts to project bioenergy effects on biodiversity and to design landscapes to promote both.”
Response to reviews
31 Forecasting Water Quality and Biodiversity
Future work
Most-positive comments: “The project has a strong approach and quality portfolio of work moving forward. Continued work on biodiversity indicators will be valuable to many..”, “This project offers a comprehensive (if not daunting) plan for future work.”, “Glad to see that you are …considering species of concern and using current research on birds.””A continued focus on minimizing trade-offs between loadings and yield is highly important and valuable.”
Most-negative comments: “Planned GOM work appears to be a substantial future task effort, however details on this activity were not thoroughly discussed.”, ”The project should try to prioritize reseach on the effects of tile drainage.”
Response: Thank you for endorsing our plans to extend the Potts/Evans study and design harvesting guidelines for wildlife. With regard to providing information to state wildlife agencies, we have been actively participating in the multi-LCC Mississippi River basin / Gulf Hypoxia Initiative and will look for opportunities to share results with them. We plan to address tile drain mitigation in the BT16 effort. We are close to completing our contributions to the overall Gulf of Mexico effort.”
Response to reviews
32 Forecasting Water Quality and Biodiversity
Overall Impressions
Most-positive comments: This is one of the most exciting projects in BETOs portfolio; it is way far out in front of research in the area, and has the potential to build the foundation for bioenergy to receive ecosystem services credit in the policy space. The approach and work ethic of the project should be mirrored in other BETO funded ecosystem service projects.”
Most-negative comments: “There is great potential for synergy with ANL’s water work and ORNL work in forestry.”, “Continued project coordination with USDA and USGS experts…should be highly encouraged.”
Response: Thank you for the positive feedback! We are working with Dale Robertson (USGS) to identify long-term water quality gages as part of our harmonization. USDA collaboration will be key in our future pheasant modeling effort on CRP lands. We greatly appreciate your support and suggestions for improvement.
Response to reviews
33 Forecasting Water Quality and Biodiversity
Progress FY15 – FY17
Publications
• Jager, HI and RA Efroymson "Bioenergy Mediates the Flow of Ecosystem Services" to a special issue on Ecosystem Services in Biomass & Bioenergy (in 2nd review)
• Schweizer, Jager, Eaton, Efroymson, and Baskaran. ‘Hot spots for recreational fishing: mapping the value of ecosystem services at the confluence of fish diversity, water quality, and people with access to freshwater,’ submitted to Fisheries Research (in revision)
• Forbes, Jager, et al. In press 2016. A framework for predicting impacts on ecosystem services from (sub)organismal responses to chemicals’ Environmental Toxicology & Chemistry
• Jager, HI, LM Baskaran, PE Schweizer, A Turhollow, CC Brandt, and R Srinivasan. 2015. Forecasting changes in water quality in rivers associated with growing biofuels in the Arkansas-White-Red river drainage, USA. Global Change Biology: Bioenergy 7(4): 774-784.
Publications in progress
• Jager, HI, RA Efroymson. In progress. Designing landscapes to produce bioenergy and wildlife habitat.
• Jager, HI, J. Kreig, C. Negri, H. Ssesane, I. Chaubey, M. Tomer and others. In progress. Designing bioenergy landscapes to improve water quality
• Jager, Brandes, Craig, Evans, Negri, Nejadhashemi, Phifer, Schwartz, Verdade, and Zumpf (participants in IALE Symposium on Biomass and Biodiversity). "Understanding how spatial decisions influence co-production of bioenergy feedstocks and biodiversity: a synthesis "
34 Forecasting Water Quality and Biodiversity
Progress FY15-FY17
Significant Reports
2017
• Jager, HI, M. Wu, M. Ha, LM Baskaran, JA Kreig. 2017. Chapter 5. Water Quality Responses to Simulated Management Practices on Agricultural Lands Producing Biomass Feedstocks in Two Tributary Basins of the Mississippi River. U.S. Department of Energy. 2016 Billion-Ton Report: Advancing Domestic Resources for a Thriving Bioeconomy, Volume 2: Environmental Sustainability Effects of Select Scenarios from Volume 1. R. A. Efroymson, M. H. Langholtz, K.E. Johnson, and B. J. Stokes (Eds.), ORNL/TM-2016/727. Oak Ridge National Laboratory, Oak Ridge, TN. 642p. doi 10.2172/1338837
• Jager, HI, G Wang, JA Kreig, N Sutton and I Busch. 2017. Chapter 10. Simulated Resposes of Avian Biodiversity to Biomass Production. U.S. Department of Energy. 2016 Billion-Ton Report: Advancing Domestic Resources for a Thriving Bioeconomy, Volume 2: Environmental Sustainability Effects of Select Scenarios from Volume 1. R. A. Efroymson, M. H. Langholtz, K.E. Johnson, and B. J. Stokes (Eds.), ORNL/TM-2016/727. Oak Ridge National Laboratory, Oak Ridge, TN. 642p. doi 10.2172/1338837
35 Forecasting Water Quality and Biodiversity
Progress FY15-FY17
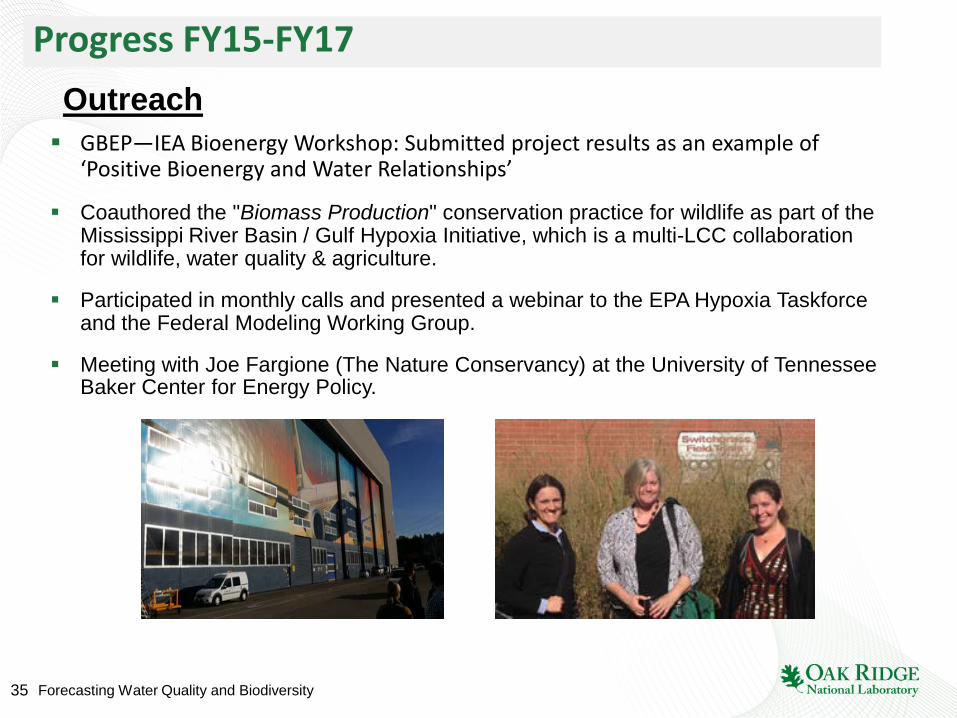
GBEP—IEA Bioenergy Workshop: Submitted project results as an example of ‘Positive Bioenergy and Water Relationships’
Coauthored the "Biomass Production" conservation practice for wildlife as part of the Mississippi River Basin / Gulf Hypoxia Initiative, which is a multi-LCC collaboration for wildlife, water quality & agriculture.
Participated in monthly calls and presented a webinar to the EPA Hypoxia Taskforce and the Federal Modeling Working Group.
Meeting with Joe Fargione (The Nature Conservancy) at the University of Tennessee Baker Center for Energy Policy.
Outreach
36 Forecasting Water Quality and Biodiversity
Progress FY15-FY17 2017
• Jan: Jager and Novello attended a kick-off meeting for a multi-lab project to develop decision-support tools for forest thinning to produce biofuels, reduce wildfires, and benefit salmon.
• Jan: Novello presented “Forest Thinning to Avert Wildfire, Produce Energy, and Save Salmon” to a ‘Fishheads’ brownbag.
2016
• Dec: Baskaran presented “Exploring the potential for Sustainable future bioenergy production in the Arkansas-White-Red river basin” at the Annual American Geophysical Union Meeting, San Francisco.
• Oct: Jager toured the Boeing Plant in Seattle, WA, to learn about Boeing’s progress in sourcing jet fuel from bioenergy produced in the western US
• Apr: Jager invited to present biodiversity modeling in a combined Session on Renewable Bioenergy and Biodiversity and Riparian Buffers at the National Working Forum: Managing Poplar and Willow for Environmental Benefits and the Renewable Fuels Industry, Seattle, WA
• Apr: Jager organized Symposium entitled “Reshaping Bioenergy Landscapes: Bioenergy and Biodiversity II” at the US Chapter of the International Association of Landscape Ecology (IALE) annual meeting in Asheville, NC.
• Aug: Jager presented to the Southern Grassroots Biofuels Project Workshop at Tennessee Technical University in Cookeville, TN.
Meetings and Presentations
37 Forecasting Water Quality and Biodiversity
Progress FY15-FY17 2016
• Mar: Jager attended the Mississippi River Basin / Gulf Hypoxia Initiative meeting in Indianapolis. This initiative, led by the USFWS, seeks to provide guidance and also involves developing a decision support framework for farmers.
• L. Baskaran presented “Opportunities for sustainable bioenergy production in two southern tributary basins of the Mississippi River” at the Annual meeting of the American Association of Geographers.
• May: Kreig presented “Spatial allocation of conservation practices to maximize bioenergy production and water quality at a regional scale” at International Society of Ecological Modeling Global Conference at Towsend U., Maryland.
• Feb: Jager (ORNL) and Wu (ANL) jointly addressed the Gulf of Mexico Hypoxia Taskforce on behalf of Taskforce members USDA and NRC. The purpose was to present joint BETO research to evaluate future implications of growing biofuels for downstream nutrient loadings to the Gulf of Mexico.
2015
• Dec: Jager participated in a review meeting for the Billion Ton 2016 Volume II Environmental analysis.
• Oct: Jager invited to Organisms-to Ecosystem Services Working Group at the NSF National Institute of Mathematical and Biological Sciences. The group will develop ecosystem production response curves to relate biological entities (i.e., fishes) to ecosystem services and contribute to EPA’s library of models.
• Aug: Jager Invited presentation at symposium, 'Inland Drivers of Gulf Hypoxia', American Fisheries Society Annual meeting, Kansas City
Meetings and Presentations
38 Forecasting Water Quality and Biodiversity
Progress FY15-FY17 Meetings and Presentations
Forecasting water quality & biodiversity 39
Arkansas-White-Red River Basin
Tennessee River Basin
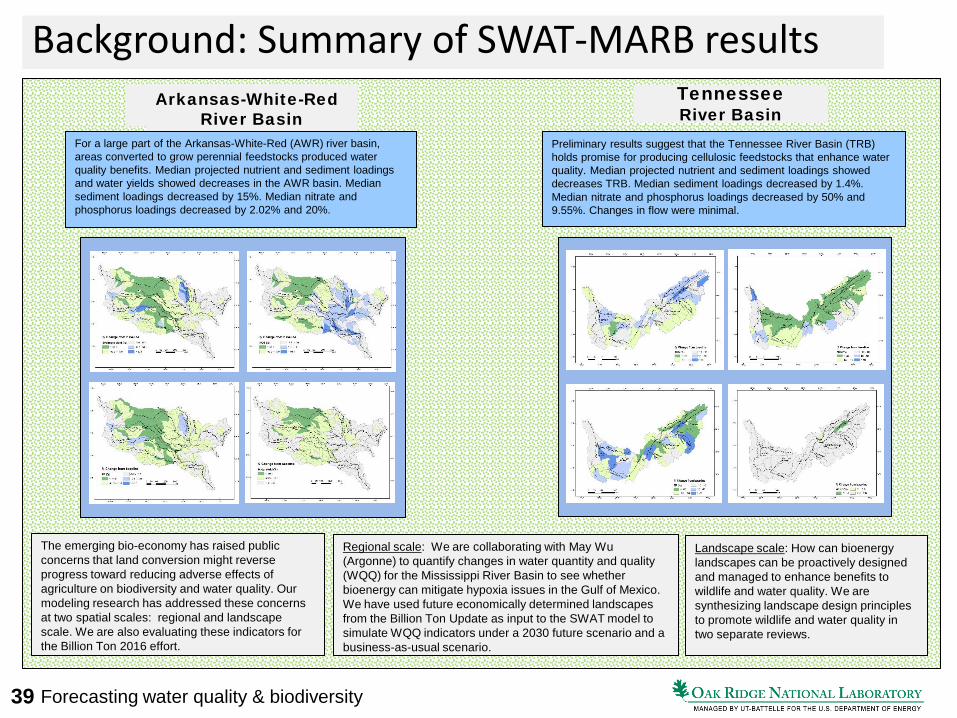
Preliminary results suggest that the Tennessee River Basin (TRB) holds promise for producing cellulosic feedstocks that enhance water quality. Median projected nutrient and sediment loadings showed decreases TRB. Median sediment loadings decreased by 1.4%. Median nitrate and phosphorus loadings decreased by 50% and 9.55%. Changes in flow were minimal.
For a large part of the Arkansas-White-Red (AWR) river basin, areas converted to grow perennial feedstocks produced water quality benefits. Median projected nutrient and sediment loadings and water yields showed decreases in the AWR basin. Median sediment loadings decreased by 15%. Median nitrate and phosphorus loadings decreased by 2.02% and 20%.
The emerging bio-economy has raised public concerns that land conversion might reverse progress toward reducing adverse effects of agriculture on biodiversity and water quality. Our modeling research has addressed these concerns at two spatial scales: regional and landscape scale. We are also evaluating these indicators for the Billion Ton 2016 effort.
Landscape scale: How can bioenergy landscapes can be proactively designed and managed to enhance benefits to wildlife and water quality. We are synthesizing landscape design principles to promote wildlife and water quality in two separate reviews.
Regional scale: We are collaborating with May Wu (Argonne) to quantify changes in water quantity and quality (WQQ) for the Mississippi River Basin to see whether bioenergy can mitigate hypoxia issues in the Gulf of Mexico. We have used future economically determined landscapes from the Billion Ton Update as input to the SWAT model to simulate WQQ indicators under a 2030 future scenario and a business-as-usual scenario.
Background: Summary of SWAT-MARB results
Recommended