Outlook for the San Diego Metro Office Market with Green and Medical Office Breakdown
By Norm Miller, PhD, with Bryan Masters, Lawrence Kopp and Charles Tu, PhD
Preface: The purpose of this report is not to replace the forecasting work of the excellent consultants and real
estate firms in the region. Rather, it is intended to provide an independent, aggregate and longer‐term
outlook on the health of the office market.
Demand and Supply: San Diego appears to be on a good track with respect to the metro office market.
Normal additions to supply run about 2 percent of the stock each year and that suffices for normal wear and
tear and attrition of the old stock—estimated at 1 percent per year—as well as net new demand from normal
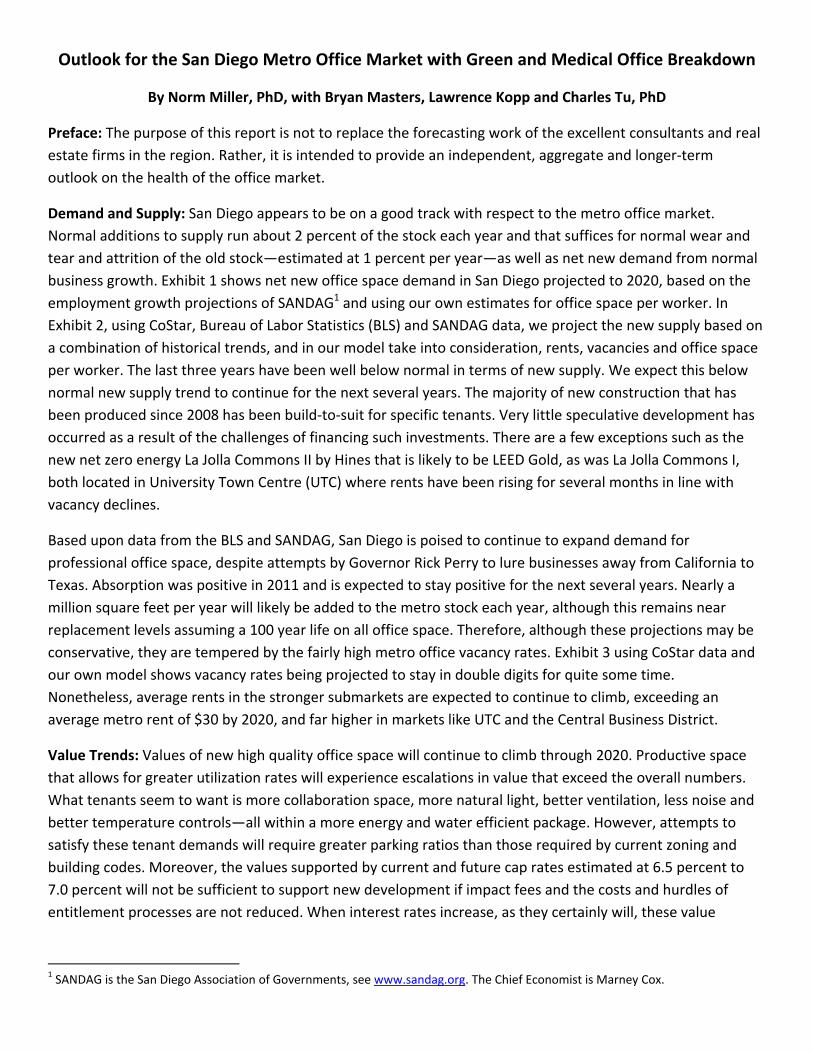
business growth. Exhibit 1 shows net new office space demand in San Diego projected to 2020, based on the
employment growth projections of SANDAG1 and using our own estimates for office space per worker. In
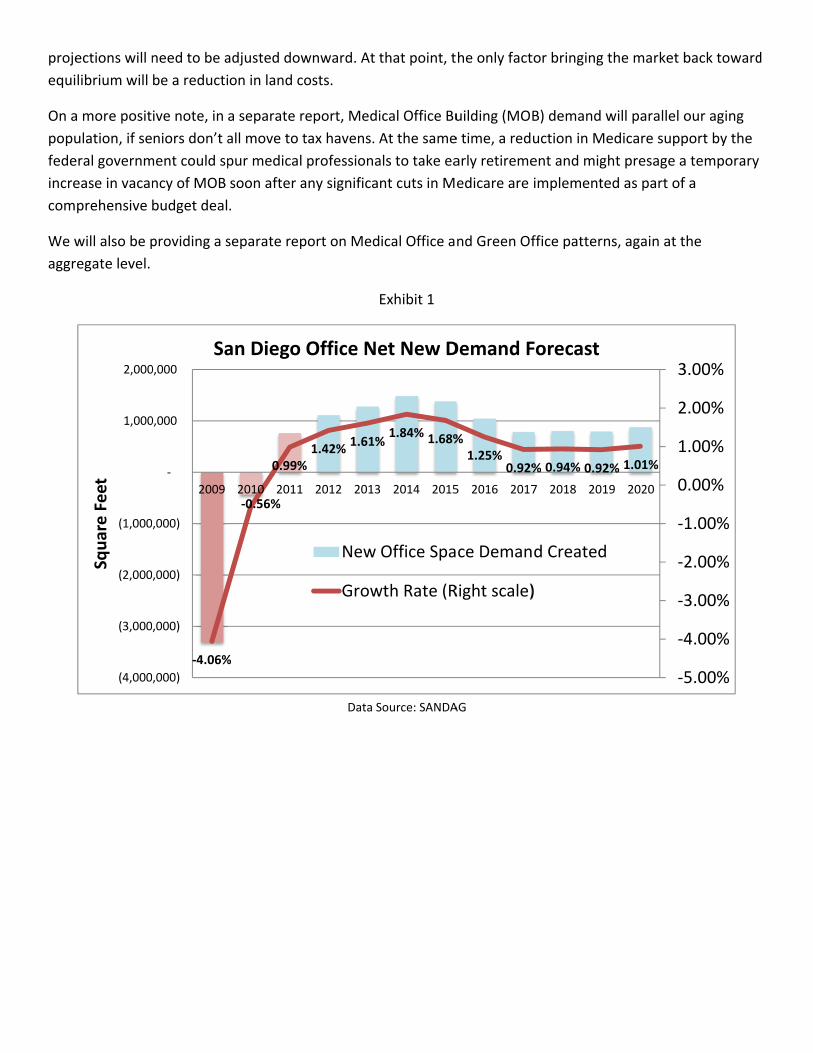
Exhibit 2, using CoStar, Bureau of Labor Statistics (BLS) and SANDAG data, we project the new supply based on
a combination of historical trends, and in our model take into consideration, rents, vacancies and office space
per worker. The last three years have been well below normal in terms of new supply. We expect this below
normal new supply trend to continue for the next several years. The majority of new construction that has
been produced since 2008 has been build‐to‐suit for specific tenants. Very little speculative development has
occurred as a result of the challenges of financing such investments. There are a few exceptions such as the
new net zero energy La Jolla Commons II by Hines that is likely to be LEED Gold, as was La Jolla Commons I,
both located in University Town Centre (UTC) where rents have been rising for several months in line with
vacancy declines.
Based upon data from the BLS and SANDAG, San Diego is poised to continue to expand demand for
professional office space, despite attempts by Governor Rick Perry to lure businesses away from California to
Texas. Absorption was positive in 2011 and is expected to stay positive for the next several years. Nearly a
million square feet per year will likely be added to the metro stock each year, although this remains near
replacement levels assuming a 100 year life on all office space. Therefore, although these projections may be
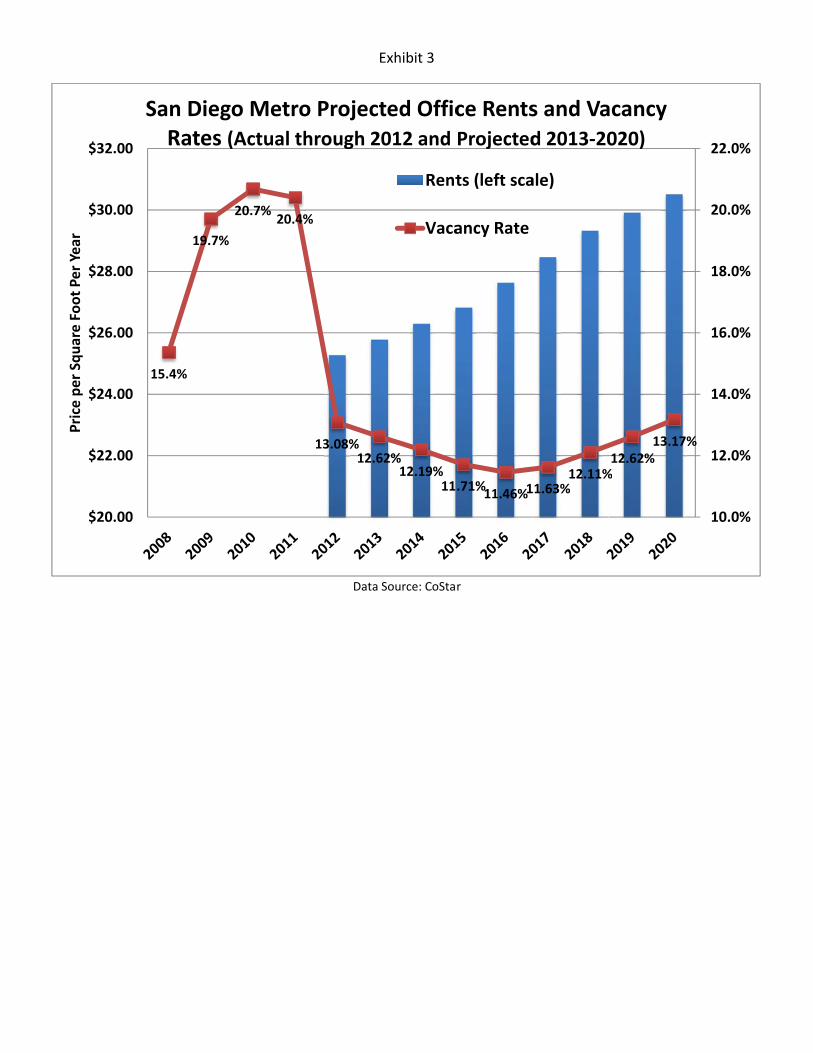
conservative, they are tempered by the fairly high metro office vacancy rates. Exhibit 3 using CoStar data and
our own model shows vacancy rates being projected to stay in double digits for quite some time.
Nonetheless, average rents in the stronger submarkets are expected to continue to climb, exceeding an
average metro rent of $30 by 2020, and far higher in markets like UTC and the Central Business District.
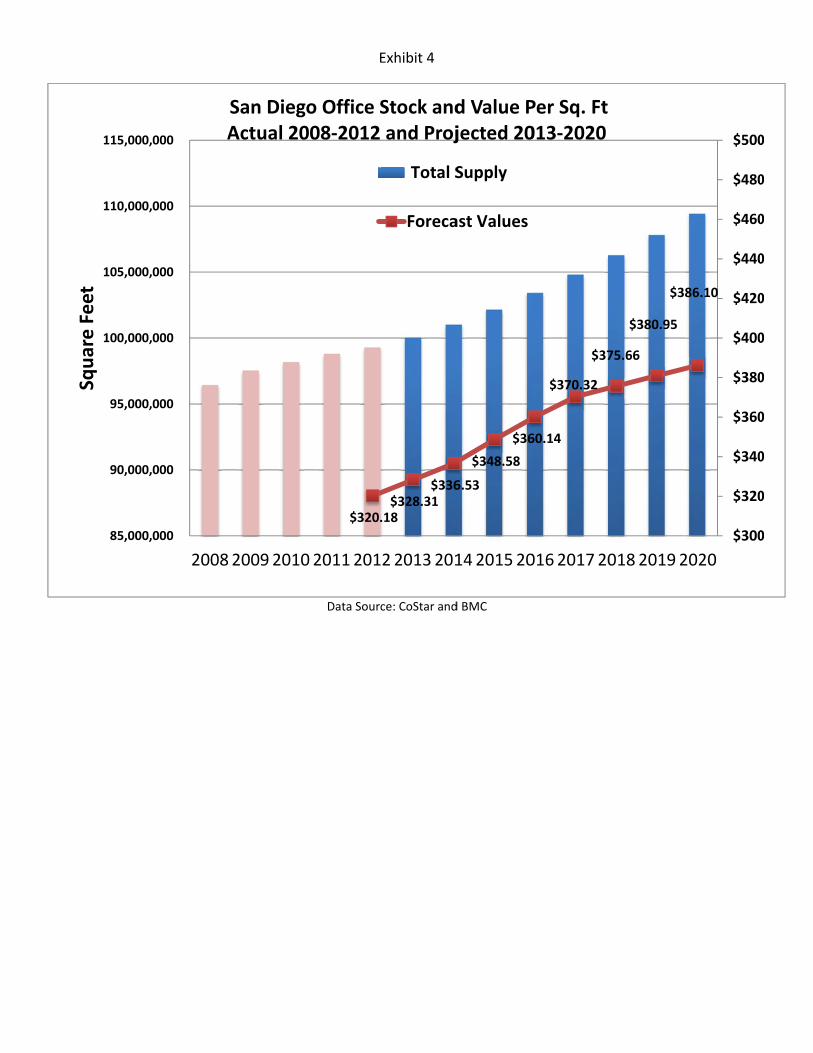
Value Trends: Values of new high quality office space will continue to climb through 2020. Productive space
that allows for greater utilization rates will experience escalations in value that exceed the overall numbers.
What tenants seem to want is more collaboration space, more natural light, better ventilation, less noise and
better temperature controls—all within a more energy and water efficient package. However, attempts to
satisfy these tenant demands will require greater parking ratios than those required by current zoning and
building codes. Moreover, the values supported by current and future cap rates estimated at 6.5 percent to
7.0 percent will not be sufficient to support new development if impact fees and the costs and hurdles of
entitlement processes are not reduced. When interest rates increase, as they certainly will, these value
1 SANDAG is the San Diego Association of Governments, see www.sandag.org. The Chief Economist is Marney Cox.
proje
equi
On a
popu
fede
incre
com
We w
aggr
ections will n
librium will
a more posit
ulation, if se
eral governm
ease in vacan
prehensive
will also be p
egate level.
(4,000
(3,000
(2,000
(1,000
1,000
2,000
Square Feet
need to be a
be a reducti
ive note, in
niors don’t a
ment could sp
ncy of MOB
budget deal
providing a s
‐4.06%
,000)
,000)
,000)
,000)
‐
0,000
0,000
2009
Sa
adjusted dow
on in land co
a separate r
all move to t
pur medical
soon after a
.
separate rep
%
‐0.56%
0.99%
2010 2011
an Diego
wnward. At t
osts.
report, Medi
tax havens. A
professiona
any significan
port on Med
E
Data S
%1.42%
1.61%
2012 2013
Office Ne
New
Grow
that point, t
ical Office Bu
At the same
als to take ea
nt cuts in M
ical Office a
Exhibit 1
Source: SANDA
%1.84% 1.68%
2014 2015
et New D
Office Spa
wth Rate (R
he only fact
uilding (MOB
e time, a red
arly retireme
edicare are
nd Green Of
AG
%1.25%
0.92%
5 2016 2017
Demand F
ce Deman
Right scale)
tor bringing t
B) demand w
uction in Me
ent and migh
implemente
ffice pattern
% 0.94% 0.92
7 2018 201
Forecast
d Created
)
the market b
will parallel o
edicare supp
ht presage a
ed as part of
ns, again at t
2% 1.01%
‐5
‐4
‐3
‐2
‐
0
1
2
3
9 2020
back toward
our aging
port by the
a temporary
f a
the
5.00%
4.00%
3.00%
2.00%
1.00%
0.00%
1.00%
2.00%
3.00%
d
80,000,00
85,000,00
90,000,00
95,000,00
100,000,00
105,000,00
110,000,00
115,000,00
Square Feet
1.01%1.18%
00
00
00
00
00
00
00
00
20032004
SupA
R
Data Source
%
2.17%
2.76%
3.36
420052006200
pply of OActual 200
RBA witho
E
e: CoStar, Bure
6%
2.70%
1.13%
0.6
072008200920
Office Sp03‐2012 a
ut MOB
Exhibit 2
eau of Labor St
66%0.63%0.48%
0
010201120122
ace in Sand Proje
Tota
tatistics and SA
%
0.76%0.97%
1.13
201320142015
an Diegoected 201
al Annual G
ANDAG
%1.25%
1.33%1.4
52016201720
o Count13‐2020
Growth Rat
40%
1.45%
1.49%
01820192020
y
te
0.00%
0.50%
1.00%
1.50%
2.00%
2.50%
3.00%
3.50%
4.00%
Price
perSquareFootPerYear
1
$20.00
$22.00
$24.00
$26.00
$28.00
$30.00
$32.00
Price per Square Foot Per Year
S
15.4%
19.7%
San DiegRates
%
20.7%20.4%
go Metro(Actual th
E
Data
%
13.08%12.6
o Projecthrough 2
Exhibit 3
Source: CoSta
62%12.19%
11
ted Offic012 and
Rent
Vaca
r
.71%11.46%1
ce RentsProjected
ts (left sca
ancy Rate
11.63%12.11%
s and Vad 2013‐20
ale)
%12.62%
13.17
acancy 020)
7%
10.0%
12.0%
14.0%
16.0%
18.0%
20.0%
22.0%
85,000,
90,000,
95,000,
100,000,
105,000,
110,000,
115,000,
Square Feet
000
000
000
000
000
000
000
2008
A
20092010
San DiegActual 20
E
Data Sour
$320.
0 2011201
go Office S008‐2012
Exhibit 4
ce: CoStar and
.18 $328.31
$336
122013201
Stock and and Proj
Total S
Foreca
d BMC
6.53
$348.58
$36
14201520
d Value Pjected 20
Supply
ast Values
60.14
$370.32
$37
0162017 20
Per Sq. Ft013‐2020
75.66
$380.95
$3
018 2019 2
86.10
$300
$320
$340
$360
$380
$400
$420
$440
$460
$480
$500
2020
0
0
0
0
0
0
0
0
0
0
0
Outlook for the San Diego Green Office Market
Demand and Supply: The San Diego Green office market appears to be recovering at a more rapid pace than
the general metro office market. Most green buildings are already superior in quality with a large proportion
of Class A quality inventory. Many tenants realizing the historically low rental rates bargains in the past few
years have made the “flight to quality.” The overall vacancy rate for green buildings has come down faster
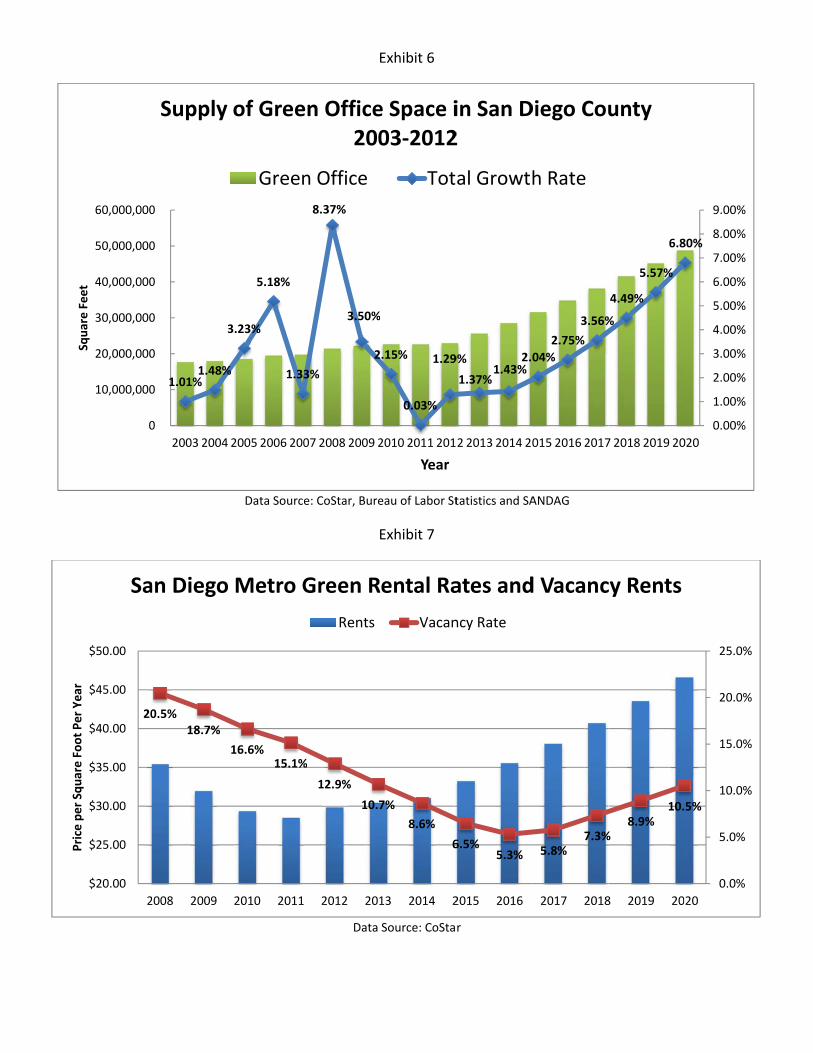
than the overall market. Normal additions to supply run about 2.8 percent of the stock each year in San Diego
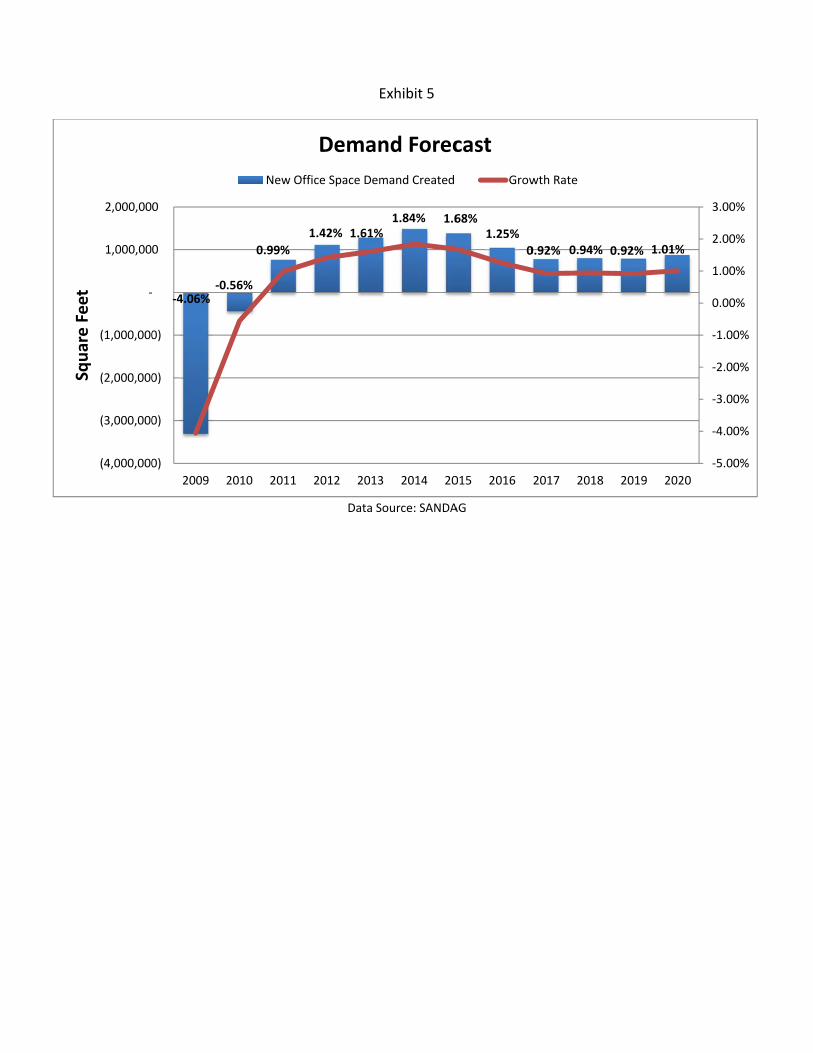
County, included in this figure is the addition of new construction and existing building conversion. Exhibit 5
shows net new office space demand in San Diego projected through 2020, based on the employment growth
projections of SANDAG and using our own estimates for office space per worker. In Exhibit 6, using CoStar, BLS
and SANDAG data, we project the new supply based on a combination of historical trends, as well as rental
rates, vacancies and office space per worker.
The last three years have been well below normal in terms of net new supply. Due to the lengthy permitting
process for new construction, we expect this below normal new supply trend to continue for the next several
years. In regards to office buildings, the majority of new construction since 2008 has been green buildings. We
expect this trend to continue, whether or not the owner decides to certify the building is their decision. Those
few projects currently under construction are green buildings including La Jolla Commons II in the UTC
submarket, which is likely to be LEED Gold and will be one of the largest ‘net‐zero’ buildings in the United
States. The other, the FBI headquarters building in Sorrento Mesa, is projected to be LEED Gold. In addition,
Rio San Diego I, a Class A building in Mission Valley, achieved LEED EB certification last year.
Based upon data from the Bureau of Labor Statistics and SANDAG, San Diego is poised to continue to expand
demand for professional office space. Absorption in green buildings has been positive in 18 of the last 20
quarters and is expected to stay positive for the next several years. Just under three million square feet per
year will likely be added to the green metro stock each year, this includes about two million square of existing
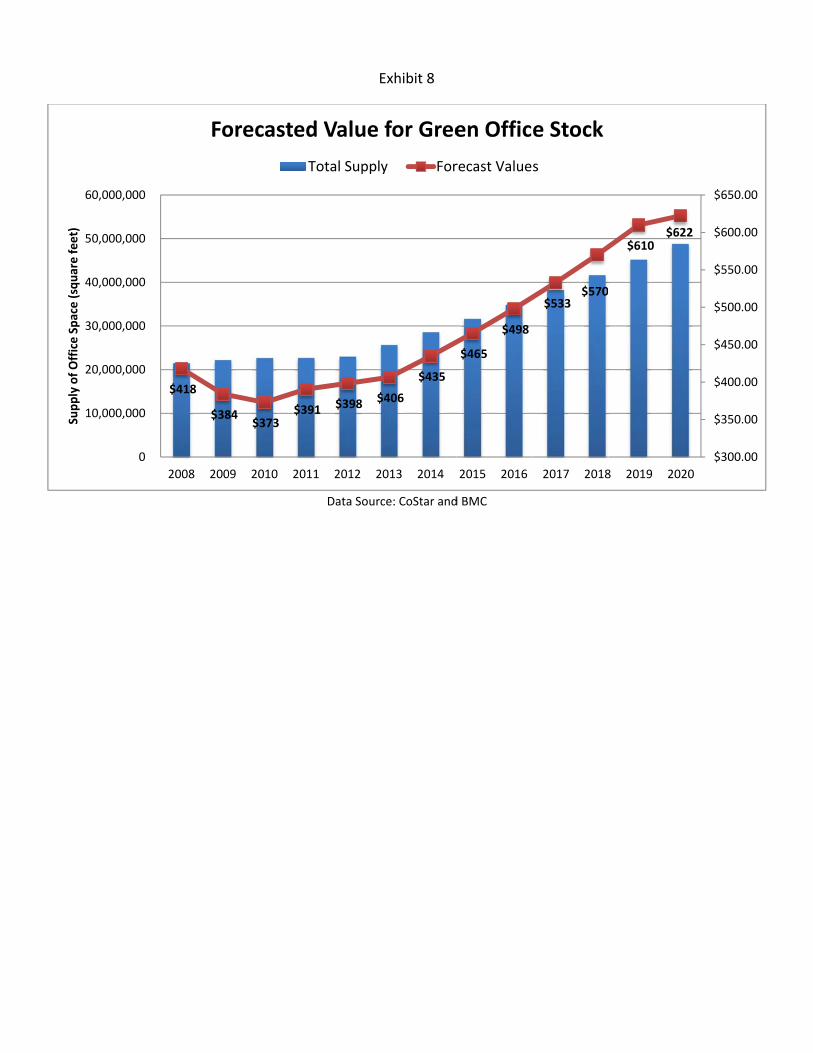
construction being retrofitted to meet green standards. Exhibit 7 using CoStar data and our own model shows
the vacancy rate for green space is projected to reach single digits again in 2014. With this trend, the average
green rental rate is expected to climb, exceeding an average metro rent of $47 by 2020, with some of the
stronger submarkets like Del Mar Heights and UTC being even higher.
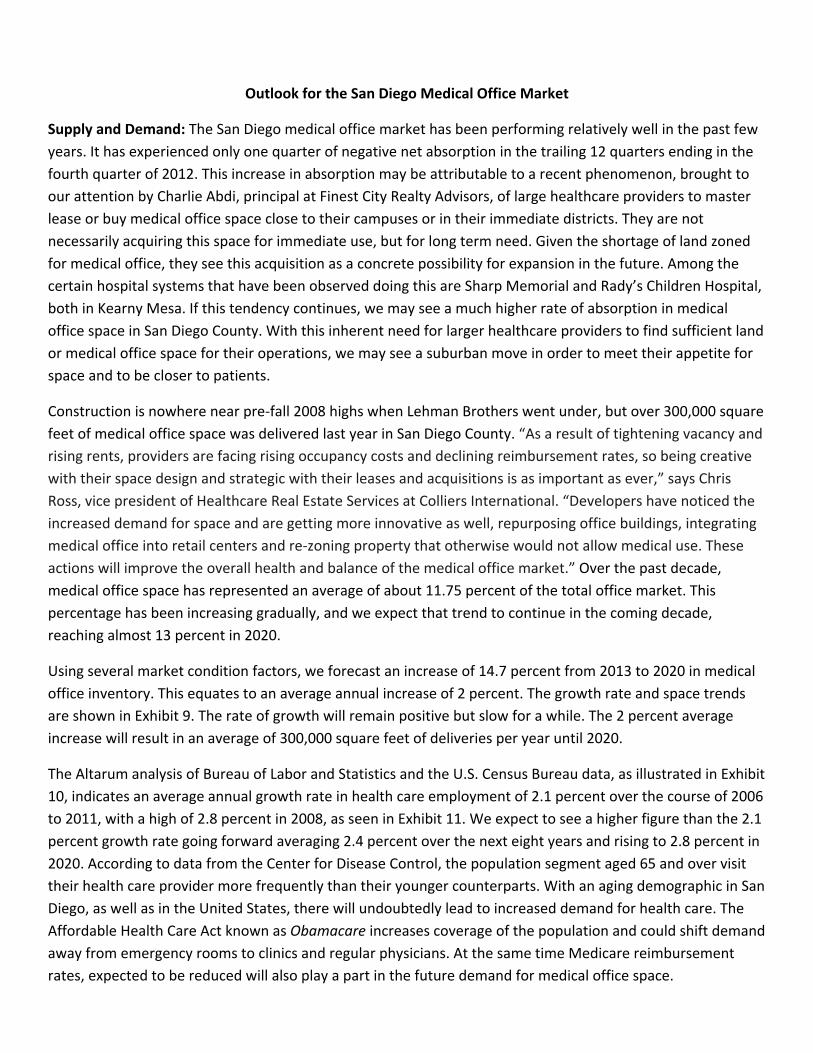
Value Trends: Values of green office buildings will continue to climb through 2020 as seen in Exhibit 8.
Buildings that offer the greatest amenities and are in premium locations will experience escalations in value
that exceed the average price per square foot. More tenants that desire to be in more convenient locations,
require more collaborative space, better natural lighting, better ventilation, less noise and better temperature
controls, along with more energy and water efficient package will be attracted to green buildings. Moreover,
as land availability is limited in the ideal locations for green buildings and land values and entitlement costs
remain high, especially in the desirable submarkets, the feasibility of new construction will be limited. In
addition, when interest rates increase, the interest of new spec office development will be reduced. We
anticipate that with the demand and land shortage, that the spread between green building and non‐green
building values will become greater before green becomes the standard benchmark required for all
competitive buildings.
SF
(4,000,000
(3,000,000
(2,000,000
(1,000,000
‐
1,000,00
2,000,00
Square Feet ‐4.06%
‐0.
0)
0)
0)
0)
0
0
2009 2
.56%
0.99%
2010 2011
New Of
E
Data S
1.42% 1.61%
2012 2013
Deman
ffice Space Dem
Exhibit 5
Source: SANDA
%1.84% 1.6
3 2014 20
nd Forec
mand Created
AG
68%1.25%
0
015 2016
cast
Grow
0.92% 0.94%
2017 2018
wth Rate
0.92% 1.01%
2019 202
‐5.00%
‐4.00%
‐3.00%
‐2.00%
‐1.00%
0.00%
1.00%
2.00%
3.00%
0
Price
perSquareFootPerYear
0
10,000,000
20,000,000
30,000,000
40,000,000
50,000,000
60,000,000
Square Feet
20
$20.00
$25.00
$30.00
$35.00
$40.00
$45.00
$50.00
2
Price per Square Foot Per Year
Sa
1.01%1.48%
3
0
0
0
0
0
0
0
2003 2004
Supply
0.5%18.7%
2008 2009
an Diego
Data Source
%
3.23%
5.18%
1.33
2005 2006 200
of Gree
Green
16.6%15.1%
2010 2011
Metro G
E
e: CoStar, Bure
E
Data
3%
8.37%
3.50%
2
07 2008 2009 2
en Office200
n Office
%
12.9%
10.7
2012 201
Green R
Rents
Exhibit 6
eau of Labor St
Exhibit 7
Source: CoSta
%
.15%
0.03%
1.29
2010 2011 201
Year
e Space i03‐2012
Tot
7%
8.6%
6
13 2014 2
Rental Ra
Vacan
tatistics and SA
r
9%
1.37%1.43%
2.0
2 2013 2014 20
in San D2
al Growth
6.5%5.3%
2015 2016
ates and
ncy Rate
ANDAG
04%
2.75%
3.56%
015 2016 2017
Diego Cou
h Rate
5.8%7.3%
2017 2018
d Vacanc
%
4.49%
5.57%
6.8
7 2018 2019 20
unty
%8.9%
10.
8 2019 20
cy Rents
80%
0.00%
1.00%
2.00%
3.00%
4.00%
5.00%
6.00%
7.00%
8.00%
9.00%
020
5%
0.0%
5.0%
10.0%
15.0%
20.0%
25.0%
20
SupplyofOfficeSpace(squarefeet)
0
10,000,000
20,000,000
30,000,000
40,000,000
50,000,000
60,000,000
Supply of Office Space (square feet)
$418
$38
2008 200
Fo
84 $373
$3
09 2010 20
orecaste
E
Data Sour
391 $398 $
011 2012 2
ed Value
Total Suppl
Exhibit 8
ce: CoStar and
$406
$435
2013 2014
for Gree
y For
d BMC
$465
$498
2015 2016
en Offic
recast Value
$533 $570
2017 2018
e Stock
s
$610 $62
8 2019 202
22
$300.00
$350.00
$400.00
$450.00
$500.00
$550.00
$600.00
$650.00
20
Outlook for the San Diego Medical Office Market
Supply and Demand: The San Diego medical office market has been performing relatively well in the past few
years. It has experienced only one quarter of negative net absorption in the trailing 12 quarters ending in the
fourth quarter of 2012. This increase in absorption may be attributable to a recent phenomenon, brought to
our attention by Charlie Abdi, principal at Finest City Realty Advisors, of large healthcare providers to master
lease or buy medical office space close to their campuses or in their immediate districts. They are not
necessarily acquiring this space for immediate use, but for long term need. Given the shortage of land zoned
for medical office, they see this acquisition as a concrete possibility for expansion in the future. Among the
certain hospital systems that have been observed doing this are Sharp Memorial and Rady’s Children Hospital,
both in Kearny Mesa. If this tendency continues, we may see a much higher rate of absorption in medical
office space in San Diego County. With this inherent need for larger healthcare providers to find sufficient land
or medical office space for their operations, we may see a suburban move in order to meet their appetite for
space and to be closer to patients.
Construction is nowhere near pre‐fall 2008 highs when Lehman Brothers went under, but over 300,000 square
feet of medical office space was delivered last year in San Diego County. “As a result of tightening vacancy and
rising rents, providers are facing rising occupancy costs and declining reimbursement rates, so being creative
with their space design and strategic with their leases and acquisitions is as important as ever,” says Chris
Ross, vice president of Healthcare Real Estate Services at Colliers International. “Developers have noticed the
increased demand for space and are getting more innovative as well, repurposing office buildings, integrating
medical office into retail centers and re‐zoning property that otherwise would not allow medical use. These
actions will improve the overall health and balance of the medical office market.” Over the past decade,
medical office space has represented an average of about 11.75 percent of the total office market. This
percentage has been increasing gradually, and we expect that trend to continue in the coming decade,
reaching almost 13 percent in 2020.
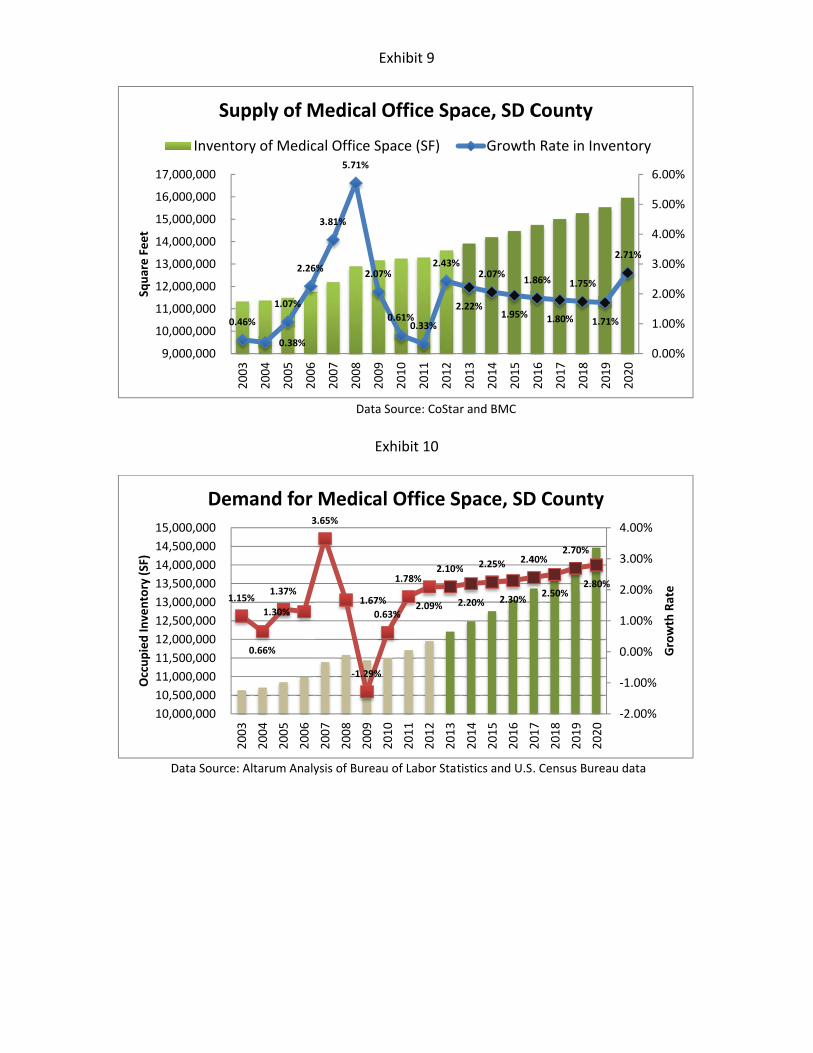
Using several market condition factors, we forecast an increase of 14.7 percent from 2013 to 2020 in medical
office inventory. This equates to an average annual increase of 2 percent. The growth rate and space trends
are shown in Exhibit 9. The rate of growth will remain positive but slow for a while. The 2 percent average
increase will result in an average of 300,000 square feet of deliveries per year until 2020.
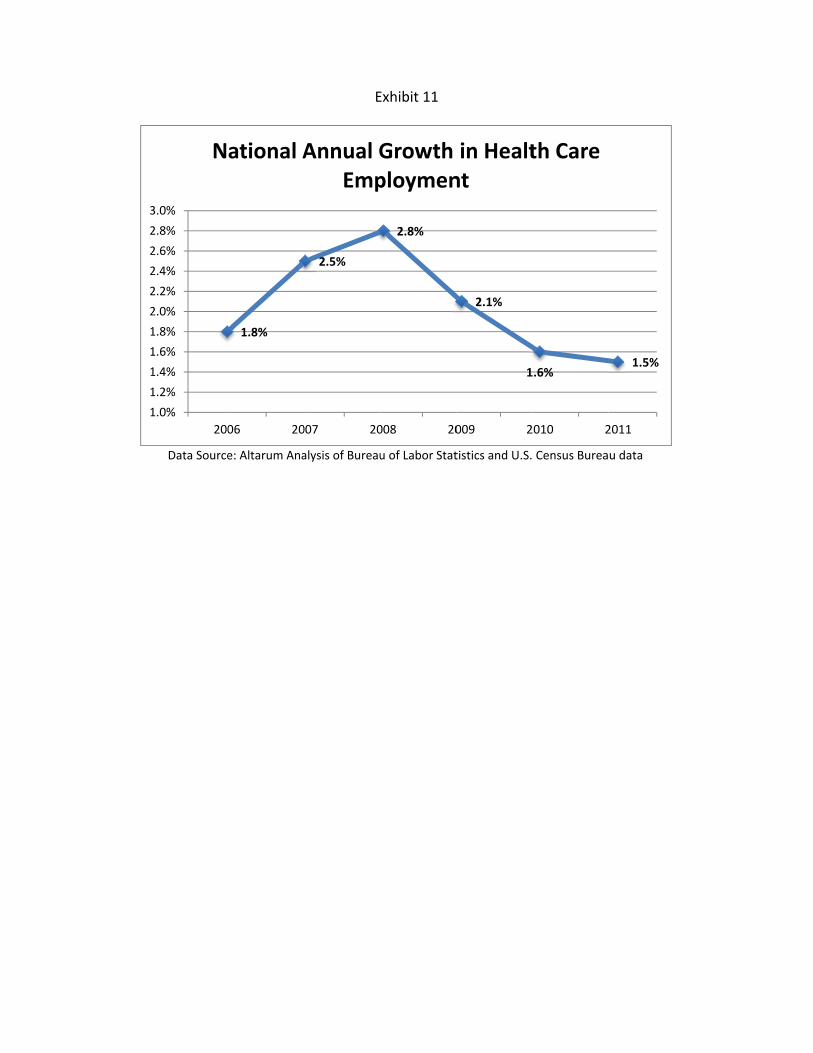
The Altarum analysis of Bureau of Labor and Statistics and the U.S. Census Bureau data, as illustrated in Exhibit
10, indicates an average annual growth rate in health care employment of 2.1 percent over the course of 2006
to 2011, with a high of 2.8 percent in 2008, as seen in Exhibit 11. We expect to see a higher figure than the 2.1
percent growth rate going forward averaging 2.4 percent over the next eight years and rising to 2.8 percent in
2020. According to data from the Center for Disease Control, the population segment aged 65 and over visit
their health care provider more frequently than their younger counterparts. With an aging demographic in San
Diego, as well as in the United States, there will undoubtedly lead to increased demand for health care. The
Affordable Health Care Act known as Obamacare increases coverage of the population and could shift demand
away from emergency rooms to clinics and regular physicians. At the same time Medicare reimbursement
rates, expected to be reduced will also play a part in the future demand for medical office space.
Reimbursement rates are simply the payment a doctor receives for a particular procedure performed on a
patient in the Medicare system. The lower reimbursements suggested by current policy strategies and the
greater the regulatory reporting and billing costs burden imposed, the less incentive doctors have to accept
and treat such patients. With an aging physician population, many of them may decide retirement or selling
their practice to larger hospitals and clinics is a better alternative to staying in private practice. This may shift
some of the demand away from smaller medical office tenancy towards larger facilities affecting the vacancy
rates of the lower quality smaller scaled and generally older medical office stock. In the past few years, there
have also been reports of Medicare dependent doctors and their practices entering into financial difficulties
due to not being able to cover their operating expenses with declining reimbursement rates. Smaller medical
office tenants, especially those with a heavy Medicare practice, may not be as reliable and secure as they once
were. “With the uncertainty of the future of this country’s healthcare system, it is more important than ever
for physicians to control their overhead costs and reduce their risk exposure in order to most effectively
position their practices for the future,” added JP Roach of Hughes Marino.
Value Trends: Characteristics of highly‐sought after medical office space includes higher quality space with
more efficient layouts and close proximity to hospitals. We will see a premium being paid for these buildings.
In regards to multi‐tenant medical office spaces, we see a continued trend of preferences for ancillary services
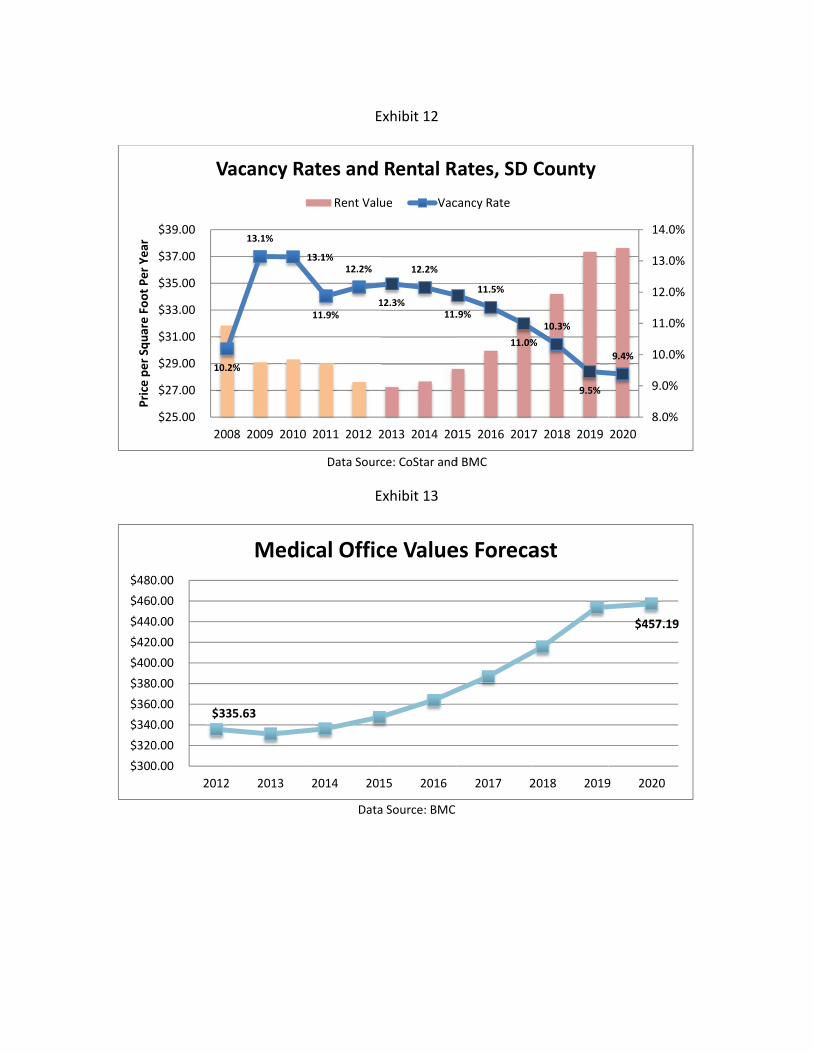
to be located in the same building. In 2012, vacancy for medical office buildings in San Diego was 12.2 percent.
We expect this vacancy rate to increase in 2013. In the long term, vacancy rates will decline, reaching a low of
9.4 percent by the end of the decade. According to our model, average rental rates will rise as vacancy falls,
reaching $37.65 in 2020. This analysis is shown in Exhibit 12. This rental rate, of $37.65, is 36 percent higher
than the average rental rate of $27.64 observed in 2012. In the value analysis, seen in Exhibit 13, average price
per square foot for medical office space in San Diego County is forecast to rise to $457 by 2020. This is a 38
percent increase from our 2013 values. Although this is an optimistic scenario, we believe that the
fundamental trends show us that values will reach that vicinity later this decade. At the same time, there will
be a high dispersion of medical office property values with the new on‐campus facilities at high premiums
compared to that of older medical office buildings. Technological advancements and flight to quality will add
to the price dispersion observed.
Square Feet
Occupied In
ventory (SF)
Data Sourc
9,000,000
10,000,000
11,000,000
12,000,000
13,000,000
14,000,000
15,000,000
16,000,000
17,000,000
S
Inven
10,000,000
10,500,000
11,000,000
11,500,000
12,000,000
12,500,000
13,000,000
13,500,000
14,000,000
14,500,000
15,000,000
De
ce: Altarum An
0.46%
0.38%
1.07%
2.
2003
2004
2005
Supply of
ntory of Med
1.15%
0.66%
1.37%
1.30%
2003
2004
2005
2006
emand fo
E
Data
E
alysis of Burea
%
.26%
3.81%
5.71%
2.07
2006
2007
2008
2009
Medical
dical Office S
3.65%
1.67%
‐1.29%
0.
2006
2007
2008
2009
or Medica
Exhibit 9
a Source: CoSta
Exhibit 10
au of Labor Sta
7%
0.61%0.33%
2.43%
2
2009
2010
2011
2012
Office Sp
Space (SF)
%
%
.63%
1.78%
2.09%
2.10%
2010
2011
2012
2013
al Office S
ar and BMC
tistics and U.S
%
2.22%
2.07%
1.95%
1.8
2013
2014
2015
pace, SD C
Growth
%
2.20%
2.25%
2.30%
2.4
2014
2015
2016
2017
Space, SD
. Census Burea
86%
1.80%
1.75%
1.71
2016
2017
2018
2019
County
h Rate in Inv
40%
2.50%
2.70%
2.80%
2017
2018
2019
2020
D County
au data
1%
2.71%
0.00%
1.00%
2.00%
3.00%
4.00%
5.00%
6.00%
2019
2020
entory
%
‐2.00%
‐1.00%
0.00%
1.00%
2.00%
3.00%
4.00%
Growth Rate
%
%
%
%
%
%
%
1
1
1
1
1
2
2
2
2
2
3
Data Source
1.0%
1.2%
1.4%
1.6%
1.8%
2.0%
2.2%
2.4%
2.6%
2.8%
3.0%
200
N
e: Altarum Ana
1.8%
06 20
ational A
E
alysis of Bureau
2.5%
007 20
Annual GEmp
Exhibit 11
u of Labor Stat
2.8%
008 20
Growth ploymen
tistics and U.S.
2.1%
1
009 2
in Healtnt
Census Burea
1.6%
2010 2
th Care
u data
1.5%
2011
Price per Square Foot Per Year
$300
$320
$340
$360
$380
$400
$420
$440
$460
$480
10.2
$25.00
$27.00
$29.00
$31.00
$33.00
$35.00
$37.00
$39.00
200
Va
$33
0.00
0.00
0.00
0.00
0.00
0.00
0.00
0.00
0.00
0.00
2012
2%
13.1%
08 2009 2010
Vacancy R
35.63
2 2013
Medi
E
Data Sour
E
Data
13.1%
11.9%
12.2%
1
0 2011 2012 2
ates and
Rent Valu
2014 20
ical Offic
Exhibit 12
ce: CoStar and
Exhibit 13
a Source: BMC
12.3%
12.2%
11.
2013 2014 20
Rental R
ue Vac
15 2016
ce Value
d BMC
.9%
11.5%
11.0%
015 2016 2017
Rates, SD
cancy Rate
2017 2
es Foreca
%
10.3%
9.5%
7 2018 2019
County
2018 2019
ast
9.4%
8.0%
9.0%
10.0%
11.0%
12.0%
13.0%
14.0%
2020
$457.19
9 2020
%
%
%
%
%
Recommended