FOR THENAGA REGION
EXECUTIVE SUMMARY2009
2 Towards Zero Net Emissions for the NAGA Region: Executive Summary 2009
CITY OFHUME
CITY OFWHITTLESEA
CITY OFWHITTLESEA
SHIRE OFNILLUMBIKSHIRE OF
NILLUMBIK
CITY OFBANYULE
CITY OFMANNINGHAM
CITY OFDAREBIN
CITY OFMORELAND
CITY OFMELBOURNE CITY OF
YARRA
VICTORIA
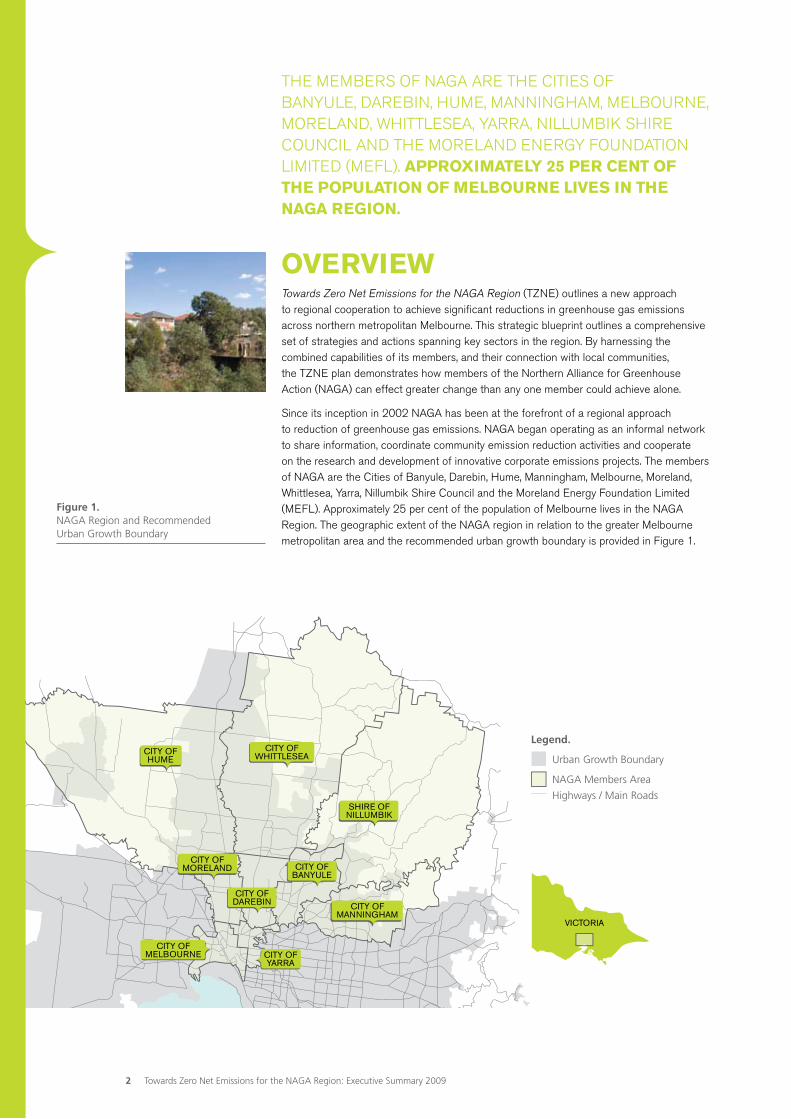
Towards Zero Net Emissions for the NAGA Region (TZNE) outlines a new approach to regional cooperation to achieve significant reductions in greenhouse gas emissions across northern metropolitan Melbourne. This strategic blueprint outlines a comprehensive set of strategies and actions spanning key sectors in the region. By harnessing the combined capabilities of its members, and their connection with local communities, the TZNE plan demonstrates how members of the Northern Alliance for Greenhouse Action (NAGA) can effect greater change than any one member could achieve alone.
Since its inception in 2002 NAGA has been at the forefront of a regional approach to reduction of greenhouse gas emissions. NAGA began operating as an informal network to share information, coordinate community emission reduction activities and cooperate on the research and development of innovative corporate emissions projects. The members of NAGA are the Cities of Banyule, Darebin, Hume, Manningham, Melbourne, Moreland, Whittlesea, Yarra, Nillumbik Shire Council and the Moreland Energy Foundation Limited (MEFL). Approximately 25 per cent of the population of Melbourne lives in the NAGA Region. The geographic extent of the NAGA region in relation to the greater Melbourne metropolitan area and the recommended urban growth boundary is provided in Figure 1.
THE MEMBERS oF NAGA ARE THE CiTiES oF BANYuLE, DAREBiN, HuME, MANNiNGHAM, MELBouRNE, MoRELAND, WHiTTLESEA, YARRA, NiLLuMBik SHiRE CouNCiL AND THE MoRELAND ENERGY FouNDATioN LiMiTED (MEFL). approximately 25 per cent of the population of melbourne liVeS in the naGa reGion.
Legend.
Urban Growth Boundary
NAGA Members Area
Highways / Main Roads
oVerVieW
Figure 1. NAGA Region and Recommended Urban Growth Boundary
3
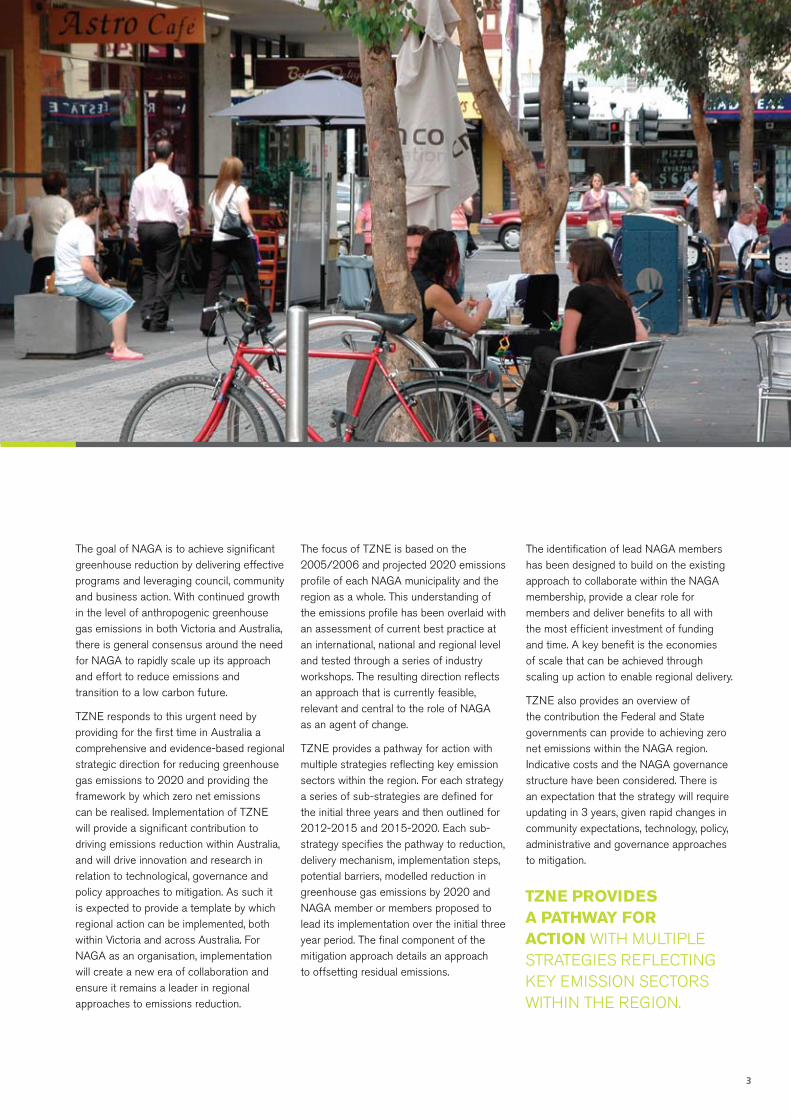
The goal of NAGA is to achieve significant greenhouse reduction by delivering effective programs and leveraging council, community and business action. With continued growth in the level of anthropogenic greenhouse gas emissions in both Victoria and Australia, there is general consensus around the need for NAGA to rapidly scale up its approach and effort to reduce emissions and transition to a low carbon future.
TZNE responds to this urgent need by providing for the first time in Australia a comprehensive and evidence-based regional strategic direction for reducing greenhouse gas emissions to 2020 and providing the framework by which zero net emissions can be realised. implementation of TZNE will provide a significant contribution to driving emissions reduction within Australia, and will drive innovation and research in relation to technological, governance and policy approaches to mitigation. As such it is expected to provide a template by which regional action can be implemented, both within Victoria and across Australia. For NAGA as an organisation, implementation will create a new era of collaboration and ensure it remains a leader in regional approaches to emissions reduction.
The focus of TZNE is based on the 2005/2006 and projected 2020 emissions profile of each NAGA municipality and the region as a whole. This understanding of the emissions profile has been overlaid with an assessment of current best practice at an international, national and regional level and tested through a series of industry workshops. The resulting direction reflects an approach that is currently feasible, relevant and central to the role of NAGA as an agent of change.
TZNE provides a pathway for action with multiple strategies reflecting key emission sectors within the region. For each strategy a series of sub-strategies are defined for the initial three years and then outlined for 2012-2015 and 2015-2020. Each sub-strategy specifies the pathway to reduction, delivery mechanism, implementation steps, potential barriers, modelled reduction in greenhouse gas emissions by 2020 and NAGA member or members proposed to lead its implementation over the initial three year period. The final component of the mitigation approach details an approach to offsetting residual emissions.
The identification of lead NAGA members has been designed to build on the existing approach to collaborate within the NAGA membership, provide a clear role for members and deliver benefits to all with the most efficient investment of funding and time. A key benefit is the economies of scale that can be achieved through scaling up action to enable regional delivery.
TZNE also provides an overview of the contribution the Federal and State governments can provide to achieving zero net emissions within the NAGA region. indicative costs and the NAGA governance structure have been considered. There is an expectation that the strategy will require updating in 3 years, given rapid changes in community expectations, technology, policy, administrative and governance approaches to mitigation.
tZne proVideS a pathWay for action WiTH MuLTipLE STRATEGiES REFLECTiNG kEY EMiSSioN SECToRS WiTHiN THE REGioN.

4 Towards Zero Net Emissions for the NAGA Region: Executive Summary 2009
Man
ufac
turin
g (s
tatio
nary
)
Com
mer
cial
(st
atio
nary
)
Res
iden
tial (
stat
iona
ry)
Non
-Fre
ight
Roa
d
Frei
ght R
oad
Com
mer
cial
and
Indu
stria
l Was
te
Pub
lic T
rans
port
Non
-ene
rgy
min
ing
(sta
tiona
ry)
Mun
icip
al W
aste
Rai
l Fre
ight
Con
stru
ctio
n an
d D
emol
ition
Was
te
Ser
vice
s to
Tra
nspo
rt (
stat
iona
ry)
Wat
er (
stat
iona
ry)
Con
stru
ctio
n (s
tatio
nary
)
Agr
icul
ture
(st
atio
nary
)
Agr
icul
tura
l
Land
-use
cha
nge
Was
te W
ater
Sec
tor
kt CO2-e
7,000
6,000
5,000
4,000
3,000
2,000
1,000
0
The NAGA region represents a diverse range of urban forms from inner city to rural fringe and this is reflected in the regional emissions profile, with no one sector dominating. The largest contributors to regional emissions are the industrial, commercial and residential sectors. private vehicle use provides the fourth largest contribution to emissions within the NAGA region. Figure 2 illustrates the relative contribution of each sector to emissions across the region and the predicted change to 2020 under a business as usual scenario. over this period there is expected to be a relative decline in the contribution to emissions from the manufacturing sector and an increase from the residential and commercial sectors, reflecting the changing nature of employment and continued population and residential growth within the NAGA region.
The total greenhouse gas emissions of the NAGA region for 2005/2006 were 21,051 kilotonnes of carbon dioxide equivalents (kt Co2-e) and this is projected to grow by 18.8 per cent to 25,012 kt Co2-e in 2020 without the implementation of TZNE. Growth in emissions is primarily attributed to the growth in the number of households and population predicted over the period from 2005/2006 to 2020.
emiSSionS profile
Figure 2. NAGA region emissions profile by sector (2005/2006 to 2020)
THE NAGA REGioN REpRESENTS a diVerSe ranGe of urban formS FRoM iNNER CiTY, To RESiDENTiAL AND RuRAL FRiNGE AND THiS iS REFLECTED iN THE REGioNAL EMiSSioNS pRoFiLE, WiTH No oNE SECToR DoMiNATiNG.
2005/2006
2020
5
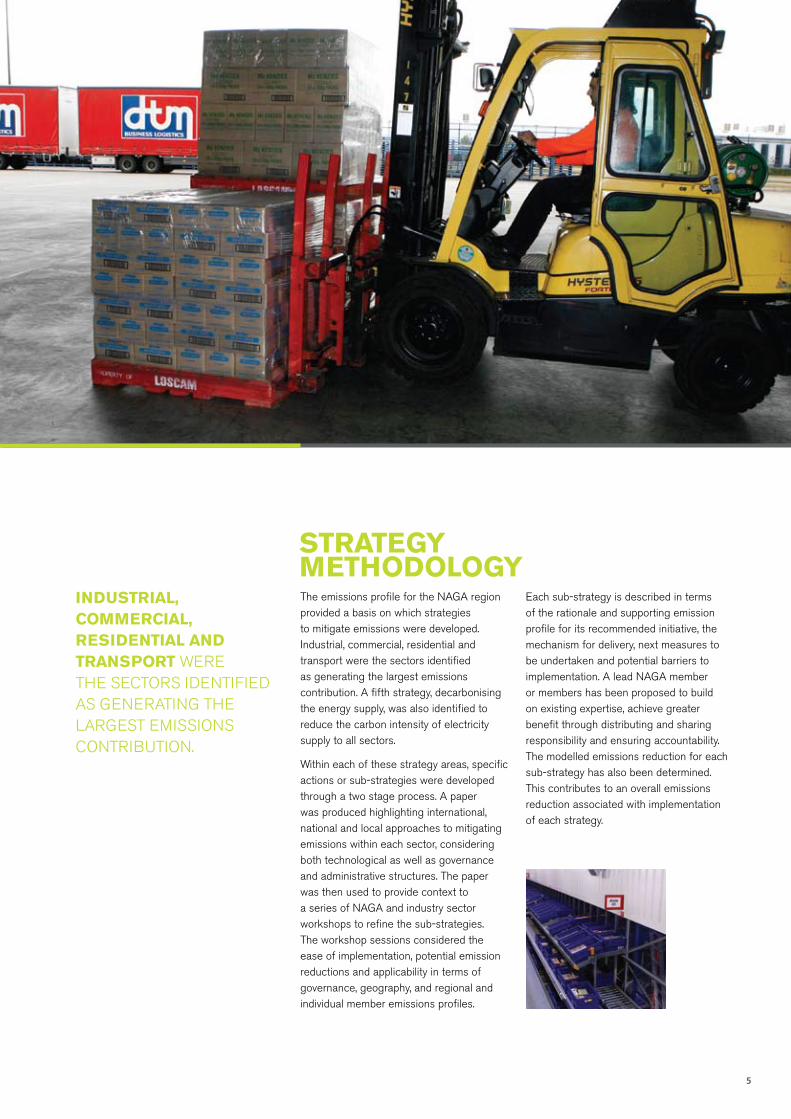
The emissions profile for the NAGA region provided a basis on which strategies to mitigate emissions were developed. industrial, commercial, residential and transport were the sectors identified as generating the largest emissions contribution. A fifth strategy, decarbonising the energy supply, was also identified to reduce the carbon intensity of electricity supply to all sectors.
Within each of these strategy areas, specific actions or sub-strategies were developed through a two stage process. A paper was produced highlighting international, national and local approaches to mitigating emissions within each sector, considering both technological as well as governance and administrative structures. The paper was then used to provide context to a series of NAGA and industry sector workshops to refine the sub-strategies. The workshop sessions considered the ease of implementation, potential emission reductions and applicability in terms of governance, geography, and regional and individual member emissions profiles.
Each sub-strategy is described in terms of the rationale and supporting emission profile for its recommended initiative, the mechanism for delivery, next measures to be undertaken and potential barriers to implementation. A lead NAGA member or members has been proposed to build on existing expertise, achieve greater benefit through distributing and sharing responsibility and ensuring accountability. The modelled emissions reduction for each sub-strategy has also been determined. This contributes to an overall emissions reduction associated with implementation of each strategy.
StrateGy methodoloGy
induStrial, commercial, reSidential and tranSport WERE THE SECToRS iDENTiFiED AS GENERATiNG THE LARGEST EMiSSioNS CoNTRiBuTioN.

6 Towards Zero Net Emissions for the NAGA Region: Executive Summary 2009
Table 2. Commercial Strategy
Sector StrateGieS
induStrial StrateGy Emissions from the industrial sector comprised 28 per cent of overall emissions and 38 per cent of all stationary energy emissions for the period 2005/2006, representing the largest source of emissions in the NAGA region. By 2020, annual industrial emissions are projected to rise by 6,150 kt Co2-e, representing 24 per cent of overall emissions. Modelling of the sub-strategies contained in the industrial strategy indicate that by 2020 these emissions can be reduced by 1,873 kt Co2-e through implementation of the strategy contained in Table 1.
implementation of an industrial efficiency program City of Darebin and Hume
implementation of an industrial ecology program for key industrial areas within Cities of Hume and Whittlesea the NAGA region
Development of a central services hub/s for electricity, waste and water for key MEFL and City of Moreland industrial areas
Existing commercial office buildings City of Melbourne
Wholesale and retail, and health and education sectors efficiency programWholesale and retail sector Cities of Hume and Yarra �Health and education sector City of Melbourne �
information provision, training and advocacy of existing voluntary programs to wholesale MEFL and City of Yarra and retail sector
Health and education and large wholesale and retail cogeneration MEFL
commercial StrateGy The commercial sector within NAGA represented 26.2 per cent of total emissions in 2005/2006 and by 2020 is expected to represent 27.5 per cent, or 6,877 kt Co2-e. implementation of the sub-strategies contained within the commercial strategy as outlined in Table 2 is projected to decrease these emissions by 1,159 kt Co2-e per annum by 2020.
SuB-STRATEGiES pRopoSED LEAD NAGA MEMBER/S
SuB-STRATEGiES pRopoSED LEAD NAGA MEMBER/S
Table 1. Industrial Strategy

7
Table 3. Residential Strategy
Table 4. Decarbonising Energy Supply
Table 5. Transport Strategy
reSidential StrateGy Residential sector emissions in the NAGA region in 2005/2006 were 17.1 per cent of total emissions. Due to the projected increase in population within the NAGA region to 2020, the overall proportion of emissions from this sector is anticipated to increase to 19.5 per cent, or 4,893 kt Co2-e. The approach to mitigating emissions within the residential sector is provided in Table 3 and is modelled to provide an annual reduction of 1,317 kt Co2-e of emissions by 2020.
decarboniSinG enerGy Supply A significant portion of Victoria’s energy is supplied through brown coal, the most greenhouse gas intense form of energy generation. in addition up to 3.5% of energy is lost to the network through the generation of heat during transmission from remote locations and subsequent distribution to urban areas. While demand reduction and efficiency measures can reduce the need for energy, underlying pressures from population and subsequent increases in housing stock and commercial and industrial facilities will, to a degree, nullify the effect of these measures without a strategy that addresses the need to decarbonise the energy supply. Table 4 outlines the approach to decarbonising the energy supply within the NAGA region. When implemented, it is expected to contribute to a reduction of 1,579 kt Co2-e per annum by 2020.
tranSport StrateGy The transport sector was calculated as comprising 20.9 per cent of emissions for the NAGA region, representing 4,420 kt Co2-e for 2005/2006 and increasing to 5,231 kt Co2-e by 2020. Within the transport sector, private vehicle use provides the largest contribution to emissions. implementation of the sub-strategies contained in Table 5 is predicted to reduce annual emissions by 158 kt Co2-e by 2020.
Existing residential built formExpansion of existing programs for low-income segment MEFL and City of Moreland �Homeowner energy efficiency program City of Manningham �Establish program for efficiency upgrades to rentals through real-estates agents City of Yarra �
and landlords
influencing future built formindividual residences Cities of Moreland and Whittlesea �Estate guidance Cities of Moreland and Whittlesea �
Addressing institutional barriers to installation of low emission and renewable technologies City of Melbourne
Facilitation of low emission and renewable technologies: Cities of Melbourne, City of Yarra, within commercial, residential and industrial built form City of Darebin and Shire Nillumbik �as stand alone generators �
Transport advocacy Cities of Melbourne and Whittlesea
The development of a regional Cycling and Walking Strategy City of Manningham and Melbourne
Development of Community Transport programs and plans City of Darebin
Establishment of electric vehicle network Cities of Melbourne, Whittlesea and MEFL
SuB-STRATEGiES pRopoSED LEAD NAGA MEMBER/S
SuB-STRATEGiES pRopoSED LEAD NAGA MEMBER/S
SuB-STRATEGiES pRopoSED LEAD NAGA MEMBER/S

8 Towards Zero Net Emissions for the NAGA Region: Executive Summary 2009
Figure 3. NAGA region emissions profile (Business as Usual and TZNE scenarios)
2005/2006
21,051
kt CO2-e
Year
30,000
25,000
20,000
15,000
10,000
5,000
02020
18,926
6086
THRouGH THE iMpLEMENTATioN oF EACH STRATEGY iT iS pREDiCTED THAT an annual emiSSionS reduction of 6,086 kt co2-e can be achieVed by 2020.
TZNE emissions reduction
NAGA regional emissions
Each of the five mitigation strategies provides a contribution to emissions reduction and represents a balance between our current understanding of what can be practically achieved by 2020, the need for significant emissions reduction and the capability of NAGA members to progress mitigation actions.
Through the implementation of each strategy it is predicted that an annual emissions reduction of 6,086 kt Co2-e, or 24.3 per cent, can be achieved by 2020. The proportion of emissions reduction in comparison with a business-as-usual scenario is provided in Figure 3.
emiSSionS reduction

9
federal, State and indiVidual council contribution TZNE represents a regional approach to greenhouse gas reduction. it demonstrates what can be achieved to move towards zero net emissions by 2020 through leadership, advocacy and driving innovation. A range of issues that will influence the future emissions profile of the NAGA region, including a reduction target under an emissions trading scheme, the density and energy efficiency of new development, and public transport provision, rest with other levels of Government. They, in turn are influenced by the demands and pressures placed on them by business and the community.
To achieve zero net emissions there will need to be alignment and concerted effort in regards to policies and actions by the Federal and State Governments, individual Local Governments’ mitigation strategies and the contribution of businesses and individuals. These multiple contributions are required to achieve significantly greater reductions demanded by the climate science. TZNE represents a realistic step in the process.
offSet StrateGy The final element is to offset the residual emissions, whereby emission reductions are carried out by a third-party. Within the existing Federal Government policy context of a proposed Carbon pollution Reduction Scheme (CpRS), the strategy outlines the three options for NAGA members to offset emissions, namely:
purchase of international offsets �Establishment of biosequestration �purchasing units from within the CpRS. �
To finance the offset program it is proposed that NAGA establish an offset fund to assist member Councils and community members to reach a zero net position. A centralised fund will reduce transaction costs and ensure the purchase of high quality offsets.
The proportion of emissions to be offset will be dependent on the contribution of Federal and State policies on emissions reduction.
reSidual emiSSionS
multiple contributionS are required To ACHiEVE SiGNiFiCANTLY GREATER REDuCTioNS DEMANDED BY THE CLiMATE SCiENCE.

10 Towards Zero Net Emissions for the NAGA Region: Executive Summary 2009
TZNE presents a new approach to collaboration at a regional level. Based on analysis of local and regional emissions profiles, it provides a comprehensive pathway to achieve greenhouse gas reductions in northern metropolitan Melbourne. TZNE outlines the enabling role that local governments can play in driving change, made stronger by combining efforts and leveraging their connection to local communities.
A summary of the applicability of each strategy and the supporting sub-strategies to each NAGA municipality is provided in Table 6. The full TZNE report (accessible from www.naga.org.au) provides detailed actions and timeframes for each of the strategic areas and defined sub-strategies and in doing so provides clear direction for NAGA members to 2020.
TZNE will guide a new era of collaborative action for NAGA and will provide a significant contribution to driving emissions reduction within Australia.
reGional collaboration
Towards Zero Net Emissions for the NAGA Region is an initiative of the Northern Alliance for Greenhouse Action, developed by Arup, in consultation with the NAGA membership. The project was funded under the Victorian Government’s Sustainability Fund through the Victorian Local Sustainability Accord.
Copies of the full version of the Towards Zero Net Emissions for the NAGA Region are available electronically on the Northern Alliance for Greenhouse Action website, www.naga.org.au
printed on recycled paper made from 100% post consumer waste.
*
TZNE ouTLiNES THE ENABLiNG RoLE THAT LoCAL GoVERNMENTS CAN pLAY iN DRiViNG CHANGE, MADE STRoNGER BY combininG effortS and leVeraGinG their connection To LoCAL CoMMuNiTiES.

11
PP H
igh
App
licat
ion
P
Pote
ntia
l App
licat
ion
– Li
mite
d A
pplic
atio
n
Ban
yule
D
areb
in
Hum
e M
anni
ngha
m
Mel
bour
ne
Mor
elan
d N
illum
bik
Whi
ttle
sea
Yarr
a
STR
ATE
GY
pR
oJE
CTE
D E
MiS
Sio
NS
R
ED
uC
Tio
N p
ER
A
NN
uM
BY
20
20
No
RTH
ER
N A
LLiA
NC
E F
oR
GR
EE
NH
ou
SE
AC
Tio
N–
LoC
AL
Go
VE
RN
ME
NT
AR
EA
S
tota
l 6,
036
24.3
%
(kt
Co
2-e
) (%
)
Tab
le 6
. Su
mm
ary
of s
trat
egy
appl
icat
ion
acro
ss
NA
GA
Loc
al G
over
nmen
t A
reas
Larg
est
Sour
ce
of E
mis
sion
s
Low
est
Sour
ce
of E
mis
sons
ind
ust
rial
1,
873
7.5%
indu
stria
l effi
cien
cy
68
8
2.8
%
P
PP
PP
–
P
PP
–
PP
PP
indu
stria
l eco
logy
4
2
0.2
%
P
PP
PP
–
P
PP
–
PP
PP
Cen
tral
ser
vice
s hu
bs
1,1
42
4
.6%
P
PP
PP
–
PP
PP
–
PP
PP
co
mm
erci
al
1,15
9 4.
6%
Exi
stin
g co
mm
erci
al o
ffice
bui
ldin
gs
38
3
1.5
%
P
PP
PP
PP
PP
PP
P
PP
PP
Who
lesa
le &
ret
ail a
nd e
duca
tion
& h
ealth
67
8
2.7
%
P
PP
PP
PP
PP
PP
P
PP
PP
ef
ficie
ncy
prog
ram
Who
lesa
le &
ret
ail e
xist
ing
prog
ram
s pa
rtic
ipat
ion
3
0.0
%
P
PP
PP
PP
PP
PP
P
PP
PP
Hea
lth, e
duca
tion
and
larg
e sc
ale
reta
il co
gene
ratio
n 9
5
0.4
%
P
PP
PP
PP
PP
PP
P
PP
PP
res
iden
tial
1,
317
5.3%
Exi
stin
g bu
ilt f
orm
4
68
1
.9%
PP
PP
PP
PP
PP
PP
PP
PP
PP
Futu
re b
uilt
form
8
49
3
.4%
PP
PP
PP
PP
PP
PP
PP
PP
PP
dec
arb
on
isin
g e
ner
gy
1,57
9 6.
3%
Add
ress
inst
itutio
nal b
arrie
rs to
ren
ewab
les
–
0.0
%
pro
mot
ion
of e
mbe
dded
ren
ewab
les
1,5
79
6.3
%
PP
PP
PP
PP
PP
PP
PP
PP
PP
tran
spo
rt
158
0.6%
Tran
spor
t adv
ocac
y –
0
.0%
PP
PP
PP
PP
PP
PP
PP
PP
PP
Reg
iona
l cyc
ling
and
wal
king
str
ateg
y 5
5
0.2
%
PP
PP
PP
PP
PP
PP
PP
PP
PP
Com
mun
ity tr
avel
pla
n 71
0
.3%
PP
PP
PP
PP
PP
PP
PP
PP
PP
Ele
ctric
al c
ar n
etw
ork
base
d on
ren
ewab
les
32
0
.1%
PP
PP
PP
PP
PP
PP
PP
PP
PP

naGa - northern alliance for GreenhouSe action
c/- Moreland Energy Foundation Limited Level One 233 Sydney Road Brunswick PO Box 276 Brunswick 3056 Telephone 03 9385 8504 Facsimile 03 9385 8586 www.naga.org.au
MEMBER oRGANiSATioNS
Victorian LocalSustainability Accord
SuppoRTiNG pARTNER
Recommended