1
Food Security Assessment in Northern Rakhine State
Myanmar
February 2011
Prepared by Claudia Ah Poe, Food Security Analysis Services (ODXF)
2
Table of Contents
Key messages
1. Background
2. Objectives and methodology
3. Food security status and trends
3.1 How many are food insecure?
3.2 Where are the food insecure?
3.3 Who are the food insecure?
3.3.1 Demography
3.3.2 Livelihoods
3.3.3 Asset ownership
4. Key vulnerability issues and opportunities
4.1 Agriculture
4.2 Migration
4.3 Indebtedness
4.4 Education
4.4 Water and sanitation
4.5 Shocks and coping
5. Towards ensuring food security
3
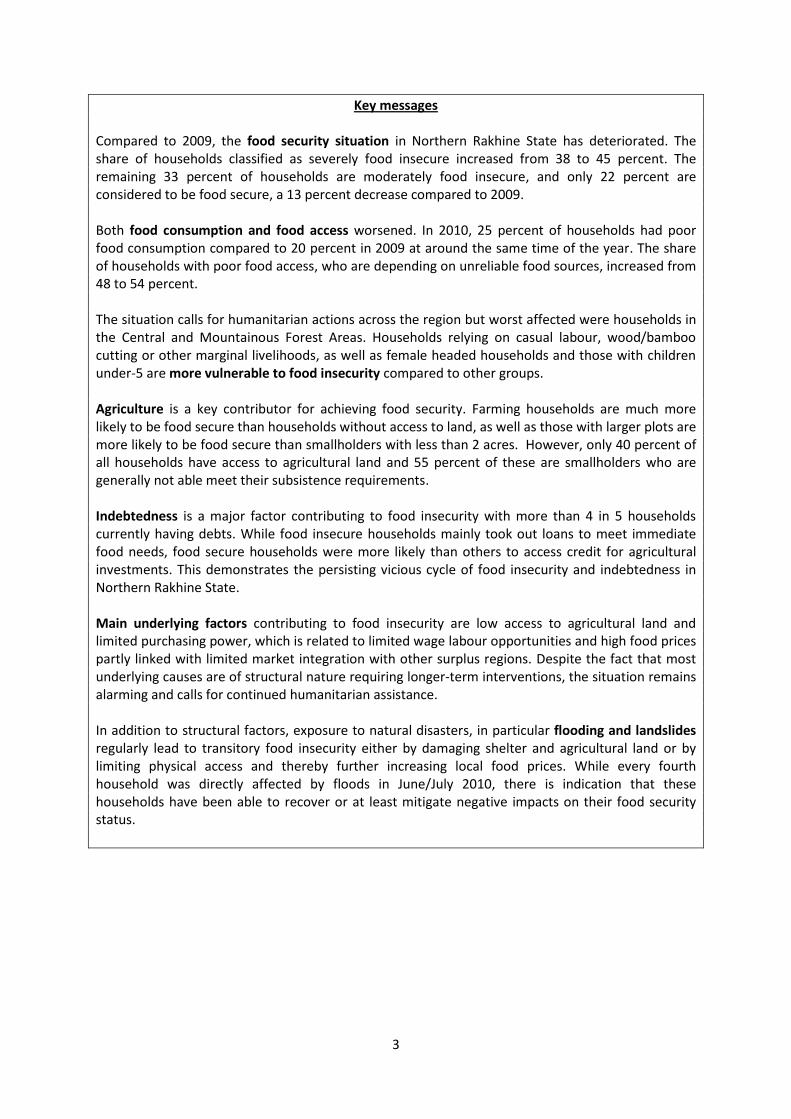
Key messages Compared to 2009, the food security situation in Northern Rakhine State has deteriorated. The share of households classified as severely food insecure increased from 38 to 45 percent. The remaining 33 percent of households are moderately food insecure, and only 22 percent are considered to be food secure, a 13 percent decrease compared to 2009. Both food consumption and food access worsened. In 2010, 25 percent of households had poor food consumption compared to 20 percent in 2009 at around the same time of the year. The share of households with poor food access, who are depending on unreliable food sources, increased from 48 to 54 percent. The situation calls for humanitarian actions across the region but worst affected were households in the Central and Mountainous Forest Areas. Households relying on casual labour, wood/bamboo cutting or other marginal livelihoods, as well as female headed households and those with children under-5 are more vulnerable to food insecurity compared to other groups. Agriculture is a key contributor for achieving food security. Farming households are much more likely to be food secure than households without access to land, as well as those with larger plots are more likely to be food secure than smallholders with less than 2 acres. However, only 40 percent of all households have access to agricultural land and 55 percent of these are smallholders who are generally not able meet their subsistence requirements. Indebtedness is a major factor contributing to food insecurity with more than 4 in 5 households currently having debts. While food insecure households mainly took out loans to meet immediate food needs, food secure households were more likely than others to access credit for agricultural investments. This demonstrates the persisting vicious cycle of food insecurity and indebtedness in Northern Rakhine State. Main underlying factors contributing to food insecurity are low access to agricultural land and limited purchasing power, which is related to limited wage labour opportunities and high food prices partly linked with limited market integration with other surplus regions. Despite the fact that most underlying causes are of structural nature requiring longer-term interventions, the situation remains alarming and calls for continued humanitarian assistance. In addition to structural factors, exposure to natural disasters, in particular flooding and landslides regularly lead to transitory food insecurity either by damaging shelter and agricultural land or by limiting physical access and thereby further increasing local food prices. While every fourth household was directly affected by floods in June/July 2010, there is indication that these households have been able to recover or at least mitigate negative impacts on their food security status.
4
1. Background
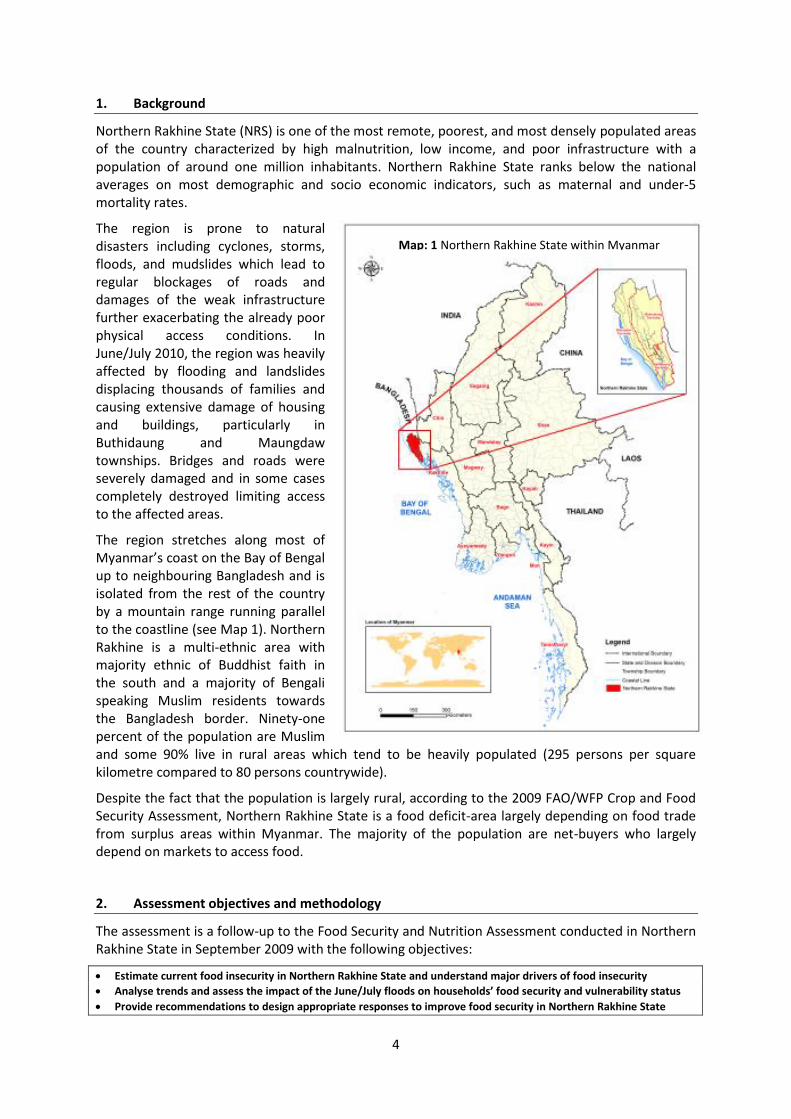
Northern Rakhine State (NRS) is one of the most remote, poorest, and most densely populated areas of the country characterized by high malnutrition, low income, and poor infrastructure with a population of around one million inhabitants. Northern Rakhine State ranks below the national averages on most demographic and socio economic indicators, such as maternal and under-5 mortality rates.
The region is prone to natural disasters including cyclones, storms, floods, and mudslides which lead to regular blockages of roads and damages of the weak infrastructure further exacerbating the already poor physical access conditions. In June/July 2010, the region was heavily affected by flooding and landslides displacing thousands of families and causing extensive damage of housing and buildings, particularly in Buthidaung and Maungdaw townships. Bridges and roads were severely damaged and in some cases completely destroyed limiting access to the affected areas.
The region stretches along most of Myanmar’s coast on the Bay of Bengal up to neighbouring Bangladesh and is isolated from the rest of the country by a mountain range running parallel to the coastline (see Map 1). Northern Rakhine is a multi-ethnic area with majority ethnic of Buddhist faith in the south and a majority of Bengali speaking Muslim residents towards the Bangladesh border. Ninety-one percent of the population are Muslim and some 90% live in rural areas which tend to be heavily populated (295 persons per square kilometre compared to 80 persons countrywide).
Despite the fact that the population is largely rural, according to the 2009 FAO/WFP Crop and Food Security Assessment, Northern Rakhine State is a food deficit-area largely depending on food trade from surplus areas within Myanmar. The majority of the population are net-buyers who largely depend on markets to access food.
2. Assessment objectives and methodology
The assessment is a follow-up to the Food Security and Nutrition Assessment conducted in Northern Rakhine State in September 2009 with the following objectives:
Estimate current food insecurity in Northern Rakhine State and understand major drivers of food insecurity
Analyse trends and assess the impact of the June/July floods on households’ food security and vulnerability status
Provide recommendations to design appropriate responses to improve food security in Northern Rakhine State
Map: 1 Northern Rakhine State within Myanmar
5
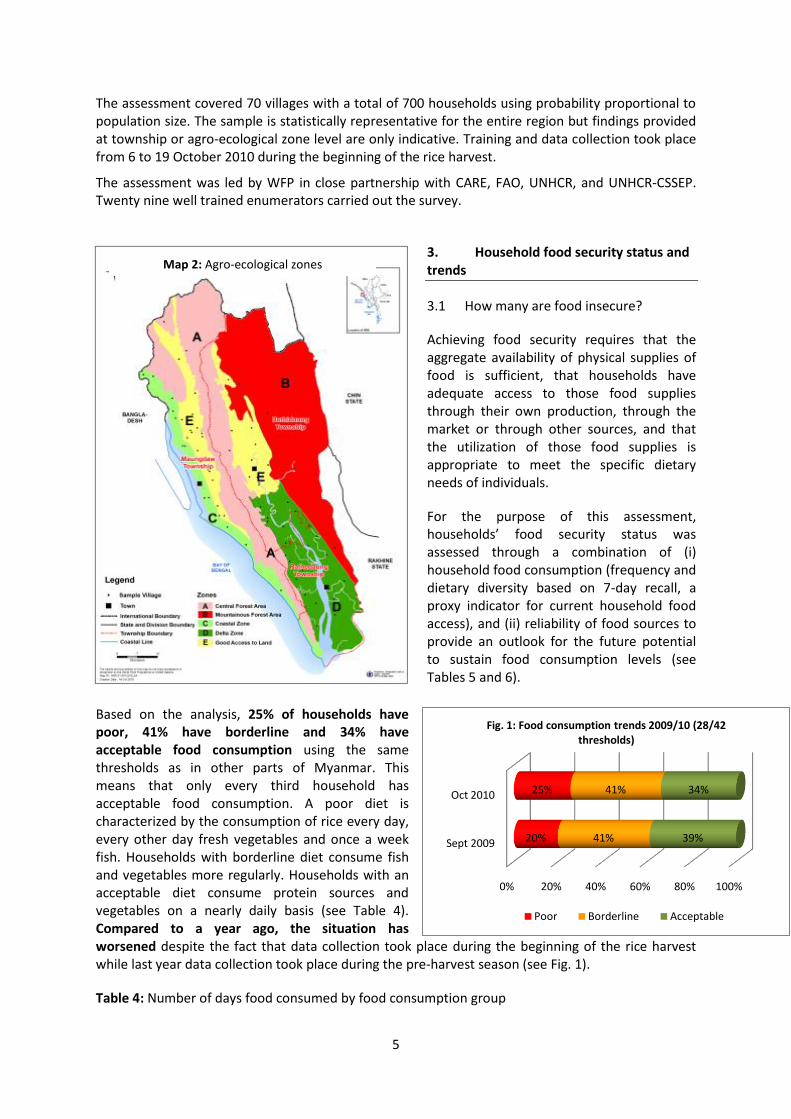
The assessment covered 70 villages with a total of 700 households using probability proportional to population size. The sample is statistically representative for the entire region but findings provided at township or agro-ecological zone level are only indicative. Training and data collection took place from 6 to 19 October 2010 during the beginning of the rice harvest.
The assessment was led by WFP in close partnership with CARE, FAO, UNHCR, and UNHCR-CSSEP. Twenty nine well trained enumerators carried out the survey.
3. Household food security status and trends
3.1 How many are food insecure?
Achieving food security requires that the aggregate availability of physical supplies of food is sufficient, that households have adequate access to those food supplies through their own production, through the market or through other sources, and that the utilization of those food supplies is appropriate to meet the specific dietary needs of individuals.
For the purpose of this assessment, households’ food security status was assessed through a combination of (i) household food consumption (frequency and dietary diversity based on 7-day recall, a proxy indicator for current household food access), and (ii) reliability of food sources to provide an outlook for the future potential to sustain food consumption levels (see Tables 5 and 6).
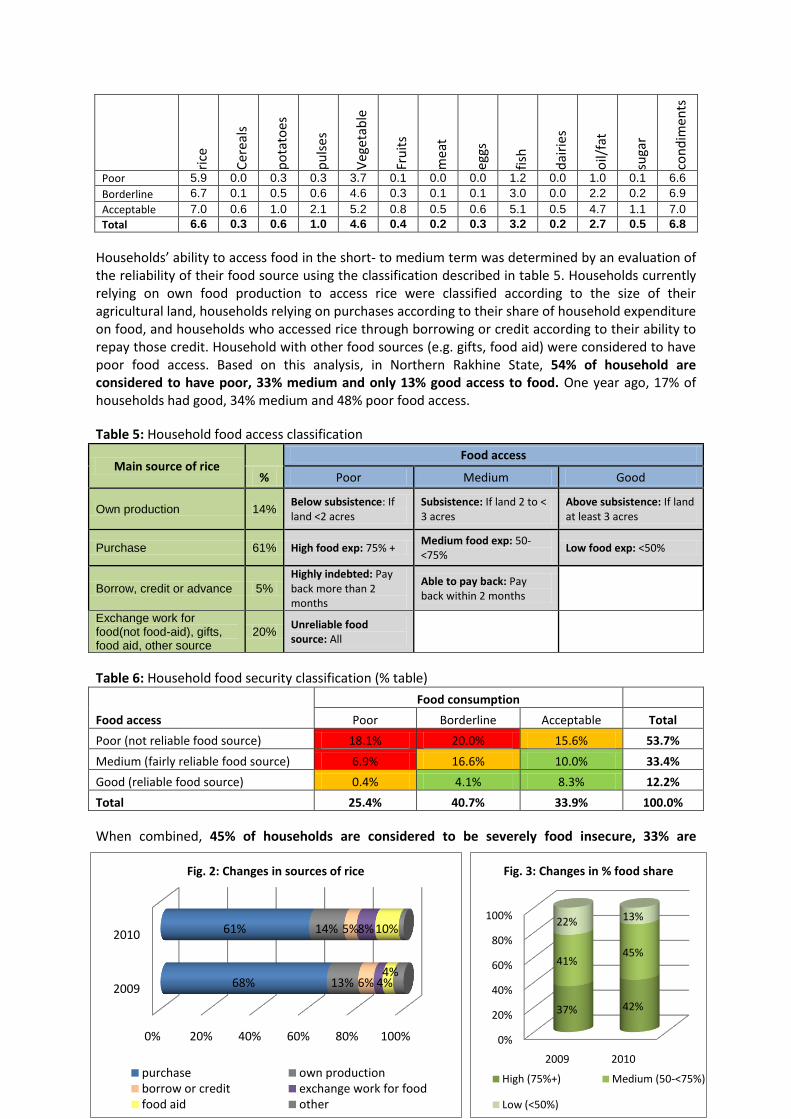
Based on the analysis, 25% of households have poor, 41% have borderline and 34% have acceptable food consumption using the same thresholds as in other parts of Myanmar. This means that only every third household has acceptable food consumption. A poor diet is characterized by the consumption of rice every day, every other day fresh vegetables and once a week fish. Households with borderline diet consume fish and vegetables more regularly. Households with an acceptable diet consume protein sources and vegetables on a nearly daily basis (see Table 4). Compared to a year ago, the situation has worsened despite the fact that data collection took place during the beginning of the rice harvest while last year data collection took place during the pre-harvest season (see Fig. 1).
Table 4: Number of days food consumed by food consumption group
Map 2: Agro-ecological zones
0% 20% 40% 60% 80% 100%
Sept 2009
Oct 2010
20%
25%
41%
41%
39%
34%
Fig. 1: Food consumption trends 2009/10 (28/42 thresholds)
Poor Borderline Acceptable
6
rice
Cer
eals
po
tato
es
pu
lses
Veg
etab
le
Fru
its
mea
t
eggs
fish
dai
ries
oil/
fat
suga
r
con
dim
ents
Poor 5.9 0.0 0.3 0.3 3.7 0.1 0.0 0.0 1.2 0.0 1.0 0.1 6.6
Borderline 6.7 0.1 0.5 0.6 4.6 0.3 0.1 0.1 3.0 0.0 2.2 0.2 6.9
Acceptable 7.0 0.6 1.0 2.1 5.2 0.8 0.5 0.6 5.1 0.5 4.7 1.1 7.0
Total 6.6 0.3 0.6 1.0 4.6 0.4 0.2 0.3 3.2 0.2 2.7 0.5 6.8
Households’ ability to access food in the short- to medium term was determined by an evaluation of the reliability of their food source using the classification described in table 5. Households currently relying on own food production to access rice were classified according to the size of their agricultural land, households relying on purchases according to their share of household expenditure on food, and households who accessed rice through borrowing or credit according to their ability to repay those credit. Household with other food sources (e.g. gifts, food aid) were considered to have poor food access. Based on this analysis, in Northern Rakhine State, 54% of household are considered to have poor, 33% medium and only 13% good access to food. One year ago, 17% of households had good, 34% medium and 48% poor food access.
Table 5: Household food access classification
Main source of rice Food access
% Poor Medium Good
Own production 14% Below subsistence: If land <2 acres
Subsistence: If land 2 to < 3 acres
Above subsistence: If land at least 3 acres
Purchase 61% High food exp: 75% + Medium food exp: 50-<75%
Low food exp: <50%
Borrow, credit or advance 5%
Highly indebted: Pay back more than 2 months
Able to pay back: Pay back within 2 months
Exchange work for food(not food-aid), gifts, food aid, other source
20% Unreliable food source: All
Table 6: Household food security classification (% table)
Food access
Food consumption
Poor Borderline Acceptable Total
Poor (not reliable food source) 18.1% 20.0% 15.6% 53.7%
Medium (fairly reliable food source) 6.9% 16.6% 10.0% 33.4%
Good (reliable food source) 0.4% 4.1% 8.3% 12.2%
Total 25.4% 40.7% 33.9% 100.0%
When combined, 45% of households are considered to be severely food insecure, 33% are
0%
20%
40%
60%
80%
100%
2009 2010
37% 42%
41%45%
22% 13%
Fig. 3: Changes in % food share
High (75%+) Medium (50-<75%)
Low (<50%)
0% 20% 40% 60% 80% 100%
2009
2010
68%
61%
13%
14%
6%
5%
4%
8%
4%
10%
Fig. 2: Changes in sources of rice
purchase own productionborrow or credit exchange work for foodfood aid other
7
moderately food insecure and 22% can be considered to be food secure. The proportion of severely food insecure households has increased compared to a year ago. Using the same methodology, 38% of households were considered to be severely food insecure, 34% moderately food insecure and 36% food secure. The main drivers for this change were decreased food consumption, higher reliance on food assistance, and increased share of food expenditure (see Fig. 1, 2, and 3). Households relying on markets spent more than 70% of their total expenditure on food. Overall, households increased their relative expenditure on food and utilities, while their relative expenditure on health, education and agricultural inputs decreased, an indication for decreased purchasing power.
3.2 Where are the food insecure?
Northern Rakhine State is divided into three townships: Maungdaw, Buthidaung and Rathedaung and covers 5 relatively homogeneous agro-ecological zones based on spatial analysis work conducted by the Food Security Core Group in 2006 using data on land cover, access to main roads, quality of soil, coastal line and rivers (see Map 2 and Table 7).
Table 7: Zone characteristics
Zone Description
Zone A (Central Forest Area) Mountainous and poor access to roads. Agriculture mainly based on shifting cultivation on hills and mountain slopes. Households have access to forests and forests products.
Zone B (Mountainous Forest Area) Similar to zone 1 but in addition very limited physical access (only foot paths) and high risk of insecurity.
Zone C (Coastal Zone) Along the coast line with good access to road infrastructure. Fishing in the sea and ponds (including shrimp cultivation) are the predominant livelihood activities. Soils are salty and only suitable for monsoon paddy. No winter crops are grown.
Zone D (Delta Zone) Good physical access by road and water ways. Agricultural land is fertile due to alluvial soils from the deposition of sediments in the delta zone. Households have access to fishing in numerous rivers and creeks.
Zone E (Good Access to Land) Good physical access combined with availability of arable land enable the cultivation of monsoon/summer paddy and ins some cases winter crops
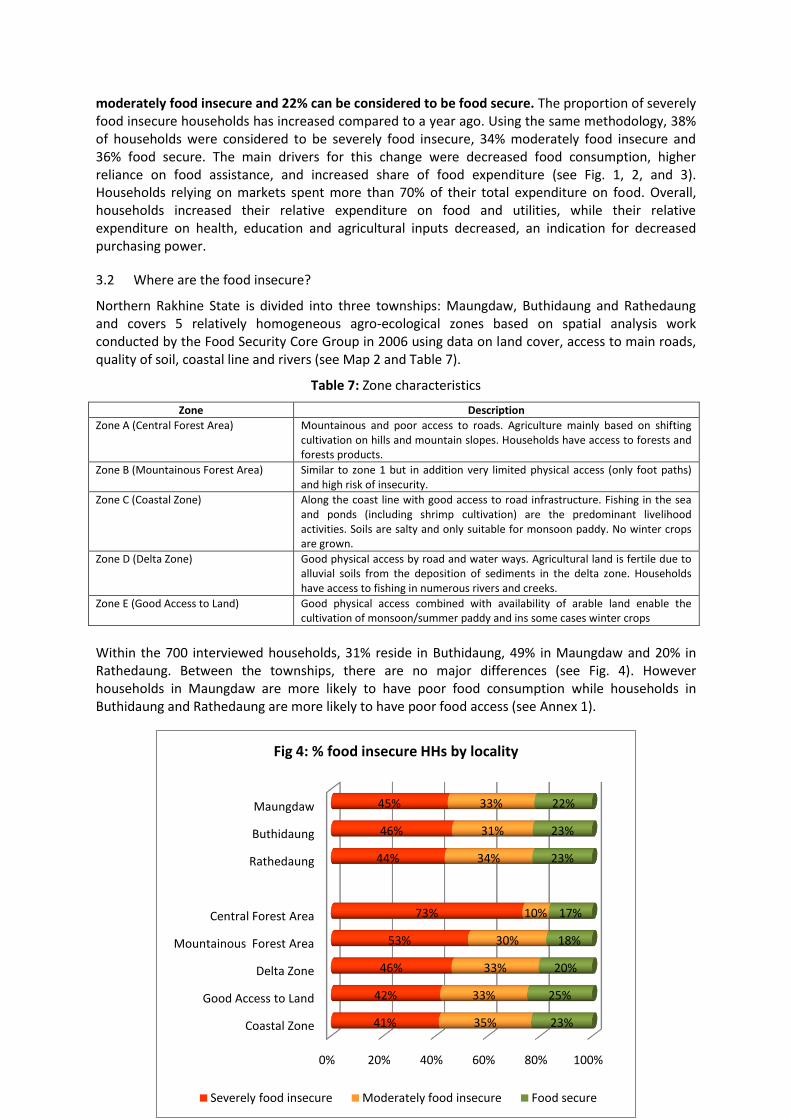
Within the 700 interviewed households, 31% reside in Buthidaung, 49% in Maungdaw and 20% in Rathedaung. Between the townships, there are no major differences (see Fig. 4). However households in Maungdaw are more likely to have poor food consumption while households in Buthidaung and Rathedaung are more likely to have poor food access (see Annex 1).
0% 20% 40% 60% 80% 100%
Coastal Zone
Good Access to Land
Delta Zone
Mountainous Forest Area
Central Forest Area
Rathedaung
Buthidaung
Maungdaw
41%
42%
46%
53%
73%
44%
46%
45%
35%
33%
33%
30%
10%
34%
31%
33%
23%
25%
20%
18%
17%
23%
23%
22%
Fig 4: % food insecure HHs by locality
Severely food insecure Moderately food insecure Food secure
8
The agro-ecological environment seems to be a decisive factor for determining food security in the context of NRS. Though not statistically representative (see Section 2), households interviewed in the “Central” and “Mountainous Forest Areas” tend to be more food insecure compared to households residing in other zones, which are characterized by better physical access and opportunities for either fishing or agricultural activities (see Table 7). Best food consumption levels were observed in the “Coastal” and “Good Access to Land” zones, while the “Delta Zone” has the fewest number of households with poor food access (see also Annex 1).
3.2 Who are the food insecure?
3.2.1 Demography
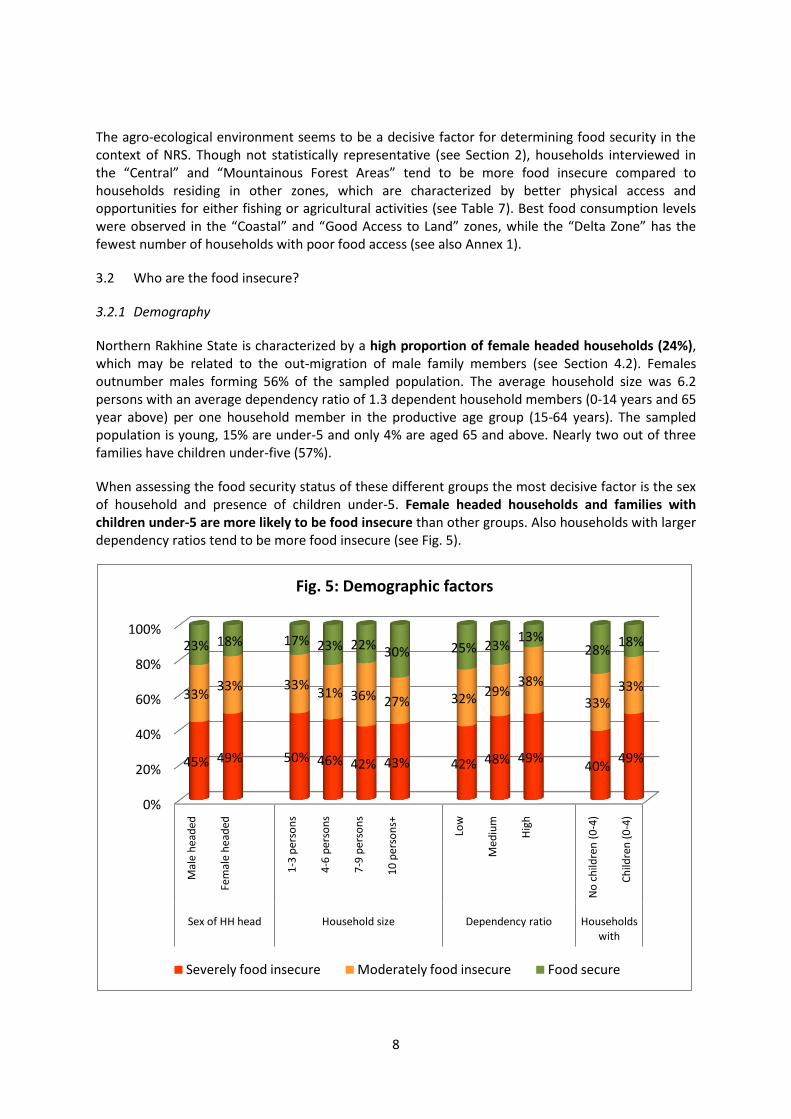
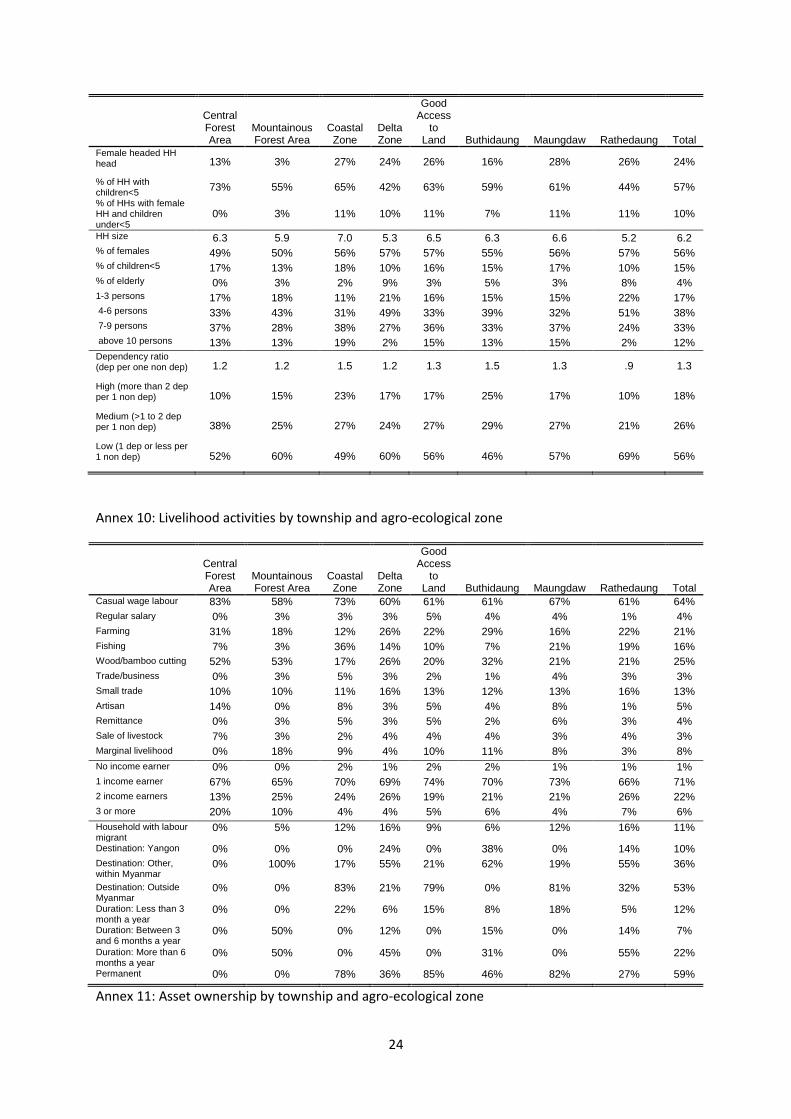
Northern Rakhine State is characterized by a high proportion of female headed households (24%), which may be related to the out-migration of male family members (see Section 4.2). Females outnumber males forming 56% of the sampled population. The average household size was 6.2 persons with an average dependency ratio of 1.3 dependent household members (0-14 years and 65 year above) per one household member in the productive age group (15-64 years). The sampled population is young, 15% are under-5 and only 4% are aged 65 and above. Nearly two out of three families have children under-five (57%).
When assessing the food security status of these different groups the most decisive factor is the sex of household and presence of children under-5. Female headed households and families with children under-5 are more likely to be food insecure than other groups. Also households with larger dependency ratios tend to be more food insecure (see Fig. 5).
0%
20%
40%
60%
80%
100%
Mal
e h
ead
ed
Fem
ale
hea
ded
1-3
per
son
s
4-6
per
son
s
7-9
per
son
s
10
per
son
s+
Low
Med
ium
Hig
h
No
ch
ildre
n (
0-4
)
Ch
ildre
n (
0-4
)
Sex of HH head Household size Dependency ratio Households with
45% 49% 50% 46% 42% 43% 42% 48% 49%40%
49%
33%33% 33%
31% 36% 27% 32% 29%38%
33%33%
23% 18% 17% 23% 22% 30% 25% 23%13%
28%18%
Fig. 5: Demographic factors
Severely food insecure Moderately food insecure Food secure
9
3.2.2 Livelihoods
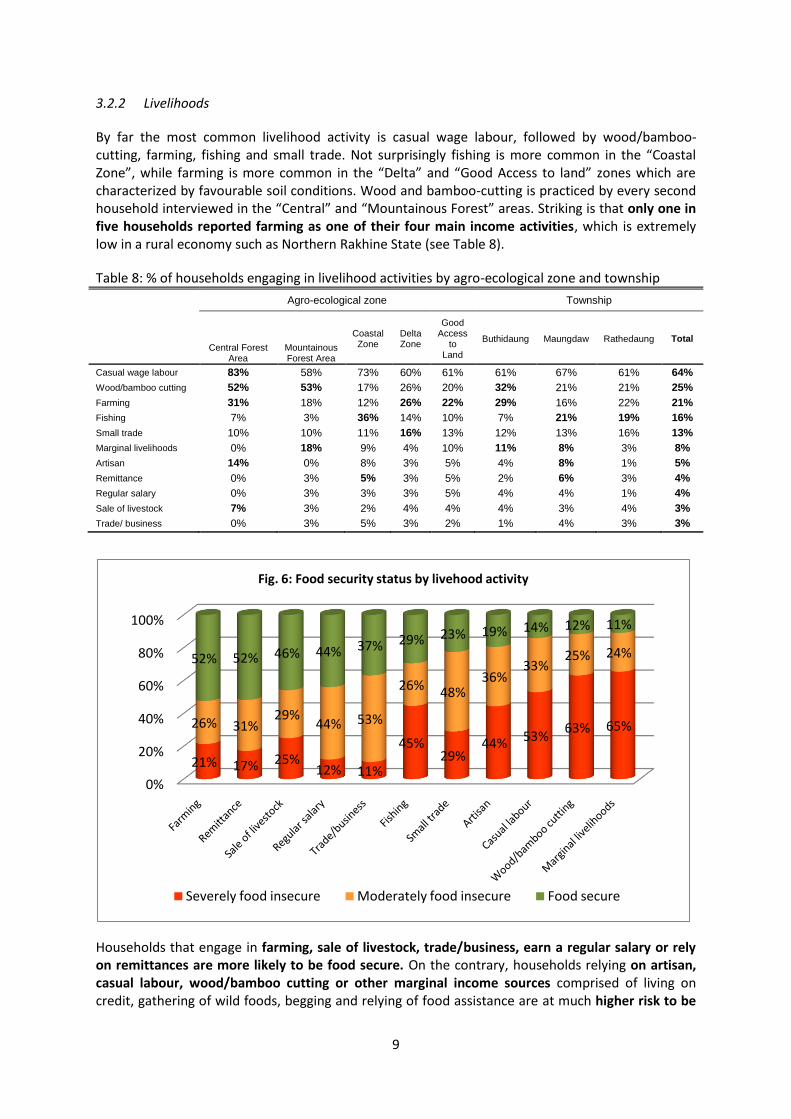
By far the most common livelihood activity is casual wage labour, followed by wood/bamboo-cutting, farming, fishing and small trade. Not surprisingly fishing is more common in the “Coastal Zone”, while farming is more common in the “Delta” and “Good Access to land” zones which are characterized by favourable soil conditions. Wood and bamboo-cutting is practiced by every second household interviewed in the “Central” and “Mountainous Forest” areas. Striking is that only one in five households reported farming as one of their four main income activities, which is extremely low in a rural economy such as Northern Rakhine State (see Table 8).
Table 8: % of households engaging in livelihood activities by agro-ecological zone and township
Agro-ecological zone Township
Central Forest Area
Mountainous Forest Area
Coastal Zone
Delta Zone
Good Access
to Land
Buthidaung Maungdaw Rathedaung Total
Casual wage labour 83% 58% 73% 60% 61% 61% 67% 61% 64%
Wood/bamboo cutting 52% 53% 17% 26% 20% 32% 21% 21% 25%
Farming 31% 18% 12% 26% 22% 29% 16% 22% 21%
Fishing 7% 3% 36% 14% 10% 7% 21% 19% 16%
Small trade 10% 10% 11% 16% 13% 12% 13% 16% 13%
Marginal livelihoods 0% 18% 9% 4% 10% 11% 8% 3% 8%
Artisan 14% 0% 8% 3% 5% 4% 8% 1% 5%
Remittance 0% 3% 5% 3% 5% 2% 6% 3% 4%
Regular salary 0% 3% 3% 3% 5% 4% 4% 1% 4%
Sale of livestock 7% 3% 2% 4% 4% 4% 3% 4% 3%
Trade/ business 0% 3% 5% 3% 2% 1% 4% 3% 3%
Households that engage in farming, sale of livestock, trade/business, earn a regular salary or rely on remittances are more likely to be food secure. On the contrary, households relying on artisan, casual labour, wood/bamboo cutting or other marginal income sources comprised of living on credit, gathering of wild foods, begging and relying of food assistance are at much higher risk to be
0%
20%
40%
60%
80%
100%
21% 17% 25%12% 11%
45%29%
44% 53%63% 65%26% 31%
29%44% 53%
26% 48%36%
33%25% 24%52% 52% 46% 44% 37% 29% 23% 19% 14% 12% 11%
Fig. 6: Food security status by livehood activity
Severely food insecure Moderately food insecure Food secure
10
food insecure (see Fig. 6). Households involved in these activities are characterized by a high proportion of households with poor food consumption combined with poor food access (see also Annex 2).
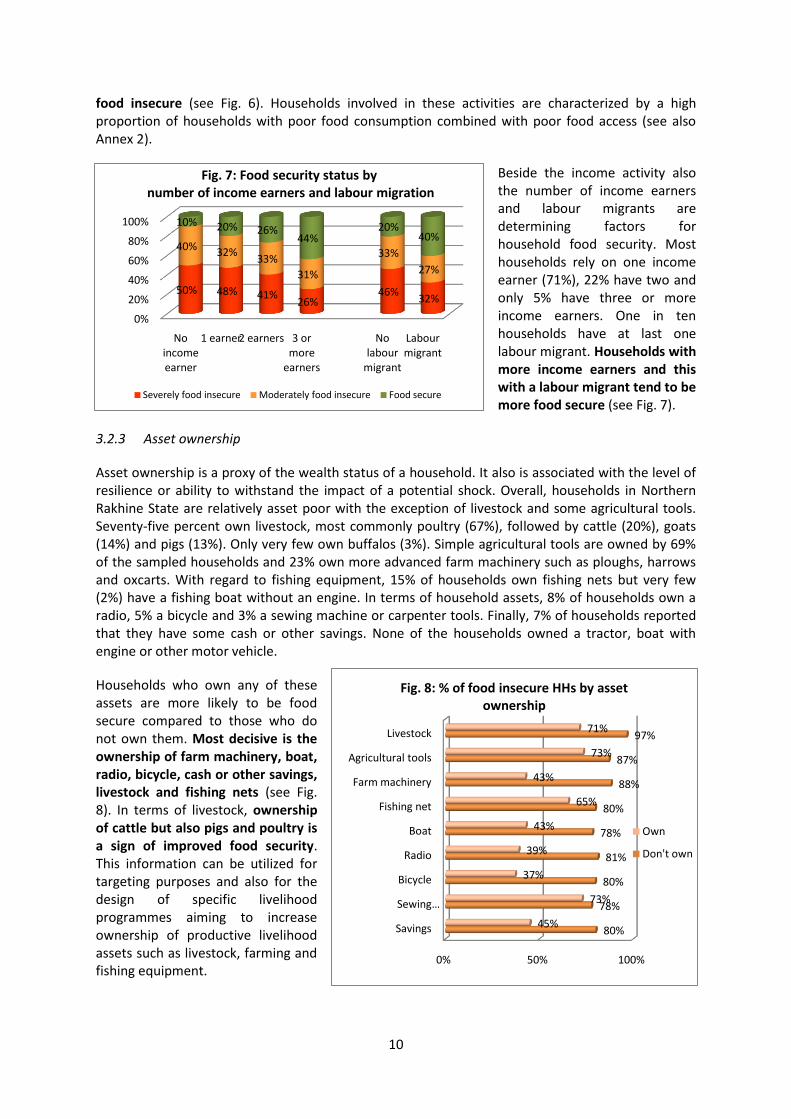
Beside the income activity also the number of income earners and labour migrants are determining factors for household food security. Most households rely on one income earner (71%), 22% have two and only 5% have three or more income earners. One in ten households have at last one labour migrant. Households with more income earners and this with a labour migrant tend to be more food secure (see Fig. 7).
3.2.3 Asset ownership
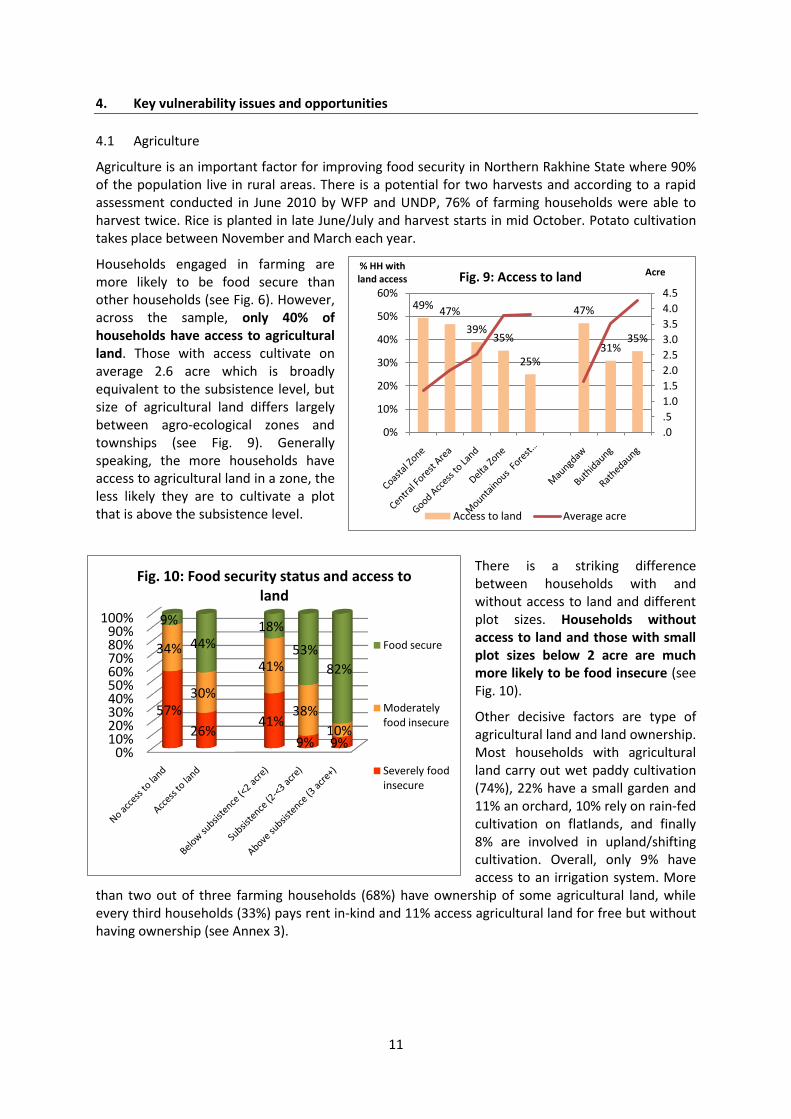
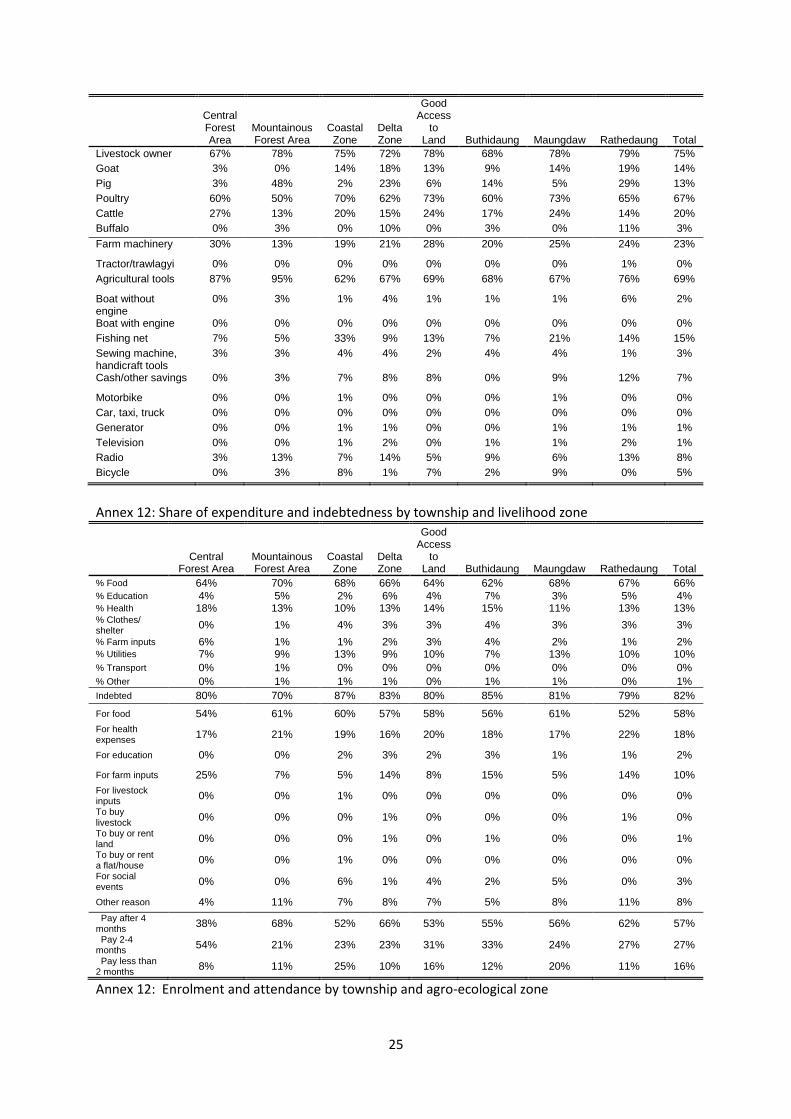
Asset ownership is a proxy of the wealth status of a household. It also is associated with the level of resilience or ability to withstand the impact of a potential shock. Overall, households in Northern Rakhine State are relatively asset poor with the exception of livestock and some agricultural tools. Seventy-five percent own livestock, most commonly poultry (67%), followed by cattle (20%), goats (14%) and pigs (13%). Only very few own buffalos (3%). Simple agricultural tools are owned by 69% of the sampled households and 23% own more advanced farm machinery such as ploughs, harrows and oxcarts. With regard to fishing equipment, 15% of households own fishing nets but very few (2%) have a fishing boat without an engine. In terms of household assets, 8% of households own a radio, 5% a bicycle and 3% a sewing machine or carpenter tools. Finally, 7% of households reported that they have some cash or other savings. None of the households owned a tractor, boat with engine or other motor vehicle.
Households who own any of these assets are more likely to be food secure compared to those who do not own them. Most decisive is the ownership of farm machinery, boat, radio, bicycle, cash or other savings, livestock and fishing nets (see Fig. 8). In terms of livestock, ownership of cattle but also pigs and poultry is a sign of improved food security. This information can be utilized for targeting purposes and also for the design of specific livelihood programmes aiming to increase ownership of productive livelihood assets such as livestock, farming and fishing equipment.
0%
20%
40%
60%
80%
100%
No income earner
1 earner2 earners 3 or more
earners
No labour
migrant
Labour migrant
50% 48% 41%26%
46%32%
40% 32%33%
31%
33%
27%
10% 20% 26%44%
20%40%
Fig. 7: Food security status bynumber of income earners and labour migration
Severely food insecure Moderately food insecure Food secure
0% 50% 100%
Savings
Sewing …
Bicycle
Radio
Boat
Fishing net
Farm machinery
Agricultural tools
Livestock
80%
78%
80%
81%
78%
80%
88%
87%
97%
45%
73%
37%
39%
43%
65%
43%
73%
71%
Fig. 8: % of food insecure HHs by asset ownership
Own
Don't own
11
4. Key vulnerability issues and opportunities
4.1 Agriculture
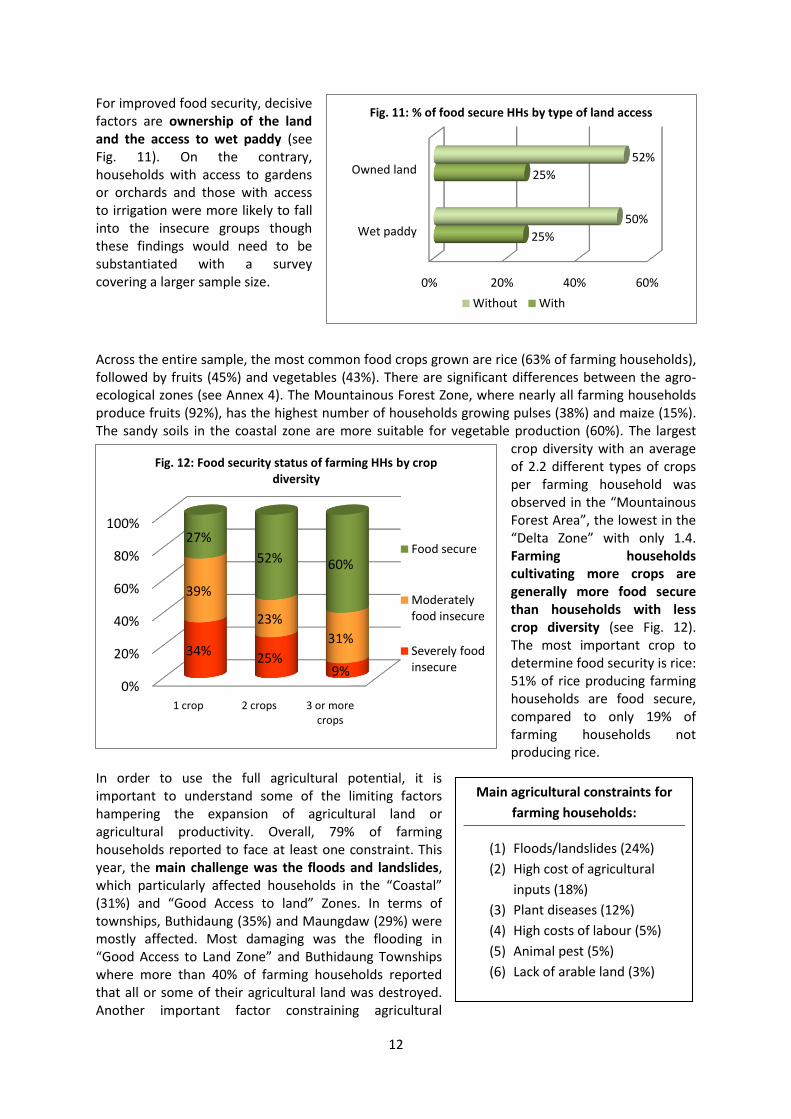
Agriculture is an important factor for improving food security in Northern Rakhine State where 90% of the population live in rural areas. There is a potential for two harvests and according to a rapid assessment conducted in June 2010 by WFP and UNDP, 76% of farming households were able to harvest twice. Rice is planted in late June/July and harvest starts in mid October. Potato cultivation takes place between November and March each year.
Households engaged in farming are more likely to be food secure than other households (see Fig. 6). However, across the sample, only 40% of households have access to agricultural land. Those with access cultivate on average 2.6 acre which is broadly equivalent to the subsistence level, but size of agricultural land differs largely between agro-ecological zones and townships (see Fig. 9). Generally speaking, the more households have access to agricultural land in a zone, the less likely they are to cultivate a plot that is above the subsistence level.
There is a striking difference between households with and without access to land and different plot sizes. Households without access to land and those with small plot sizes below 2 acre are much more likely to be food insecure (see Fig. 10).
Other decisive factors are type of agricultural land and land ownership. Most households with agricultural land carry out wet paddy cultivation (74%), 22% have a small garden and 11% an orchard, 10% rely on rain-fed cultivation on flatlands, and finally 8% are involved in upland/shifting cultivation. Overall, only 9% have access to an irrigation system. More
than two out of three farming households (68%) have ownership of some agricultural land, while every third households (33%) pays rent in-kind and 11% access agricultural land for free but without having ownership (see Annex 3).
49%47%
39%35%
25%
47%
31%35%
.0
.5
1.0
1.5
2.0
2.5
3.0
3.5
4.0
4.5
0%
10%
20%
30%
40%
50%
60%
Acre% HH with land access Fig. 9: Access to land
Access to land Average acre
0%10%20%30%40%50%60%70%80%90%
100%
57%
26%41%
9% 9%
34%
30%
41%
38%
10%
9%
44%18%
53%
82%
Fig. 10: Food security status and access to land
Food secure
Moderately food insecure
Severely food insecure
12
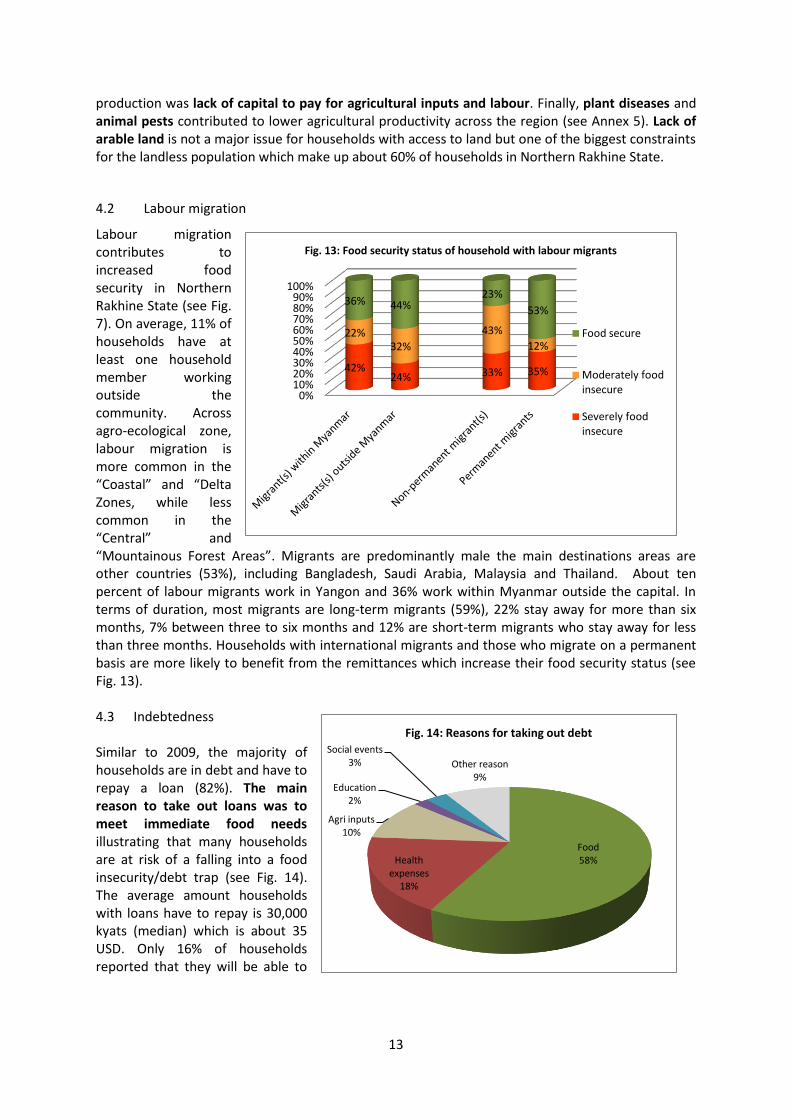
For improved food security, decisive factors are ownership of the land and the access to wet paddy (see Fig. 11). On the contrary, households with access to gardens or orchards and those with access to irrigation were more likely to fall into the insecure groups though these findings would need to be substantiated with a survey covering a larger sample size.
Across the entire sample, the most common food crops grown are rice (63% of farming households), followed by fruits (45%) and vegetables (43%). There are significant differences between the agro-ecological zones (see Annex 4). The Mountainous Forest Zone, where nearly all farming households produce fruits (92%), has the highest number of households growing pulses (38%) and maize (15%). The sandy soils in the coastal zone are more suitable for vegetable production (60%). The largest
crop diversity with an average of 2.2 different types of crops per farming household was observed in the “Mountainous Forest Area”, the lowest in the “Delta Zone” with only 1.4. Farming households cultivating more crops are generally more food secure than households with less crop diversity (see Fig. 12). The most important crop to determine food security is rice: 51% of rice producing farming households are food secure, compared to only 19% of farming households not producing rice.
In order to use the full agricultural potential, it is important to understand some of the limiting factors hampering the expansion of agricultural land or agricultural productivity. Overall, 79% of farming households reported to face at least one constraint. This year, the main challenge was the floods and landslides, which particularly affected households in the “Coastal” (31%) and “Good Access to land” Zones. In terms of townships, Buthidaung (35%) and Maungdaw (29%) were mostly affected. Most damaging was the flooding in “Good Access to Land Zone” and Buthidaung Townships where more than 40% of farming households reported that all or some of their agricultural land was destroyed. Another important factor constraining agricultural
Main agricultural constraints for
farming households:
(1) Floods/landslides (24%)
(2) High cost of agricultural
inputs (18%)
(3) Plant diseases (12%)
(4) High costs of labour (5%)
(5) Animal pest (5%)
(6) Lack of arable land (3%)
0% 20% 40% 60%
Wet paddy
Owned land
25%
25%
50%
52%
Fig. 11: % of food secure HHs by type of land access
Without With
0%
20%
40%
60%
80%
100%
1 crop 2 crops 3 or more crops
34%25%
9%
39%
23%
31%
27%
52% 60%
Fig. 12: Food security status of farming HHs by crop diversity
Food secure
Moderately food insecure
Severely food insecure
13
Food58%Health
expenses18%
Agri inputs10%
Education2%
Social events3% Other reason
9%
Fig. 14: Reasons for taking out debt
production was lack of capital to pay for agricultural inputs and labour. Finally, plant diseases and animal pests contributed to lower agricultural productivity across the region (see Annex 5). Lack of arable land is not a major issue for households with access to land but one of the biggest constraints for the landless population which make up about 60% of households in Northern Rakhine State.
4.2 Labour migration
Labour migration contributes to increased food security in Northern Rakhine State (see Fig. 7). On average, 11% of households have at least one household member working outside the community. Across agro-ecological zone, labour migration is more common in the “Coastal” and “Delta Zones, while less common in the “Central” and “Mountainous Forest Areas”. Migrants are predominantly male the main destinations areas are other countries (53%), including Bangladesh, Saudi Arabia, Malaysia and Thailand. About ten percent of labour migrants work in Yangon and 36% work within Myanmar outside the capital. In terms of duration, most migrants are long-term migrants (59%), 22% stay away for more than six months, 7% between three to six months and 12% are short-term migrants who stay away for less than three months. Households with international migrants and those who migrate on a permanent basis are more likely to benefit from the remittances which increase their food security status (see Fig. 13). 4.3 Indebtedness Similar to 2009, the majority of households are in debt and have to repay a loan (82%). The main reason to take out loans was to meet immediate food needs illustrating that many households are at risk of a falling into a food insecurity/debt trap (see Fig. 14). The average amount households with loans have to repay is 30,000 kyats (median) which is about 35 USD. Only 16% of households reported that they will be able to
0%10%20%30%40%50%60%70%80%90%
100%
42%24% 33% 35%
22%32%
43%
12%
36% 44%23%
53%
Fig. 13: Food security status of household with labour migrants
Food secure
Moderately food insecure
Severely food insecure
14
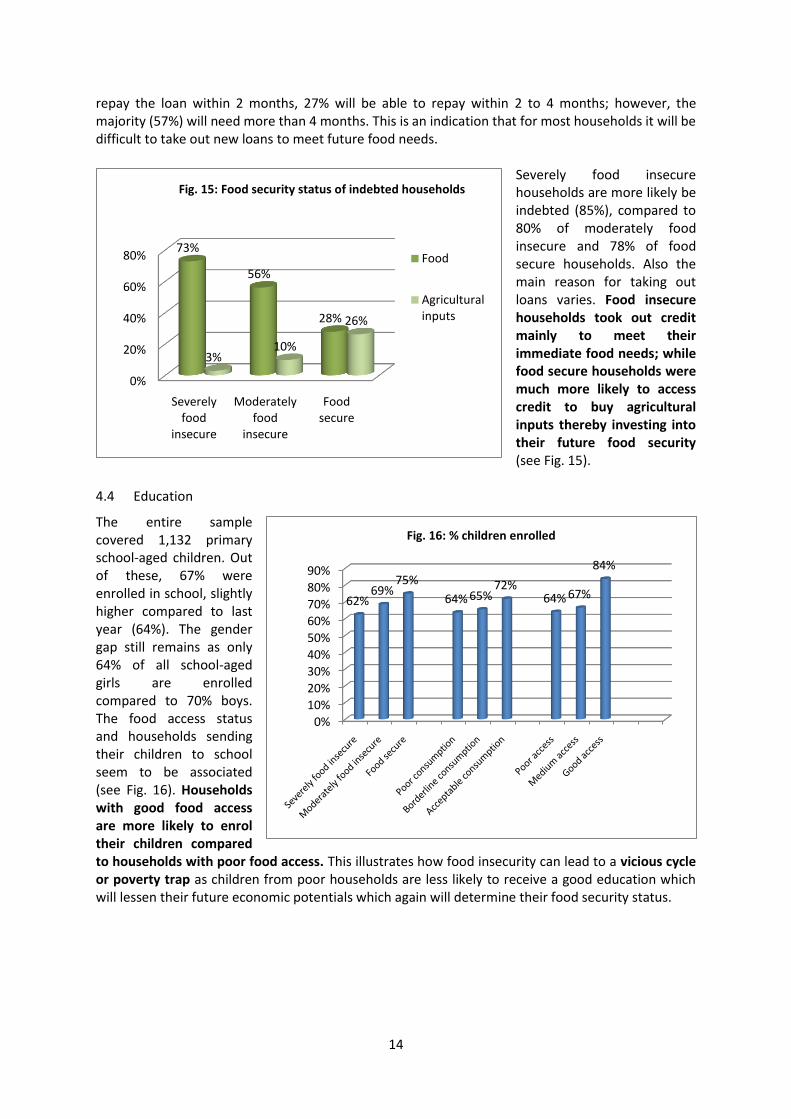
repay the loan within 2 months, 27% will be able to repay within 2 to 4 months; however, the majority (57%) will need more than 4 months. This is an indication that for most households it will be difficult to take out new loans to meet future food needs.
Severely food insecure households are more likely be indebted (85%), compared to 80% of moderately food insecure and 78% of food secure households. Also the main reason for taking out loans varies. Food insecure households took out credit mainly to meet their immediate food needs; while food secure households were much more likely to access credit to buy agricultural inputs thereby investing into their future food security (see Fig. 15).
4.4 Education
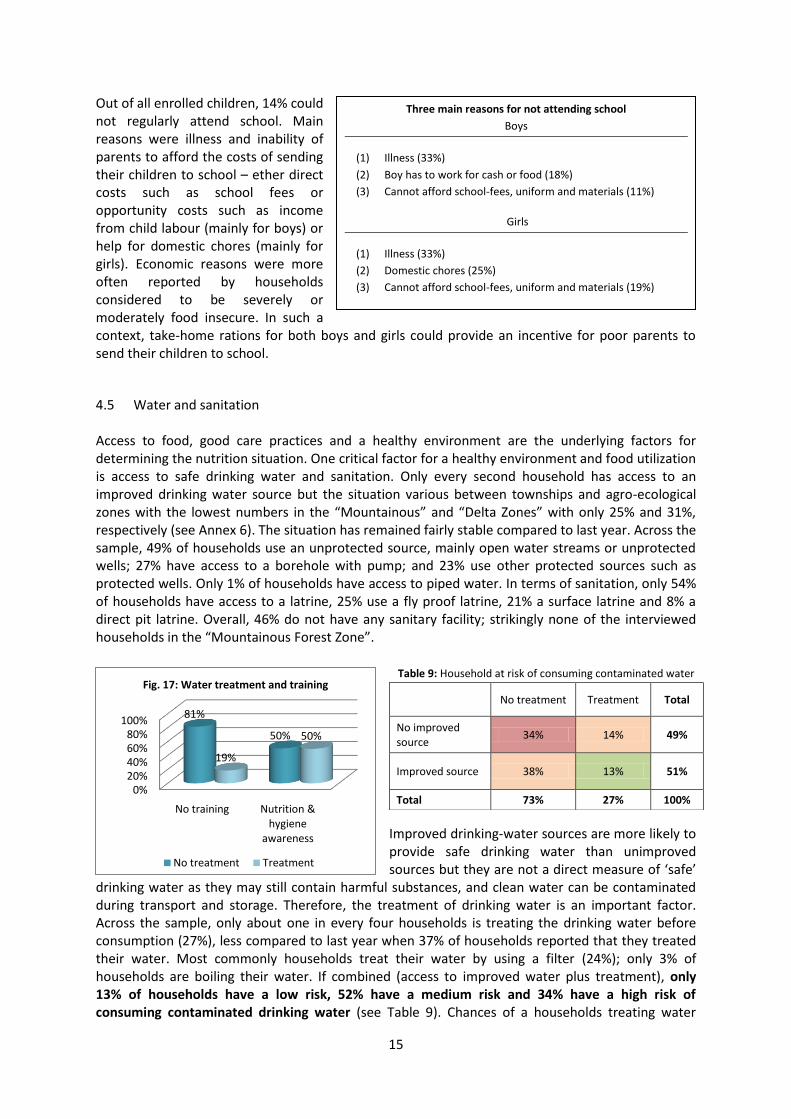
The entire sample covered 1,132 primary school-aged children. Out of these, 67% were enrolled in school, slightly higher compared to last year (64%). The gender gap still remains as only 64% of all school-aged girls are enrolled compared to 70% boys. The food access status and households sending their children to school seem to be associated (see Fig. 16). Households with good food access are more likely to enrol their children compared to households with poor food access. This illustrates how food insecurity can lead to a vicious cycle or poverty trap as children from poor households are less likely to receive a good education which will lessen their future economic potentials which again will determine their food security status.
0%
20%
40%
60%
80%
Severely food
insecure
Moderately food
insecure
Food secure
73%
56%
28%
3%10%
26%
Fig. 15: Food security status of indebted households
Food
Agricultural inputs
0%
10%
20%
30%
40%
50%
60%
70%
80%
90%
62%69%
75%
64% 65%72%
64% 67%
84%
Fig. 16: % children enrolled
15
0%20%40%60%80%
100%
No training Nutrition & hygiene
awareness
81%
50%
19%
50%
Fig. 17: Water treatment and training
No treatment Treatment
Out of all enrolled children, 14% could not regularly attend school. Main reasons were illness and inability of parents to afford the costs of sending their children to school – ether direct costs such as school fees or opportunity costs such as income from child labour (mainly for boys) or help for domestic chores (mainly for girls). Economic reasons were more often reported by households considered to be severely or moderately food insecure. In such a context, take-home rations for both boys and girls could provide an incentive for poor parents to send their children to school.
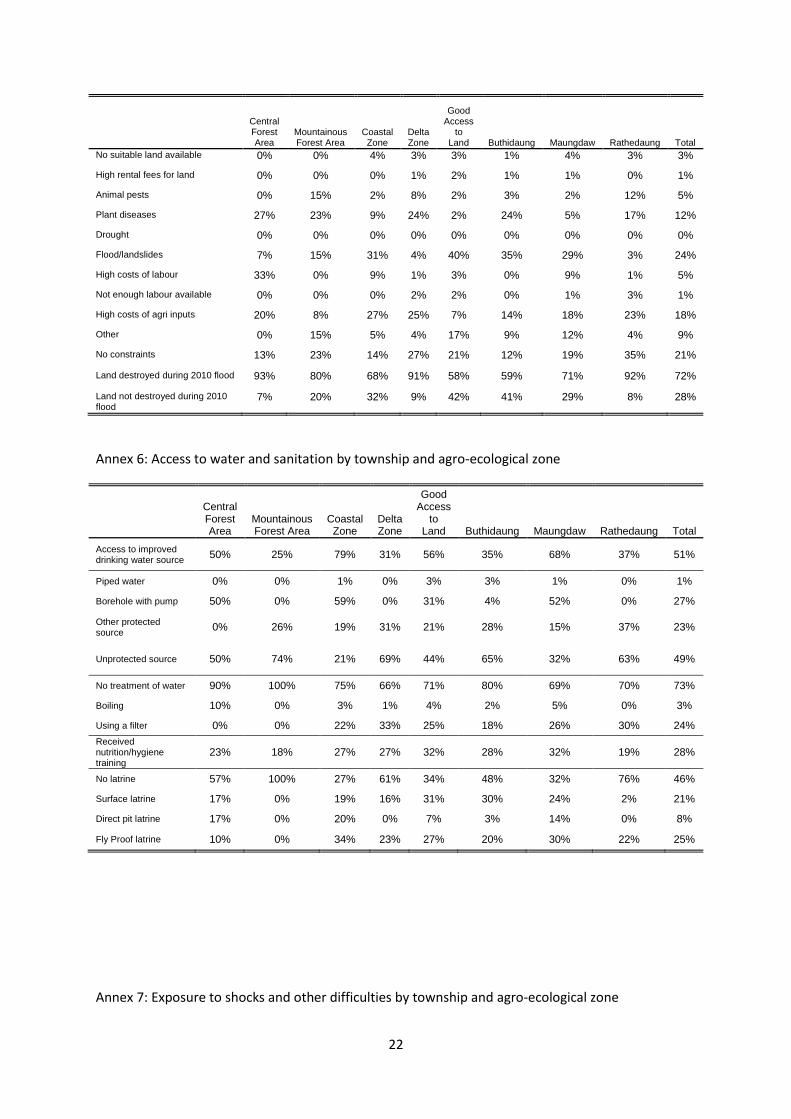
4.5 Water and sanitation Access to food, good care practices and a healthy environment are the underlying factors for determining the nutrition situation. One critical factor for a healthy environment and food utilization is access to safe drinking water and sanitation. Only every second household has access to an improved drinking water source but the situation various between townships and agro-ecological zones with the lowest numbers in the “Mountainous” and “Delta Zones” with only 25% and 31%, respectively (see Annex 6). The situation has remained fairly stable compared to last year. Across the sample, 49% of households use an unprotected source, mainly open water streams or unprotected wells; 27% have access to a borehole with pump; and 23% use other protected sources such as protected wells. Only 1% of households have access to piped water. In terms of sanitation, only 54% of households have access to a latrine, 25% use a fly proof latrine, 21% a surface latrine and 8% a direct pit latrine. Overall, 46% do not have any sanitary facility; strikingly none of the interviewed households in the “Mountainous Forest Zone”.
Improved drinking-water sources are more likely to provide safe drinking water than unimproved sources but they are not a direct measure of ‘safe’
drinking water as they may still contain harmful substances, and clean water can be contaminated during transport and storage. Therefore, the treatment of drinking water is an important factor. Across the sample, only about one in every four households is treating the drinking water before consumption (27%), less compared to last year when 37% of households reported that they treated their water. Most commonly households treat their water by using a filter (24%); only 3% of households are boiling their water. If combined (access to improved water plus treatment), only 13% of households have a low risk, 52% have a medium risk and 34% have a high risk of consuming contaminated drinking water (see Table 9). Chances of a households treating water
Table 9: Household at risk of consuming contaminated water
No treatment Treatment Total
No improved source
34% 14% 49%
Improved source 38% 13% 51%
Total 73% 27% 100%
Three main reasons for not attending school
Boys
(1) Illness (33%)
(2) Boy has to work for cash or food (18%)
(3) Cannot afford school-fees, uniform and materials (11%)
Girls
(1) Illness (33%)
(2) Domestic chores (25%)
(3) Cannot afford school-fees, uniform and materials (19%)
16
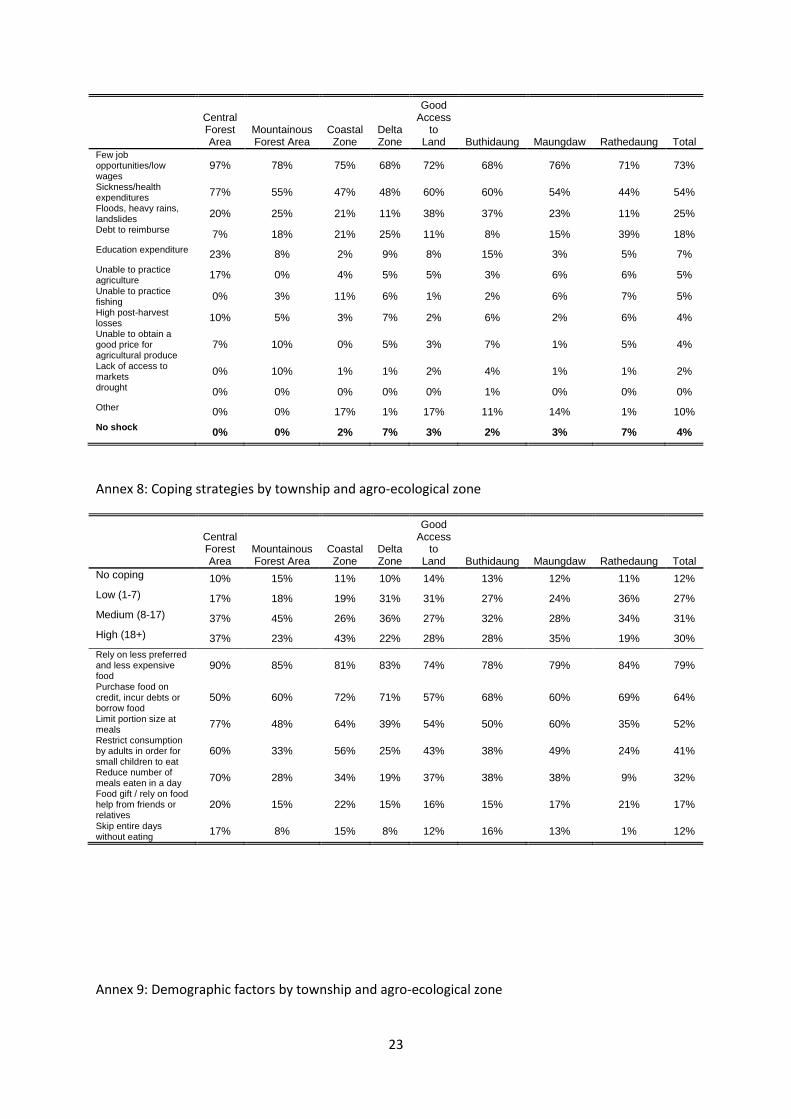
increase if they participated in nutrition and hygiene training (see Fig. 17). In total, 28% of surveyed households benefitted from such training in the past. 4.6 Shocks and coping Exposure to shocks - including natural hazards and economic shocks – as well as household ability to cope with the impact of these shocks will affects both current and future food security status. Respondents were asked to list the three main shocks or difficulties their households faced during the past six months. Number one constraint reported this year and last year were few job opportunities and low wages. Debt was the second most important shock last year, reported by 37%. This year it is still on rank 4 indicating a continued high risk of households being trapped in the debt cycle. Nearly every second household was concerned by high health expenditures and every fourth households was affected by the floods and landslides in June/July 2010 (see also Section 4.1 and Annex 7).
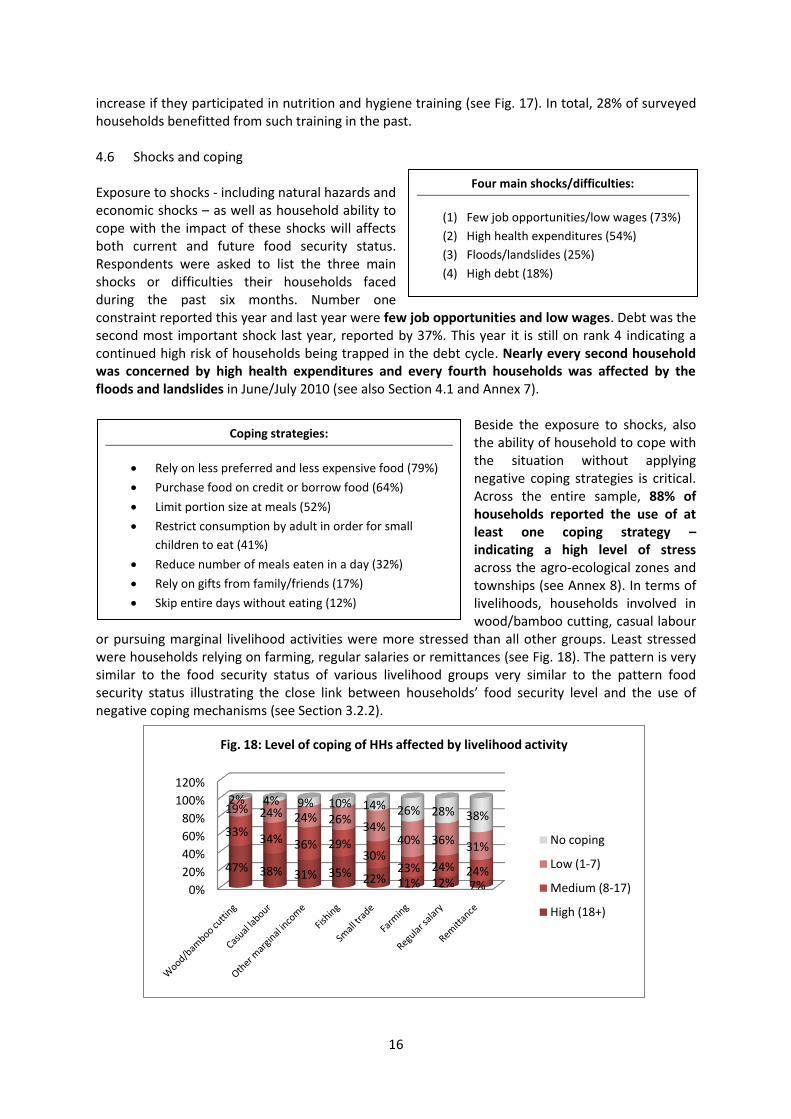
Beside the exposure to shocks, also the ability of household to cope with the situation without applying negative coping strategies is critical. Across the entire sample, 88% of households reported the use of at least one coping strategy – indicating a high level of stress across the agro-ecological zones and townships (see Annex 8). In terms of livelihoods, households involved in wood/bamboo cutting, casual labour
or pursuing marginal livelihood activities were more stressed than all other groups. Least stressed were households relying on farming, regular salaries or remittances (see Fig. 18). The pattern is very similar to the food security status of various livelihood groups very similar to the pattern food security status illustrating the close link between households’ food security level and the use of negative coping mechanisms (see Section 3.2.2).
Four main shocks/difficulties:
(1) Few job opportunities/low wages (73%)
(2) High health expenditures (54%)
(3) Floods/landslides (25%)
(4) High debt (18%)
Coping strategies:
Rely on less preferred and less expensive food (79%)
Purchase food on credit or borrow food (64%)
Limit portion size at meals (52%)
Restrict consumption by adult in order for small
children to eat (41%)
Reduce number of meals eaten in a day (32%)
Rely on gifts from family/friends (17%)
Skip entire days without eating (12%)
0%
20%
40%
60%
80%
100%
120%
47% 38% 31% 35% 22% 11% 12% 7%
33%34% 36% 29%
30%23% 24% 24%
19% 24% 24% 26%34%
40% 36%31%
2% 4% 9% 10% 14% 26% 28% 38%
Fig. 18: Level of coping of HHs affected by livelihood activity
No coping
Low (1-7)
Medium (8-17)
High (18+)
17
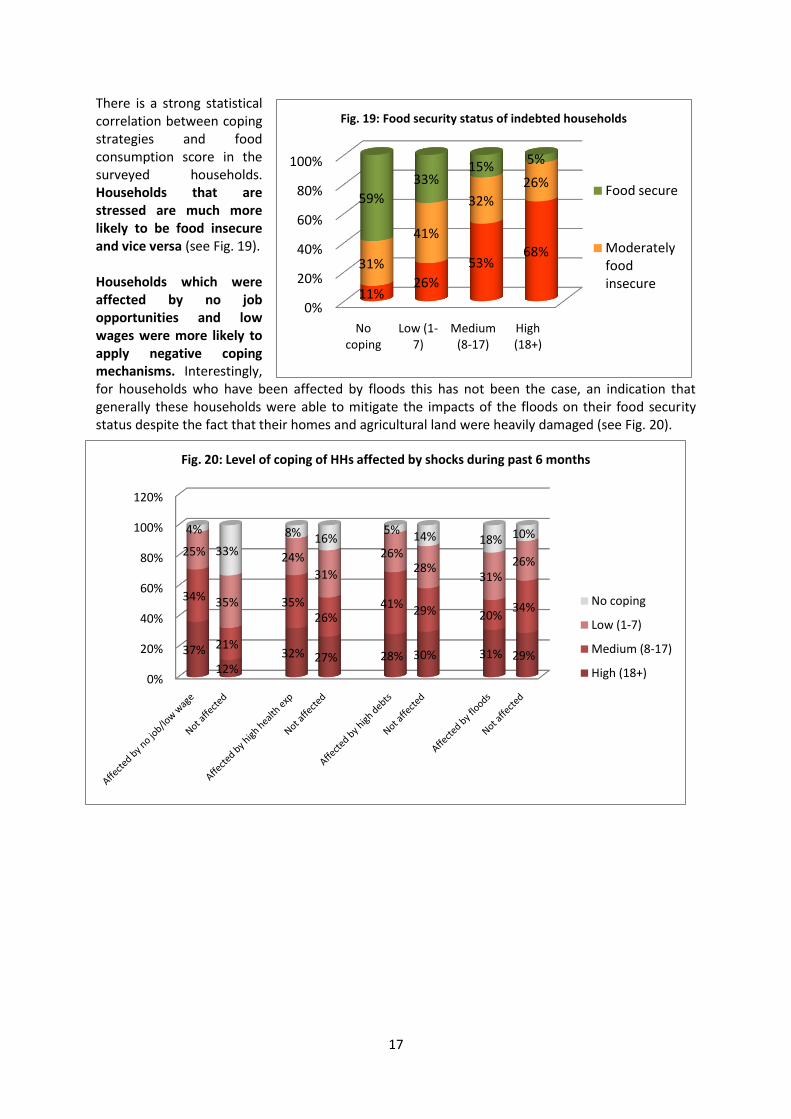
There is a strong statistical correlation between coping strategies and food consumption score in the surveyed households. Households that are stressed are much more likely to be food insecure and vice versa (see Fig. 19). Households which were affected by no job opportunities and low wages were more likely to apply negative coping mechanisms. Interestingly, for households who have been affected by floods this has not been the case, an indication that generally these households were able to mitigate the impacts of the floods on their food security status despite the fact that their homes and agricultural land were heavily damaged (see Fig. 20).
0%
20%
40%
60%
80%
100%
120%
37%
12%32% 27% 28% 30% 31% 29%
34%
21%
35%26%
41%29% 20%
34%
25%
35%
24%
31%
26%28%
31%26%
4%
33%
8% 16%5%
14% 18% 10%
Fig. 20: Level of coping of HHs affected by shocks during past 6 months
No coping
Low (1-7)
Medium (8-17)
High (18+)
0%
20%
40%
60%
80%
100%
No coping
Low (1-7)
Medium (8-17)
High (18+)
11%26%
53%68%
31%
41%
32%
26%59%
33%15%
5%
Fig. 19: Food security status of indebted households
Food secure
Moderately food insecure
18
5. Towards ensuring food security
Main underlying factors contributing to food insecurity in Northern Rakhine State are low access to
agricultural land, and limited purchasing power which is related to limited wage labour
opportunities/low wages on one hand, and high food prices partly linked with limited market
integration with other surplus regions on the other hand. In addition to these structural factors, also
exposure to natural disasters, such as flooding and landslides regularly lead to transitory food
insecurity either directly by damaging shelter and agricultural land of affected households or by
limiting physical access and thereby further increasing local food prices. While overall, food
insecurity worsened compared to one year ago, it seems that household who were directly affected
by the floods in June/July 2010 have been able to recover or at least mitigate potential impacts on
their food security status. Hence, they will not be in need of food assistance, however may require
support for restoring their agricultural land.
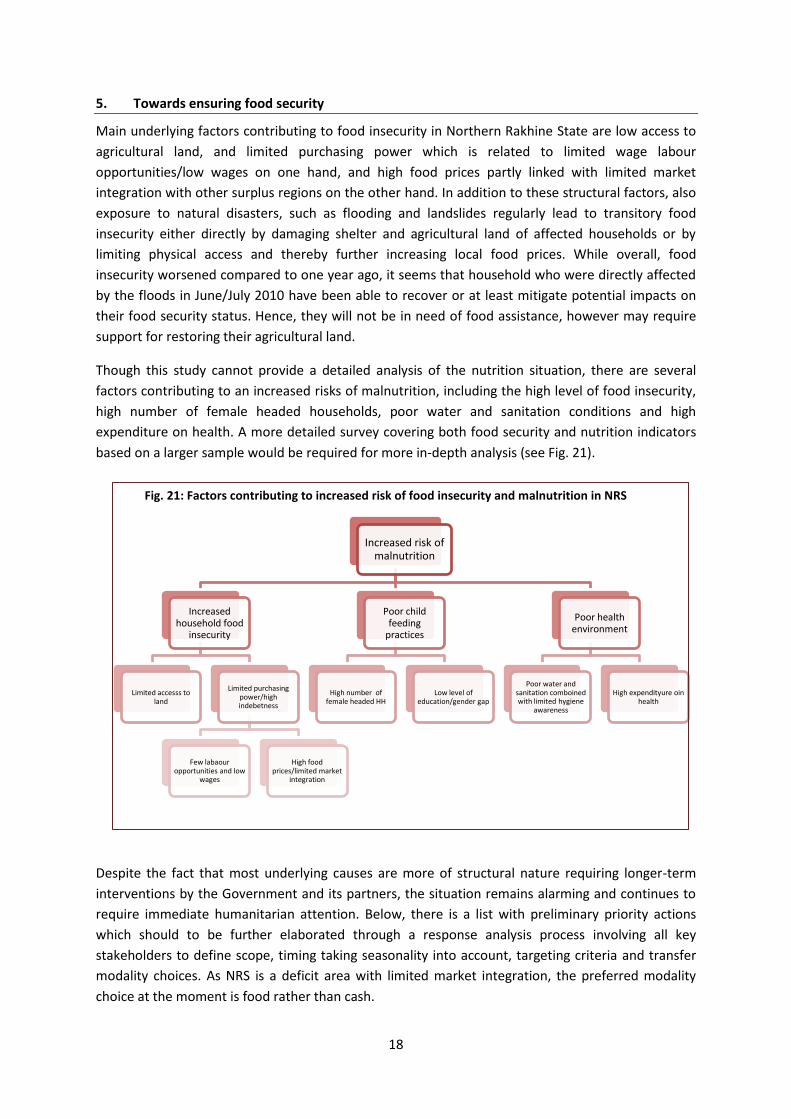
Though this study cannot provide a detailed analysis of the nutrition situation, there are several
factors contributing to an increased risks of malnutrition, including the high level of food insecurity,
high number of female headed households, poor water and sanitation conditions and high
expenditure on health. A more detailed survey covering both food security and nutrition indicators
based on a larger sample would be required for more in-depth analysis (see Fig. 21).
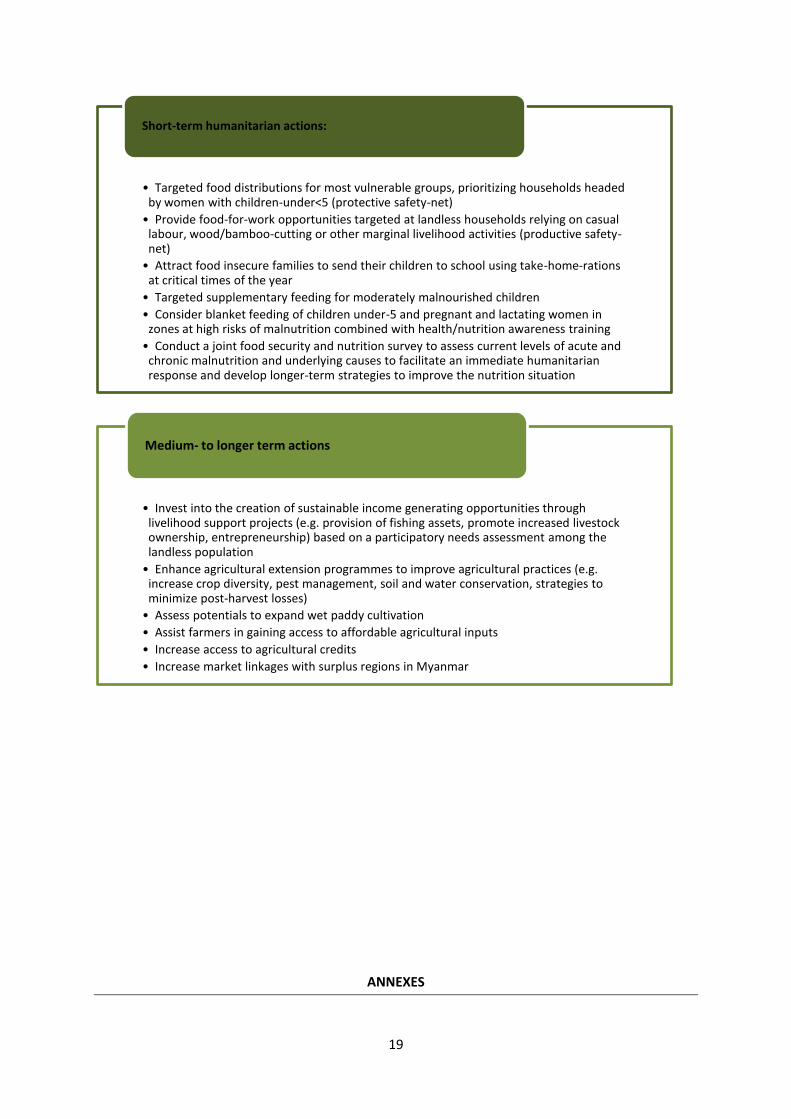
Despite the fact that most underlying causes are more of structural nature requiring longer-term
interventions by the Government and its partners, the situation remains alarming and continues to
require immediate humanitarian attention. Below, there is a list with preliminary priority actions
which should to be further elaborated through a response analysis process involving all key
stakeholders to define scope, timing taking seasonality into account, targeting criteria and transfer
modality choices. As NRS is a deficit area with limited market integration, the preferred modality
choice at the moment is food rather than cash.
Fig. 21: Factors contributing to increased risk of food insecurity and malnutrition in NRS
Increased risk of malnutrition
Increased household food
insecurity
Limited accesss to land
Limited purchasing power/high indebetness
Few labaour opportunities and low
wages
High food prices/limited market
integration
Poor child feeding
practices
High number of female headed HH
Low level of education/gender gap
Poor health environment
Poor water and sanitation comboined with limited hygiene
awareness
High expendityure oin health
19
ANNEXES
• Targeted food distributions for most vulnerable groups, prioritizing households headed by women with children-under<5 (protective safety-net)
• Provide food-for-work opportunities targeted at landless households relying on casual labour, wood/bamboo-cutting or other marginal livelihood activities (productive safety-net)
• Attract food insecure families to send their children to school using take-home-rations at critical times of the year
• Targeted supplementary feeding for moderately malnourished children
• Consider blanket feeding of children under-5 and pregnant and lactating women in zones at high risks of malnutrition combined with health/nutrition awareness training
• Conduct a joint food security and nutrition survey to assess current levels of acute and chronic malnutrition and underlying causes to facilitate an immediate humanitarian response and develop longer-term strategies to improve the nutrition situation
Short-term humanitarian actions:
• Invest into the creation of sustainable income generating opportunities through livelihood support projects (e.g. provision of fishing assets, promote increased livestock ownership, entrepreneurship) based on a participatory needs assessment among the landless population
• Enhance agricultural extension programmes to improve agricultural practices (e.g. increase crop diversity, pest management, soil and water conservation, strategies to minimize post-harvest losses)
• Assess potentials to expand wet paddy cultivation
• Assist farmers in gaining access to affordable agricultural inputs
• Increase access to agricultural credits
• Increase market linkages with surplus regions in Myanmar
Medium- to longer term actions
20
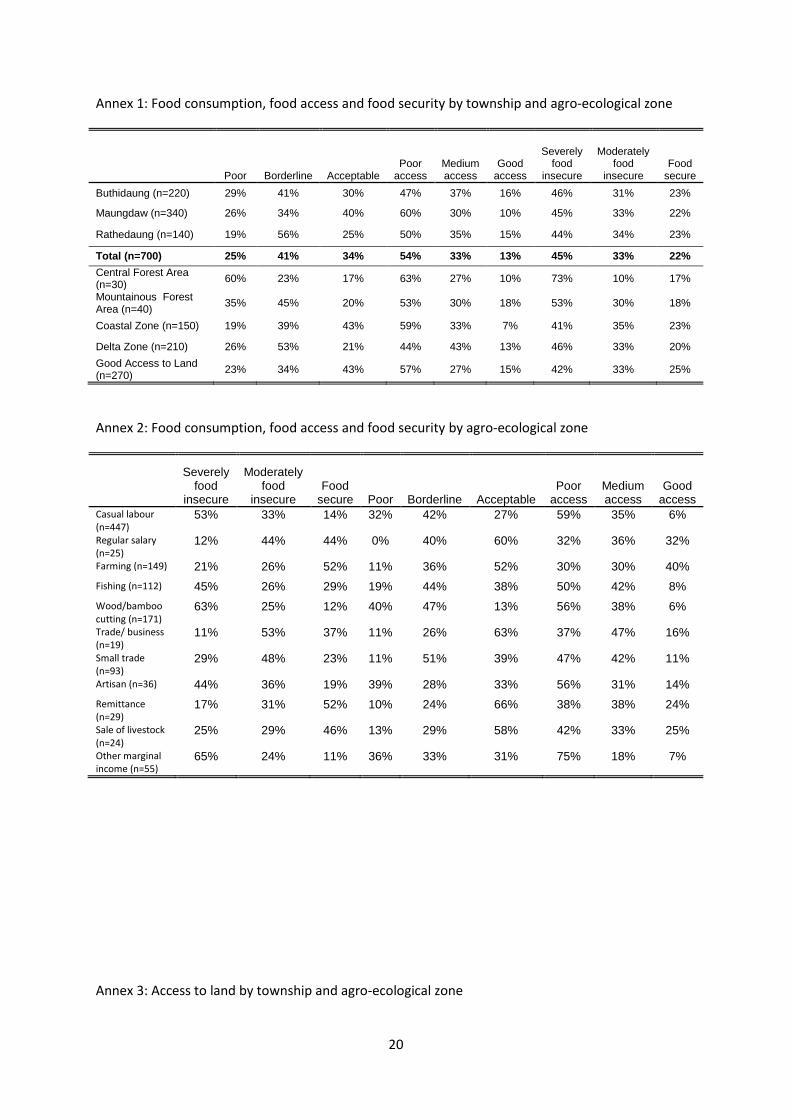
Annex 1: Food consumption, food access and food security by township and agro-ecological zone
Poor Borderline Acceptable Poor
access Medium access
Good access
Severely food
insecure
Moderately food
insecure Food
secure
Buthidaung (n=220) 29% 41% 30% 47% 37% 16% 46% 31% 23%
Maungdaw (n=340) 26% 34% 40% 60% 30% 10% 45% 33% 22%
Rathedaung (n=140) 19% 56% 25% 50% 35% 15% 44% 34% 23%
Total (n=700) 25% 41% 34% 54% 33% 13% 45% 33% 22%
Central Forest Area (n=30)
60% 23% 17% 63% 27% 10% 73% 10% 17%
Mountainous Forest Area (n=40)
35% 45% 20% 53% 30% 18% 53% 30% 18%
Coastal Zone (n=150) 19% 39% 43% 59% 33% 7% 41% 35% 23%
Delta Zone (n=210) 26% 53% 21% 44% 43% 13% 46% 33% 20%
Good Access to Land (n=270)
23% 34% 43% 57% 27% 15% 42% 33% 25%
Annex 2: Food consumption, food access and food security by agro-ecological zone
Severely
food insecure
Moderately food
insecure Food
secure Poor Borderline Acceptable Poor
access Medium access
Good access
Casual labour (n=447)
53% 33% 14% 32% 42% 27% 59% 35% 6%
Regular salary (n=25)
12% 44% 44% 0% 40% 60% 32% 36% 32%
Farming (n=149) 21% 26% 52% 11% 36% 52% 30% 30% 40%
Fishing (n=112) 45% 26% 29% 19% 44% 38% 50% 42% 8%
Wood/bamboo cutting (n=171)
63% 25% 12% 40% 47% 13% 56% 38% 6%
Trade/ business (n=19)
11% 53% 37% 11% 26% 63% 37% 47% 16%
Small trade (n=93)
29% 48% 23% 11% 51% 39% 47% 42% 11%
Artisan (n=36) 44% 36% 19% 39% 28% 33% 56% 31% 14%
Remittance (n=29)
17% 31% 52% 10% 24% 66% 38% 38% 24%
Sale of livestock (n=24)
25% 29% 46% 13% 29% 58% 42% 33% 25%
Other marginal income (n=55)
65% 24% 11% 36% 33% 31% 75% 18% 7%
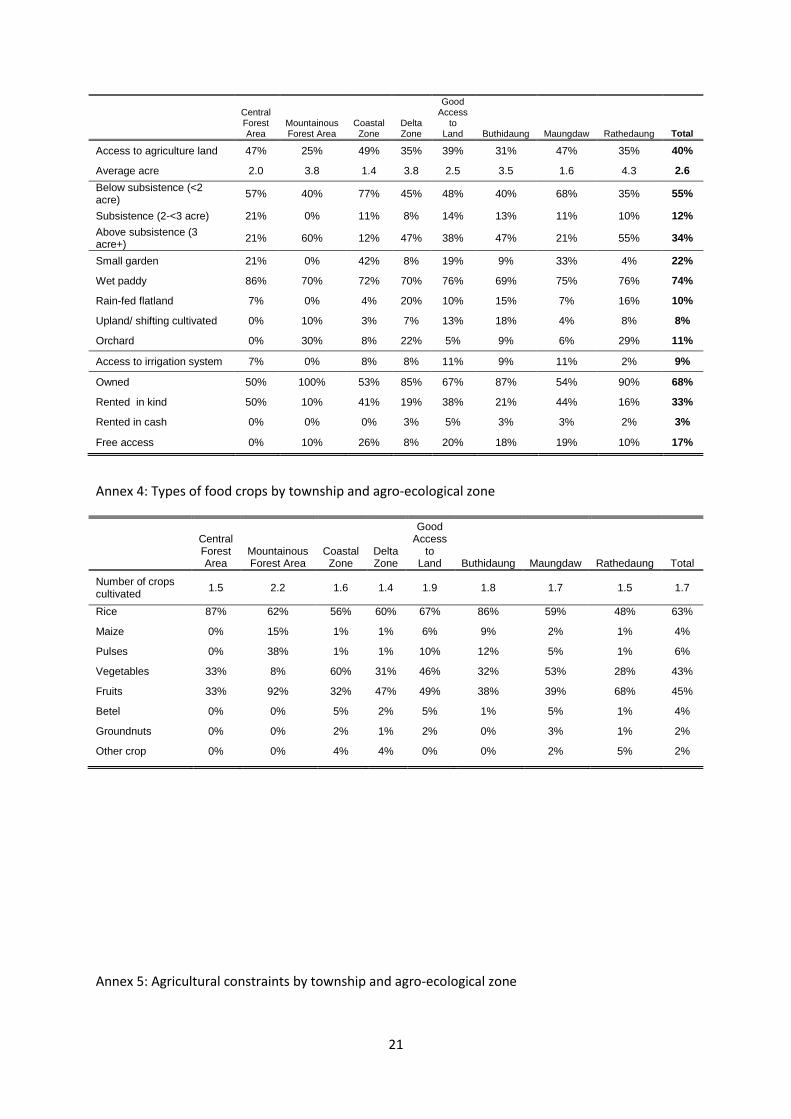
Annex 3: Access to land by township and agro-ecological zone
21
Central Forest Area
Mountainous Forest Area
Coastal Zone
Delta Zone
Good Access
to Land Buthidaung Maungdaw Rathedaung Total
Access to agriculture land 47% 25% 49% 35% 39% 31% 47% 35% 40%
Average acre 2.0 3.8 1.4 3.8 2.5 3.5 1.6 4.3 2.6
Below subsistence (<2 acre)
57% 40% 77% 45% 48% 40% 68% 35% 55%
Subsistence (2-<3 acre) 21% 0% 11% 8% 14% 13% 11% 10% 12%
Above subsistence (3 acre+)
21% 60% 12% 47% 38% 47% 21% 55% 34%
Small garden 21% 0% 42% 8% 19% 9% 33% 4% 22%
Wet paddy 86% 70% 72% 70% 76% 69% 75% 76% 74%
Rain-fed flatland 7% 0% 4% 20% 10% 15% 7% 16% 10%
Upland/ shifting cultivated 0% 10% 3% 7% 13% 18% 4% 8% 8%
Orchard 0% 30% 8% 22% 5% 9% 6% 29% 11%
Access to irrigation system 7% 0% 8% 8% 11% 9% 11% 2% 9%
Owned 50% 100% 53% 85% 67% 87% 54% 90% 68%
Rented in kind 50% 10% 41% 19% 38% 21% 44% 16% 33%
Rented in cash 0% 0% 0% 3% 5% 3% 3% 2% 3%
Free access 0% 10% 26% 8% 20% 18% 19% 10% 17%
Annex 4: Types of food crops by township and agro-ecological zone
Central Forest Area
Mountainous Forest Area
Coastal Zone
Delta Zone
Good Access
to Land Buthidaung Maungdaw Rathedaung Total
Number of crops cultivated
1.5 2.2 1.6 1.4 1.9 1.8 1.7 1.5 1.7
Rice 87% 62% 56% 60% 67% 86% 59% 48% 63%
Maize 0% 15% 1% 1% 6% 9% 2% 1% 4%
Pulses 0% 38% 1% 1% 10% 12% 5% 1% 6%
Vegetables 33% 8% 60% 31% 46% 32% 53% 28% 43%
Fruits 33% 92% 32% 47% 49% 38% 39% 68% 45%
Betel 0% 0% 5% 2% 5% 1% 5% 1% 4%
Groundnuts 0% 0% 2% 1% 2% 0% 3% 1% 2%
Other crop 0% 0% 4% 4% 0% 0% 2% 5% 2%
Annex 5: Agricultural constraints by township and agro-ecological zone
22
Central Forest Area
Mountainous Forest Area
Coastal Zone
Delta Zone
Good Access
to Land Buthidaung Maungdaw Rathedaung Total
No suitable land available 0% 0% 4% 3% 3% 1% 4% 3% 3%
High rental fees for land 0% 0% 0% 1% 2% 1% 1% 0% 1%
Animal pests 0% 15% 2% 8% 2% 3% 2% 12% 5%
Plant diseases 27% 23% 9% 24% 2% 24% 5% 17% 12%
Drought 0% 0% 0% 0% 0% 0% 0% 0% 0%
Flood/landslides 7% 15% 31% 4% 40% 35% 29% 3% 24%
High costs of labour 33% 0% 9% 1% 3% 0% 9% 1% 5%
Not enough labour available 0% 0% 0% 2% 2% 0% 1% 3% 1%
High costs of agri inputs 20% 8% 27% 25% 7% 14% 18% 23% 18%
Other 0% 15% 5% 4% 17% 9% 12% 4% 9%
No constraints 13% 23% 14% 27% 21% 12% 19% 35% 21%
Land destroyed during 2010 flood 93% 80% 68% 91% 58% 59% 71% 92% 72%
Land not destroyed during 2010 flood
7% 20% 32% 9% 42% 41% 29% 8% 28%
Annex 6: Access to water and sanitation by township and agro-ecological zone
Central Forest Area
Mountainous Forest Area
Coastal Zone
Delta Zone
Good Access
to Land Buthidaung Maungdaw Rathedaung Total
Access to improved drinking water source
50% 25% 79% 31% 56% 35% 68% 37% 51%
Piped water 0% 0% 1% 0% 3% 3% 1% 0% 1%
Borehole with pump 50% 0% 59% 0% 31% 4% 52% 0% 27%
Other protected source
0% 26% 19% 31% 21% 28% 15% 37% 23%
Unprotected source 50% 74% 21% 69% 44% 65% 32% 63% 49%
No treatment of water 90% 100% 75% 66% 71% 80% 69% 70% 73%
Boiling 10% 0% 3% 1% 4% 2% 5% 0% 3%
Using a filter 0% 0% 22% 33% 25% 18% 26% 30% 24%
Received nutrition/hygiene training
23% 18% 27% 27% 32% 28% 32% 19% 28%
No latrine 57% 100% 27% 61% 34% 48% 32% 76% 46%
Surface latrine 17% 0% 19% 16% 31% 30% 24% 2% 21%
Direct pit latrine 17% 0% 20% 0% 7% 3% 14% 0% 8%
Fly Proof latrine 10% 0% 34% 23% 27% 20% 30% 22% 25%
Annex 7: Exposure to shocks and other difficulties by township and agro-ecological zone
23
Central Forest Area
Mountainous Forest Area
Coastal Zone
Delta Zone
Good Access
to Land Buthidaung Maungdaw Rathedaung Total
Few job opportunities/low wages
97% 78% 75% 68% 72% 68% 76% 71% 73%
Sickness/health expenditures
77% 55% 47% 48% 60% 60% 54% 44% 54%
Floods, heavy rains, landslides
20% 25% 21% 11% 38% 37% 23% 11% 25%
Debt to reimburse 7% 18% 21% 25% 11% 8% 15% 39% 18%
Education expenditure 23% 8% 2% 9% 8% 15% 3% 5% 7%
Unable to practice agriculture
17% 0% 4% 5% 5% 3% 6% 6% 5%
Unable to practice fishing
0% 3% 11% 6% 1% 2% 6% 7% 5%
High post-harvest losses
10% 5% 3% 7% 2% 6% 2% 6% 4%
Unable to obtain a good price for agricultural produce
7% 10% 0% 5% 3% 7% 1% 5% 4%
Lack of access to markets
0% 10% 1% 1% 2% 4% 1% 1% 2%
drought 0% 0% 0% 0% 0% 1% 0% 0% 0%
Other 0% 0% 17% 1% 17% 11% 14% 1% 10%
No shock 0% 0% 2% 7% 3% 2% 3% 7% 4%
Annex 8: Coping strategies by township and agro-ecological zone
Central Forest Area
Mountainous Forest Area
Coastal Zone
Delta Zone
Good Access
to Land Buthidaung Maungdaw Rathedaung Total
No coping 10% 15% 11% 10% 14% 13% 12% 11% 12%
Low (1-7) 17% 18% 19% 31% 31% 27% 24% 36% 27%
Medium (8-17) 37% 45% 26% 36% 27% 32% 28% 34% 31%
High (18+) 37% 23% 43% 22% 28% 28% 35% 19% 30%
Rely on less preferred and less expensive food
90% 85% 81% 83% 74% 78% 79% 84% 79%
Purchase food on credit, incur debts or borrow food
50% 60% 72% 71% 57% 68% 60% 69% 64%
Limit portion size at meals
77% 48% 64% 39% 54% 50% 60% 35% 52%
Restrict consumption by adults in order for small children to eat
60% 33% 56% 25% 43% 38% 49% 24% 41%
Reduce number of meals eaten in a day
70% 28% 34% 19% 37% 38% 38% 9% 32%
Food gift / rely on food help from friends or relatives
20% 15% 22% 15% 16% 15% 17% 21% 17%
Skip entire days without eating
17% 8% 15% 8% 12% 16% 13% 1% 12%
Annex 9: Demographic factors by township and agro-ecological zone
24
Central Forest Area
Mountainous Forest Area
Coastal Zone
Delta Zone
Good Access
to Land Buthidaung Maungdaw Rathedaung Total
Female headed HH head 13% 3% 27% 24% 26% 16% 28% 26% 24%
% of HH with children<5
73% 55% 65% 42% 63% 59% 61% 44% 57%
% of HHs with female HH and children under<5
0% 3% 11% 10% 11% 7% 11% 11% 10%
HH size 6.3 5.9 7.0 5.3 6.5 6.3 6.6 5.2 6.2 % of females 49% 50% 56% 57% 57% 55% 56% 57% 56% % of children<5 17% 13% 18% 10% 16% 15% 17% 10% 15% % of elderly 0% 3% 2% 9% 3% 5% 3% 8% 4%
1-3 persons 17% 18% 11% 21% 16% 15% 15% 22% 17% 4-6 persons 33% 43% 31% 49% 33% 39% 32% 51% 38% 7-9 persons 37% 28% 38% 27% 36% 33% 37% 24% 33% above 10 persons 13% 13% 19% 2% 15% 13% 15% 2% 12%
Dependency ratio (dep per one non dep) 1.2 1.2 1.5 1.2 1.3 1.5 1.3 .9 1.3
High (more than 2 dep per 1 non dep) 10% 15% 23% 17% 17% 25% 17% 10% 18%
Medium (>1 to 2 dep per 1 non dep) 38% 25% 27% 24% 27% 29% 27% 21% 26%
Low (1 dep or less per 1 non dep) 52% 60% 49% 60% 56% 46% 57% 69% 56%
Annex 10: Livelihood activities by township and agro-ecological zone
Central Forest Area
Mountainous Forest Area
Coastal Zone
Delta Zone
Good Access
to Land Buthidaung Maungdaw Rathedaung Total
Casual wage labour 83% 58% 73% 60% 61% 61% 67% 61% 64%
Regular salary 0% 3% 3% 3% 5% 4% 4% 1% 4%
Farming 31% 18% 12% 26% 22% 29% 16% 22% 21%
Fishing 7% 3% 36% 14% 10% 7% 21% 19% 16%
Wood/bamboo cutting 52% 53% 17% 26% 20% 32% 21% 21% 25%
Trade/business 0% 3% 5% 3% 2% 1% 4% 3% 3%
Small trade 10% 10% 11% 16% 13% 12% 13% 16% 13%
Artisan 14% 0% 8% 3% 5% 4% 8% 1% 5%
Remittance 0% 3% 5% 3% 5% 2% 6% 3% 4%
Sale of livestock 7% 3% 2% 4% 4% 4% 3% 4% 3%
Marginal livelihood 0% 18% 9% 4% 10% 11% 8% 3% 8%
No income earner 0% 0% 2% 1% 2% 2% 1% 1% 1%
1 income earner 67% 65% 70% 69% 74% 70% 73% 66% 71%
2 income earners 13% 25% 24% 26% 19% 21% 21% 26% 22%
3 or more 20% 10% 4% 4% 5% 6% 4% 7% 6%
Household with labour migrant
0% 5% 12% 16% 9% 6% 12% 16% 11%
Destination: Yangon 0% 0% 0% 24% 0% 38% 0% 14% 10%
Destination: Other, within Myanmar
0% 100% 17% 55% 21% 62% 19% 55% 36%
Destination: Outside Myanmar
0% 0% 83% 21% 79% 0% 81% 32% 53%
Duration: Less than 3 month a year
0% 0% 22% 6% 15% 8% 18% 5% 12%
Duration: Between 3 and 6 months a year
0% 50% 0% 12% 0% 15% 0% 14% 7%
Duration: More than 6 months a year
0% 50% 0% 45% 0% 31% 0% 55% 22%
Permanent 0% 0% 78% 36% 85% 46% 82% 27% 59%
Annex 11: Asset ownership by township and agro-ecological zone
25
Central Forest Area
Mountainous Forest Area
Coastal Zone
Delta Zone
Good Access
to Land Buthidaung Maungdaw Rathedaung Total
Livestock owner 67% 78% 75% 72% 78% 68% 78% 79% 75%
Goat 3% 0% 14% 18% 13% 9% 14% 19% 14%
Pig 3% 48% 2% 23% 6% 14% 5% 29% 13%
Poultry 60% 50% 70% 62% 73% 60% 73% 65% 67%
Cattle 27% 13% 20% 15% 24% 17% 24% 14% 20%
Buffalo 0% 3% 0% 10% 0% 3% 0% 11% 3%
Farm machinery 30% 13% 19% 21% 28% 20% 25% 24% 23%
Tractor/trawlagyi 0% 0% 0% 0% 0% 0% 0% 1% 0%
Agricultural tools 87% 95% 62% 67% 69% 68% 67% 76% 69%
Boat without engine
0% 3% 1% 4% 1% 1% 1% 6% 2%
Boat with engine 0% 0% 0% 0% 0% 0% 0% 0% 0%
Fishing net 7% 5% 33% 9% 13% 7% 21% 14% 15%
Sewing machine, handicraft tools
3% 3% 4% 4% 2% 4% 4% 1% 3%
Cash/other savings 0% 3% 7% 8% 8% 0% 9% 12% 7%
Motorbike 0% 0% 1% 0% 0% 0% 1% 0% 0%
Car, taxi, truck 0% 0% 0% 0% 0% 0% 0% 0% 0%
Generator 0% 0% 1% 1% 0% 0% 1% 1% 1%
Television 0% 0% 1% 2% 0% 1% 1% 2% 1%
Radio 3% 13% 7% 14% 5% 9% 6% 13% 8%
Bicycle 0% 3% 8% 1% 7% 2% 9% 0% 5%
Annex 12: Share of expenditure and indebtedness by township and livelihood zone
Central
Forest Area Mountainous Forest Area
Coastal Zone
Delta Zone
Good Access
to Land Buthidaung Maungdaw Rathedaung Total
% Food 64% 70% 68% 66% 64% 62% 68% 67% 66% % Education 4% 5% 2% 6% 4% 7% 3% 5% 4% % Health 18% 13% 10% 13% 14% 15% 11% 13% 13% % Clothes/ shelter
0% 1% 4% 3% 3% 4% 3% 3% 3%
% Farm inputs 6% 1% 1% 2% 3% 4% 2% 1% 2% % Utilities 7% 9% 13% 9% 10% 7% 13% 10% 10%
% Transport 0% 1% 0% 0% 0% 0% 0% 0% 0%
% Other 0% 1% 1% 1% 0% 1% 1% 0% 1%
Indebted 80% 70% 87% 83% 80% 85% 81% 79% 82%
For food 54% 61% 60% 57% 58% 56% 61% 52% 58%
For health expenses
17% 21% 19% 16% 20% 18% 17% 22% 18%
For education 0% 0% 2% 3% 2% 3% 1% 1% 2%
For farm inputs 25% 7% 5% 14% 8% 15% 5% 14% 10%
For livestock inputs
0% 0% 1% 0% 0% 0% 0% 0% 0%
To buy livestock
0% 0% 0% 1% 0% 0% 0% 1% 0%
To buy or rent land
0% 0% 0% 1% 0% 1% 0% 0% 1%
To buy or rent a flat/house
0% 0% 1% 0% 0% 0% 0% 0% 0%
For social events
0% 0% 6% 1% 4% 2% 5% 0% 3%
Other reason 4% 11% 7% 8% 7% 5% 8% 11% 8%
Pay after 4 months
38% 68% 52% 66% 53% 55% 56% 62% 57%
Pay 2-4 months
54% 21% 23% 23% 31% 33% 24% 27% 27%
Pay less than 2 months
8% 11% 25% 10% 16% 12% 20% 11% 16%
Annex 12: Enrolment and attendance by township and agro-ecological zone
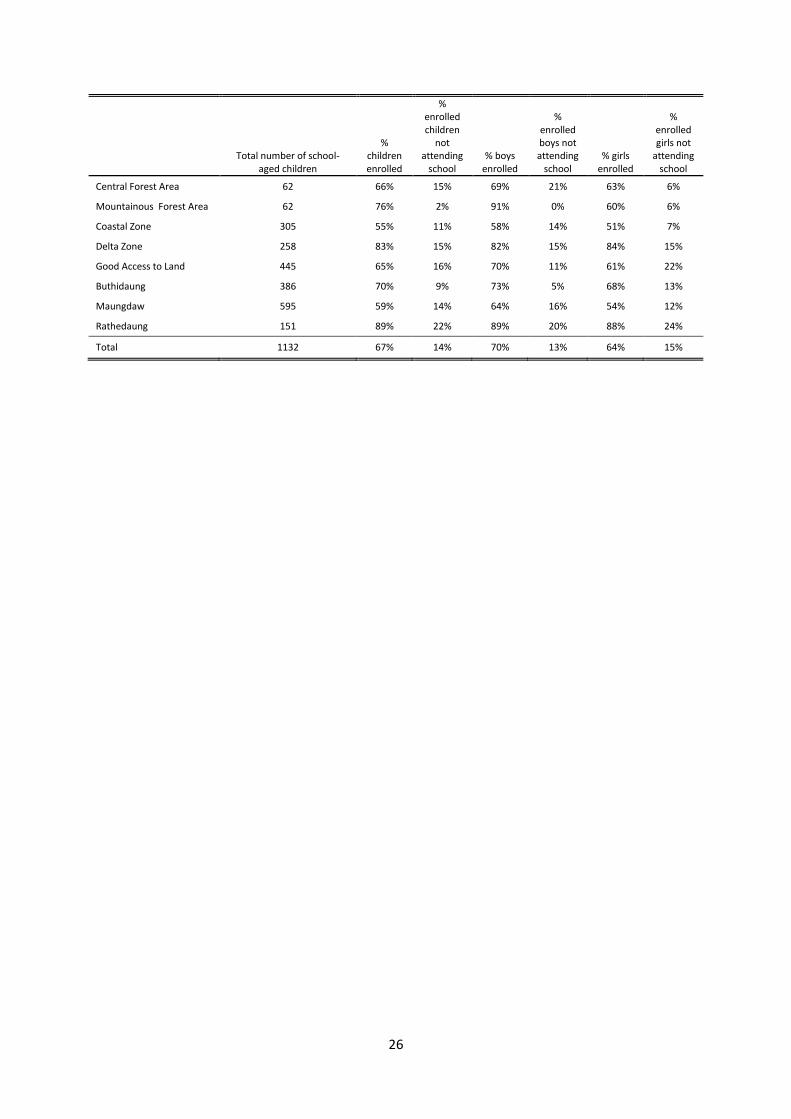
26
Total number of school-
aged children
% children enrolled
% enrolled children
not attending
school % boys
enrolled
% enrolled boys not attending
school % girls
enrolled
% enrolled girls not
attending school
Central Forest Area 62 66% 15% 69% 21% 63% 6%
Mountainous Forest Area 62 76% 2% 91% 0% 60% 6%
Coastal Zone 305 55% 11% 58% 14% 51% 7%
Delta Zone 258 83% 15% 82% 15% 84% 15%
Good Access to Land 445 65% 16% 70% 11% 61% 22%
Buthidaung 386 70% 9% 73% 5% 68% 13%
Maungdaw 595 59% 14% 64% 16% 54% 12%
Rathedaung 151 89% 22% 89% 20% 88% 24%
Total 1132 67% 14% 70% 13% 64% 15%
Recommended