Food Portion Size Perceptions of Various
Athletes at the University of
Wisconsin - Stout
by
Krista Hight
A Research Paper Submitted in Partial Fulfillment of the
Requirements for the Master of Science Degree
In
Food and Nutritional Sciences
The Graduate School
University of Wisconsin-Stout
May, 2008
11
The Graduate School University of Wisconsin-Stout
Menomonie, WI
Author: Hight, Krista K.
Title: Food Portion Size Perceptions of Various Athletes at the
University of Wisconsin-Stout.
Graduate Degree/ Major: MS Food and Nutritional Sciences
Research Adviser: Janice Coker, Ph.D.
MonthrYear: May, 2008
Number of Pages: 83
Style Manual Used: American Psychological Association, 5th edition
ABSTRACT
Americans' waistlines are expanding at a rapid rate. Large portion sizes may be to
blame as they supply more calories and entice individuals to eat more (Young and Nestle,
2002). Registered dietitians obtain dietary intake information from patients and clients,
but usually with impaired accuracy. Portion estimation is a major source of error since
most people cannot identify a standard portion size. Collegiate athletes are typically
leaner than the general population, but are also at risk for portion distortion and obesity in
the future ifthey lead more sedentary lives after completing their athletic career. The goal
of this study was to determine the typical portion sizes that various athletes consume,
what they perceive to be a standard portion size, and to determine if specific factors play
a significant role in their portion size choices. This study used life-size color photographs
of six common foods as a portion estimation aid. There were 86 participants, all of whom
were athletes at UW-Stout. Football players tended to have a higher body mass index
111
(BMI) than cross country runners. This study found that males typically consume larger
portions than females. Most subjects typically consumed larger portions than the standard
portion size, and many were unable to correctly identify the photo that represented a
standard portion. Registered dietitians should provide nutrition education that emphasizes
portion sizes and calorie differences between portions to help fight the obesity epidemic.
IV
The Graduate School
University of Wisconsin Stout
Menomonie, WI
Acknowledgments
I would like to take the opportunity to thank many people who have been a part of my life
through the research and writing of this paper. First and foremost is God, without Him, I am
nothing, and I acknowledge that above all else. The gifts He has given to me have enabled me to
complete this paper and persevere through all things in life.
I want to thank Daddy and Mamma for their complete support including encouragement,
love, lectures to get it done, and financial support of my education. Without them, I definitely
would not be where I am today. Thanks to my brothers and sister-in-law who have been there as
well to encourage me to keep going on the paper, and for their understanding and love. Thanks to
many of my friends who maybe didn't quite grasp what it takes to research and write a paper as
extensive as a thesis paper, but who offered understanding, support, encouragement, and patience
through it all.
A special thanks to Janice Coker for being my advisor, helping me corne up with my
topic for research, and providing edits and suggestions the whole way through. Thanks again to
my thesis committee for continued support, encouragement, and time spent helping me
throughout the research, writing, and editing process, as well as allowing me to pass my defense,
and finally, turn the paper in!
To anyone that I might have forgotten to mention above: I appreciate you, and I am
grateful that you have been a part of my life.
v
TABLE OF CONTENTS
...............................................................................................................................Page
ABSTRACT ii
List of Tables vii
List of Figures viii
Chapter 1: Introduction 1
Statement ofthe Problem 2
Purpose ofthe Study 3
Assumptions ofthe Study 4
Definition ofTerms 4
Limitations ofthe Study 5
Methodology 5
Chapter II: Literature Review 6
Introduction to Reported Dietary Intake 6
Portion Size Estimation 6
Trends in Food Consumption 7
Portion Size Affects Amount Consumed 9
Trends in Food Consumption Among College Students 10
Portion Selection ofYoung Adults 12
Validity ofPortion Size Measurement Aids 14
Role ofAge, Sex, BMI in Portion Estimation 15
Estimation ofLarge Portion Sizes 17
Effect ofPortion Size on Energy Intake 18
VI
Prevalence ofObesity in Former Athletes 24
Three Dimensional Portion Size Aids 25
Two Dimensional Portion Size Aids 26
Food Photographs 28
Photographic Atlases for Assessing Portion Size 30
Portion Photos ofPopular Foods 31
Chapter III: Methodology 33
Subject Selection and Description 34
Instrumentation 35
Data Collection Procedures 35
Data Analysis 36
Limitations 37
Chapter IV: Results 38
Item Analysis 39
Description ofSubjects 39
Chapter V: Discussion 57
Limitations 58
Conclusions 58
Recommendations 61
References 63
Appendix A: Consent to Participate 68
Appendix B: Survey 71
Vll
List of Tables
Table 1: Mean and Standard Deviation for Demographics By Gender. 53
Table 2: Mean and Standard Deviation for Demographics By Sport 54
Table 3: BMI Category By Gender 55
Table 4: BMI Category By Sport 56
Table 5: Survey Responses By Gender 58
Table 6: Survey Responses By Sport 60
Vlll
List of Figures
Figure 1: Estimates of Portion Size for Cornbread 62
Figure 2: Estimates of Portion Size for Rice 63
Figure 3: Male and Female Estimates of Portion Size For Rice 64
Figure 4: Estimates of Portion Size for Pancakes 65
Figure 5: Estimates of Portion Size for Mixed Vegetables
Figure 6: Estimates of Portion Size for Watermelon 67
Figure 7: Male and Female Estimates of Portion Size For Watermelon 68
Figure 8: Estimates of Portion Size for Beef Patty 69
66
1 Chapter I: Introduction
In order to obtain the most accurate dietary intake records from a patient or client,
it is necessary to have an estimate of the amount of food consumed (Foster et al., 2006).
Food portions can be approximated using several different methods. The most common
techniques used for estimating portion size include the following: obtaining the weight of
food, observation of eating, food records, food frequency questionnaires, and dietary
recalls. Each method has its strengths and limitations in terms of time, cost, effectiveness,
and ease of use (Williamson et al., 2003). Responses from subjects on food frequency
questionnaires, food diaries, or 24-hour recalls depend on the individual's ability to
accurately estimate portion sizes. Individuals have a tendency to underestimate large
portions in dietary assessments. Food photographs have frequently been used as an aid to
subjects recalling their portion size on dietary surveys (Nelson, Atkinson & Darbyshire,
1996). There are few resources that represent portion sizes in photographic form. The
book that is most inclusive to date, representing over 100 foods in the United States (US),
is the Portion Photos of Popular Foods (Hess, 1997).
Most of the population is unable to identify standard portion sizes that have been
established by the US Department of Agriculture (USDA), as seen on MyPyramid, or on
the Nutrition Facts label printed on food packages (Seligson, 2003; Young & Nestle,
2002). Not only do consumers have difficulty identifying standard portions, but
advertisements and portions served at establishments outside the home further skew their
view of portion sizes. Larger portion sizes supply more calories and also entice
individuals to eat more (Young & Nestle).
Obesity in the United States has been on the rise at a rapid rate since the 1970s
(Hedley et al., 2004). The Center for Disease Control (CDC) reports that adult obesity
has more than doubled from 15% in the 1970s to 32.9% in 2003. The CDC defined
overweight individuals as those who had a BMI between 25 and 29.9. Obese individuals
2 were classified as those who had a BMI greater than or equal to 30. In 1991, there were
no states with obesity rates at 20% or higher. By 2006, only four states with obesity rates
under 20% remained. Approximately 34% of adults over age 20 are obese (Center for
Disease Control and Prevention, 2007).
The general cause of the rapid increase in prevalence of obesity is more calories
consumed than the amount of energy an individual burns (Nestle, 2003). Portion sizes
have certainly increased, indicating that consumers are taking in excess calories, thus
leading to weight gain. The food produced in the US now provides 500 calories per day
per capita more than in the 1970s, indicative of an increase in energy intake. Common
foods were researched by Young and Nestle (2002) to see how portion sizes contribute to
the rise in prevalence of obesity. Their findings showed that since the 1970s, cookies are
now up to seven times larger, cooked pasta is usually five times the standard portion size,
and muffins are more than three times the standard portion size. Fast foods like
hamburgers, French fries, and soda are two to five times the size at which they were first
introduced. Consumers believe these larger portions are typical as car manufacturers
make bigger cup holders to hold the Seven Eleven 64-ounce "Double Gulp" soft drink
and other soft drinks that have increased in size. Restaurants are using larger plates and
bakers use bigger muffin tins. Consumers get sucked into the greater value of buying the
larger portions because they get more food for their money. Large food portions have
been shown to increase energy intake by up to 56%. Limiting portion sizes can help
lower caloric intake (Ledikwe, Ello-Martin, & Rolls, 2005). Due to the dramatic increase
in portion sizes, public health education should focus on the need to return to smaller
portions (Young & Nestle).
Statement ofthe Problem
Portion distortion is one of the major contributing factors to the obesity epidemic.
Larger food portion sizes contain more calories and also encourage people to eat more.
3 When individuals consume more calories than they typically bum, it leads to weight gain.
This is a topic of interest with athletes because one day they will become former athletes,
and will possibly lead more sedentary lives. Collegiate athletes typically are not
overweight or obese; however, if they experience portion distortion now, there is a high
probability it will continue, putting them at risk to be overweight or obese like the general
population. This study investigated the perceptions of portion sizes of six common foods
by various athletes at the University of Wisconsin-Stout to see if specific factors played a
role in the athletes' perceptions of portion size. Dissemination of the outcomes of this
study provided a basis for identifying to what extent athletes may experience portion
distortion. It also presented the opportunity for dietitian intervention to educate athletes
about standard food portion sizes, and the importance of maintaining an active lifestyle to
manage weight (Schwartz, & Byrd-Bredbenner, 2006).
Purpose ofthe Study
The goal of this study was to determine the typical portion sizes that various
athletes consume, what they perceive to be a standard portion size, and to find out if
specific factors playa significant role in their portion size choices.
The specific objectives of this research were as follows:
1. Identify factors that significantly affect subjects' typical portion size and subjects'
view of a standard portion size.
2. Analyze the subjects' portion size perceptions to determine ifthey are able to identify a
standard portion size of six commonly consumed foods using life-size color food
photographs.
3. Determine if it is necessary for dietitians to educate athletes about standard portion
sizes and energy intake as a basis for weight management.
4 Assumptions ofthe Study
It was assumed in this study that the subjects were honest in their responses on the
survey, and chose the letter that best corresponded to their typical portion size as well as
their perception of a standard portion size. Another assumption is that subjects know
English and were able to clearly see the food photographs.
Definition ofTerms
Body Mass Index (BMI) is an assessment of weight compared to height. To
calculate BMI, weight in kilograms is divided by height in meters squared (kg/m2). The
resulting number is the BMI (National Institute of Health, Medline Plus, 2006).
In the data presented in Chapter four, BMI categories are as follows: anorexic is
<17.5, underweight is 17.5-20.7, normal range is 20.7-26.3, marginally overweight is
26.3-27.7, overweight is 27.7-31.1, obese is 31.1-35, severely obese is 35-40, and
morbidly obese is >40.
Disinhibition is the tendency to eat in excess when food is appealing and readily
available, such as at a buffet (Ard, Desmond, Allison, & Conway, 2006).
Portion distortion is defined as perceiving "large portion sizes as appropriate
amounts to eat at a single eating occasion" (Schwartz & Byrd-Bredbenner, 2006, p.1412).
Standard portion size is the portion size of a food as recommended by the
USDA's MyPyramid. For example, a standard portion size, or a standard serving size, of
cooked rice is 1/3 cup.
Typical portion size is defined as the amount of food individuals deem appropriate
to serve themselves for consumption at a single eating occasion.
5 Limitations ofthe Study
One of the limitations of the study was the number of participants from each
sport. There were fewer total athletes on all teams participating in the study compared to
number of athletes on the football team. The sample size for the study was relatively
small at a Wisconsin university that draws students mostly from Wisconsin and
Minnesota. Therefore, the sample size may not be generalizable to collegiate athletes
outside of the University of Wisconsin-Stout. Another limitation was that the athletes
may have known each other and possibly discussed the study amongst themselves.
Subjects may also have responded to survey questions according to what they thought
were the researcher's expectations instead of choosing the answers that best represented
their perspective.
Methodology
This thesis is prepared in five chapters. Chapter two will examine previous
research related to this study. The methods of the research are explained in chapter three.
Presentations of the results of the research are included in chapter four. Chapter five
includes the discussion, conclusions, and applications of the research.
6
Chapter II: Literature Review
Introduction to reported dietary intake
Existing methods for describing dietary intake and assessing an individual's intake
ranges from quantitative approaches, which require the actual weighing of food
consumed, to qualitative approaches, such as diet histories (Howat et al., 1994). There is
no ideal method for evaluating dietary intake. It is important for nutrition professionals to
work with clients on dietary intake and to be as accurate as possible because obesity rates
are higher than ever and are continuing to rise in parallel to increasing portion sizes. Most
people do not realize how much they are eating or the calories contained in the foods they
eat, so nutrients and calories are figured based on the individual's reported food
consumption. There is some inaccuracy in reporting dietary intake due to an individual's
variation in food consumed from day to day, poor memory recall, inability to estimate
portions resulting in over or underestimation, and inadequate knowledge of portion sizes.
Portion Size Estimation
"In adults, the ability to estimate portion size of food eaten appears to be affected
by the food type, the quantification aid used, and consistency of subject's perceptions and
estimation skills" (Robson & Livingstone, 2000, p. 281). Portion size measurement aids
(PSMAs) may be beneficial for subjects trying to accurately describe portion sizes
(McGuire, Chambers, Godwin, & Brenner, 2001). According to Godwin, Chambers, and
Cleveland (2004), numerous factors playa role in reliability of aids used for estimation
including the way the aids are presented to the subjects, the type of aid used for recall, the
food type and shape, characteristics of the subject, and the extent to which the aid
resembles the size and shape of the food.
Williamson et al. (2003) conducted a study comparing portion size estimates
using digital photography versus weighed and visual estimation methods. Foods in the
7 study were made to represent typical meals in a university cafeteria. There were 60 meals
of 10 varying portion sizes prepared for test meals. The meals included an entree,
starches, vegetables, fruits, desserts, condiments, and beverages. Reference foods were
prepared and weighed in usual portion sizes to compare with test meals for when
researchers did the direct visual estimation. Food items of each meal were weighed
beforehand. Meal portions were 0% to 235% of reference portions. Researchers were
trained to use the visual estimation method and another group of researchers was trained
to estimate food using digital photography. Estimates were recorded as a percentage of
the reference portion size such as 10%, 90%, 100%, etc. The reference portions, portions
selected by participants, and leftovers on the plate for all meals were used in the digital
photography method. Food was photographed using a digital video camera and put into a
computer program specifically made for estimating food portions in digital photographs.
The results of the study showed that digital photography is a valid way to measure
food selections, plate waste, and food intake. Digital photography and visual estimation
provided similar estimates. For both digital photography and visual estimation, there was
a small tendency towards portion overestimation. Direct visual estimation was the more
accurate method for portion estimation. This study showed that digital photography and
direct visualization by trained observers are both accurate methods for portion estimation
(Williamson et al., 2003).
Trends in food consumption
Marion Nestle has done extensive research on the increase in portion sizes and the
obesity epidemic. The cause of obesity is essentially consuming more calories than an
individual expends. Over time, the weight gain leads to obesity. Nestle (2003) found that
people tend to see a food as a single portion size, no matter what size it is. Most
individuals do not realize that larger portions provide more calories.
8 Young and Nestle (2002) studied the change in portion sizes from the 1970s to
date. In 1970, only about 34% of food was consumed outside the home. By the late
1990s, food consumed outside the home had increased to 47%. Restaurants and fast food
outlets serve larger portions because it provides the customer with more value for their
money. Young and Nestle sampled foods such as steak, soda, cake, white bread products,
and alcoholic beverages from many types of restaurants. Foods were weighed and the
weight was compared to standard portions that have been established by the USDA and
the Food and Drug Administration (FDA) for food labels. Information was also collected
about the portion sizes of the foods from manufacturers, professionaljoumals,
advertising, menus, cookbooks, and old food composition tables. All of the foods and
beverages, except the white bread, surpassed the USDA and FDA standard portions.
Cookies had the largest increase at 700%, pasta was 480%, muffins were 333%, steak
was 224%, and bagels were 195% larger. Hamburgers and French fries are offered at two
to five times the size they were when they were first introduced. Large portions are seen
as a bargain by the consumer, and most people are choosing restaurants based on the size
of their portions. Young and Nestle concluded that more attention should be paid to the
fact that portion size plays a major role in weight management and total caloric intake.
Smiciklas-Wright, Mitchell, Mickle, Goldman, and Cook (2003) investigated the
change in reported portion size estimates from 1989-1991 and 1994-1996. The purpose of
their study was also to determine if portion sizes changed and if so, of which foods.
Portion estimates were completed by subjects two years and older on three consecutive
days. A 24-hour recall was taken on the first day and food records were kept for days 2
and 3. Subjects used rulers, measuring cups, spoons, and their own household cups and
bowls to help them estimate portions. The findings showed that there were significant
differences in the amount of food eaten at each eating occasion in 1989-1991 and 1994
1996 for 33 of the 107 foods the study reviewed. Most foods in 1994-1996 were reported
9 in larger portions than in 1989-1991, without a significant effect for age or gender. The
researchers concluded that portion sizes of many commonly consumed foods became
larger for both males and females of all ages after 1991. The researchers recommended
that data consumption should be looked at again in the future to observe any changes in
portion sizes from the 1994-1996 study.
Portion size affects amount consumed
When subjects are given a predetermined amount of food on a plate, there has
been an effect of portion size. When subjects serve themselves, the amount of food eaten
was relatively consistent. Researchers Rolls, Morris, and Roe (2002) hypothesized that
when subjects were able to serve themselves, the amount of food presented in a serving
dish would not have an effect on their intake, but when the researcher dished out the
portion on their plate, then portion size would affect their intake.
The study included fifty-one male and female subjects, who were 21-40 years old,
in good health, not trying to gain or lose weight, not taking medication that would affect
appetite, were not athletes in training, were not pregnant or lactating, regularly ate three
meals per day, and had no food restrictions that would affect their intake participated in
the study. Subjects completed a questionnaire that evaluated dietary restraint, perceived
hunger, disinhibition, and an eating attitudes test that tested for eating disorders. Height
and weight were also measured and recorded. Testing was completed on four different
days, with test dates one week apart. Subjects arrived at the laboratory for lunch to obtain
macaroni and cheese served in one of four portion sizes: 500,625, 750, or 1000g. One
group of subjects got the macaroni and cheese on a plate, and the other group received it
in a serving dish to serve themselves the portion they wanted. Subjects were assigned to a
group based on matching age, sex, BMI, and scores for dietary restraint and disinhibition.
The food was weighed before and after the meal to figure out how much each subject ate.
For the individuals who served themselves, the macaroni and cheese taken from the dish
10 was weighed as well as leftovers from the plate. Subjects completed a discharge
questionnaire asking if they knew the purpose of the study, factors that affected
responses, and whether they noticed any differences in the test days (Rolls et al., 2002).
There were 27 subjects in the pre-portioned group and 24 subjects in the group
that served themselves. There was no difference between men and women in age or
disinhibition, but men had higher body mass indexes (BMls), and women had more
dietary restraint and depression. The subjects in both groups ate more macaroni and
cheese as portion size increased, so there was no significant difference between serving
method. Participants ate 30% more food and calories when they were given the largest
portion of macaroni and cheese than when they had the smallest portion. Subjects in both
groups ate 67% of the smallest portion, but 43% of the largest portion. Ratings of hunger
and satiety were not significant. Age, gender, BMI, dietary restraint, and disinhibition did
not have a significant effect, meaning that men and women, overweight and normal
weight, restrained and unrestrained, were affected by portion size. Only 45% of subjects
reported that they noticed a difference in portion size from each test day. The portions
used in this study were relatively large, but were similar to the portions served in
restaurants. More people are dining out than ever, and the portions served in restaurants
provide more energy than most Americans need (Rolls et al., 2002).
Trends in food consumption among college students
The purpose of Guthrie's (1984) research study was to determine young adults'
perceptions of portion size, and to see how accurately they could describe a portion size
without additional aids such as food models or hints from the interviewer. College
students make up a large portion of the population that tend to enjoy convenience foods.
These students have busy lives with classes, jobs, and other activities, that can lead to
poor food choices. College students usually choose foods that have a long shelf life, are
easily portable, or can be found in vending machines. Convenience products are
11 increasing in portion size, and they often target this age group. As long as consumers are
unable to identify standard portion sizes of the foods they eat, they will continue to
consume larger portions. Guthrie's study included 147 adults, ages 18-30. Guthrie found
that serving size perceptions were widely varied. Men tended to choose larger portions
than women. A range of 8 to 68% of subjects could estimate some food items within
about 25% of the actual amount. Zero to two thirds of subjects overestimated portion
sizes by at least 51%. Guthrie concluded that subjects need assistance with estimating
portion sizes in order to obtain more accurate dietary intake data.
Research has shown that larger portions and an unlimited supply of food, such as
cafeteria-style dining, prompt individuals to eat more (Bryant & Dundes, 2005). College
students, especially those in the dorms, usually eat at a cafeteria, which increases their
risk of gaining weight. Bryant and Dundes studied portion sizes of college age adults.
The subjects included 42 undergraduates recruited from a sociology course at a
private university who represented various races, majors, and both sexes. Subjects were
asked to measure out their serving size of cereal if they were to just eat cereal for
breakfast without any other foods (no eggs, bacon, etc). Subjects were also instructed to
look at the cereal box to see the suggested serving size (one cup). They were to pour their
perception of a one cup serving into a second bowl. Subjects were given a 14-ounce bag
ofM&Ms® and asked to pour into a bowl the amount they usually consume if they were
having M&Ms® for a snack by itself. The third item was Hawaiian Punch®. Subjects
poured the amount of punch they would normally consume for dinner into a glass, and
were asked to estimate how many cups they would typically drink. To evaluate whether
larger bowls affect portion size, subjects were given two bowls, of varying sizes, and
were asked to pour another bowl of cereal as before, only this time, twice; once for both
the larger and the smaller bowl. Finally, participants filled out a questionnaire about how
much attention they pay to food labels, and whether they think their portion size is
12 affected by eating in a college cafeteria. The researchers weighed the cereal and M&Ms®
the students had poured (Bryant & Dundes, 2005).
The researchers found that about 33% of subjects typically ate twice as much, or
more, than the standard serving size. Only one third of respondents' estimates of the
actual serving size were within 90-110% of the serving size category. Slightly over one
third of respondents underestimated the actual serving size. They also found that 37% of
participants typically ate 200% of the standard serving size of M&Ms®, and 60% of
participants regularly drank 200% of the serving size for punch. Most males (86%) drank
larger portions of punch, and only 34% of females drank large portions. The difference in
intake between males and females was found to be significant. Most students felt that
cafeteria-style dining contributed to their selection of larger portion sizes. Bryant and
Dundes also found that the actual serving size of cereal and punch was less than half of
what the students typically consume. Only one third of subjects were able to estimate the
standard serving size of cereal within 10% of the actual amount. The researchers
expected to find that a bigger bowl in the second pouring of cereal would lead to pouring
a larger portion size; however, that was not the case in this study (Bryant & Dundes,
2005).
Portion selection ofyoung adults
In a study conducted by Schwartz and Byrd-Bredbenner (2006), the participants
were 16-26 years of age, and enrolled in an introductory psychology course at a
university. The purpose of the study was to determine typical portion sizes of young
adults, how their portions compare to standard portion sizes, and whether the sizes of
typical portions have changed over time. There were 63, 62, and 52 participants at
breakfast, lunch, and dinner. Most (64%) of subjects were freshman, and 75% of subjects
were female. The food for each meal was arranged on a buffet table in household serving
dishes. Dinner plates came in sizes of 7.5, 9, and 10.25 inches in diameter. Bowls were 6,
13 12, and 28 ounces in volume, and glasses were 12,20, and 32 ounces. Subjects could
choose the size they wanted to hold their typical portion size, to avoid limiting their
choices. Subjects were told to complete a questionnaire that obtained their demographic
information such as age, gender, and college major. The researchers also assessed their
hunger status and preference for the foods served to evaluate whether those factors
affected the selection of portion size. Each subject went individually to the buffet table to
self-serve the amount of food he or she would typically eat of each menu item. The
beginning weight of the food was recorded, and any leftovers on the plate were also
weighed and recorded to determine the weight of each individual's typical portion.
The researchers found that there was no significant effect on portion size from
factors like hunger status or preference for the foods. They also found that time of day
did not influence portion size selections. For some foods, males chose larger portions
than females. This was expected because males tend to have higher energy needs as they
are usually bigger than females. Typical portion sizes of cornflakes, milk on cereal, and
jelly tended to exceed standard portion sizes by more than 25%. Typical portion sizes of
butter, tuna salad, tossed salad, and salad dressing tended to be less than standard portion
sizes by 25% or more. "Individuals who are unaware of how the portion sizes they
typically select compare with reference portion sizes will likely face challenges in their
attempts to control their body weight..." (Schwartz & Byrd-Bredbenner, 2006, p. 1416).
Burger, Kern, and Coleman (2007) also studied the portion choices of college
students. There were 51 university students who participated in this study. The average
BMI of participants was 23.5. Each subject arrived at the lab to have height and weight
measured. Subjects also served themselves each food as if they were going to eat it as
either a snack or as part of a meal after instruction from the researcher. Provided for
participants was silverware of two sizes, an 11" inch dinner plate, and a 6" bowl, which
were placed on a scale to weigh the amount of food selected. Peanut butter, jelly, and
14 margarine were spread on bread to be more realistic, and the bread with the spread on it
was put on the scale. Corn chips were measured twice, once with a smaller 85 gram bag
of chips, and the second time with a large 368.5 gram bag of chips. Rice was measured as
a side dish and also as if it was part of a main dish. Liquids were presented with the
subject choosing the typical size cup they would use. Cups were available in sizes that
students usually find on campus from the 591 mL small to the 1.9 L extra large.
Participants poured the amount typically consumed at one time into the cup.
Results of the study showed that in general, subjects selected portion sizes
significantly larger than standard amounts for most of the food items. Packaging of food
had a significant effect on portion size. Subjects chose larger portions from the larger bag
of chips compared to the smaller bag. Males selected significantly larger portions of solid
foods than the reference portion size. Males also chose significantly larger portions of
high-energy density, high-fat, and high-carbohydrate foods than females. On the other
hand, there was no effect of gender on portion size selection of low-energy dense, low-
fat, or low-carbohydrate foods. The researchers found that a higher BMI predicted a
larger portion selection of five foods: peanuts, M&Ms®, cereal, jam, and soda. Those
with a higher BMI may see larger portions as more typical, leading to the consumption of
much larger portion sizes of energy-dense foods, and increasing their risk of obesity
(Burger et al., 2007).
Validity ofportion size measurement aids
In a study by Howat et al. (1994),44 women, ages 18 to 50 years participated.
Participant BMIs ranged from 16.9 to 64.5. Subjects were divided into two groups, 26 of
which were in the control group, trained with 24 different food models. The experimental
group had 18 subjects, trained with 13 different food models and 11 life-size
photographs. A 24-hour recall was conducted before training began and the other was
done after training. Calories were calculated using a computer-based program. The color
15 food photos were 16 x 16.5 inches and were depicted on a white plate in front of a one
inch grid background. Three portion tests were given to subjects to assess their ability to
estimate food portions using the knowledge they obtained in training. The tests were
completed before training, and 3 and 11 days after the training session. Participants
estimated portion sizes for 11 common foods in two separate sets. Subjects used food
models for portion estimation in the first set, and food photos for the second set of
portion estimations. Training provided participants with two photos, one with the actual
size given for comparison. The testing procedure gave only one photograph, and did not
identify the portion size. Subjects reported estimated quantities of the food portions,
which were compared to the actual amount of the food. The error was calculated from the
difference in the two values.
Most participants overestimated portion size using the food models and food
photos. The control group had more significant errors using the food photos. Greater
error using food models and photos was found for amorphous and liquid foods compared
to solid food, showing that form of the food can affect accuracy ofportion estimation.
Both training techniques did improve subjects' ability to recall and estimate food portions
more efficiently; however, estimates were better using food photos. There was no
correlation found among subjects' estimates of portion size and their BMI (Howat et al.,
1994).
Role ofage, sex, and BM! in portion estimation
The gender, age, and body size of an individual can playa role in perception of
portion size. Researchers Nelson, Atkinson, and Darbyshire (1994) examined the use of
photographs for portion estimation in relation to factors that may influence perception of
portion size, such as the size of the photo, the number of photos, and color versus black
and white photos. The researchers chose six common foods that were passed through a
small window to the subjects to view along with the photographs. Subjects were given a
16 visual analogue scale (VAS) labeled one to eight and were asked to mark the spot that
best represented the portion size of the food presented. Participants also wrote down a
number that described the amount of food on the plate as a fraction or percentage of the
amount shown in the photograph. The weight of the food was subtracted from the amount
the subject estimated on the VAS for each of the eight photos. The results from the study
showed that portions tended to be underestimated; however, they were underestimated
less often when using the eight photographs.
This study found highly significant data in relation to gender, age, and BMI.
Males underestimated portion sizes more than females. The 65 and older age group
tended to overestimate portion sizes for the eight photographs and underestimate portions
less than the other age groups. Subjects with a BMI greater than or equal to 30 tended to
underestimate portion size. Color photographs led to a slight overestimation when using a
single photograph versus eight photos. The researchers found that a single photo leads to
a higher percentage of error than using a series of eight photographs. They also noted that
large portions tended to be underestimated using a single photo instead of a series of
eight photos (Nelson et al., 1994).
A study by Lillegaard, Overby, and Andersen (2005) investigated whether
children and adolescents could estimate portion sizes accurately using food photographs,
and whether their age played a role in their ability to estimate portion sizes. A
photographic book of foods that contained 13 color photos was used for this study.
Photos were labeled A, B, C, or D with the letter A representing small portion sizes and
D representing large portion sizes. Subjects ranged in age from 9 to 19 with 41 females
and 22 males participating. Subjects were shown real plates of food and asked to estimate
the portion size of the food by comparing it to the portions in the photographs. They
wrote down the letter ofthe photo that they felt best represented the portion on the plate.
Subjects were presented with 17 food items in two different portion sizes to estimate.
17 The results showed that in general, 60% of portion estimations were correct, and
95% of estimations were made within an error of one photograph. When foods were
served exactly the same way it was depicted in the photograph, subjects were correct on
portion estimations 82% of the time. On the other hand, when the food differed from the
photo, such as in shape or portion size, only 48% of estimations were correct. There were
no significant differences between age and accuracy of portion estimation. The research
findings suggest that it may be easier to estimate food portions if the food closely
resembles the food in the photograph (Lillegaard et al., 2005).
Estimation oflarge portion sizes
One problem with estimating larger portions could be due to the size of portion
estimation aids used in relation to the size of the portion consumed. One study by
Harnack, Steffen, Arnett, Gao, and Luepker (2004) evaluated the accuracy of estimating
large portions that were eaten in a restaurant. The size of the portion estimation aid used
was assessed for accuracy in reporting. Subjects were 25 to 84 years old, and were served
a meal at a hotel restaurant in Minneapolis, ND'J". The meal consisted of hamburger on a
bun, French fries, ice cream, and the participant's choice of beverage. Demographic
information and subjects' height and weight were obtained. There were 49 subjects who
participated in the study. When participants finished eating, the researchers collected the
leftover food to be weighed, and amount eaten was calculated based on the weight of the
food they were served. After eating, subjects also estimated the amount of food they ate
using two different sizes of 3-dimensional (3D) food models. The smaller size of food
models depicted a two ounce hamburger patty, 2.14 ounce French fries, and 2.36 ounce
ice cream. The larger size food models displayed a 4 ounce hamburger patty, 3.21 ounce
French fries, and 4.71 ounce ice cream. When participants used the smaller size food
models to estimate how much they ate, they underestimated the amount they ate for all
three foods. When they used the larger food models to estimate their intake, participants
18 were closer to the actual portion consumed for ice cream, but still underestimated intake
of hamburger patty and French fries. Based on nutrient assessment of the foods, the
amount of calories in the food served to subjects was about 998 calories. The average
amount that subjects estimated they ate based on the portions they chose from the food
models was 599 calories from the smaller models and 728 calories from the larger food
models. The study concluded that larger portion sizes tend to be underestimated (Harnack
et al., 2004).
Effect ofportion size on energy intake
The energy density of foods has an effect on total caloric intake for both genders.
A study done by Kral, Roe, and Rolls (2004) included 39 female subjects, ages 20 to 45.
Subjects completed demographic and health questionnaires, as well as an assessment of
dietary restraint, disinhibition, hunger, attitude towards eating, depression, and degree of
emotional eating. Participants arrived at the lab on the same day each week for six weeks
for breakfast, iunch, and dinner. For lunch, subjects were given Italian pasta bake, made
in two separate energy densities, and served in three different portion sizes. To determine
how much the subject ate, the food was weighed before and after the meal. Before and
after each meal, subjects completed visual analogue scales (VAS) to rate their degree of
hunger, fullness, thirst, and prospective consumption. The results ofthe study showed
that there was a significant effect of portion size as well as a significant effect of energy
density on the weight of the food eaten at lunch. There was no significant interaction
between portion size and energy density, which means those factors act alone to affect
total food intake.
The researchers found that subjects ate 20% more food when they were given the
largest portion of pasta compared to when they had the smallest portion. Subjects also ate
10% less food when they were served the pasta with a higher energy density compared to
the pasta with lower energy density. Even though less food was consumed with the
19 higher energy density pasta, the overall caloric intake was 26% higher at lunch. When
served the biggest portion size of pasta, the combined effect of portion size and energy
density led to a 56% increase in caloric intake. Breakfast and dinner energy intakes did
not differ; only lunch was found to have an effect on total calorie intake. Taste ratings of
the pasta for both high and low energy density servings showed that the pasta was equally
well liked (Kral et al., 2004).
The subjects noticed that the portion size increased, and they also admitted to
being able to eat more when they were served a larger portion. Even though energy
density of the food varied, the participants did not rate hunger or fullness differently after
lunch. The researchers also noted that although subjects felt the portions were larger than
their usual portion sizes, they still responded to the larger portions by consuming more of
what they were served. Subject characteristics were not found to have any effect on the
portion of food or the energy density of the food. The conclusion of the study was that
large portions of energy dense foods contributed to increased caloric intake (Kral et al.,
2004).
Eating out often at fast food establishments is an indicator of high BMI in women.
For men, eating at restaurants and fast food establishments is associated with higher BMI
(Diliberti, Bordi, Conklin, Roe, & Rolls, 2004). In 2000, Americans put forth 47% of
their money for food on food eaten away from home, and it continues to increase. When
eating outside the home, consumers are served low-cost, energy-dense foods in large
portions. The study by Diliberti et al. investigated whether a larger portion size of an
entree had an effect on energy intake for a restaurant meal. A restaurant that served
cafeteria-style on a university campus was the location of choice, and participants were
served the entree at 100% of the standard portion size on five days, and 150% ofthe
standard portion size on the other five days. Participants were observed by the researchers
and amount of entree served was pre-weighed, then the amount leftover was weighed in
20 the research kitchen. The amount consumed was calculated and recorded. Those who
bought the entree completed a short survey about the appropriateness of the serving size,
how much they ate compared to what they typically consume, value for what they paid,
and taste of the entree. They also reported their sex and age, while researchers recorded
an estimate of the participant's body size in terms of underweight, normal weight,
overweight, or obese.
There were 89 participants who bought the 100% portion size and 91 participants
who bought the 150% portion size. The difference between the groups was not gender or
body size, but age and university status. More of the customers who bought the 150%
portion size were 25 to 34 years old and were graduate students. The researchers in this
study found that portion size had a significant effect on energy intake. For the 150%
portion size of the entree, participants obtained 43% more calories than those who bought
the 100% serving size. It was also noted that participants who bought the larger entree
also ate much more of the side items, such as tomato and a roll with butter, than those
who bought the smaller portion of the entree. Subject characteristics did not have an
effect on portion size and energy intake, meaning that there was a significant increase in
energy intake among both genders, all age groups, and in normal and overweight
participants (Diliberti et al., 2004).
On the survey rating for appropriateness of portion size, there was an effect of
body size. Underweight and normal weight individuals felt that the 150% portion was
closer to being too large than those who bought the 100% portion. Overweight and obese
participants felt that both portions were appropriate sizes. When participants rated their
perception of what they ate at the meal, ratings did not differ significantly between
individuals who had the larger portion and those who had the standard portion size. Even
though there were major differences in intake, the two groups did not differ in their
perception of how much food they ate. The female participants felt that they ate more at
21 the meal than they typically eat, whereas the men did not. The results of the study showed
that large portion sizes served in restaurants contributes to increased caloric intake.
Participants in this study ate significantly more when they were served a larger portion,
and they reported on the survey that they were not aware that they had eaten more food
due to the larger portion size (Diliberti et al., 2004).
A review by Ello-Martin, Ledikwe, and Rolls (2005), discussed research that
shows the effect of portion size on caloric intake and the influence of energy density and
portion size on intake. It seems that very young children tend to eat similar amounts of
food, no matter what size portion they are given. Children more or less under age three
respond to physiological hunger and satiety cues. As children get a little older, they tend
to use external cues more, such as the portion they are served. Rolls, Engel, and Berch (as
cited in Ello-Martin et al.) conducted a study that found some five year old children ate
significantly more calories when they were given a bigger portion size. In a later study,
investigators Fisher, Rolls, and Birch (as cited in Ello-Martin et al.) found that four-year
olds ate 25% more food when they were served an entree twice the size of what would
have been appropriate for them. They also ate 25% less food when they put the food on
the plate themselves versus an adult serving them a large portion of food. Ello-Martin et
al. concluded that since children over the age of three respond to environmental cues to
eat more food, it is no surprise that adults follow similar patterns.
In a study by Rolls, Roe, Meengs, and Wall (2004), when individuals were
offered 6,8, 10, or 12 inch sandwiches on different days, both genders significantly
raised their caloric intake in parallel to the increase in size of the sandwich. When served
the 12 inch sandwich, women ate 31% more calories, and men consumed 56% more
calories than when they were served the 6 inch sandwich. The participants rated their
hunger and fullness the same at the end of the meal even though food intake tended to
increase.
22 It could be argued that a large intake at one meal may lead to eating less at the
next meal. A study by Rolls, Roe, Kral, Meengs, and Wall (2004), researched how snack
portions affect energy intake. Subjects in this study were given different sized packages
of potato chips for a snack, and then received dinner later. When they were given the
largest size package of potato chips, the men ate 37% more chips and women consumed
18% more chips than when they were served the medium sized package. Subjects did not
change their intake at dinner after eating more calories during the snack.
From the previous study, Rolls, Roe, and Meengs (2006) proceeded to determine
whether portion size affects energy intake on more than just one eating occasion. Subjects
in the study ranged in age from 19 to 37 years, and had BMls of20 to 29. On two
consecutive days for three weeks in a row, participants ate breakfast, lunch, and dinner at
the lab. After each meal, they were given a snack to eat mid-morning, mid-afternoon, and
after dinner. The menus were the same each week, but the portions varied from 100%,
150%, and 200%. Female subjects were served greater than 3,000 calories each day and
men were served greater than 3,900 calories each day in order to ensure energy intake
was not restricted. Subjects used a visual analogue scale (VAS) to rate hunger, fullness,
and prospective consumption before and after each meal. A discharge questionnaire was
given to find out if subjects knew the purpose of the study and if they noticed any
changes between test days.
The results showed that overall caloric intake for the two days increased when the
portion size increased for both genders. When portions were increased to 50% above the
baseline amounts, men and women ate 16% more calories and obtained 120% of daily
calorie needs. When portions were increased to 100% above baseline amounts, subjects
obtained 26% more calories, or about 130% of daily energy needs. Subjects' intake did
not change between the first and second day, so they did not adjust to overeating on the
first day. Portion size and energy intake was not affected by age or BMI. Men did have a
23 higher energy intake than women. Almost all ofthe subjects noticed a change in portion
size, but only four subjects reported that it affected their intake. Overall, larger portions
led to an increased intake for all foods including sides, entree, desserts, and snacks.
Subject characteristics had little effect on portion size consumed. The study supports
previous conclusions that larger portions lead to excess caloric intake that may be
contributing to an increase in body weight (Rolls et al., 2006).
In the review by Ello-Martin et al. (2005), the researchers mentioned that recent
survey data from the American Institute of Cancer Research in 2004 showed that of 1,000
adults surveyed, 42% report that they decided how much food to eat based on how much
they typically eat. The results also showed that 69% report that when they eat out, they
consume all of their entrees all or most of the time, but 30% would be satisfied with a
smaller portion.
Levitsky and Youn (2004) conducted a study with nine males and four females
who were undergraduate students. Height and weight was measured, and BMI ranged
from 20 to 26. For the first week, subjects chose foods from the buffet table and were
allowed as little or as much food as they wanted. Each food was placed on a separate
plate or bowl. Each plate or bowl was weighed before and after eating to calculate how
much each subject ate. For the second week, subjects were assigned to a group: A, B, or
C. Each group sat at a table separate from the other groups. One group received 100% of
the portion size, another group received 125% of the portion size, and the other group
received 150% of the portion size. On three different days, each group received each of
the three varying portion sizes. Increasing the portion size influenced subjects to eat
more. There was no difference between genders. The results ofthis study corroborate
with similar findings that larger portions result in greater intake of food.
24 Prevalence ofobesity in former athletes
O'Kane, Teitz, Fontana, and Lind (2002) studied the prevalence of obesity in
adults, 20 to 60 years old, to compare national data on adult obesity with that of former
college rowers. Their hypothesis was that former rowers would have lower rates of
obesity throughout adulthood. The researchers sent questionnaires to 4,680 former
intercollegiate rowing athletes. They had a 46% response rate, with 2,165 questionnaires
returned. Subjects were asked how long their rowing career lasted, and their training
methods, current height and weight, as well as college height and weight. BMI was
calculated for both college and current reports. Data from the Centers for Disease Control
(CDC) and Prevention Third National Health and Nutrition Examination Survey
(NHANES III) provided the BMI data for the comparison group in their study.
The researchers found that for both sexes, current BMI was higher than their
college BM!. For women, current average BMI was within normal range; on the other
hand, current average BMI for men was just under 30. There was also a trend for both
sexes towards a higher BMI at each higher age group. Only 10% or less of the former
rowers were classified as obese. Comparison of current BMI for men who continued
rowing during adulthood with men who stopped rowing showed that there was less
obesity in those who were still rowing. It should be noted that only 8% of men and only
5% of women were still rowing. Current BMI of former rowers compared to the general
population shows a lower rate of obesity and a higher percentage of normal weight
among male and female former rowers. Percentage of obese individuals increased with
age in the general population and former rowers. The data suggests that participation in
sports or regular physical activity in early adulthood may be beneficial for preventing
obesity later in life (O'Kane et al., 2002).
Pihl and Jurimae (2001) researched the cardiovascular risk factors in former male
athletes based on their changes in weight during the post-competitive period. The study
25 included 150 former athletes who previously participated in endurance sports and sports
games nationally or internationally at least 15 years prior to the study. Weight was self-
reported and recorded for each subject at age 20. Current height and weight was also
measured, recorded, and BMI was calculated. Of the subjects, 63.3% were regularly
physically active. The data showed that weight gain was significantly related to a lack of
physical activity. Weight gain was also significantly higher in former athletes whose
physical activity was lacking after retiring from a career in their sport compared to
individuals who kept up with physical activity. In order to prevent weight gain, physical
activity plays a major role. Body fat is higher for middle-age and older athletes than in
younger athletes. The data from the study suggests that most former athletes are likely to
gain weight within 15 to 30 years after retiring from their sport.
Three dimensional portion size aids
Three-dimensional (3D) resources used to estimate food portion sizes can include
plastic food models, objects, such as a tennis ball, or common household measures such
as cups, measuring spoons, glasses, plates, and bowls. These tools can be used as an aid
for estimating food portion sizes. Three-dimensional models tend to be common shapes
used to represent a given portion size. A common example is that a deck of cards
represents about three ounces of meat. In Weber, Tinsley, Houtkooper, and Lohman's
(1997) study, they found that learning to recognize standard portion sizes using food
models had an effect on progression towards accurately estimating portion sizes of
amorphous and solid foods in cups. According to Chambers, Godwin, and Vecchio
(2000), it may be that the more a food model resembles the actual food, subjects find it
more appealing and easier to use for recall of portion size of that food.
Schwartz and Byrd-Bredbenner (2006) investigated the accuracy of two different
types of practical portion size measurement aids (PSMAs): 2D and 3D. Accuracy of
portion size estimates for amorphous forms of fruits, vegetables, and grains were
26 compared when subjects used practical PSMAs to when they did not use practical
PSMAs. The 2D aid was a life-size photograph of a golf ball and a tennis ball with labels
that described the cup volume of both balls. The 3D aid was an actual golf ball and tennis
ball, both with tags attached labeling their cup volume. Food was presented to subjects on
plates, in predetermined measures, using 36 foods divided into three sets of 12. Each set
of foods included the same food, but in varying portion sizes, shapes, and heights or
widths. This was done to assess whether practical PSMAs help create more accurate
estimates of the foods in various forms. Demographic data was collected from a
questionnaire. Subjects were randomly assigned to one of two groups and estimated the
portion size of the foods in each of the three sets of food. All subjects estimated, in cup
measurements, the portion sizes of the foods in set one. Subjects were asked to estimate
the amount of each food in set two using the 2D or 3D PSMA assigned to their group and
record it on the form provided for them. The subjects were then asked to estimate the
amount of each food in set three without a PSMA and record them.
Subjects included 113 young adults, ranging in age from 17 to 24. Subject
characteristics did not significantly affect portion estimations. The use of both types of
practical PSMAs significantly affected portion estimation. Even when a PSMA was used,
it only facilitated up to 60% accuracy, which shows that there was still quite a bit of error
in portion estimation (Schwartz & Byrd-Bredbenner, 2006).
Two dimensional portion size aids
The purpose ofthe study by Godwin et al. (2004) was to compare subject
accuracy in reporting food intake when they used two-dimensional (2D) versus three
dimensional (3D) portion size estimation aids (PSEAs). Factors such as interview
methods, in person or via telephone, and guidance to certain PSEAs versus subject choice
ofany aid were investigated. Subjects included 120 individuals of both genders, ranging
in age from 18 to 65. Subjects chose food from a buffet table that were pre-weighed.
27 After subjects finished eating, their leftovers were weighed and the total amount of food
consumed was calculated. The next day, the subject estimated how much they ate via
telephone or in-person interviews, using 2D or 3D PSEAs, and guidance or no guidance
towards using specific aids.
The data collected showed that none of the participants were able to estimate their
intake within 20%. The average accuracy of estimating using 2D versus 3D aids were
fairly similar, but there were three foods for which mean inaccurate estimations for 2D
aids were more than 20% and were less than 20% for 3D aids. This indicates that when
2D aids were only flat drawings without shading, the 3D aids were more effective for
estimating portion size. Use of 2D aids was more of a challenge over the telephone
compared to in person; however no significant differences were found in reported intake.
Guiding participants to a certain aid did not affect accuracy of reported intake.
Misestimations in this study for 2D aids could be because the 2D aids were not made to
look 3D. Representation of a 3D food using a more accurate 2D PSEA would probably
be more beneficial (Godwin et al., 2004).
McGuire et al. (2001) compared the accuracy of a 2D muffin diagram to other
portion size measurement aids (PSMAs). A total of 120 subjects, 58 of which were men
and 62 were women, participated in the study. There were seven muffins of different
sizes and shapes that were numbered for the study. Subjects estimated the size of four
muffins after taking thirty seconds to look at and touch each one. The muffin was taken
and placed out of sight, and subjects estimated the size of the muffin according to size
categories of mini, small, medium, large, extra large, and jumbo. They also estimated the
amount by using any PSMAs such as a ruler, bean bag, or 2D muffin diagrams, or ItO
PSMA at all. Finally they described their confidence of the accuracy of their estimation
using a five point scale. The 2D muffin diagram was in a muffin shape, but was depicted
using a tapered cylinder for the base of the muffin and the top of the muffin was
28 spherical. The diagrams were meant to look like muffins and represent them in size, but
were definitely not the same as using an actual photograph of a muffin.
The researchers found that more than 90% of the subjects decided to use a PSMA
for estimation. Among those who used a PSMA, 70% used the 2D muffin diagram, which
also led to the greatest overestimation. "This finding is important because it indicates that
developing PSMAs is difficult and that validation of new aids is essential before their
use" (McGuire et al., 2001, p. 471). The beanbags and ruler also produced overestimation
by at least 30%. Subjects' confidence in their estimation did not correlate with their
percentage of error, suggesting that individuals do not realize the extent of their errors
(McGuire et al., 2001).
Food Photographs
Robson and Livingstone (2000) evaluated the use of food photographs as an aid
for quantifying food intake. Their goals were to evaluate subject error in using
photographs to quantify the amount of food consumed at six meals over a period of two
separate days, and to assess the affect of the errors on estimating nutrient intakes. There
were 15 male and 15 female subjects ages 18 to 36. Height and weight measurements
were taken for each participant. Subjects were informed of the purpose and approved all
foods prior to the study.
Food photographs used in the study were single color prints, with the food
pictured on plates, in bowls, or glasses on top of a wooden table. Subjects were invited to
breakfast, lunch, and dinner on two non-consecutive days. Each participant was given a
pre-weighed amount of food, a portion large enough so the subject was not limited by the
amount of food provided. Serving dishes and leftover food were weighed. The amount of
each food consumed by every individual was calculated. The day after eating, subjects
returned to estimate how much they ate by using fractions or multiples of portion shown
in the single food photograph. The same procedure took place on the second eating day
29 for each subject to provide data over two days versus just one day (Robson &
Livingstone, 2000).
The researchers found that there were no significant gender differences in using
food photos to estimate portion size. As a group for the first day, ten foods were
overestimated and six were underestimated. On the second day, seven foods were
overestimated and ten were underestimated. There was no evidence that a certain shape
of food or other characteristic had an effect on subject over- or underestimation of portion
size. For most foods, there was no significant relationship between the extent of the error
and the amount of food consumed in relation to the photograph quantity. This study did
not find that age, gender, or BMI had an effect on portion size estimation. The errors
made in quantifying the food consumed using a photograph could be due to factors that
cannot be quantified or controlled including the subject's motivation, cooperation, mood,
restraint, memory, perception, etc. Single photographs may not be as beneficial for
portion estimation as using multiple photographs. Robson and Livingstone also suggested
that if subjects had been given the opportunity to estimate portion size immediately after
each meal instead of waiting a day, the single food photographs might have been more
helpful (Robson & Livingstone, 2000).
Again Nelson et al. (1996), studied the use of food photographs as an aid to
estimating portion size and the nutrient content of meals. Subjects were between 18 and
90 years old, and from various backgrounds. Participants arrived for one meal, either
breakfast, lunch, or dinner, where they served themselves any of the foods being offered.
After the subject chose the amount of food, the weight was taken and recorded. Subjects
sat down to eat their meal, and any leftovers were weighed and recorded. The amount of
food participants ate was calculated. Twenty-two commonly consumed foods were used
in the study. Foods that were easy to describe in common household measurements, such
as a slice of bread, were not used in the study. The point was to incorporate foods for
30 which a portion estimation aid would be needed. "Within five minutes of the completion
of the meal, subjects were given a VAS and a set of eight color photographs for each food
they had eaten" (1996, p. 33). Using the VAS, subjects were asked to relate the size of
the portion they just ate to the eight photos. Based on the results of the study, men and
women were both prone to overestimating small portion sizes and underestimating large
portion sizes. This study corroborates the conclusion from Nelson et al.'s previous
research (1994) that food photographs are beneficial for estimating portion sizes.
In an earlier study in 1992 by Faggiano as mentioned in Cypel, Guenther, and
Petot's (1997) article on the validity ofPSMAs, 103 men and women, ages 35 to 64,
chose their own portion sizes. The weight of the food subjects selected was measured and
foods eaten were recorded. The next day, subjects recalled the amount of food consumed
the day before using a set of seven food photos that varied in portion size. Results
showed that some foods tended to be overestimated, while others were underestimated.
The researchers in the study did not find a significant effect of age or gender on the
accuracy of portion estimation.
Photographic atlases for assessing portion size
"A photographic atlas is a set of photograph series, usually bound together in a
single volume" (Nelson & Haraldsdottir, 1998, p. 231). Nelson and Haraldsdottir
researched how to create a photograph series of food portion sizes to formulate some
practical guidelines. They recommend using an even number of photographs such as four
or six, but three is typical, and using only one photo to represent a portion is not
recommended. It is most common to place the photograph series in order of smallest to
largest, and images should be labeled with numbers or letters. Whether the picture is in
color or black and white should have no effect on an individual's ability to estimate
portion size. It is best to have one food item on a plate rather than foods in combinations
on a plate.
31 Foods that should be included in the atlas are ones which are amorphous, can vary
greatly in size, and are not easily described in household measurements such as one slice
of bread. The number of foods to include in the atlas depends on the following factors:
the purpose of the atlas, resources available for creating the atlas, desired cost for
professionals to pay for the atlas, and the extent to which the foods represent other foods
that have similar characteristics and appearances, or equivalent foods. Subjects can
identify portions using a photograph series in numerous different ways. One way is to ask
the subject which photograph best displays their typical portion size. The subject can
choose one of the labeled photographs or a portion in between two photos. Subjects could
select a portion size greater than the largest portion shown or smaller than the smallest
portion shown. The last option is to use a visual analogue scale to allow subjects to
choose a portion size at any point on a continuum (Nelson & Haraldsdottir, 1998).
Turconi et al. (2005) researched the validity of using a color food photo atlas to
estimate portion sizes. A color food photo atlas was assimilated by taking photos of three
different portion sizes (small, medium and large, respectively) of 434 actual foods that
had been prepared and weighed. There were 448 male and female subjects, who ranged in
age from 16 to 60. Demographic data was collected from participants. Subjects arrived at
a cafeteria to get their food that was weighed by the researchers. Subjects ate their meal,
then about five minutes after completing the meal, they estimated how much food they
ate using the photographs in the food atlas. The findings suggest that using a
photographic food atlas to estimate portion sizes is a valid method. The study also did not
find a correlation between age, gender, and BM!.
Portion Photos ofPopular Foods
Portion Photos ofPopular Foods (Hess, 1997) is a color food portion size
estimation aid (PSEA). The book includes at least 109 foods commonly consumed in the
US. It contains life-size photographs of each food with three separate portion sizes on
32 each page. There are 128 total pages included in the book. Foods are photographed on
appropriate plates or in bowls, and some photos include accessories of common
household silverware such as a fork or spoon. The book was created to be used by
nutrition professionals in various settings for portion size education and dietary recall of
portions. The book features portion sizes that vary according to the Nutrition Facts label,
diabetic exchanges, and the USDA Food Guide Pyramid for ease of use by the client and
nutrition professional. A color code is located on each page to identify which photo
represents the Nutrition Facts label, USDA Pyramid, and diabetic exchange portion.
Forms of the food pictured may vary in order to provide the best means of estimation; for
example, a glass of milk displayed in a tall, narrow glass as well as in a shorter, wider
glass. Portion Photos of Popular Foods is available for purchase for $169 through the
American Dietetic Association (ISBN: 978-0-88091-162-7). It is a spiral-bound book that
measures 12" x 15", small enough to transport easily.
33 Chapter III: Methodology
Larger portion sizes have emerged along with increases in the availability of food
in the US food supply, caloric intake from food, and higher rates of obesity. Individuals
tend to overlook monitoring their portion sizes in an effort to manage their weight, which
suggests the importance of stressing the impact of portion sizes on caloric intake and
weight management (Young & Nestle, 2002).
A major obstacle for individuals to control dietary intake is the inability to
estimate portion size (Byrd-Bredbenner & Schwartz, 2004). Portion size estimation aids
(PSEAs) may be beneficial for individuals who are describing their portion size
(McGuire et al., 2001). Aids most commonly used are portion size models of neutral
shapes, models that replicate actual foods, and food photographs. Using photographs has
many benefits including the ability to copy them for questionnaires, opportunity to make
them specific and include a variety of individual foods (Nelson et al., 1996). Portion size
measurement aids (PSMAs) are lightweight, inexpensive, compact, easily transported,
and easy to obtain (Byrd-Bredbenner & Schwartz, 2004). According to Lillegaard,
Overby, and Andersen (2005), visual aids, such as food photographs, may help to
improve subjects' ability to accurately describe portion sizes. As a result of their study,
they also concluded that a book containing food photographs can be helpful for children
and adolescents to estimate portion size.
Usually food photographs are taken of small, medium, and large portions.
Subjects pick the photo that best represents their typical portion size (Nelson et al., 1994).
Nelson et al. also describe a complex mental process that occurs when portion sizes are
identified using food photographs. The process involves perception, conceptualization,
and memory. Perception is when a subject relates a food amount that is physically present
to an amount shown in a photograph. Conceptualization is a subject's ability to mentally
visualize an amount of food that is not currently present, and relate it to an amount in a
34 food photograph. Memory has an effect on the accuracy of the conceptualization.
Previous research has shown the benefits of using photographs to aid subjects in
estimating portion size (Nelson et al., 1996).
The Portion Photos ofPopular Foods book (Hess, 1997) is a photographic aid
that can be used for portion size estimation. The book has 109 life size photos of foods
commonly consumed in the US. Each food is shown in three different portion sizes:
small, medium, and large, respectively. The book was created noting the varying portions
described by the Nutrition Facts label, Food Guide Pyramid, and the food exchanges of
each food (Edens, 2003).
It is important to research the typical portion sizes of young adults, as well as how
typical portion sizes compare to standard portion sizes (Schwartz & Byrd-Bredbenner,
2006). This research paper investigated the aforementioned using life-size color food
photographs. Sections addressed in this chapter include subject selection and description,
instrumentation, data collection procedures, data analysis, and limitations of the study.
Subject Selection and Description
The sample population for this study was college athletes, ages 18-22. The
athletes were participating in their sport's pre-season at the University of Wisconsin
Stout during the month of August, 2006. The subjects who participated in this study were
involved in football, women's soccer, women's volleyball, and men's cross country. The
Institutional Review Board (IRB) for the Protection ofHuman Subjects at the University
of Wisconsin-Stout approved this research study. An informed consent form (Appendix
A) was used for the study. Participation was strictly voluntary as described on the
participant consent form and could be terminated at any time without discrimination. The
consent form also explained that confidentiality would be sustained during the study.
35 Instrumentation
The survey used in this study was a 26 question survey (Appendix B). Subjects
were asked to report their age, sport, and height and weight. Subjects were also asked
about their level of interest in nutrition, previous college courses taken in nutrition, who
taught them the most about nutrition, and the subject's desire to gain, lose, or maintain
weight. The survey was developed by the researcher solely for use in this research study.
The researchers had a handout for their own reference that contained the page number of
each food item, the name of the food, and the standard portion size of each of the six
foods used in this research study to refer to during the data collection procedure.
Data Collection Procedures
The researcher first prepared for the research study by choosing six foods
representing various food groups to be researched in this study. Cornbread, pancakes,
rice, mixed vegetables, watermelon, and beef patty were the six foods designated for the
study. These foods were elected to be in the study because they represented various food
groups as well as different shapes for portion estimation. The researcher labeled the
photographs in the Portion Photos ofPopular Foods book (Hess, 1997) with letters on
post-it notes so they would stick to the page and clearly label the photo it correlated to.
The letter A was assigned to the smallest portion photo, B to the medium sized portion
photo, letter C to the largest portion photo, and the letter D was placed on the side of the
page as it described a portion larger than any of those pictured. A manila folder was also
prepared before data collection for completed surveys to be placed into once each subject
completed the survey to ensure confidentiality.
The researcher sent an email to the coaches of the women's volleyball team, the
football team, the men's cross country team, and the women's soccer team. The email
gave background information about the researcher and the research project to be
completed. It stated the requirements of the athletes who chose to participate as well as
36 the day the research was to be conducted. The athletes' participation in the study
occurred during pre-season. The time of day was after the athletes finished practice in
their particular sport, but before the athletes ate supper to assume that hunger was a
constant for all athletes who participated. The athletes were asked to participate as they
were on their way to eat dinner at the UW-Stout Merle M. Price Commons. Two tables
were set up in the Commons with two researchers present.
As the athletes arrived to participate in the study, they were given an informed
consent form to read over and a paper 26 question survey was administered to each
subject. Subjects were standing during the study and used the table as a hard surface to
place their surveys on to record responses. Pens were provided, and small groups ranging
from two to eight were randomly formed around each researcher to conduct the study.
The study was done with free flow of subjects, which is why there was a range of group
sizes. Once subjects agreed to terms of the study, they were given time to fill out the top
portion ofthe survey which included sport, age, height, and weight. Subjects were also
asked multiple choice questions about their level of interest in nutrition, previous college
courses taken in nutrition, who taught them the most about nutrition, and the subject's
desire to gain, lose, or maintain weight. Once subjects were ready to continue, the
investigator opened the Portion Photos ofPopular Foods book (Hess, 1997) to display
the first food item. Subjects were instructed to look at the photos and refer to the first set
of questions for the first food item. Once subjects arrived at the third question for each set
of three questions, they were instructed to stop and wait for the researcher to say the
standard portion size of the food. This process was repeated for each of the six different
food items. Subjects then turned in their completed surveys to the manila envelope.
Data Analysis
A number of statistical analyses were used in this study. The Statistical Program
for Social Sciences, version 14.0, (SPSS, 2005) was used to analyze the data.
37 Demographic information was analyzed using descriptive statistics such as percentages
and frequencies. Crosstabulation (frequencies and percentages) with a Pearson Chi-
Square analysis between BMI category and gender, and between sport and gender were
analyzed. Independent group t-tests were used to analyze characteristics within gender.
Chi square analyses were used to assess the correlation between BMI and typical portion
size. Pearson's correlation coefficient was used to assess the association between factors
such as BMI and gender, and their effect on portion sizes.
Limitations
A weakness of this study was the limited number of subjects who participated,
which makes the results less generalizable. There was also a large group size during the
data collection. Subjects may have felt that other participants nearby might see their
reported weight or other survey responses. Height and weight were self-reported. It was
assumed that the athletes were very familiar with their height and weight. Another
limitation is that both genders were not represented for each sport; for example, female
soccer players participated in the study, but male soccer players did not. The study also
focused on only six foods without obtaining subjects' food preferences prior to the study.
Subject likes and dislikes may have influenced the reported typical portion size.
38 Chapter IV: Results
Obesity is more prevalent than ever, with a 74% increase in the number of people
who are obese since 1991 (Burger, Kern, & Coleman, 2007). The increase in portion
sizes is one of the contributing factors to the drastic rise in obesity. When individuals
consume more food, their energy intake increases (Kral et al., 2004). Caloric intake
becomes even higher with added effects of larger portion size and energy-dense foods.
"Many Americans believe that the kind of food they eat is more important than its
quantity" (Young & Nestle, 2003, 234). Individuals have a tendency to eat more food
when they are served a large amount of food at one time (Nestle, 2003).
To help nutrition professionals combat the rise in obesity and obtain accurate
calorie and nutrient records, it is important to assess the diets of patients and clients
(Byrd-Bredbenner & Schwartz, 2004). Portion size estimation is difficult; thus there is a
relatively high percentage of error when individuals estimate portions of foods consumed
(Godwin et al., 2004). There are numerous ways to collect information about an
individual's dietary intake including obtaining the weight ofthe foods, directly observing
the person while eating, 24 hour recalls, food records, and food frequency questionnaires
(Williamson et al., 2003).
Dietary intake data relies on the individual's ability to recall food portions and
keep good records of what they ate. The most accurate way to determine a person's actual
food intake is weighing the food before and after eating. Weighing food can be
problematic, however, because it is expensive, time-consuming, and disruptive. Portion
estimation of foods that are solid, liquid, and amorphous may improve with the use of
PSMAs (Byrd-Bredbenner & Schwartz, 2004). Examples ofPSMAs used may be replica
food models, food photographs, or rulers, bean bags, measuring cups, and numerous
other resources.
39 For this research study, food photographs from the Portion Photos ofPopular
Foods (Hess, 1997) were used to accompany a survey. The survey was given to subjects
to complete, asking them to report demographic information, as well as answer a set of
three questions about six specific food items. Participants were asked to mark the letter
on their survey that corresponded with the food photograph that best represented each of
the following: their typical portion size, their perception of which photo best represented
what they felt was a standard portion size according to the USDA's MyPyramid
guidelines, and which photo represented their perception of the standard portion size
according to MyPyramid. The purpose was to determine the typical portion sizes that
various athletes consume, what their perception of a standard portion size of six common
foods were, and to determine whether subject characteristics played a significant role in
their portion size perceptions.
Item Analysis
Based on the objectives of the study, the data were analyzed and broken down
into the following sections: description of subjects and portion size analysis.
Description ofsubjects
There were 86 total participants in the study, who were ages 18-22, from the
football, soccer, volleyball, and cross country teams at UW-Stout. Age was similar
among males and females in this study. Males tended to be taller and weigh more than
females (Table 1). Table 1 shows that on average, males were .15m taller than females in
the study, and average weight was 29.51kg more than the females. An ANOVA analysis
showed significance for both at p<.OOl. There were 49 males and 37 females.
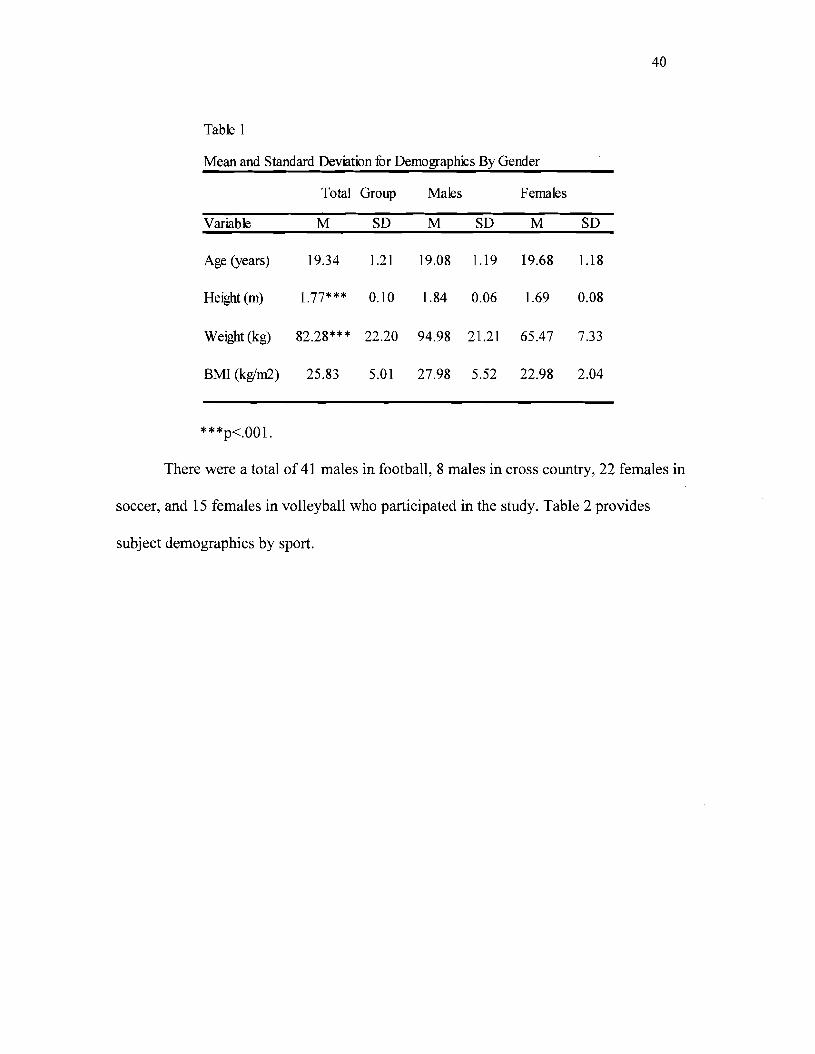
40
Table 1
Mean and Standard Deviation for Demographics By Gender
Total Group Males Females
Variable M SD M SD M SD
Age (years) 19.34 1.21 19.08 1.19 19.68 1.18
Height(m) 1.77*** 0.10 1.84 0.06 1.69 0.08
Weight(kg) 82.28*** 22.20 94.98 21.21 65.47 7.33
BMI (kglm2) 25.83 5.01 27.98 5.52 22.98 2.04
***p<.OOl.
There were a total of 41 males in football, 8 males in cross country, 22 females in
soccer, and 15 females in volleyball who participated in the study. Table 2 provides
subject demographics by sport.
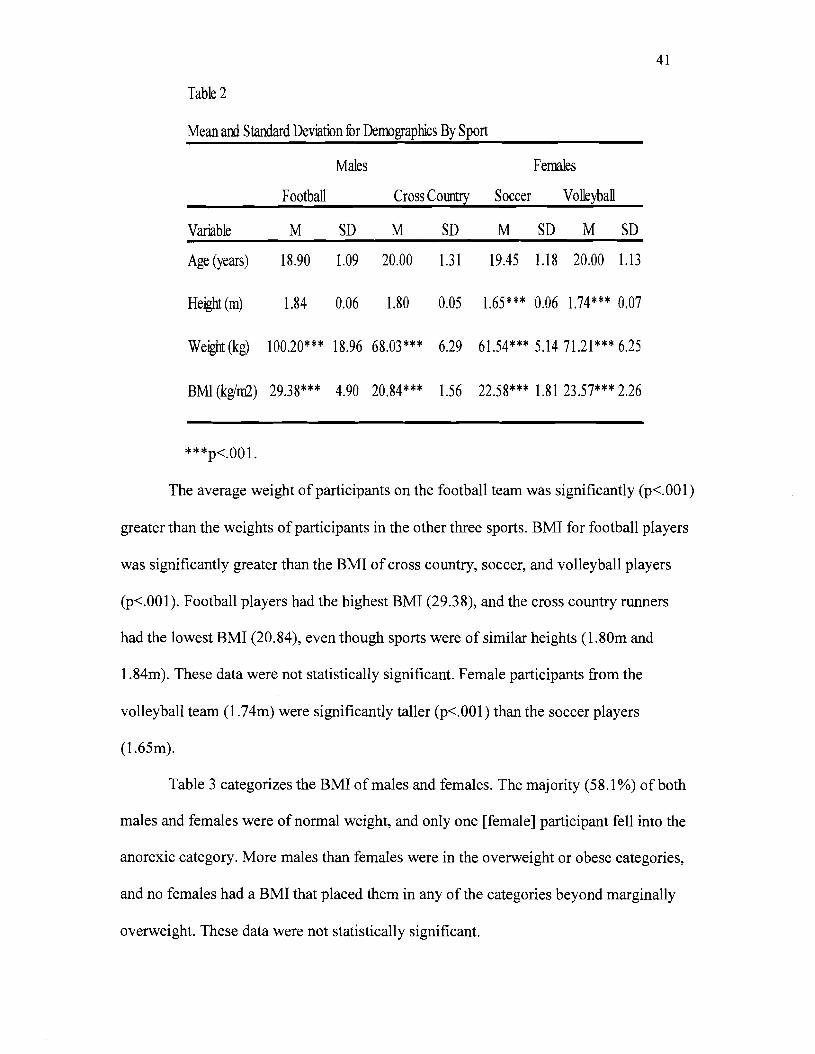
41
Table 2
Mean and Standard Deviation for Demographics By Sport
Variable
Age (years)
Males
Football Cross Couetry
M SD M
18.90 1.09 20.00
SD
1.31
Females
Soccer Volleyball
M SD M SD
19.45 1.18 20.00 1.13
Height(m) 1.84 0.06 1.80 0.05 1.65*** 0.06 1.74*** 0.07
Weight (kg) 100.20*** 18.96 68.03*** 6.29 61.54*** 5.14 71.21 *** 6.25
BMI (kgim2) 29.38*** 4.90 20.84*** 1.56 22.58*** 1.81 23.57*** 2.26
***p<.OOl.
The average weight of participants on the football team was significantly (p<.OOI)
greater than the weights of participants in the other three sports. BMI for football players
was significantly greater than the BMI of cross country, soccer, and volleyball players
(p<.OOI). Football players had the highest BMI (29.38), and the cross country runners
had the lowest BMI (20.84), even though sports were of similar heights (1.80m and
1.84m). These data were not statistically significant. Female participants from the
volleyball team (l.74m) were significantly taller (p<.OOI) than the soccer players
(l.65m).
Table 3 categorizes the BMI of males and females. The majority (58.1%) of both
males and females were of normal weight, and only one [female] participant fell into the
anorexic category. More males than females were in the overweight or obese categories,
and no females had a BMI that placed them in any of the categories beyond marginally
overweight. These data were not statistically significant.
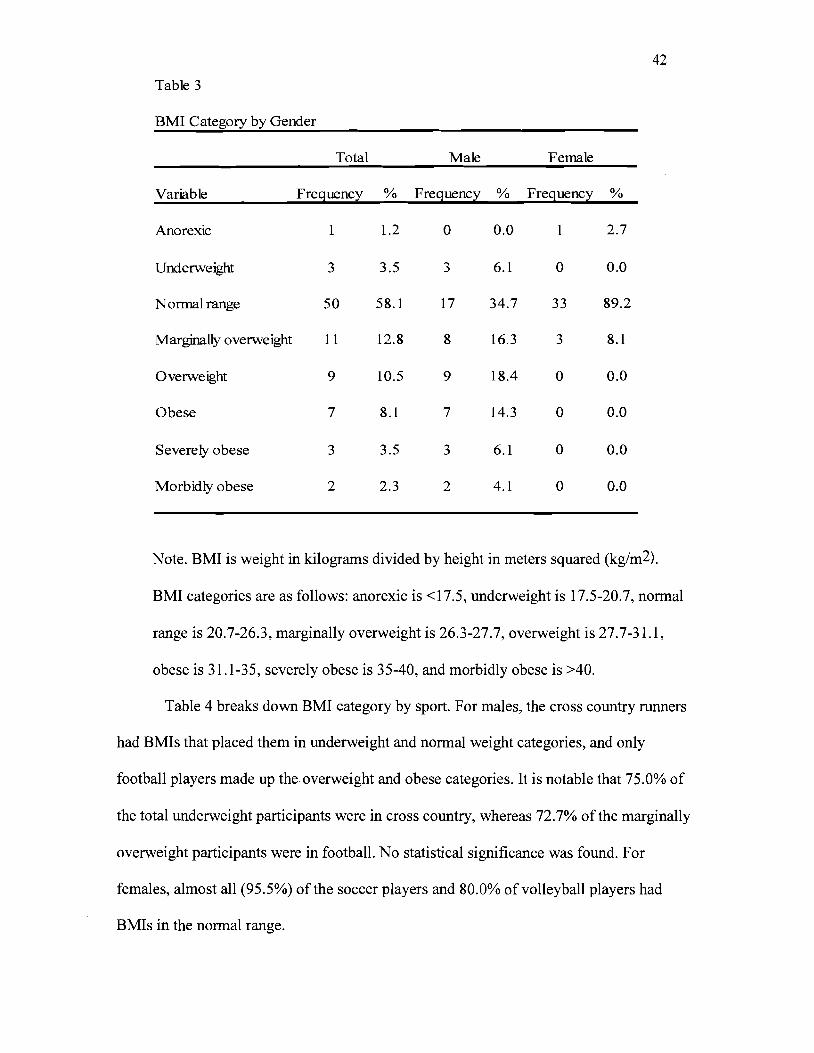
Table 3
42
BMI Category by Gender
Total Male Female
Variable Frequency % Frequency % Frequency %
Anorexic 1 1.2 0 0.0 2.7
Underweight
Normal range
Marginally overweight
3
50
11
3.5
58.1
12.8
3
17
8
6.1
34.7
16.3
0
33
3
0.0
89.2
8.1
Overweight
Obese
9
7
10.5
8.1
9
7
18.4
14.3
0
0
0.0
0.0
Severely obese
Morbidly obese
3
2
3.5
2.3
3
2
6.1
4.1
0
0
0.0
0.0
Note. BMI is weight in kilograms divided by height in meters squared (kg/m2).
BMI categories are as follows: anorexic is <17.5, underweight is 17.5-20.7, normal
range is 20.7-26.3, marginally overweight is 26.3-27.7, overweight is 27.7-31.1,
obese is 31.1-35, severely obese is 35-40, and morbidly obese is >40.
Table 4 breaks down BMI category by sport. For males, the cross country runners
had BMIs that placed them in underweight and normal weight categories, and only
football players made up the overweight and obese categories. It is notable that 75.0% of
the total underweight participants were in cross country, whereas 72.7% of the marginally
overweight participants were in football. No statistical significance was found. For
females, almost all (95.5%) of the soccer players and 80.0% of volleyball players had
BMIs in the normal range.
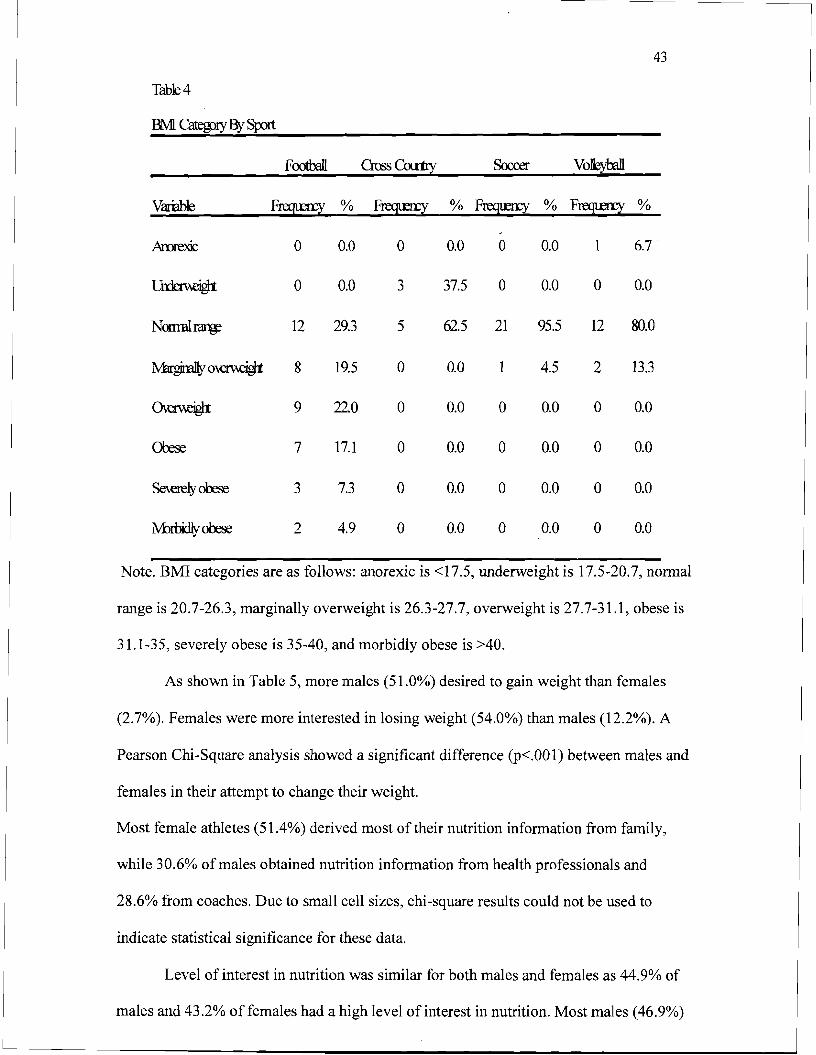
43
Table 4
BMI Categ>ry BySJX)rt
Foothill CrossColl1Iy Soccer Volk;yOOll
Variable Freqtm1' % Fl"eCJlmY % Fregu::ry % Frequny %
Arorexic 0 0.0 0 0.0 a 0.0 1 6.7
l.Jrrlerneigl1 0 0.0 3 37.5 0 0.0 0 0.0
Nonml~ 12 29.3 5 62.5 21 95.5 12 80.0
~o~ 8 19.5 0 0.0 4.5 2 13.3
0\erneigl1 9 22.0 0 0.0 0 0.0 0 0.0
Orese 7 17.1 0 0.0 0 0.0 0 0.0
Se\erely obese 3 7.3 0 0.0 0 0.0 0 0.0
M:lluidlyobese 2 4.9 0 0.0 0 0.0 0 0.0
Note. BMI categories are as follows: anorexic is <17.5, underweight is 17.5-20.7, normal
range is 20.7-26.3, marginally overweight is 26.3-27.7, overweight is 27.7-31.1, obese is
31.1-35, severely obese is 35-40, and morbidly obese is >40.
As shown in Table 5, more males (51.0%) desired to gain weight than females
(2.7%). Females were more interested in losing weight (54.0%) than males (12.2%). A
Pearson Chi-Square analysis showed a significant difference (p<.OOl) between males and
females in their attempt to change their weight.
Most female athletes (51.4%) derived most oftheir nutrition information from family,
while 30.6% of males obtained nutrition information from health professionals and
28.6% from coaches. Due to small cell sizes, chi-square results could not be used to
indicate statistical significance for these data.
Level of interest in nutrition was similar for both males and females as 44.9% of
males and 43.2% of females had a high level of interest in nutrition. Most males (46.9%)
44 had a medium interest in nutrition, and 51.4% of females had a medium interest. Only
8.2% of males and 5.4% of females had a low interest in nutrition.
Most participants had not taken a nutrition course prior to the study, but in
general, more females (27.0%) than males (12.2%) had taken a nutrition course. This was
not statistically significant.
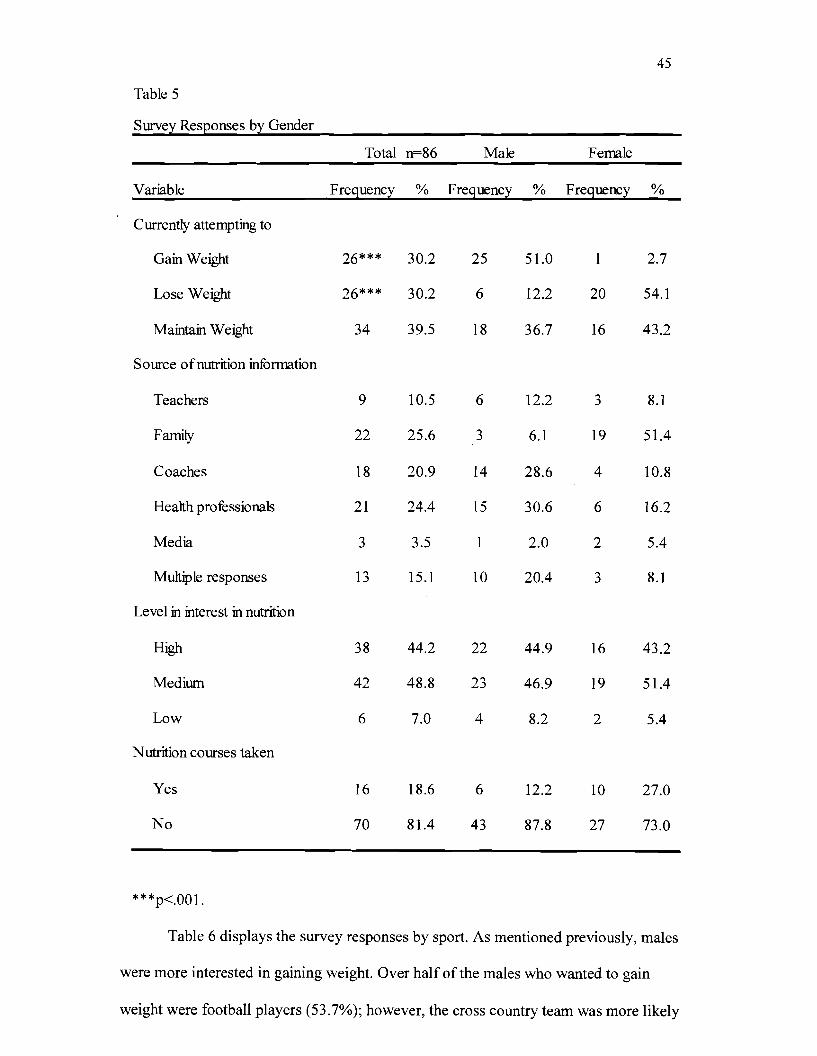
45
Table 5
Survey Responses by Gender
Total n=86 Male Female
Variable Frequency % Frequency % Frequency %
Currently attempting to
Gain Weight 26*** 30.2 25 51.0 2.7
Lose Weight 26*** 30.2 6 12.2 20 54.1
Maintain Weight 34 39.5 18 36.7 16 43.2
Source ofnutrition information
Teachers 9 10.5 6 12.2 3 8.1
Family 22 25.6 3 6.1 19 51.4
Coaches 18 20.9 14 28.6 4 10.8
Health professionals 21 24.4 15 30.6 6 16.2
Media 3 3.5 1 2.0 2 5.4
Multiple responses 13 15.1 10 20.4 3 8.1
Level in interest in nutrition
High 38 44.2 22 44.9 16 43.2
Medium 42 48.8 23 46.9 19 51.4
Low 6 7.0 4 8.2 2 5.4
Nutrition courses taken
Yes 16 18.6 6 12.2 10 27.0
No 70 81.4 43 87.8 27 73.0
***p<.OOl.
Table 6 displays the survey responses by sport. As mentioned previously, males
were more interested in gaining weight. Over half of the males who wanted to gain
weight were football players (53.7%); however, the cross country team was more likely
46 to want to maintain current weight. Both of the women's teams were more interested in
losing or maintaining current weight.
Sources of nutrition information for males in both football and cross country were
predominantly coaches and health professionals. The female volleyball players reported
that family (80.0%) was the primary source of their nutrition information, whereas 31.8%
of the soccer players reported they obtained their information from family. Participants
from soccer also reported getting their nutrition information from coaches and health
professionals (18.2% for both). These data were not found to be statistically significant.
Each sport reported a high level of interest in nutrition at 40.0% or higher. Most
of the participants in the study had a medium level of interest in nutrition, with the lowest
percentage being 46.3% of football players. No cross country runners had a low level of
interest in nutrition, while only 9.8% of football players, and 4.5% of soccer and 6.7% of
volleyball players had a low level of interest. Most of the athletes had not previously
taken a course in nutrition. Only 9.8% of football players, 25.0% of cross country
runners, 31.8% of soccer players, and 20.0% of volleyball players reported having taken
a course in nutrition.
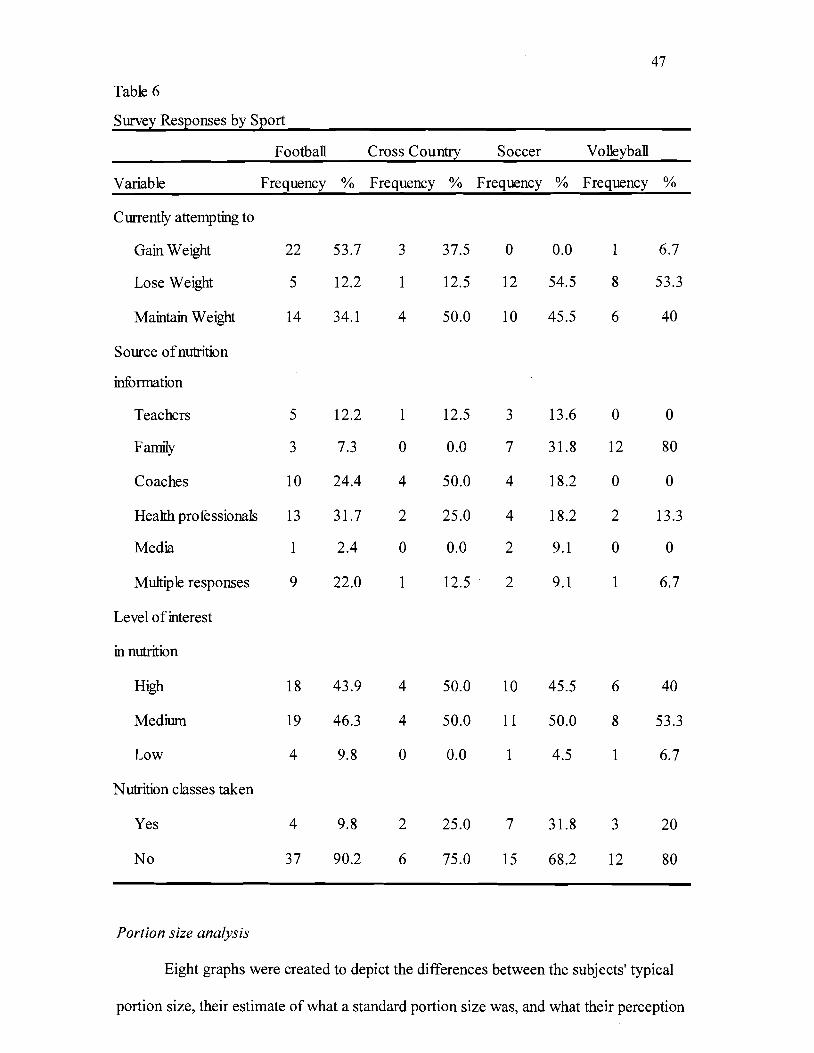
47
Table 6
Survey Responses by Sport
Football Cross Country Soccer Volleyball
Variable Frequency % Frequency % Frequency % Frequency %
Currently attempting to
Gain Weight 22 53.7 3 37.5 0 0.0 1 6.7
Lose Weight 5 12.2 1 12.5 12 54.5 8 53.3
Maintain Weight 14 34.1 4 50.0 10 45.5 6 40
Source ofnutrition
information
Teachers 5 12.2 1 12.5 3 13.6 0 0
Family 3 7.3 0 0.0 7 31.8 12 80
Coaches 10 24.4 4 50.0 4 18.2 0 0
Health professionals 13 31.7 2 25.0 4 18.2 2 13.3
Media 1 2.4 0 0.0 2 9.1 0 0
Multiple responses 9 22.0 1 12.5 2 9.1 1 6.7
Level of interest
in nutrition
High 18 43.9 4 50.0 10 45.5 6 40
Medium 19 46.3 4 50.0 11 50.0 8 53.3
Low 4 9.8 0 0.0 1 4.5 1 6.7
Nutrition classes taken
Yes 4 9.8 2 25.0 7 31.8 3 20
No 37 90.2 6 75.0 15 68.2 12 80
Portion size analysis
Eight graphs were created to depict the differences between the subjects' typical
portion size, their estimate of what a standard portion size was, and what their perception
48 was of the actual USDA standard portion size. After comparing the data using crosstabs
and the Pearson Chi-Square tests for the six food items, there were only two significant
differences found for the typical portion size, estimates of a standard portion size, and the
actual USDA standard portion size between genders. The estimate of which photograph
represented a standard portion size of cornbread was significant (p<.OO 1), and the
estimate of which photograph represented a standard portion size of watermelon was
significant at p<.05. Only gender is compared for each of the six food items because no
correlation between portion size and sport or age was found. For each of the following
graphs of the subjects' portion size estimates for the six food items, the small was the
actual standard portion size according to USDA's MyPyramid.
Figure 1, on the following page, shows the total for both genders' estimates of the
portion size of cornbread. Most (91.9%) of the estimates for the amount of cornbread
typically consumed were medium or large. More than one third (38.4%) of respondents
identified the correct standard portion size for cornbread. Close to 28.0% of respondents
chose the large portion as their perception of a standard portion size.
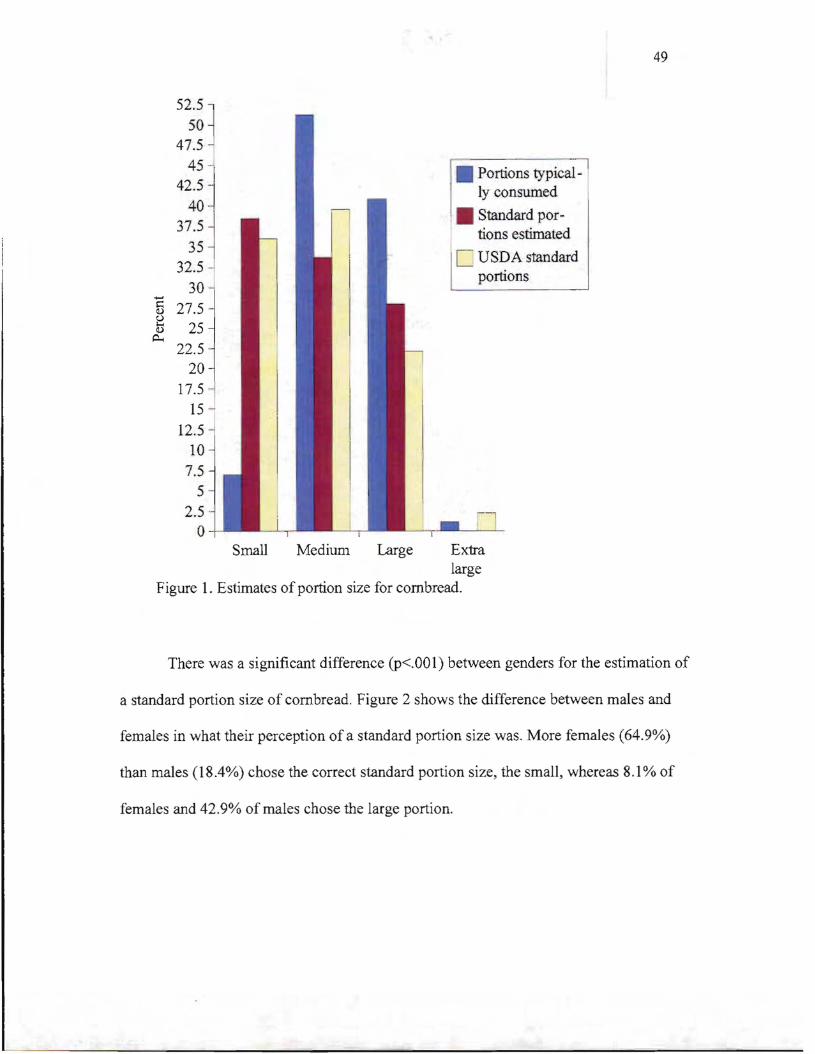
49
52.5l
~
.
• Portions typical]
sOl 47.5
4 42 ; j ly consumed
Standard portions estimated 37:~ j
c: USDA standard32.5
portions30-5 27.5
(.)
[) 25 ~
22.5 .
20
17.5 15 ~
12.5 10
7.5
5 2.5
o -Small Medium Large Extra
large Figure 1. Estimates of portion size for cornbread.
There was a significant difference (p<.001) between genders for the estimation of
a standard portion size of cornbread. Figure 2 shows the difference between males and
females in what their perception ofa standard portion size was. More females (64.9%)
than males (18.4%) chose the correct standard portion size, the small, whereas 8.1 % of
females and 42.9% of males chose the large portion.
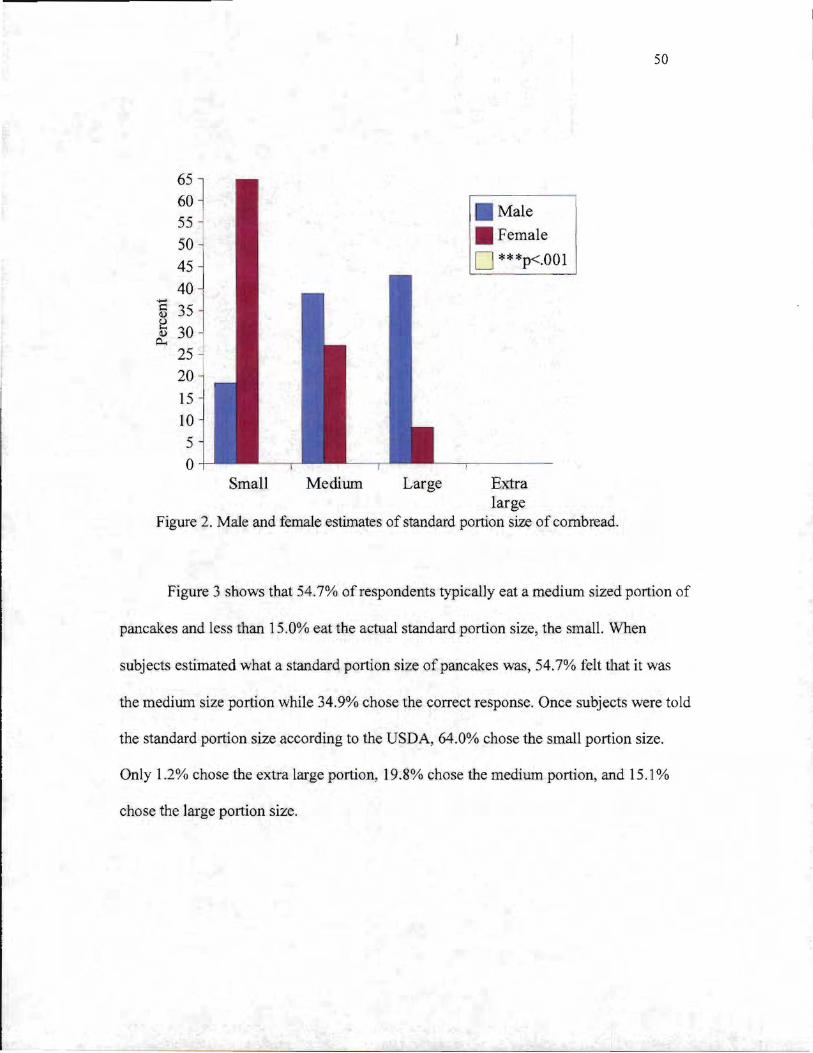
50
65 60
~ ,
j
Male55 J
Female50 o ***p<.OOl45
40
'5 35 J ~ 30 ~
25 20 I 15
10
5 o
Small Medium Large Extra large
Figure 2. Male and female estimates of standard portion size of cornbread.
Figure 3 shows that 54.7% of respondents typically eat a medium sized portion of
pancakes and less than 15.0% eat the actual standard portion size, the small. When
subj ects estimated what a standard portion size of pancakes was, 54.7% felt that it was
the medilim size portion while 34.9% chose the correct response. Once subjects were told
the standard portion size according to the USDA, 64.0% chose the small portion size.
Only 1.2% chose the extra large portion, 19.8% chose the medium portion, and 15.1 %
chose the large portion size.
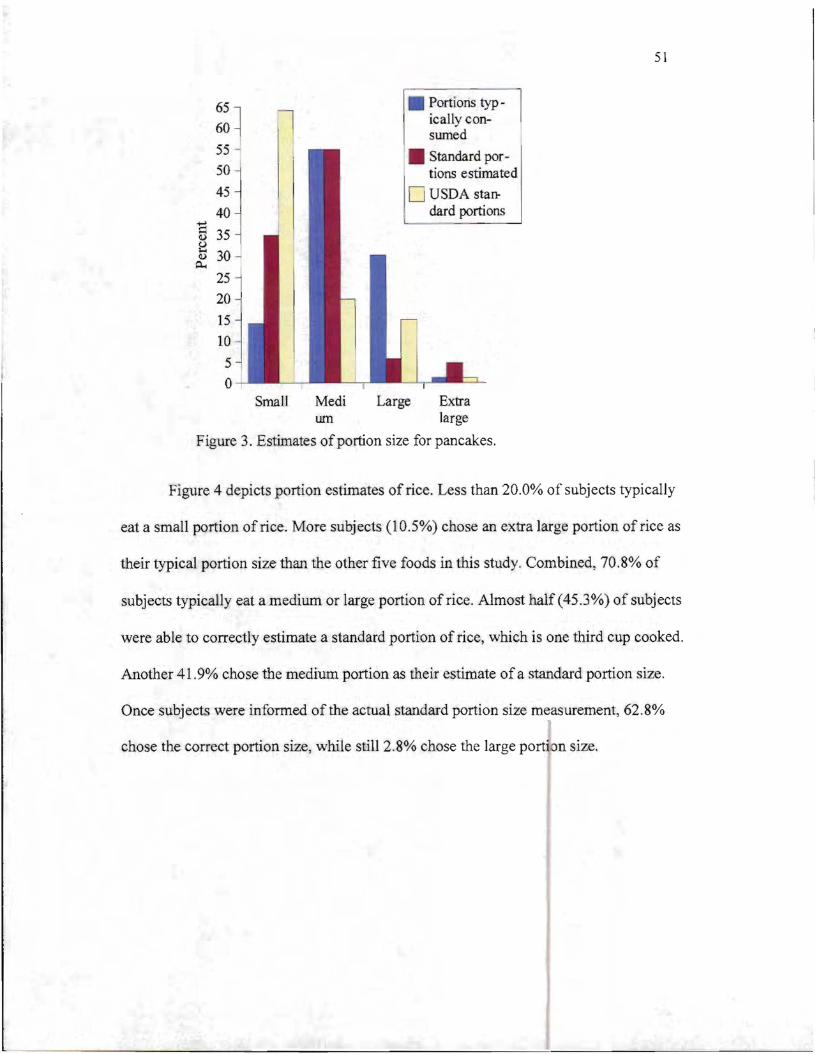
51
55 ~
50
45
40
~ 35 e Q) 30 ~
0... 25
20
15
10
5 I o
I ' sumed
Standard por~
I tions estimated
o USDA standard portions
Portions typ65l ically con60 l
Small Medi Large Extra urn large
Figure 3. Estimates ofportion size for pancakes.
Figure 4 depicts portion estimates of rice. Less than 20.0% of subjects typically
eat a small portion of rice. More subj ects (10.5%) chose an extra large portion of rice as
their typical portion size than the other five foods in this study. Combined, 70.8% of
subjects typicaUy eat a medium or large portion of rice. Almost half (45.3%) of subjects
were able to correctly estimate a standard portion of rice, which is one third cup cooked.
Another 41.9% chose the medium portion as their estimate ofa standard portion size.
Once subjects were informed of the actual standard portion size measurement, 62.8%
chose the correct portion size, while still 2.8% chose the large portion size.
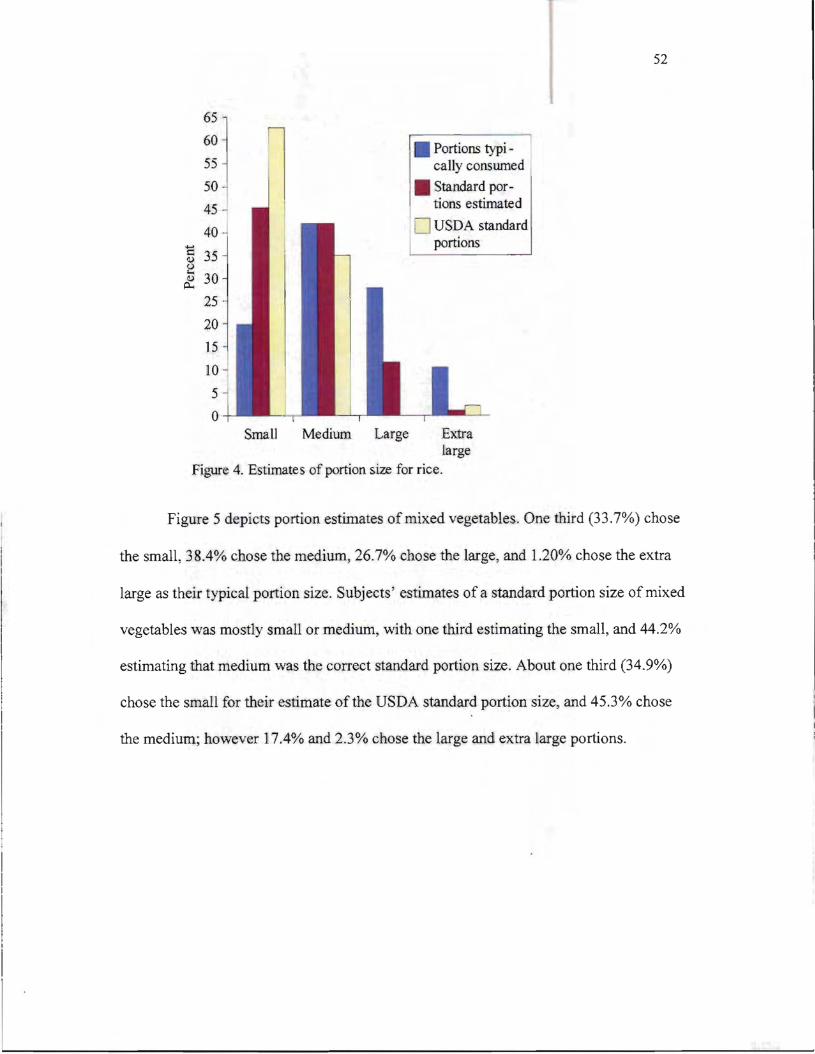
52
55
50
45
40
~ 35 8 ~ 30
25
20 15
10
5
o
cally conswned
• Standard portions estimated
USDA standard portions
Portions typi ~:~ ~
Small Medium Large Extra large
Figure 4. Estimates of portion size for rice.
Figure 5 depicts portion estimates of mixed vegetables. One third (33.7%) chose
the small, 38.4% chose the medium, 26.7% chose the large, and 1.20% chose the extra
large as their typical portion size. Subjects' estimates of a standard portion size of mixed
vegetables was mostly small or medium, with one third estimating the small, and 44.2%
estimating that medium was the correct standard portion size. About one third (34.9%)
chose the small for their estimate ofthe USDA standard portion size, and 45.3% chose
the medium; however 17.4% and 2.3% chose the large and extra large portions.
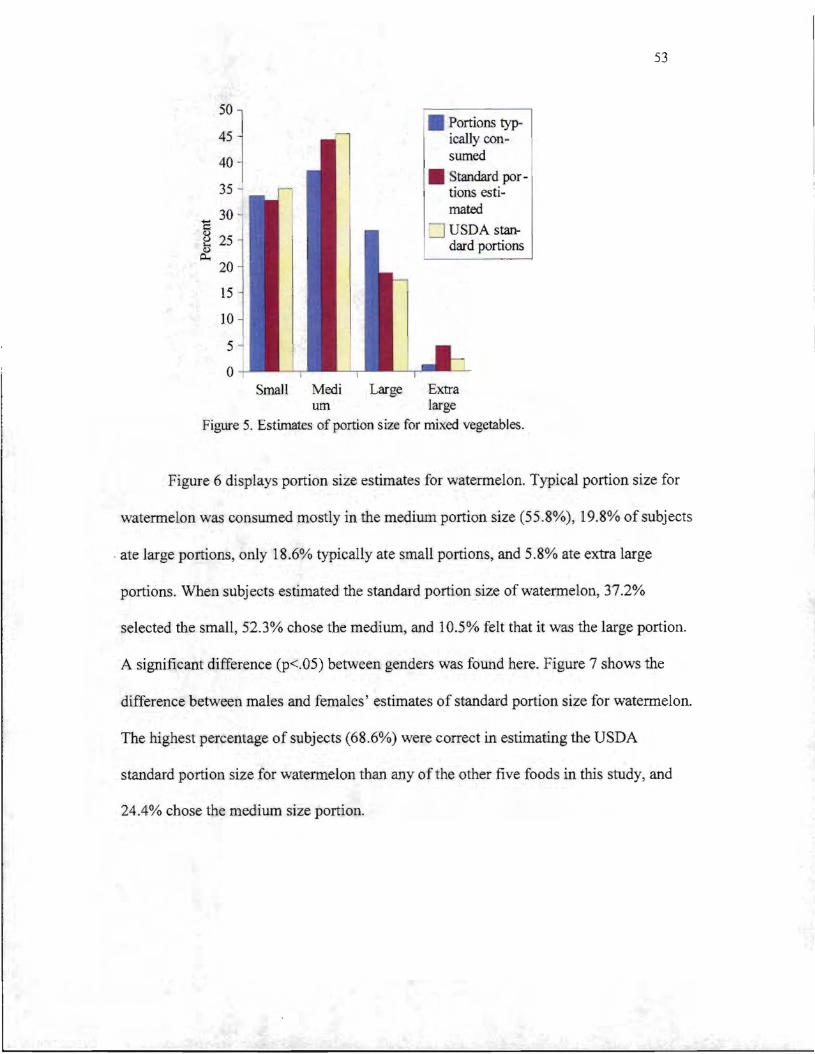
53
50
1 45
40
35 -l
tandard partjons esti
30 mated-5 25
:=J USDA stan(J I dard portions ~
p.. 20
15
10
5
0 Small Medi Large Extra
urn large
Figure 5. Estimates of portion size for mixed vegetables.
Figure 6 displays portion size estimates for watermelon. Typical portion size for
watermelon was consumed mostly in the medium portion size (55.8%), [9.8% of subjects
. ate large portions, only 18.6% typically ate small portions, and 5.8% ate extra large
portions. When subjects estimated the standard portion size of watermelon, 37.2%
selected the small, 52.3% chose the medium, and 10.5% felt that it was the large portion.
A significant difference (p<.05) between genders was found here. Figure 7 shows the
difference between males and females' estimates of standard portion size for watermelon.
The highest percentage of subjects (68.6%) were correct in estimating the USDA
standard portion size for watermelon than any of the other five foods in this study, and
24.4% chose the medium size portion.
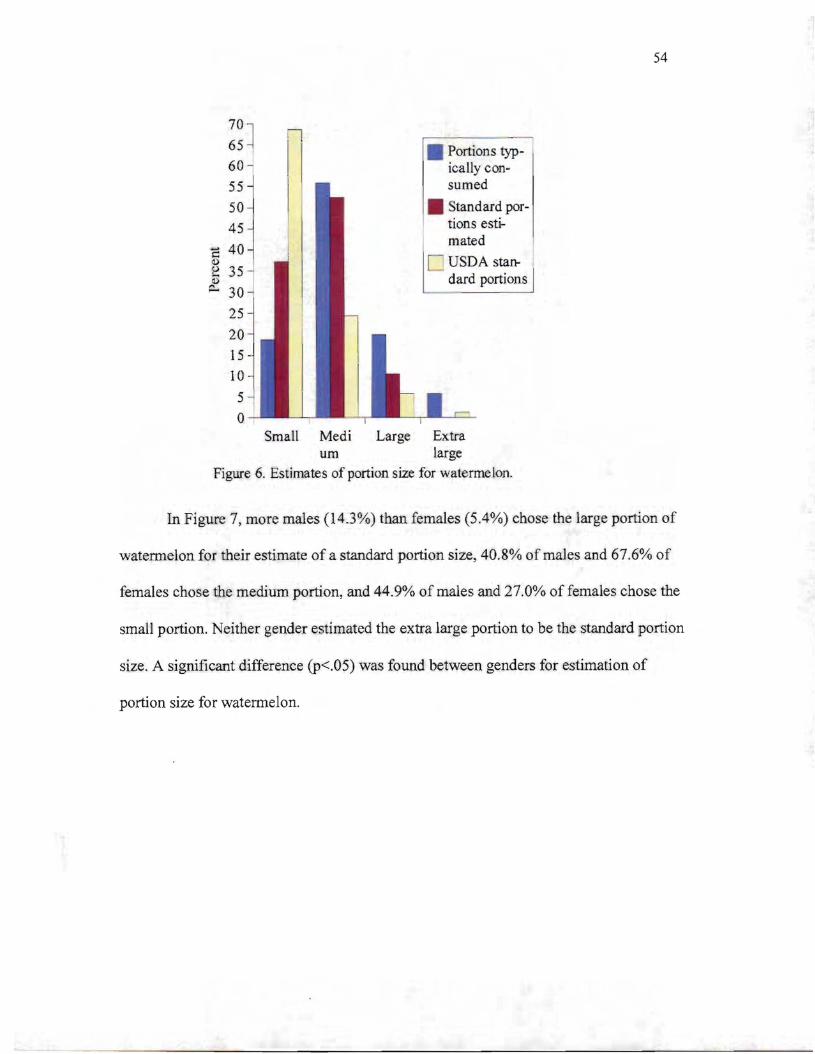
54
70 ] n65 I
60 - I
~~~ 25
20 15 10 5 0
Small Medi Large Extra urn large
Figure 6. Estimates of portion size for watermelon.
In Figure 7, more males (14.3%) than females (5.4%) chose the large portion of
watermelon for their estimate of a standard portion size, 40.8% of males and 67.6% of
females chose the medium portion, and 44.9% of males and 27.0% of females chose the
small portion. Neither gender estimated the extra large portion to be the standard portion
size. A significant difference (p<.05) was found between genders for estimation of
portion size for watermelon.
55 50 45
..... ;:: 40 Q) u .... II)
~
i
Portions typically consumed
tandard portions estimatedI
C USDA standard portions
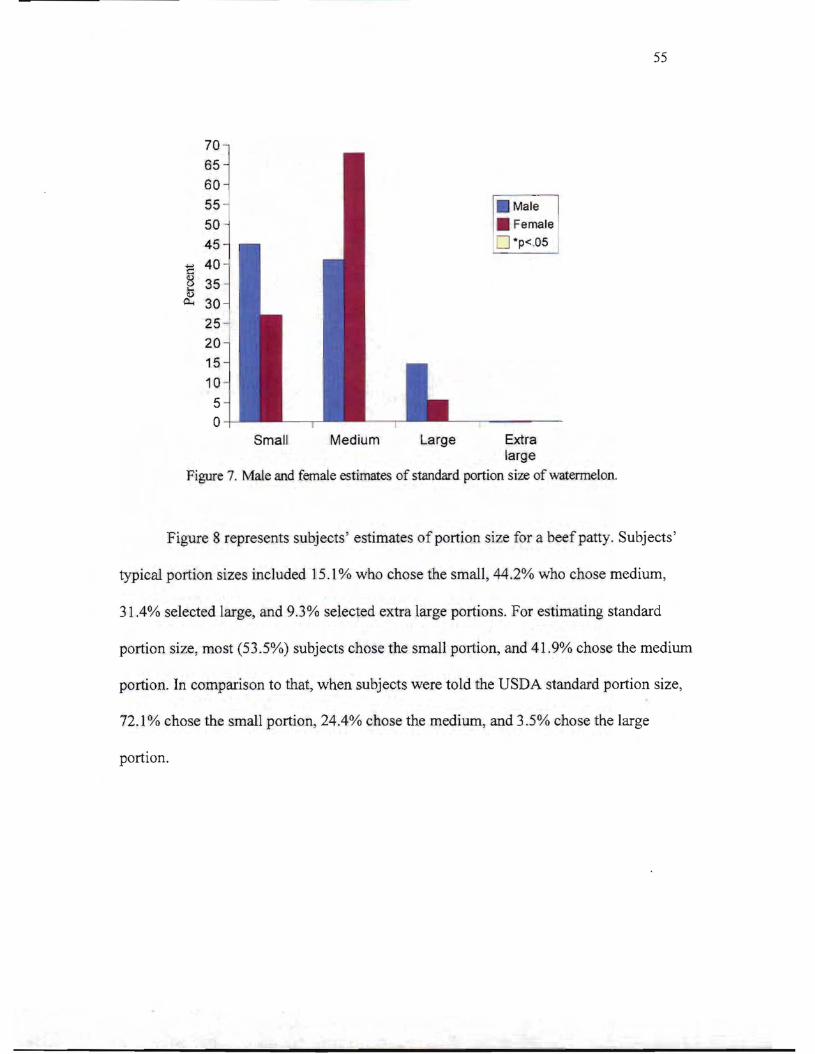
55
Male] 50
~~~ 60 1 55
. Female ::J ·p<.0545
C 40 8 35· ~ 30
25 20 15
10
5 o
Small Medium Large Extra large
Figure 7. Male and female estimates of standard portion size of watermelon.
Figure 8 represents subjects' estimates of portion size for a beef patty. Subjects'
typical portion sizes included 15.1% who chose the small, 44.2% who chose medium,
31.4% selected large, and 9.3% selected extra large portions. For estimating standard
portion size, most (53.5%) subjects chose the small portion, and 41.9% chose the medium
portion. In comparison to that, when subjects were told the USDA standard portion size,
72.1 % chose the small portion, 24.4% chose the medium, and 3.5% chose the large
portion.
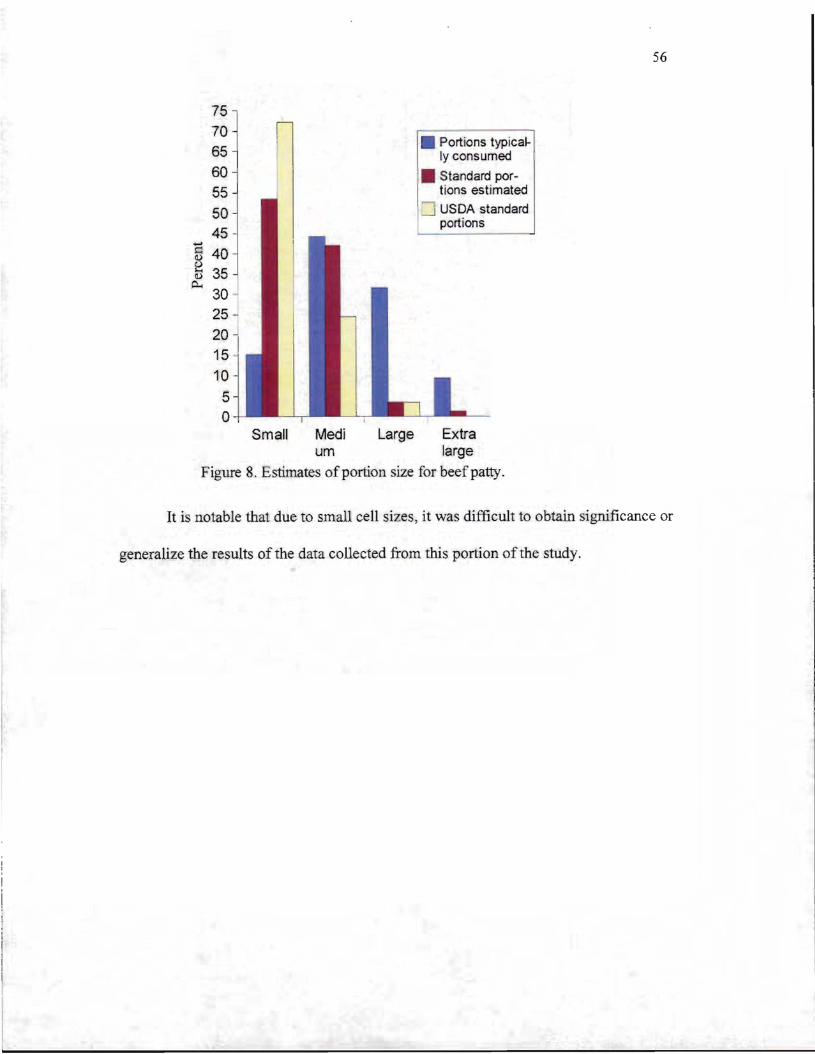
56
75 70 65 60 55
....... ~
~ p...,
15 10
5 o
50 45
40 35 30 25
20 I
--l USDA standard portions
• Portions typically consumed
Standard portions estimated
Small Medi Large Extra um large
Figure 8. Estimates of portion size for beef patty.
It is notable that due to small cell sizes, it was difficult to obtain significance or
generalize the results of the data collected from this portion of the study.
57 Chapter V: Discussion
Obesity is increasing at a rapid rate in the United States and has become a major
public health problem (Nestle, 2003). The increase in caloric intake from large portion
sizes contributes to the obesity epidemic as individuals take in more calories than they
burn (Young & Nestle, 2002). Dietitians collect dietary intake data to assess the calorie
and nutrient intakes of clients, and they should ask questions to obtain more accurate
information about the actual amount of food eaten (Young & Nestle, 1998). Estimating
portion size for dietary intake data has many possible inaccuracies that can accompany it
(Godwin et al., 2004). Portion size aids, such as portion models, food photos, and food
replicas, can be used to help estimate portion sizes (Nelson et al., 1996). Visual aids can
help with portion estimation, though the extent of their benefits is not known (Robson &
Livingstone, 2000). This study investigated the typical portion sizes of various collegiate
athletes compared to their perception of what a standard portion is, and if they can
identify from a photo what best represents a standard portion size of six different foods.
A survey instrument was developed to obtain subject demographic information and
record subject responses to questions about typical portion size and perceived portion
size. The 86 subjects participating in the study were athletes on the University of
Wisconsin - Stout's women's volleyball, women's soccer, men's football, and men's cross
country teams. Data were collected and results were analyzed to determine if subject
characteristics impacted typical portion size and portion estimation, and to compare
subjects' portion size perceptions to determine if they are able to identify a standard
portion size of six commonly consumed foods using food photographs. Other purposes of
the study were to compare reported typical portion sizes to what subjects perceive to be a
standard portion size, and to determine whether dietitians should educate athletes about
standard portion sizes and how large portion sizes affect energy intake and weight
management.
58 Limitations
There were several limitations in this study. One of the limitations was the small
sample size from a Wisconsin University that draws students mainly from Wisconsin and
Minnesota. The results may not represent collegiate athletes of these sports as a whole.
Subjects may also have responded to survey questions according to what they thought
were the researcher's expectations instead of choosing the answers that best represented
their perspective. There was also a large group size during the data collection. Subjects
may have felt that other participants nearby might see their reported weight or other
survey responses. Height and weight were self-reported by subjects. Another limitation is
that the researcher could not compare data between both genders of the same sport. The
number of foods examined were limited in this study due to practical use of time. Lastly,
subject likes and dislikes of the six foods chosen for the study may have influenced the
reported typical portion size.
Conclusions
The first objective of this study was to identify any factors that significantly
affected subjects' typical portion size and subjects' view of a standard portion size.
Finding that males choose larger portions of some foods than females was expected
(Schwartz & Byrd-Bredbenner, 2006). Males tend to be larger than females, causing their
bodies to require more calories. Schwartz and Byrd-Bredbenner suggest that individuals
who are not familiar with standard portion sizes and have large typical portion sizes will
probably have more difficulty managing their weight and other health-related conditions.
In this study, there was no significant effect of subject characteristics such as age
and BMI in perceptions of portion size, and only in two instances there was an effect of
gender on portion size. Opposing the general findings of this study was a study by Nelson
et al. (1996) that found that age, sex, and BMI were factors that affected estimates of
subjects who used eight portion photos to estimate food portions. Burger et al. (2007),
59 also found that males chose significantly larger portion sizes than the standard portion in
some foods. They also found that a higher BMI led to larger typical portion sizes of some
foods compared to the standard portion size.
On the other hand, there have been other studies that found no effect of subject
characteristics on portion size. Studies by Kral et al. (2004), Diliberti et al. (2004), and
Byrd-Bredbenner and Schwartz (2004) found no effect of subject characteristics on
portion size selections. A study by Rolls et al. (2002) found no effect of gender, age, or
BMI on portion size and concluded that overall, subject characteristics had no significant
effect of portion size on intake.
Subjects in this study were placed in BMI categories. Those placed in a BMI
category called anorexic does not signify a medical diagnosis of anorexia, but simply
describes the low weight compared to the height of the individual. The same is true for
those placed in the categories up to morbidly obese, except that they have a higher mass
compared to their height. O'Kane et al. (2002) mentioned that power-sport athletes tend
to have higher BMls than endurance athletes and the general population. Many athletes
are lean individuals, but may have a falsely high BMI due to increased muscle mass. For
example, in this study, cross country runners tended to have a much lower BMI than the
football players, probably due to the large amount of muscle mass the football players
carry.
The second objective was to analyze subjects' perceptions of a standard portion
size to determine if they were able to identify a standard portion size using food
photographs. It can be concluded from this study that most athletes experience portion
distortion. A majority of subjects typically consumed larger portions than the standard
portion size, and many were unable to correctly identify the photo that represented a
standard portion. A study by Schwartz and Byrd-Bredbenner (2006) concurs with this
conclusion as they also found that young adults experience portion distortion with some
60 foods. Rolls et al. (2002) also found that the more food subjects were served, the more
they ate. Subjects did not realize they were eating larger portions, thus they too
experienced portion distortion. Rolls et al. (2006) later found similar results. Increased
portion size led to increased intake in subjects, thus causing a higher energy intake,
basically unnoticed by participants. Levitsky and Youn (2004) also found results similar
to the aforementioned studies. Bryant and Dundes (2005) found that there was about an
equal amount of subjects who overestimated or underestimated standard portion sizes. In
the study, reported typical consumption of cereal and punch tended to be 50% or less of
what the subjects were actually consuming. Chambers et al. (2000) found that most
subjects in their study experienced portion distortion.
Based on the findings in this study, it can be concluded that dietitians and
nutrition professionals should develop portion size education materials to present to
collegiate athletes and the general population alike. Levitsky and Youn (2004, 2549)
summarize the aforementioned perspective: " ...it should be possible to stop and possibly
reverse this trend toward increased body weight by controlling the size of portions served
to the American people." A suggestion by Ello-Martin et al. (2005, 238S) was to " ...train
adults to recognize and respond to their physiologic cues related to satiety." Furthermore,
Ello-Martin et al. suggested that it would be beneficial for the population if restaurants
and other food vendors would offer smaller portion sizes at a cheaper cost than buying
the larger portion. Education is a necessity for people to obtain the knowledge and skills
they need to make lifestyle changes. Nutrition education should involve using aids that
are helpful in teaching individuals about standard portion sizes. According to Rolls et al.
(2002), nutrition education should also involve teaching individuals how to read food
labels. Food Nutrition Facts labels list a serving size that tends to be much smaller than
the typical portion size of most consumers. It is also vital to teach people how to limit the
amount of food available as Rolls et al. found in their study that larger portions led to
61 increased energy intake. Schwartz and Byrd-Bredbenner (2006) suggest teaching
individuals how to measure portion sizes accurately as well.
Recommendations
Further research is needed on the topic of using PSMAs such as food
photographs. A study that would be beneficial is one that examines the accuracy of
portion estimation using a set of three, four, or five varying portions of color, life-size
food photographs for comparing portion estimations while subjects have the food right in
front of them, immediately after they have eaten, and after some time has elapsed
between when subjects eat the food and when they estimate the portions of food eaten at
that meal.
It is also important for researchers to continue to evaluate which PSMAs work
best for clients and subjects to most accurately estimate their portion sizes, especially for
foods that are more difficult to estimate (Howat et aI., 1994). In order to research accurate
estimations ofportion size, it is essential to measure what subjects actually consume as
part of the study. This is important for comparing what was actually consumed to the
participant's estimation of the amount consumed. Another possibility is to measure
subjects' accuracy in estimating pre-measured or pre-weighed amounts of food using
PSMAs.
Future studies should obtain data about subject likes and dislikes of the foods
used for the study to ensure that individual preferences do not affect the portion size a
subject chooses for each food. This will help prevent subjects from choosing less of a
food they do not like or possibly consuming more of a food they like to compensate.
It would also be beneficial for Registered Dietitians to learn where collegiate
athletes obtain most of their nutrition information. Registered Dietitians are already
aware that there is much misinformation out there. The media plays a role in the lives of
most Americans, so it is important for nutrition professionals to be involved with the
62 mass media to help educate the general population about various nutrition topics. In a
future study, it might be beneficial to include peers as a response option to the question of
where subjects obtain nutrition information on the survey used in this study because
many athletes ask each other questions about nutrition.
The last objective of the study was to determine if dietitians should educate
athletes about portion sizes and energy intake. After reviewing results from this study, it
can be concluded that athletes experience portion distortion. Schwartz and Byrd-
Bredbenner (2006) suggested that Registered dietitians should keep in mind when
conducting dietary recalls with clients that their typical portion sizes are probably not the
same as standard portion sizes. Portion sizes at restaurants will most likely not get
smaller, but are following a trend toward portion sizes that are even larger than current
portions. Registered dietitians need to express to clients how many calories they actually
need, and the portion sizes that best suit their calorie limit compared to their typical
portion sizes. "Bringing portion distortion under control could help confront and combat
the growing diet-related problems in this country" (1417). Smiciklas-Wright et al. (2003)
suggested that Registered dietitians should counsel clients about the need to decrease
portion sizes and be able to recognize the difference between typical and standard portion
sizes. Registered dietitians should emphasize the importance of physical activity and
healthy eating for their dual role in weight loss. Nutrition education and counseling with
young adults should cover the topics of controlling portion sizes of all foods as well as
instilling in the client that they should pay attention to any change in eating habits based
on food packaging and what the media conveys (Burger et aI., 2007).
63 References
Ard, J., Desmond, R., Allison, Do, Conway, J. (2006). Dietary restraint and disinhibition
do not affect the accuracy of 24-hour recall in a multiethnic population. Journal of
the American Dietetic Association, 106(3),434-437.
Bryant, R, & Dundes, L. (2005). Portion Distortion: A study of college students. The
Journal ofConsumer Affairs, 39(2),399-408.
Byrd-Bredbenner, C., & Schwartz, J. (2004). The effect of practical portion size
measurement aids on the accuracy of portion size estimates made by young
adults. Journal ofHuman Nutrition and Dietetics, 17,351-357.
Burger, K., Kern, M., & Coleman, K. (2007). Characteristics of self-selected portion size
in young adults. Journal ofthe American Dietetic Association, 107(4),611-618.
Centers for Disease Control and Prevention. Obesity Among Adults in the United States
No Statistically Significant Change Since 2003-2004 [database on-line]
(Washington, D.C.: Department of Health and Human Services, 2007, accessed
10 March 2008); available from
http://www.cdc.gov/nchs/pressroom/07newsreleases/obesity.htm; Internet.
Chambers, Eo, Godwin, S., & Vecchio, F. (2000)0 Cognitive strategies for reporting
portion sizes using dietary recall procedures. Journal ofthe American Dietetic
Association, 100,891-897.
Cypel, Y, Guenther, Po, & Petot, G. (1997). Validity of portion-size measurement aids: a
review. Journal ofthe American Dietetic Association, 97(3),289-292.
Diliberti, No, Bordi, Po, Conklin, Mo, Roe, L., & Rolls, B. (2004). Increased portion size
leads to increased energy intake in a restaurant meal. Obesity Research, 12(3),
562-568.
Edens, K. (2003). Grain-based foods 24-hour food portion recall compare to portion
photo selection by university students. Unpublished master's thesis, University of
64 Wisconsin - Stout, Menomonie.
Ello-Martin, J., Ledikwe, J., & Rolls, B. (2005). The influence of food portion size and
energy density on energy intake: implications for weight management. American
Journal ofClinical Nutrition, 82(1), 236S-241S.
Foster, E., Matthews, J., Nelson, M., Harris, J., Mathers, 1., & Adamson, A. (2006).
Accuracy of estimates of food portion size using food photographs - the
importance of using age-appropriate tools. Public Health Nutrition, 9,509-514.
Godwin, S., Chambers, E., & Cleveland, L. (2004). Accuracy of reporting dietary intake
using various portion-size aids in-person and via telephone. Journal ofthe
American Dietetic Association, 104(4),585-594.
Guthrie, H. (1984). Selection and quantification oftypical food portions by young adults.
Journal ofthe American Dietetic Association, 84(12), 1440-1444.
Harnack, L., Steffen, L., Arnett, D., Gao, S., & Luepker, R (2004). Accuracy of
estimation of large portions. Journal ofthe American Dietetic Association,
104(5), 804-806.
Hedley, A., Ogden, C., Johnson, C., Carroll, M., Curtin, L., & Flegal, K. (2004).
Prevalence of overweight and obesity among US children, adolescents, and
adults, 1999-2002. Journal ofthe American Medical Association, 291, 2847
2850.
Hess, M. A. (1997). Portion Photos of Popular Foods. Chicago: The American Dietetic
Association.
Howat, P., Mohan, R, Champagne, C., Monlezun, C., Wozniak, P., & Bray, G. (1994).
Validity and reliability of reported dietary intake data. Journal ofthe American
Dietetic Association, 94, 169-173.
Kral, T., Roe, L., & Rolls, B. (2004). Combined effects of energy density and portion size
on energy intake in women. American Journal ofClinical Nutrition, 79(6),962
65 968.
Ledikwe, J., Ello-Martin J., & Rolls B. (2005). Portion sizes and the obesity epidemic.
Journal ofNutrition, 134(4),905-909.
Levitsky, D., & Youn, T. (2004). The more food young adults are served, the more they
overeat. Journal ofNutrition, 134,2546-2549.
Lillegaard, I., Overby, N., & Andersen, L. (2005). Can children and adolescents use
photos of food to estimate portion sizes? European Journal ofClinical Nutrition,
59,611-617.
McGuire, B., Chambers, E., Godwin, S., & Brenner, S. (2001). Size categories most
effective for estimating portion size of muffins. Journal ofthe American Dietetic
Association, 101(4),470-472.
National Institute of Health. (2006). Body Mass Index. Retrieved September 15,2007
from http://www.nlm.nih.gov/medlineplus/ency/article/007196.htm.
Nelson M., Atkinson, M., & Darbyshire, S. (1994). Food Photography I: the perception
of food portion size from photographs. British Journal ofNutrition, 72,649-663.
Nelson M., Atkinson, M., & Darbyshire, S. (1996). Food Photography II: use of food
photographs for estimating portion size and the nutrient content of meals. British
Journal ofNutrition, 76(1), 31-49.
Nelson, M., & Haraldsdottir, J. (1998). Food photographs: practical guidelines II.
Development and use of photographic atlases for assessing food portion size.
Public Health Nutrition, 1(4),231-237.
Nestle, M. (2003). Increasing Portion Sizes in American Diets: More calories, more
obesity. Journal ofthe American Dietetic Association, 103(1), 39-40.
O'Kane, J., Teitz, c., Fontana, S., & Lind, B. (2002). Prevalence of obesity in adult
population of former college rowers. Journal ofthe American Board ofFamily
Practice, 15, 451-456.
66 Pihl, E., & Jurimae, T. (2001). Relationships between body weight change and
cardiovascular disease risk factors in male former athletes. International Journal
ofObesity, 25(7), 1057-1062.
Robson, P., & Livingstone, M.B. (2000). An evaluation of food photographs as a tool for
quantifying food and nutrient intakes. Public Health Nutrition, 3(2), 183-192.
Rolls, B., Morris, E., & Roe, L. (2002). Portion size of food affects energy intake in
normal-weight and over-weight men and women. American Journal ofClinical
Nutrition, 76, 1207-1213.
Rolls, B., Roe, L., Kral, T., Meengs, J., & Wall, D. (2004). Increasing the portion size of
a packaged snack increases energy intake in men and women. Appetite, 42,63-69.
Rolls, B., Roe, L., & Meengs, J. (2006). Larger portion sizes lead to a sustained increase
in energy intake over 2 days. Journal ofthe American Dietetic Association,
106(4),543-549.
Rolls, B., Roe, L., Meengs, 1., & Wall, D. (2004). Increasing the portion size of a
sandwich increases energy intake. Journal ofthe American Dietetic Association,
104(3),367-372.
Schwartz, J., & Byrd-Bredbenner, C. (2006). Portion Distortion: Typical portion sizes
selected by young adults. Journal ofthe American Dietetic Association, 106,
1412-1418.
Seligson, F. H. (2003). Serving size standards: can they be harmonized? Nutr. Today, 38,
247-253.
Smiciklas-Wright, H., Mitchell, D., Mickle, S., Goldman, J., & Cook, A. (2003). Foods
commonly eaten in the United States, 1989-1991 and 1994-1996: Are portion
sizes changing? Journal ofthe American Dietetic Association, 103(1), 41-47.
SPSS Inc. (2005). SPSS 14.0 for windows student version. Upper Saddle River, NJ:
Prentice-Hall, Inc.
67 Turconi, G., Guarcello, M., Berzolari G., Carolei, A., Bazzano, R., & Roggi, C. (2005).
An evaluation of a colour food photography atlas as a tool for quantifying food
portion size in epidemiological dietary surveys. European Journal ofClinical
Nutrition, 59,923-931.
Weber, J., Tinsley, A., Houtkooper, L., & Lohman, T. (1997). Multimethod training
increases portion size estimation accuracy. Journal ofthe American Dietetic
Association, 97, 176-179.
Williamson D, Allen, R., Martin, P., Alfonso, A., Gerald, R, & Hunt, A. (2003).
Comparison of digital photography to weighed and visual estimation of portion
sizes. Journal ofthe American Dietetic Association, 103, 1139-1145.
Young, L., & Nestle, M. (1998). Variation in perceptions ofa 'medium' food portion:
Implications for dietary guidance. Journal ofthe American Dietetic Association,
98(4),458-459.
Young L., & Nestle M. (2002). The contribution of expanding portion sizes to the US
obesity epidemic. American Journal ofPublic Health, 92(2): 246-50.
Young, L, & Nestle, M. (2003). Expanding portion sizes in the U.S. marketplace:
Implications for nutrition counseling. Journal ofthe American Dietetic
Association, 103(2), 231-234.

68 Appendix A: IRB Protection of Human Subjects Consent Form
69 Consent to Participate In UW-Stout Approved Research
Title: Food Portion Size Perceptions of Various Athletes at UW-Stout
Investigator: Research Sponsor: Krista Hight Dr. Janice Coker 715-232-2421 Phone: 414-218-9484 303 Admin Bldg [email protected]
Description: The study includes collegiate athletes identifying portion sizes, from a portion size photo book, that they would consume on an ordinary day of six different food items. Subjects will also come up with what they think a portion size of each of the six foods items would be according to the Food Guide Pyramid, and identify the picture that best represents that measurement. Finally, the investigator will share what the standard portion size is, and the subjects will identify the picture that they think best represents that measurement.
Risks and Benefits: The risk involved in participation of this study includes other athletes knowing you are participating in the study, a small time requirement, and emotional reflection on your eating habits. Your participation in this study could provide useful data that will help formulate nutrition education guidelines designed to teach athletes what standard size portions look like to learn the basis for a healthy lifestyle, and can develop lifelong nutrition habits beginning as a collegiate athlete.
Time Commitment and Payment: The estimated amount of time requested of you in order to complete the study is 15-25 minutes.
Confidential ity: Your name will not be included on any documents. We do not believe that you can be identified from any of this information. This informed consent will not be kept with any of the other documents completed with this project.
Right to Withdraw: Your participation in this study is entirely voluntary. You may choose not to participate without any adverse consequences to you. Should you choose to participate and later wish to withdraw from the study, you may discontinue your participation at this time without incurring adverse consequences.
IRB Approval: This study has been reviewed and approved by The University of Wisconsin-Stout's Institutional Review Board (IRB). The IRB has determined that this study meets the ethical obligations required by federal law and University policies. If you have questions or concerns regarding this study please contact the Investigator or Advisor. If you have any questions, concerns, or reports regarding your rights as a research subject, please contact the IRB Administrator.
70
Investigator: Krista Hight IRB Administrator Phone # 414-218-9484 Sue Foxwell, Director, Research Services [email protected] 152 Vocational Rehabilitation Bldg.
UW-Stout Advisor: Janice Coker Menomonie, WI 54751 715-232-2421 715-232-2477 [email protected] [email protected]
Statement of Consent: By completing the following survey, you agree to participate in the project entitled Food Portion Size Perceptions of Athletes at UW-Stout.

71 Appendix B: Survey
72
II This research has beeD.. approved by the UW·Stout IRS as required by the Code of II Federal ReguladoDS Title 45 Part 46.
I
Food Portion Size Perceptions of Athletes at UW-Stout
Age__ Sport. _ Height__'__" Weight lbs.
Circle one. Are you currently trying to gain, lose, or maintain your weight? o gain o lose o maintain
Who taught you the most about nutrition? (Check one) o teachers o family/relatives o friends o coaches o health professionals o the media
What is your level of interest in nutrition? o high o medium o low
Have you ever previously taken a college level nutrition class? Dyes Ono
If yes, please name theclass(es) _
Food Item #1
1. Identify and check below the letter of the food item that best depicts the portion size you would consume of this food item on an average day. OA DB DC OD
2. Based on what you think a portion size of this food would be according to the Food Guide Pyramid, identify the picture that best represents that measurement and check the corresponding letter below. OA DB DC OD Once you get to this question, stop. Wait for the researcher to state what a standard portion size is for this food item.
73 3. Now that you know the standard portion ofthe food item, choose the letter that you think best represents that standard measurement. DA DB DC DO
Food Item #2
1. Identify and check below the letter of the food item that best depicts the portion size you would consume of this food item on an average day. DA DB DC DD
2. Identify and check below the letter of the food item that you think best depicts an actual portion size of the food. DA DB DC DD
Once you get to this question, stop. Wait for the researcher to state what a standard portion size is for this food item. 3. Now that you know the standard portion of the food item, choose the letter that you think best represents that standard measurement. DA DB DC DD
Food Item #3
1. Identify and check below the letter of the food item that best depicts the portion size you would consume of this food item on an average day. DA DB DC DO
2. Identify and check below the letter of the food item that you think best depicts an actual portion size of the food. DA DB DC DD
Once you get to this question, stop. Wait for the researcher to state what a standard portion size is for this food item. 3. Now that you know the standard portion of the food item, choose the letter that you think best represents that standard measurement.
74 DA DB DC DD
Food Item #4
1. Identify and check below the letter of the food item that best depicts the portion size you would consume of this food item on an average day. DA DB DC DO
2. Identify and check below the letter of the food item that you think best depicts an actual portion size of the food. DA DB DC DD
Once you get to this question, stop. Wait for the researcher to state what a standard portion size is for this food item. 3. Now that you know the standard portion of the food item, choose the letter that you think best represents that standard measurement. DA DB DC DD
Food Item #5
1. Identify and check below the letter of the food item that best depicts the portion size you would consume of this food item on an average day. DA DB DC DD
2. Identify and check below the letter of the food item that you think best depicts an actual portion size of the food. DA DB DC DD
Once you get to this question, stop. Wait for the researcher to state what a standard portion size is for this food item. 3. Now that you know the standard portion of the food item, choose the letter that you think best represents that standard measurement. DA DB
75 DC DD
Food Item #6
1. Identify and circle below the letter of the food item that best depicts the portion size you would consume of this food item on an average day. DA DB DC DD
2. Identify and circle below the letter of the food item that you think best depicts an actual portion size of the food. DA DB DC DD
Once you get to this question, stop. Wait for the researcher to state what a standard portion size is for this food item. 3. Now that you know the standard portion of the food item, choose the letter that you think best represents that standard measurement. DA DB DC DD
Recommended