7/23/2019 Food industry Analysis
http://slidepdf.com/reader/full/food-industry-analysis 1/290

7/23/2019 Food industry Analysis
http://slidepdf.com/reader/full/food-industry-analysis 2/290

7/23/2019 Food industry Analysis
http://slidepdf.com/reader/full/food-industry-analysis 3/290

7/23/2019 Food industry Analysis
http://slidepdf.com/reader/full/food-industry-analysis 4/290
Overall Bargaining Power of Suppliers - Low
Switching costs - Low
Differentiation of inputs - LowThreat of forward integration - High
Supplier concentration – High
Need for Substitutes - Low

7/23/2019 Food industry Analysis
http://slidepdf.com/reader/full/food-industry-analysis 5/290
Overall Bargaining Power of Buyers: High
The strength of buying power that firms in thisindustry face from their customers depends on:buyers’ price sensitivity and relativebargaining power Buyer concentration - High
Buyer Volume - Low Switching cost - Low
Brand Loyalty - Moderate
Ability to backward integrate - Low

7/23/2019 Food industry Analysis
http://slidepdf.com/reader/full/food-industry-analysis 6/290
Overall Threat of Substitutes- High
Price- performance-differentiation - Low
Switching cost – Low

7/23/2019 Food industry Analysis
http://slidepdf.com/reader/full/food-industry-analysis 7/290
Overall Threat of New Entrants – Medium
Brand Loyalty: Quite Strong
Access to Distribution - ToughProprietary product differentiation – Low
Access to necessary inputs: Tough
Entry and Exit Barriers - Moderate

7/23/2019 Food industry Analysis
http://slidepdf.com/reader/full/food-industry-analysis 8/290
Overall Industry Degree of Rivalry – High
Market Growth - Moderate
Brand identity – StrongSwitching Cost for Customers - Low
Degree of Differentiation - Low
Scope of Competition – High (Global andlocal)
Strategic Stake - High

7/23/2019 Food industry Analysis
http://slidepdf.com/reader/full/food-industry-analysis 9/290
The Food and Beverages Industry if highlycompetitive and moderately attractive andprofitable industry
Well established players are relatively in acomfortable position while new and small playerswould find it difficult to make it big
Suppliers and Buyers are in a low and high
bargaining position
Rivalry is high laying emphasis on marketing andadvertising, and to develop brand identity, due tolow product differentiation

7/23/2019 Food industry Analysis
http://slidepdf.com/reader/full/food-industry-analysis 10/290
Entry and exit barriers are moderate and company whichcan make large investments could try and enter theindustry e.g. ITC
Threat of global competitors and unorganized players
Key is developing SCM and distribution and maintaininggood relations with suppliers and buyers
It is also essential for players in this industry to be attentiveto changing consumer needs
It also becomes necessary to tap newer markets like ruralmarkets

7/23/2019 Food industry Analysis
http://slidepdf.com/reader/full/food-industry-analysis 11/290

7/23/2019 Food industry Analysis
http://slidepdf.com/reader/full/food-industry-analysis 12/290
2012 Top 5 threats to profit margins 2011 Top 5 threats to profit margins
Cost of inputs or merchandise Cost of inputs or merchandise
Discounting and other salesincentives
Discounting and other salesincentives
Decreased sales volumes Decreased sales volumes
Regulatory Compliance Administrative and marketing costs
Inventory carrying costs Regulatory Compliance
Source: KPMG Food and Beverage Industry Outlook Survey 2012

7/23/2019 Food industry Analysis
http://slidepdf.com/reader/full/food-industry-analysis 13/290
Top Growth Barriers in 2012 Top Growth Barriers in 2011
Pricing Pressures Pricing Pressures
Volatile commodity/input prices Volatile commodity/input prices
Lack of Customer Demand Labor Costs
Labor Costs Lack of Customer Demand
Energy Prices Energy Prices
Lack of qualified workforce Regulatory and Legislativepressures
Regulatory and Legislativepressures
Inflation
Inflation Lack of qualified workforce
Source: KPMG Food and Beverage Industry Outlook Survey 2012

7/23/2019 Food industry Analysis
http://slidepdf.com/reader/full/food-industry-analysis 14/290
Convenience
Premiumization
More-out-of-homeconsumption
Choice/Selection
Freshness
Shopping Experience
Deloitte: Food and beverage 2012

7/23/2019 Food industry Analysis
http://slidepdf.com/reader/full/food-industry-analysis 15/290
S t r e n g t h s
1. Foreign food companiescontinue to target the Indianmarket
2. India is the world’s second
largest milk producer with adeveloped and high-valuedairy sector
3. India’s abundance ofnatural agricultural resources
makes the market attractive toinvestors
4. India has the second largestpopulation in the world, andrising domestic demand is amajor growth driver.
W e a k
n e s s1. The processed food industry
in India is less developedcompared to other countriesdue to logistical anddistribution problems
2. The country’s agriculturalindustry suffers from a lack ofinvestment and dependencyon erratic climatic conditions
3. Specific state-by-statelegislation governing aspectsof high-value business hindersnationwide business strategies1

7/23/2019 Food industry Analysis
http://slidepdf.com/reader/full/food-industry-analysis 16/290
O p
p o r t u n i t i e s1. The government is actively
seeking investment in the foodprocessing and agribusinessindustries
2. Rising disposable incomesand increasing urbanizationmean higher-value processedfoods should experience stronggrowth rates
3. The immense size of India’spopulation and landmassensure that market maturity is adistant prospect
4. Premiumization
T h
r e a t s1. Logistical problems,
underdeveloped servicenetworks and poorinfrastructure hinderdevelopment in fresh foodindustries, such as dairy
2. The division between theurban rich and the rural poor isas great as ever, meaningfood manufacturers do nothave access to the entire
population
3. Elevated commodity costsare a threat to food processors

7/23/2019 Food industry Analysis
http://slidepdf.com/reader/full/food-industry-analysis 17/290
The Ministry of Food Processing, Government ofIndia has defined the following segments within theFood Processing industry:
Dairy, fruits and vegetable processingGrain processing
Meat and poultry processing
Fisheries
Consumer foods including packaged foods,beverages and packaged drinking water

7/23/2019 Food industry Analysis
http://slidepdf.com/reader/full/food-industry-analysis 18/290

7/23/2019 Food industry Analysis
http://slidepdf.com/reader/full/food-industry-analysis 19/290
The Indian food processing at $135 billion and is estimated togrow at a CAGR of 10% to reach $200 billion by 2015
The industry has huge growth potential: Of the country total foodand agricultural produce only 2% is processed
The Industry contributed to 7% of the country’s GDP and itemployees 13 million people directly
Value addition of food products is expected to grow from 8% to35% by the end of 2025
The fruit and vegetable processing which is at a 2% growth rateis expected to reach 25% growth rate by 2025
The highest growth is in the dairy processing sector where 37% oftotal produce is processed
7/23/2019 Food industry Analysis
http://slidepdf.com/reader/full/food-industry-analysis 20/290
Processed foods are primarily derived from agricultural commodities,which often incur multiple taxes at various stages. This multiple taxationhas a cascading effect on prices and a barrier to the free flow ofmaterials from the farm to the factory and ultimately to the consumers
Diet food and nutraceuticals are the latest fad are available for everypatient today, be it hypertension, diabetes, obesity, or even weightreduction
Motivated by a desire for maximum indulgence coupled with a wish forcalorie control and health benefits, consumers are increasingly choosing
sugar-free and sugar-reduced products
Packaging of food products has become important in order to ensuresafety and hygiene and to eliminate the possibility of adulteration.However, packaging industry is yet to achieve international standards inthe country
7/23/2019 Food industry Analysis
http://slidepdf.com/reader/full/food-industry-analysis 21/290
India is one of the largest countries in the world, with a growing
population of 1.2 billion people
India’s GDP was US$1,843 billion in 2011 and is forecast to rise toUS$2,013 billion in 2012
GDP is expected to continue growing at rates around 7 – 8 percentper annum for the next few years
There has been a discernible increase in purchasing power in manyparts of the country and rising affluence in many urban pockets
However, income distribution in India remains uneven between awealthy urban population and a low income rural population
7/23/2019 Food industry Analysis
http://slidepdf.com/reader/full/food-industry-analysis 22/290
Almost a quarter of the population is living on less than US$1 per
day, even though GDP per capita is US$3,787
The income split essentially means that India has two separateconsumer segments, which are further split by strong regionaldifferences
India is one of the world’s largest food producers and has a largeagriculture industry and combined with a cultural preference forfresh food, means that India supplies the majority of its own food forconsumption
India is a growing market for processed food imports, which arebecoming more popular with the younger population, especially inurban areas
Consumption of food and beverages was estimated at US$366.8billion in 2011

7/23/2019 Food industry Analysis
http://slidepdf.com/reader/full/food-industry-analysis 23/290

7/23/2019 Food industry Analysis
http://slidepdf.com/reader/full/food-industry-analysis 24/290
Primary food processing (packaged fruit and vegetables, milk,milled flour and rice, tea, spices, etc.) constitutes around 60% ofprocessed foods
It has a highly fragmented structure that includes thousands of rice-mills and hullers, flour mills, pulse mills and oil-seed mills, severalthousands of bakeries, traditional food units and fruits, vegetableand spice processing units in the unorganized sector
In comparison, the organized sector is relatively small, with around516 flour mills, 568 fish processing units, 5’293 fruit and vegetable
processing units, 171 meat processing units and numerous dairyprocessing units at state and district levels
M t d
7/23/2019 Food industry Analysis
http://slidepdf.com/reader/full/food-industry-analysis 25/290
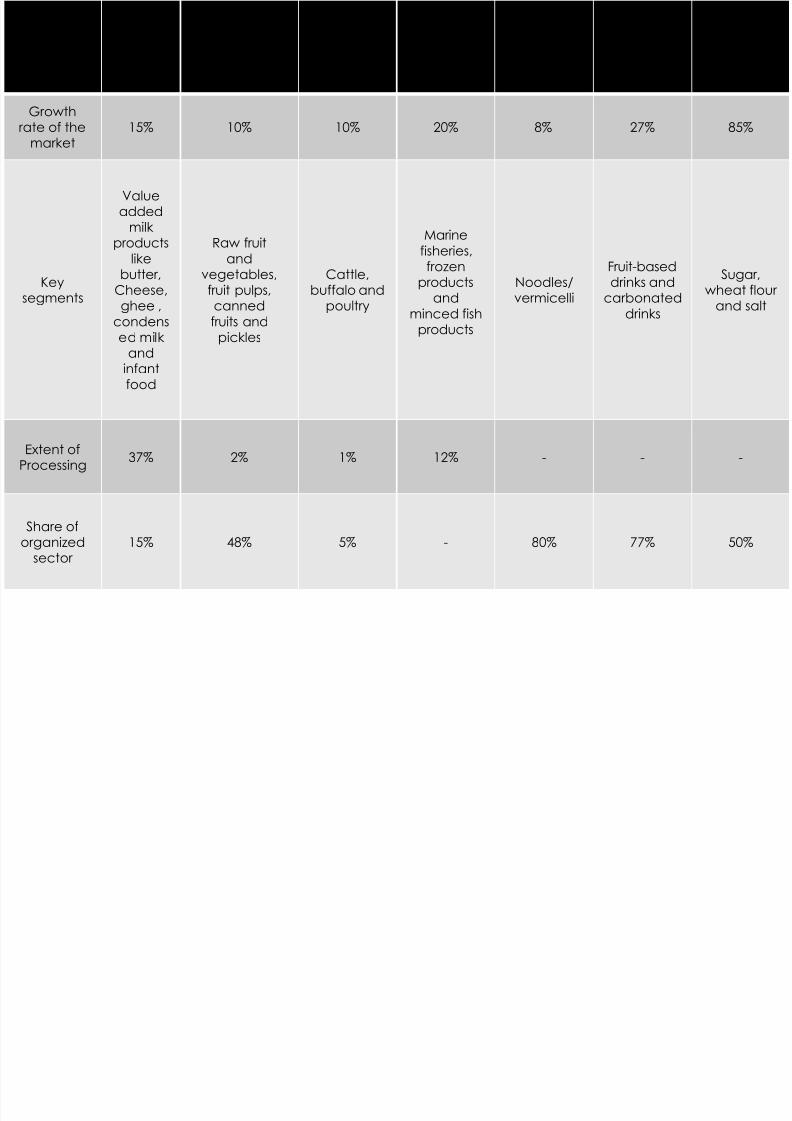
Segment
Dairy
SectorFruit and
Vegetables
Meat and
Poultry
ProcessingFisheries
Packaged
foods Beverages
Staple
foods
Growthrate of the
market
15% 10% 10% 20% 8% 27% 85%
Keysegments
Valueadded
milkproducts
like
butter,Cheese,ghee ,
condensed milk
andinfantfood
Raw fruitand
vegetables,fruit pulps,cannedfruits and
pickles
Cattle,buffalo andpoultry
Marinefisheries,frozen
productsand
minced fishproducts
Noodles/vermicelli
Fruit-based
drinks andcarbonated
drinks
Sugar,wheat flourand salt
Extent ofProcessing
37% 2% 1% 12% - - -
Share oforganized
sector
15% 48% 5% - 80% 77% 50%
7/23/2019 Food industry Analysis
http://slidepdf.com/reader/full/food-industry-analysis 26/290
The overall packaged food industry reached US$25.4 billion in 2011and is forecast to grow to US$38.5 billion by 2016
The highest value segments of packaged foods in 2011 were to be‘dairy’ (at US$9.1 billion), followed by ‘bakery’ (at US$4.9 billion), and
‘oils and fats’ (at US$4.1 billion)
The West India region has the highest value sales of packaged foodsin India
A large number of brands from domestic and multinational playersare present in the region and many international brands areimported

7/23/2019 Food industry Analysis
http://slidepdf.com/reader/full/food-industry-analysis 27/290
Consumer awareness of packaged foods is also high in North India,which is one the most affluent regions in the country with areas suchas New Delhi, NCR, Chandigarh, Jaipur and Lucknow
This has resulted in packaged foods seeing good growth in the
region and this trend is expected to continue
East and Northeast India are the smallest markets in India forpackaged food, due to the underdeveloped nature of these areasand continued political instability

7/23/2019 Food industry Analysis
http://slidepdf.com/reader/full/food-industry-analysis 28/290
7/23/2019 Food industry Analysis
http://slidepdf.com/reader/full/food-industry-analysis 29/290
ITC Limited
Parle Products Pvt. Ltd.
Agro Tech Foods
Amul Perfetti India Ltd.
Cadbury India Ltd.
PepsiCo India Holdings
Nestle India Pvt. Ltd. Britannia Industries Ltd.
Hindustan LeverLimited
Milkfood
MTR Foods Limited
Godrej IndustriesLimited
Gits Food Products Pvt.Ltd.
Dabur India Ltd.
Conagra Foods
Nissin Foods
Wal-mart
Venky's

7/23/2019 Food industry Analysis
http://slidepdf.com/reader/full/food-industry-analysis 30/290
7/23/2019 Food industry Analysis
http://slidepdf.com/reader/full/food-industry-analysis 31/290
India today stands first in the world in terms of milk production
The output is expected to be about 108 million tonnes(estimate for 2007), growing at a compounded annual
growth rate of 4%
Consumption of milk has registered a growth of nearly 8.4%(in urban areas) and is currently valued at US$ 16 billion
Within India, the dairy sector also ranks second in terms ofprocessed foods with 37% of the produce being processed

7/23/2019 Food industry Analysis
http://slidepdf.com/reader/full/food-industry-analysis 32/290
The organized sector processes an estimated 15% of the total milkoutput in India. There are 676 dairy plants registered withGovernment of India, which come under the organized sector
According to estimates of “Dairy India 2007”, the current size of the
Indian dairy sector is US$ 62.67 billion and has been growing at arate of 5% a year. Both production and consumption of milk and itsderivatives are traditionally high in the country
The dairy exports in 2007-08 rose to US$ 210.50 million against US$
113.57 million in the corresponding period, in the last fiscal, whereasthe domestic dairy sector is slated to cross US$ 108 billion in revenuesby 2011

7/23/2019 Food industry Analysis
http://slidepdf.com/reader/full/food-industry-analysis 33/290
Milk and milk products contribute to a significant 17% of thecountry’s total expenditure on food
Traditional dairy products account for about 50% of the totalmilk produced
The market for dairy products is expected to grow at 15-20%over the next three years
Ghee (or clarified butter) is the most widely marketed andbranded product with a nation-wide penetration of 24.1%
It is estimated to be growing at a rate of 8% per annum

7/23/2019 Food industry Analysis
http://slidepdf.com/reader/full/food-industry-analysis 34/290
The dairy whitener market comprises of sweetened milkpowders, condensed milk and creamers. Its market size isestimated at US$ 450 million for 2005-06
The cheese market is estimated at US$ 2.49 million for 2005-06(54’000 tonnes in volume terms), growing at a rate of nearly10% per annum
The organized cheese market is dominated by processedcheese which accounts for 74% market share
The ice-cream market in India is estimated at US$ 226 millionin 2005-06, with the organised market at US$ 158.2 billion

7/23/2019 Food industry Analysis
http://slidepdf.com/reader/full/food-industry-analysis 35/290
Probiotic dairy products - containing live organisms buildingimmunity and helping in digestion - are an emergingcategory in the Indian food market
Along with domestic dairy majors like, Amul and MotherDairy, global players like Nestle have made significantinvestments to capitalize the potential of this particular nichesegment
The latest entrant is Yakult Danone with its investment worthUS$ 28.3 million and an additional US$ 20.8 million on thecards for the next 2-3 years

7/23/2019 Food industry Analysis
http://slidepdf.com/reader/full/food-industry-analysis 36/290
According to the latest report on 'Indian Functional Foodsand Beverage Markets' by Frost & Sullivan, the market ofneutraceuticals and probiotics earned revenues of over US$185 million in 2007 and is projected to touch an estimated US$
1.16 billion in 2012
Although the segment is currently in its nascent stage, it ispoised for an upswing riding piggy-back on a healthydomestic economy and awareness of health products, thus
giving a boost to this segment.

7/23/2019 Food industry Analysis
http://slidepdf.com/reader/full/food-industry-analysis 37/290

7/23/2019 Food industry Analysis
http://slidepdf.com/reader/full/food-industry-analysis 38/290
India produces the widest range of fruits and vegetables in theworld. It is the second largest vegetable and third largest fruitproducer accounting for 8.4% of the world’s food andvegetable production
The share of organised sector in fruit processing is estimated tobe nearly 48%
Fruit production in India registered a growth of 3.9% during theperiod 2000-05 whereas the fruit processing sector grew severaltimes faster at 20% over the same period
The total area under fruit cultivation is estimated at 4.18 millionhectares
The total area under vegetable cultivation is estimated at 7.59million hectares

7/23/2019 Food industry Analysis
http://slidepdf.com/reader/full/food-industry-analysis 39/290
However, less than 2% of the total vegetables produced in thecountry are commercially processed, as compared to nearly 70% inBrazil and 65% in USA
While products like juices and fruit concentrates are largelymanufactured by the organized sector, pickles, sauces belong tounorganized sector
About 20% of processed fruits and vegetables are exported. Majorproducts exported include fruit pulps, pickles and chutneys, cannedfoods, concentrated pulps and juices and vegetables
Fruit exports have registered a growth of 16% in volume and 25% invalue terms in 2005-06. Mango and mango based products aloneconstitute 50% of these exports

7/23/2019 Food industry Analysis
http://slidepdf.com/reader/full/food-industry-analysis 40/290

7/23/2019 Food industry Analysis
http://slidepdf.com/reader/full/food-industry-analysis 41/290
India produces over 200 million tonnes of grains every year
India’s production covers all major grains are rice, wheat,maize, barley and millets like jowar, bajra and ragi
It ranks third in the production of grains in the world
With a share of 40%, grain processing is the biggestcomponent of food sector
Primary processing constitutes 96% with the remainingaccounted for by the secondary and tertiary sectors

7/23/2019 Food industry Analysis
http://slidepdf.com/reader/full/food-industry-analysis 42/290
Total rice milling capacity in the country is around 190 milliontonnes
There are about 516 large flour mills in the country, as well asabout 10’000 pulse mills
Soya food segment is also growing due to increased healthconsciousness and abundant production of quality soya
bean (3.72 million tons/year) in the country

7/23/2019 Food industry Analysis
http://slidepdf.com/reader/full/food-industry-analysis 43/290

7/23/2019 Food industry Analysis
http://slidepdf.com/reader/full/food-industry-analysis 44/290
Total meat production is around 5 million tonnes annually
Most of the production largely belongs to unorganizedsector. Some of the organised players are Venky’s andGodrej’s Real Chicken
Only 1-2% of the meat produce is converted to value addedproducts
Growth rate of egg and broiler production is around 16% and20% respectively
Poultry processing is still at a nascent stage in India

7/23/2019 Food industry Analysis
http://slidepdf.com/reader/full/food-industry-analysis 45/290

7/23/2019 Food industry Analysis
http://slidepdf.com/reader/full/food-industry-analysis 46/290
The fisheries sector contributes to 1.4% of the country’s GDP
Processing of fish and canned fish is almost entirely for export market
The fish and seafood market has continued to grow strongly asmiddle-class Indian consumers’ purchasing power continues togrow. However, this is starting from a very low base.
Molluscs and cephalopods are the fastest-growing categories of fishand seafood
India’s National Fisheries Development Board is spending Rs6.2 billion(US$123 million) to expand the use of intensive aquaculture in India,providing money to help farmers adopt technologies for sustainablefish farming and fish seed production

7/23/2019 Food industry Analysis
http://slidepdf.com/reader/full/food-industry-analysis 47/290
7/23/2019 Food industry Analysis
http://slidepdf.com/reader/full/food-industry-analysis 48/290
Consumer food industry which is a subset of thefood industry consists of: Packaged Food
Aerated Soft Drinks Packaged Drinking Water
Alcoholic Beverages
The segment consists of bakery products, ready-to-eat snacks, chips, namkeens

7/23/2019 Food industry Analysis
http://slidepdf.com/reader/full/food-industry-analysis 49/290

7/23/2019 Food industry Analysis
http://slidepdf.com/reader/full/food-industry-analysis 50/290
The beverages market primarily consists of non-alcoholic beverageswhich can be broadly classified into carbonated drinks, non-carbonated drinks and hot beverages
According to industry experts, the market for carbonated drinks inIndia is worth US$ 1.8 billion while the juice and juice-based drinksmarket accounts for US$ 300.67 million, of the approximately US$2.38 billion packaged beverages category. Growing at a rate of25% per cent
The fruit-drinks category is one of the fastest growing in thebeverages market
The US$ 1.80 billion carbonated drinks category is expected to facethe heat of the rising competition from
7/23/2019 Food industry Analysis
http://slidepdf.com/reader/full/food-industry-analysis 51/290
Categories falling under the health umbrella, i.e. juice and juice-based drinks, energy and sports drinks, maltedbeverages, probiotic drinks and bottled water. They areconsidered a socially acceptable alternative to alcoholic
beverages
At US$ 300.67 million, the juice and juice drink category isamong the fastest growing segments
While fruit drinks as a category is growing at 18% - 20%,carbonated soft drinks are growing at 6% - 8% driven by thepositive changes in India’s consumer profile.

7/23/2019 Food industry Analysis
http://slidepdf.com/reader/full/food-industry-analysis 52/290

7/23/2019 Food industry Analysis
http://slidepdf.com/reader/full/food-industry-analysis 53/290
Two of the world’s biggest global brands are wellestablished in this segment
Soft drinks constitute the third largest packagedfood segments after tea and biscuits
Penetration levels of aerated soft drinks if quite low
compared to other developing and developedmarkets

7/23/2019 Food industry Analysis
http://slidepdf.com/reader/full/food-industry-analysis 54/290

7/23/2019 Food industry Analysis
http://slidepdf.com/reader/full/food-industry-analysis 55/290
Trends such as shortage of drinking water, changesin consumer lifestyle has fueled growth in thissegment
Almost all the big players in the F&B players aretrying to gain foothold in this segment

7/23/2019 Food industry Analysis
http://slidepdf.com/reader/full/food-industry-analysis 56/290
7/23/2019 Food industry Analysis
http://slidepdf.com/reader/full/food-industry-analysis 57/290
Hot beverages include health drinks such as white beverages(Horlicks, Bournvita, etc) and brown beverages such astea/coffee as well as branded drinks (Boost)
The total size of this market is estimated at US$ 333 million byvalue and 85’000 tonnes by volume. White beveragesaccount for 65% of the market and brown beveragesconstitute the remaining 35%
India is the largest producer of tea in the world accountingfor 28% of the total global production, at 857 million kg.

7/23/2019 Food industry Analysis
http://slidepdf.com/reader/full/food-industry-analysis 58/290
Tea production in India has been growing at 1.2% per annumand India is the fourth largest exporter of tea in the world withestimated exports of US$ 5 million in 2002-03
India is also the fifth largest producer of coffee accountingfor 4% of the total production in the World
Nearly 75% of India’s production is exported and coffeeexports stood at US$ 5.2 million in 2005-06

7/23/2019 Food industry Analysis
http://slidepdf.com/reader/full/food-industry-analysis 59/290

7/23/2019 Food industry Analysis
http://slidepdf.com/reader/full/food-industry-analysis 60/290
India is the third largest for alcoholic beverages in the world
The demand for spirits and beer is estd. Around 373 millioncases per annum
There are 12 joint venture companies producing grain basedbeverages with a combined capacity of 33.9 million liters perannum
The overall wine forecasted to grow to INR23,140.2 million by2015

7/23/2019 Food industry Analysis
http://slidepdf.com/reader/full/food-industry-analysis 61/290
The highest value segments are estimated to be ‘still lightgrape wine’ (at INR7,884.7 billion), followed by ‘sparkling’ (atINR1,846.8 billion), and ‘fortified wines’ (at INR1,213.2 million)
And, while Bangalore, Chandigarh, Mumbai are reportinghigh growth in consumption, Nasik, the capital of Indianwines, registered a 100% rise
Out of the total consumption of grape wine in India, around80% wine consumption is from the major cities

7/23/2019 Food industry Analysis
http://slidepdf.com/reader/full/food-industry-analysis 62/290

7/23/2019 Food industry Analysis
http://slidepdf.com/reader/full/food-industry-analysis 63/290
Bread is slowly coming to be a staple product consumedby people of all economic classes in India
Total bread production in the country in 2004-05 was
estimated at 2.7 million tons, growing at 7.5%
About 55% of bread production comes from the organisedsector
India is the second largest producer of wheat in the world
with an output of more than 70 million tonnes
Branded ‘atta’ (wheat flour) is an important item in thissegment with an estimated market of US$ 195 million

7/23/2019 Food industry Analysis
http://slidepdf.com/reader/full/food-industry-analysis 64/290

7/23/2019 Food industry Analysis
http://slidepdf.com/reader/full/food-industry-analysis 65/290
The Indian market holds enormous growth potential for snackfood, which is estimated to be a market worth US$ 3 billion
The organised sector of the snack food market is growing at 15%- 20% a year while the growth rate of the US$ 1.56 billion
unorganized sector is 7% - 8%
Consumption level of commercial savory snacks is 10 timeshigher than that in the rural markets
Around 1’000 snack items and 300 types of savories are sold in
India
The segment is largely dominated by potato chips and potato-based products with over 85% share of the salty snack market.

7/23/2019 Food industry Analysis
http://slidepdf.com/reader/full/food-industry-analysis 66/290

7/23/2019 Food industry Analysis
http://slidepdf.com/reader/full/food-industry-analysis 67/290
The global retail market for organic food has grown to US$ 100 billionfrom US$ 35 billion over the last three years
The exports of organic food from India have grown to US$ 65 million
over the past one year from US$ 21.6 million two years ago
Some players, like Navdanya, organically cultivates crops like jowar,bajra, millet, in its 21 acre farm in Dehradun and sells it from its retailoutlets in Delhi and Mumbai
The number of such growers has been rising in the Dehradun valleyand Bundelkhand. APEDA in association with the Ministry ofAgriculture has taken an initiative to convert 20’000 farmers and atotal area of 75’000 hectares to organic farming over the next threeyears
7/23/2019 Food industry Analysis
http://slidepdf.com/reader/full/food-industry-analysis 68/290
Following suit, the Darjeeling Tea Association (DTA) has mountedefforts to increase the production of organic tea
According to the industry experts, about 37% of the total crop
grown on the slopes of the eastern Himalayas, at present, is organictea, as per certifications given by European and Japaneseagencies. DTA is aiming to organically produce the majority of thechampagne of teas by 2010

7/23/2019 Food industry Analysis
http://slidepdf.com/reader/full/food-industry-analysis 69/290
7/23/2019 Food industry Analysis
http://slidepdf.com/reader/full/food-industry-analysis 70/290
Overall food and beverage consumption is expected togrow at rates between 6 – 11 percent for the next few years
The products and sectors that are expected to have the
highest potential for growth are:› Ready to eat meals, canned foods and snacks are forecast to
be in higher demand
› There is high growth for processed dairy and milk products.Additionally, the dairy processing industry in India is growing and
demanding milk and dairy ingredients› Cheese, butter, whey, yoghurt and ice cream are some of the
major dairy products that are imported with cheese being themost popular

7/23/2019 Food industry Analysis
http://slidepdf.com/reader/full/food-industry-analysis 71/290
› In India, tea is one of the only beverage products that has amature market. Other beverages such as coffee, carbonateddrinks and functional drinks all are experiencing high growth.Coffee consumption is expected to grow 20 – 30 percent per yearfor the next few years
› Demand for wine is also growing, but the market is still capturedmostly by domestic suppliers due to high tariffs on importedwines. Still red wine sales are forecast to grow by 17.6 percentcompound annual growth rate (CAGR) between 2010 and 2015,fortified wine by 15.9 percent and still white wine by 15.2 percent
› As incomes rise, the consumption of fish is expected to increase17 percent by 2015

7/23/2019 Food industry Analysis
http://slidepdf.com/reader/full/food-industry-analysis 72/290

7/23/2019 Food industry Analysis
http://slidepdf.com/reader/full/food-industry-analysis 73/290
What are the different segments?
Consumer Food Sector

7/23/2019 Food industry Analysis
http://slidepdf.com/reader/full/food-industry-analysis 74/290
Consumer Food Sector
Packaged Food
Confectionary
Canned Food
Bakery
Processed food
Dairy
Noodles & Pastas
Sweet and SavorySnacks
Oils and fats
Sauces and Spreads
Soups & Ready
Meals

7/23/2019 Food industry Analysis
http://slidepdf.com/reader/full/food-industry-analysis 75/290
Also referred to as convenience food, packaged food is dividedinto numerous segments
Some of the leading players in packaged food in India are
Hindustan Unilever, Gujarat Co-operative Milk Marketing Federation,Nestlé India Ltd, Frito-Lay India, GlaxoSmithKline ConsumerHealthcare Ltd, Britannia Industries Ltd, MTR Foods and KarnatakaCooperative Milk Producers Federation Ltd.
With the range of packaged food products available in India likely
to become wider and awareness of such products expected toincrease over the forecast period, it is expected that packagedfood will continue to witness healthy growth in the future.
8 00 000 0
Market Size by Retail Value

7/23/2019 Food industry Analysis
http://slidepdf.com/reader/full/food-industry-analysis 76/290
0.0
2,00,000.0
4,00,000.0
6,00,000.0
8,00,000.0
10,00,000.0
12,00,000.0
14,00,000.0
16,00,000.0
18,00,000.0
2007 2008 2009 2010 2011 2012
Packaged Food Canned/Preserved Food Confectionery Dairy

7/23/2019 Food industry Analysis
http://slidepdf.com/reader/full/food-industry-analysis 77/290
Confectionary
7/23/2019 Food industry Analysis
http://slidepdf.com/reader/full/food-industry-analysis 78/290
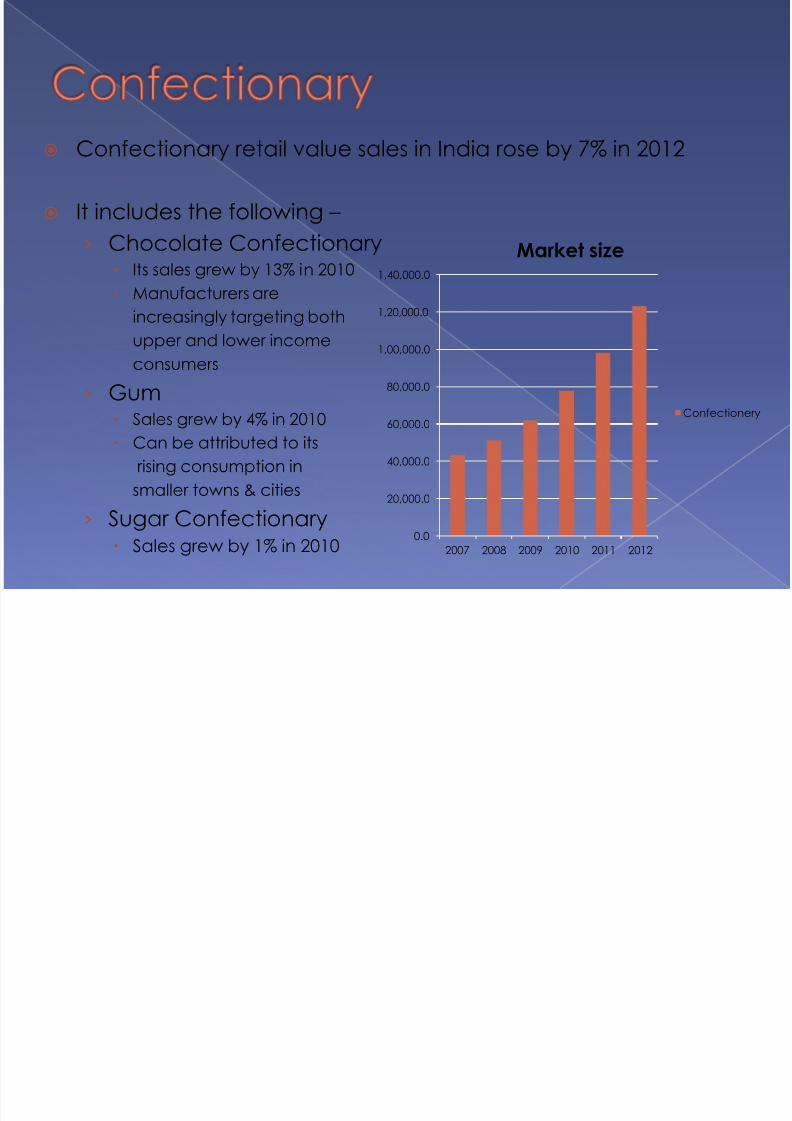
Confectionary retail value sales in India rose by 7% in 2012
It includes the following –
› Chocolate Confectionary Its sales grew by 13% in 2010
Manufacturers are
increasingly targeting both
upper and lower income
consumers
› Gum
Sales grew by 4% in 2010 Can be attributed to its
rising consumption in
smaller towns & cities
› Sugar Confectionary Sales grew by 1% in 2010
0.0
20,000.0
40,000.0
60,000.0
80,000.0
1,00,000.0
1,20,000.0
1,40,000.0
2007 2008 2009 2010 2011 2012
Market size
Confectionery
7/23/2019 Food industry Analysis
http://slidepdf.com/reader/full/food-industry-analysis 79/290
Stronger economic growth has boosted consumer confidence and
led to increased disposable incomes
This has benefited the performance of key indulgence categorieslike chocolate confectionery and functional gum, which commandhigher unit prices
Giving chocolate as a gift for festive occasions has returned
Medicated confectionary is also exhibiting robust performance andgrew by 2.4%in 2010
Functional gum remained the best performing gum category invalue terms in 2010, growing by around17%
This can be attributed to active efforts by the manufacturers to
educate consumers of its dental benefits

7/23/2019 Food industry Analysis
http://slidepdf.com/reader/full/food-industry-analysis 80/290
Canned/Preserved Food
7/23/2019 Food industry Analysis
http://slidepdf.com/reader/full/food-industry-analysis 81/290
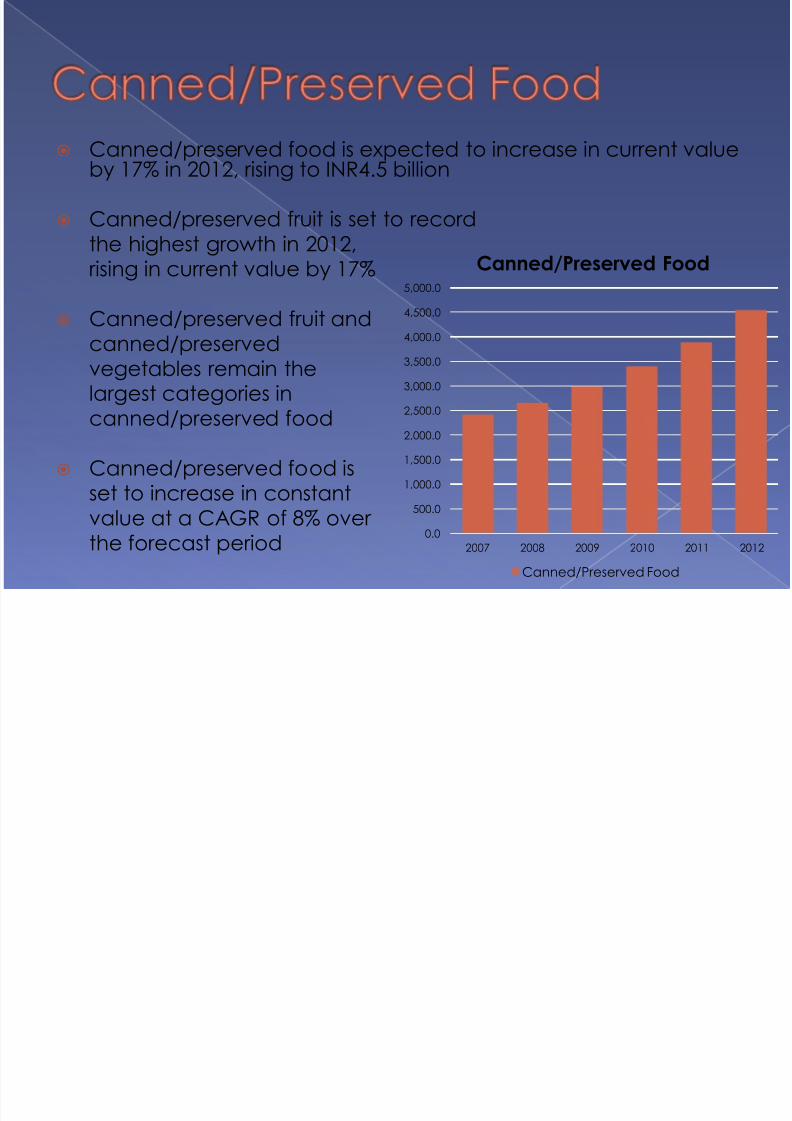
Canned/preserved food is expected to increase in current valueby 17% in 2012, rising to INR4.5 billion
Canned/preserved fruit is set to recordthe highest growth in 2012,rising in current value by 17%
Canned/preserved fruit andcanned/preservedvegetables remain thelargest categories in
canned/preserved food
Canned/preserved food isset to increase in constantvalue at a CAGR of 8% over the forecast period
0.0
500.0
1,000.0
1,500.0
2,000.0
2,500.0
3,000.0
3,500.0
4,000.0
4,500.0
5,000.0
2007 2008 2009 2010 2011 2012
Canned/Preserved Food
Canned/Preserved Food
7/23/2019 Food industry Analysis
http://slidepdf.com/reader/full/food-industry-analysis 82/290
Consumer awareness of packaged food categories such asfrozen processed food and canned/preserved food continuedto rise in India
This is occurring mainly due to the initiatives being undertaken bycompanies such as McCain Foods India Pvt. Ltd with the aim ofeducating Indian consumers about the benefits of these
packaged food products
Canned/preserved fruit and canned/preserved vegetableswere the first categories to be introduced & are set to be thefastest growing categories in canned/preserved food
However the value growth is expected to be lower than that offrozen processed food
The consumption of canned/preserved food remains limited tourban areas and the distribution of these products isconcentrated in modern grocery retail channels

7/23/2019 Food industry Analysis
http://slidepdf.com/reader/full/food-industry-analysis 83/290
Bakery

7/23/2019 Food industry Analysis
http://slidepdf.com/reader/full/food-industry-analysis 84/290
It includes the following – Baked Goods
› It is expected to post a CAGR of 4% in constant value terms
› Unpackaged/artisanal pastries is likely to register the fastest growth of 13%
Biscuits› Its’ sales are expected to post
a CAGR of 9%
› Cookies is expected to register
› the strongest value growth
Breakfast Cereals› It is projected to grow by a
CAGR of 16%
› Hot cereals is likely to lead
breakfast cereals with value
sales rising 33% in 20110.0
50,000.0
1,00,000.0
1,50,000.0
2,00,000.0
2,50,000.0
3,00,000.0
2007 2008 2009 2010 2011 2012
Market Size
Bakery
Market Size

7/23/2019 Food industry Analysis
http://slidepdf.com/reader/full/food-industry-analysis 85/290
0.0
20,000.0
40,000.0
60,000.0
80,000.0
1,00,000.0
1,20,000.0
1,40,000.0
1,60,000.0
1,80,000.0
2007 2008 2009 2010 2011 2012
Baked Goods
Biscuits
Breakfast Cereals
Market Size

7/23/2019 Food industry Analysis
http://slidepdf.com/reader/full/food-industry-analysis 86/290
Demand for bread is relatively stable and consumers are shiftingtowards healthier formats such as brown or enriched bread
Bread, cakes and pastries have grown, aided by franchiseexpansion of the leading chains of both artisanal and packagedplayers
Cakes are increasingly being used as gifts instead of traditionalsweets
Artisanal baked goods players were the leaders with a 57% value
share in 2010
With chained supermarkets/hypermarkets projected to expandfurther to reach tier-two and tier-three cities, this will give rise to anincreasing number of in-store bakeries
7/23/2019 Food industry Analysis
http://slidepdf.com/reader/full/food-industry-analysis 87/290
Consumers consider biscuits as a cheaper indulgence andnourishing products and an alternative to higher-priced cakes,pastries, and sweets
Diverse flavors and new products have made biscuits a moreattractive snack for young consumers
Innovations such as savory biscuits and crackers have contributedmajorly to the growth
With the rise in lifestyle related diseases including diabetes,
hypertension and obesity, health has become a key factor
Leading manufacturers have started offering biscuits positioned onthe health and wellness platform including sugar free, diabetic-friendly products, oat or wholegrain based

7/23/2019 Food industry Analysis
http://slidepdf.com/reader/full/food-industry-analysis 88/290
An increasing number of manufacturers have fortified breakfastcereals with vitamins, added health food ingredients and promotedtheir health benefits through educational and social programs
Growing awareness of the benefits of oats for heart health drivesdemand for breakfast cereals
Mueslis was the second fastest growing breakfast cereal category.
Niche products have emerged in the market, such as bran flakes,oatmeal squares and low fat granola, but their sales will be limited
to urban areas because they are currently only available in largesupermarkets/ hypermarkets

7/23/2019 Food industry Analysis
http://slidepdf.com/reader/full/food-industry-analysis 89/290
Processed Food

7/23/2019 Food industry Analysis
http://slidepdf.com/reader/full/food-industry-analysis 90/290
It includes the following – Frozen Processed Food
› It is expected to increase in constant value at a CAGR of 17%
› Frozen processed red meat is set to be the fastest growing frozenprocessed food category in 2012, increasing in value by 24%
Chilled Processed Food› Sales of chilled processed food
are set to remain negligible
Dried Processed Food› It is expected to increase in
constant value at a CAGR of16%
› Instant noodles with a value
growth of 30% followed by Rice
with a value growth of 24%
posted the highest value growth0.0
10,000.0
20,000.0
30,000.0
40,000.0
50,000.0
60,000.0
70,000.0
80,000.0
90,000.0
1,00,000.0
2007 2008 2009 2010 2011 2012
Market Size
Processed Food

7/23/2019 Food industry Analysis
http://slidepdf.com/reader/full/food-industry-analysis 91/290
The rising number of supermarkets and hypermarkets with freezerdisplay cabinets contributes to the strong growth registered in frozenprocessed food during 2012
Mother Dairy Fruit & Vegetable Ltd, Al Kabeer Exports Pvt. Ltd andVenky’s India Ltd are the three leading players
The changing perception of frozen processed food is based on risingawareness of its benefits in comparison with fresh food, and this inturn is driving its growth
Frozen processed vegetables is set to account for 44% of total frozenprocessed food retail value sales with Green Peas being thedominant format
The retail distribution of frozen processed red meat and frozenprocessed poultry is set to undergo quite radical changes

7/23/2019 Food industry Analysis
http://slidepdf.com/reader/full/food-industry-analysis 92/290
The rising awareness of frozen processed food and canned food inIndia has the potential to help build awareness of chilled processedfood as well
A number of players introduced premium products in rice in Indiaduring 2011 and 2012 as many consumers became more willing to
spend money on high quality rice
Spurred on by a variety of factors such as better shelf positioning,visual merchandising and in-store promotions, rice is expected toincrease in value by 24%
Organic basmati rice has a good future in India

7/23/2019 Food industry Analysis
http://slidepdf.com/reader/full/food-industry-analysis 93/290
Dairy

7/23/2019 Food industry Analysis
http://slidepdf.com/reader/full/food-industry-analysis 94/290
It includes the following – Ice Creams
› It is expected to increase by a CAGR of 12%
Yogurt & Sour Milk Products› It is expected to increase by CAGR of 20%
Cheese› It is expected to post a CAGR
of 14%
Drinking Milk Products› Its’ sales are expected to post
a CAGR of 7%
Other Dairy Products› It is expected to increase by a
› CAGR of 3%
0.0
1,00,000.0
2,00,000.0
3,00,000.0
4,00,000.0
5,00,000.0
6,00,000.0
2007 2008 2009 2010 2011 2012
Market Size

7/23/2019 Food industry Analysis
http://slidepdf.com/reader/full/food-industry-analysis 95/290
Current value sales of single portion dairy ice cream are expectedto see the fastest growth
Historically, ice cream consumption in India was limited to thesummer months but gradually it has become popular as a dessertoption
The healthy growth being registered by ice cream fast food chains isexpected to result in increased demand for retail forms
Flavored and fruited yoghurt are receiving increased attention
Pro/pre biotic drinking yoghurt sales are also increasing rapidly
Packaged and branded soft cheese (primarily paneer in India)overtook processed cheese for the first time in terms of value sales in
2010

7/23/2019 Food industry Analysis
http://slidepdf.com/reader/full/food-industry-analysis 96/290
The popularity of foreign cuisine such as pasta, pizza, and burgers, islikely to drive the retail volume growth of cheese in India
Spreadable processed cheese is expected to see the highestconstant value CAGR, as it will gradually serve as a viablealternative to spreads in India
Spicy variants of processed cheese & packaged paneer willdominate the push towards product diversification
Fresh/pasteurized milk is expected to comprise 83% of value sales of
drinking milk products
Ambient flavored milk drinks is expected to be the dominant formatin India, as chilled milk drinks face operational constraints in thecountry
7/23/2019 Food industry Analysis
http://slidepdf.com/reader/full/food-industry-analysis 97/290
Value-added products such as fermented milk and fruit-baseddairy drinks are likely to experience many new product launches
Dairy only flavored milk drinks and soy milk are forecast to see thefastest growth
Milk and milk powder, which are both essential components of otherdairy products in India, registered exceptional increases in bothwholesale and retail prices in 2011
New categories such as cream and dairy-based desserts are
expected to emerge as rapid growth categories

7/23/2019 Food industry Analysis
http://slidepdf.com/reader/full/food-industry-analysis 98/290
Noodles & Pastas

7/23/2019 Food industry Analysis
http://slidepdf.com/reader/full/food-industry-analysis 99/290
It includes the following – Noodles
› It is expected to increase by a CAGR of 18%
› Pouch instant noodles will experience the fastest growth
Pastas› It is expected to increase by
CAGR of 18%
› Strong growth in the category
due to the rising popularity of
Italian cuisine
0.0
5,000.0
10,000.0
15,000.0
20,000.0
25,000.0
30,000.0
35,000.0
40,000.0
45,000.0
2007 2008 2009 2010 2011 2012
Noodles & Pasta
Noodles & Pasta
7/23/2019 Food industry Analysis
http://slidepdf.com/reader/full/food-industry-analysis 100/290
Due to the heavy advertising by manufacturers, the awareness ofthis product has improved drastically and has thus evolved tobecome a regular staple in all households
Manufacturers are experimenting with different & exotic flavours tooffer a wide choice of product offerings
Noodles was dominated by Maggi five years ago, but with brandslike Foodles, Yippie! and Knorr entering the space through brandextensions and deep advertising pockets coupled with strongdistribution networks, the competition is intensifying
Soup, oat and curry noodles have also been launched
Many private label products have entered pasta and are expectedto do well as they can offer competitive pricing

7/23/2019 Food industry Analysis
http://slidepdf.com/reader/full/food-industry-analysis 101/290
Sweet & Savory Snacks

7/23/2019 Food industry Analysis
http://slidepdf.com/reader/full/food-industry-analysis 102/290
It is expected to increase at a CAGR of 13%
Sweet and savory snacks witnessed many product innovations underthe health and wellness banner
Nuts is expected to grow by 13%
Extruded snacks is expected to
show robust growth which will
be mainly attributable to high
sales from snacks at lower pricepoints priced between Rs5-10
The biggest threat to this category
are growing health concerns
0.0
10,000.0
20,000.0
30,000.0
40,000.0
50,000.0
60,000.0
70,000.0
80,000.0
90,000.0
1,00,000.0
2007 2008 2009 2010 2011 2012
Market Size
Sweet and Savoury Snacks

7/23/2019 Food industry Analysis
http://slidepdf.com/reader/full/food-industry-analysis 103/290
Oils & Fats

7/23/2019 Food industry Analysis
http://slidepdf.com/reader/full/food-industry-analysis 104/290
It is expected to increase by a CAGR of 4%
Vegetable and seed oil continues to dominate oils and fats
Although activity on the health
and wellness front is on the riseprice is still a key concern
Olive oil is expected to see the
fastest growth
New packaging sizes in margarine
& ghee are being introduced to
Drive volume sales0.0
50,000.0
1,00,000.0
1,50,000.0
2,00,000.0
2,50,000.0
3,00,000.0
3,50,000.0
4,00,000.0
2007 2008 2009 2010 2011 2012
Market Size
Oils and Fats

7/23/2019 Food industry Analysis
http://slidepdf.com/reader/full/food-industry-analysis 105/290
Sauces & Spreads

7/23/2019 Food industry Analysis
http://slidepdf.com/reader/full/food-industry-analysis 106/290
It includes the following – Sauces, Dressings & Condiments
› It is expected to increase by a CAGR of 8%
› It will witness 19% value growth
Spreads› It is expected to increase by
CAGR of 7%
› It will witness value growth of 12%
› Honey is likely to lead in spreads
with 13% growth in current value
sales
0.0
10,000.0
20,000.0
30,000.0
40,000.0
50,000.0
60,000.0
70,000.0
2007 2008 2009 2010 2011 2012
Market Size
Sauces & Spreads

7/23/2019 Food industry Analysis
http://slidepdf.com/reader/full/food-industry-analysis 107/290
International cuisines drive sales of sauces, dressings andcondiments
Wet/cooking sauces are still at a nascent stage in India
Another factor which has led to robust growth in this category is the
increasing prices of vegetables, like onion, garlic and ginger
The most popular table sauce is mayonnaise which showed thehighest value growth in table sauces
Ketchup is the most notable category in table sauces which willgrow by 16%
Companies have come up with innovative squeeze bottles whichare far more convenient to use than glass bottles

7/23/2019 Food industry Analysis
http://slidepdf.com/reader/full/food-industry-analysis 108/290
MTR Foods Ltd which forayed into the snacks market is eyeingacquisitions in the jams and ketchup categories
Field Fresh Foods Pvt. Ltd has plans to introduce pasta sauce to theIndian market
Honey, jams and preserves made up the bulk of spreads sales in2011
There is fast growing interest in chocolate spreads, such as Nutella innut-based spreads, or Skippy in peanut butter
The lack of growth in the bread segment, coupled with competitionfrom dairy spreads, may affect sales of jam and preserves

7/23/2019 Food industry Analysis
http://slidepdf.com/reader/full/food-industry-analysis 109/290
Soups & Ready Meals

7/23/2019 Food industry Analysis
http://slidepdf.com/reader/full/food-industry-analysis 110/290
It includes the following – Soup
› It is expected to increase by a CAGR of 12%
› Dehydrated soup to exhibit 21% value growth
Ready Meals› It is expected to increase by
CAGR of 9%
› Canned/preserved ready meals
and frozen ready meals are set to
be the most important categories
in ready meals
0.0
500.0
1,000.0
1,500.0
2,000.0
2,500.0
3,000.0
3,500.0
2007 2008 2009 2010 2011 2012
Market Size
Soups & Ready Meals

7/23/2019 Food industry Analysis
http://slidepdf.com/reader/full/food-industry-analysis 111/290
Canned/preserved soup, which is more popular than dehydrated
soup worldwide, is expected to show a decline in value sales
Manufacturers are launching soups in varieties of exotic flavors toappeal to consumers’ taste buds
Potential threats include competition from other snack offerings,such as biscuits, snack bars and cereals, which are expected tocompete with soup on the convenience and health front
Another potential threat for this category is the lack of awareness
about such products in rural areas
Both Indian companies and international players are expected tomake attempts to launch new products in ready meals which targetdemand for local flavours and traditional dishes

7/23/2019 Food industry Analysis
http://slidepdf.com/reader/full/food-industry-analysis 112/290
Packaged Food Industry

7/23/2019 Food industry Analysis
http://slidepdf.com/reader/full/food-industry-analysis 113/290
Demographical Changes› India has a large young population; with a median age of 25.5 as of 2012
› They have sufficient disposable income, are individualistic and want tostand out in whatever they do.
› As a resulting they are driving demand for & rapidly embracing newbrands
› Children are aware & have become more vocal in making theirpreferences known to parents
› An increasing number of young adults have moved to cities for work orstudy & also make daily decisions regarding what food products to buy
Socio Economic Drivers: Increased Income /Affordability
› The Indian middle class is increasing in size and purchasing power andwill definitely spend more on this category of consumer expendables

7/23/2019 Food industry Analysis
http://slidepdf.com/reader/full/food-industry-analysis 114/290
Expansion in the Food Services Sector › The proliferation of foodservice outlets and consumer’s interest in dining
out will present growth opportunities for packaged food manufacturers incoming years
› The consumers palate is also expanding and they are increasinglyexperimenting and trying out varied cuisines and flavors
› This has generated interest in packaged food products with internationalflavors
› Products that will benefit from these trends include cheese, sauces anddressings, frozen processed food, noodles, pasta, oil and fats
› Olive oil is also expected to perform well as consumers become morefamiliar with its use in preparation of Western dishes, as well as its health
benefits› Similarly, noodles and soup will also gain greater acceptance among
consumers

7/23/2019 Food industry Analysis
http://slidepdf.com/reader/full/food-industry-analysis 115/290
Focus on Health Benefits› In larger cities consumers are switching to healthier options of packaged
food, such as whole meal bread and low-sugar sweets
› Healthy products positioned for the mass segment are expected toperform more strongly than products targeting the niche high-incomesegment
› With increases in disposable incomes consumers may be more willing topay for healthier products which are often priced higher than similarproducts without health positioning
› Manufacturers continue to push health-oriented products, as theyrecognize there is huge potential for health and wellness to develop inIndia
› Manufacturers may also look at new fortified products aimed at ruralconsumers looking for basic nutritional needs such as iron, calcium,protein, etc.

7/23/2019 Food industry Analysis
http://slidepdf.com/reader/full/food-industry-analysis 116/290
Urbanization & Shifting Lifestyles› The increase in urbanisation has led to a demand for premium products
in this segment
› Shifting lifestyles of Indian people & the ongoing increase in the size ofIndia’s middle-class population is also driving demand
› Due to the paucity of time, consumers are looking at options where themeal can be prepared fast and is tasty as well
› Coupled with these, factors like an increasing number of working couplesand shortage of household help is also driving the sales
› Consumers’ dietary mix is changing with increased focus on international
food and reduced consumption of traditional food

7/23/2019 Food industry Analysis
http://slidepdf.com/reader/full/food-industry-analysis 117/290
Marketing Efforts› Leading multinational manufacturers have started using social media to
engage young consumers
› Examples of such products include sweet and savory snacks, sugarconfectionery, ice cream and snack bars etc.
› The increased reach of media channels such as television and Internet in
both urban and rural India is likely to help the growth of consumer goods’value sales over the forecast period
› Marketing efforts for brands such as Quaker and Kellogg’s heightenedawareness for the entire cereals category, while increased instances ofbreakfast buffets at restaurants led to growth in demand for hot cerealsas well.
Another factor which has led to robust growth is theincreasing prices of fresh food & vegetables, like onion, garlicand ginger
7/23/2019 Food industry Analysis
http://slidepdf.com/reader/full/food-industry-analysis 118/290
Indian consumers, particularly the youngerpopulation, are becoming more accepting ofdifferent food and drink products
There is increased demand for product variety, aswell as products from different countries
The number of imported food products isincreasing in retail stores. This trend is evident notonly in organised retail, but also in the small family-owned stores which dominate themarket.

7/23/2019 Food industry Analysis
http://slidepdf.com/reader/full/food-industry-analysis 119/290
Glocalisation is the localisation of globalised products orservices and has caused international food products to beadapted to suit Indian consumers
For example, McDonald’s in India provide vegetarian ratherthan beef burgers and pizza chains serve pizzas with Indiantoppings such as curry
This has resulted in greater acceptance and increased
demand for international food and beverage products inIndia

7/23/2019 Food industry Analysis
http://slidepdf.com/reader/full/food-industry-analysis 120/290
7/23/2019 Food industry Analysis
http://slidepdf.com/reader/full/food-industry-analysis 121/290

7/23/2019 Food industry Analysis
http://slidepdf.com/reader/full/food-industry-analysis 122/290
Demand for specialty and high valuefoods such as chocolates, almonds andother dried nuts, cakes and pastries,
imported fruits, fruit juices, and Indiansweets peaks during the festive season,especially at Deepawli (Diwali) - the
festival of lights

7/23/2019 Food industry Analysis
http://slidepdf.com/reader/full/food-industry-analysis 123/290
Changes in Retail Format› Growth in modern chained grocery retailing
› Supermarkets/hypermarkets have emerged as a key retail channel forpackaged food, as their share in overall retail sales increased by threepercentage points
› The expansion of chained grocery stores and increase in productofferings, such as more imported brands on retailers’ shelves has
contributed to the growth› There are also a growing number of specialist retailers in urban areas,
especially in shopping centers, which attract high-end consumers
› Their specialization with cold chains and associated product categoriesmakes these outlets a favorite among manufacturers looking to cater toselect urban consumers
Other factors expected to positively influence growth of driedprocessed food include the lower levels of regulationexpected in dried processed food and the increasingcultivation of rice

7/23/2019 Food industry Analysis
http://slidepdf.com/reader/full/food-industry-analysis 124/290
Efficient Back End infrastructure› The growth of cold chain infrastructure is likely to heighten the use of
frozen processed food, chilled processed food and non-traditional dairyproducts in India
› International manufacturers and domestic manufacturers with strongfinancial backing are expected to begin providing freezer displaycabinets to Indian grocery retailers in the near future in order toencourage them to stock their goods
FDI in retail› With government allowing 51% FDI in multi brand retail and 100% FDI in
single brand retail, International giants such as Wal-Mart & Carrefour are
coming in› With the arrival of these giants, there is immense scope of growth for new
segments in packaged food
› This also signals the arrival of more international giants and increasedversatility of products

7/23/2019 Food industry Analysis
http://slidepdf.com/reader/full/food-industry-analysis 125/290
7/23/2019 Food industry Analysis
http://slidepdf.com/reader/full/food-industry-analysis 126/290

7/23/2019 Food industry Analysis
http://slidepdf.com/reader/full/food-industry-analysis 127/290
Superior processing technology to compete with otherplayers in the market› The players in the market need to possess the latest technology
in order to compete and face the price sensitive audience
Brand building and marketing to gain market share;increasing penetration in domestic market; competitivepricing› With a mixed set of organised and unorganised players in the
market, there is a strong need for brand building and marketingto generate the required reach
› The market is majorly price sensitive further adding to therequirement of competitive pricing
› There is a constant effort to penetrate into the remotest of theareas to increase the presence

7/23/2019 Food industry Analysis
http://slidepdf.com/reader/full/food-industry-analysis 128/290
M&As, New entrants, Exits
7/23/2019 Food industry Analysis
http://slidepdf.com/reader/full/food-industry-analysis 129/290
During September 2011, US-based McCormick & Co Inccompleted the formation of a joint venture with KohinoorFoods Ltd for the marketing and distribution of basmati riceand various other packaged food products in India
McCormick invested a total of INR5.2 billion (US$113 million) inthis transaction, which involves McCormick taking an 85%stake in the new joint venture
Total revenues achieved by the company’s new joint ventureare expected to be in the region of US$85 million during its firstyear of operation.
7/23/2019 Food industry Analysis
http://slidepdf.com/reader/full/food-industry-analysis 130/290
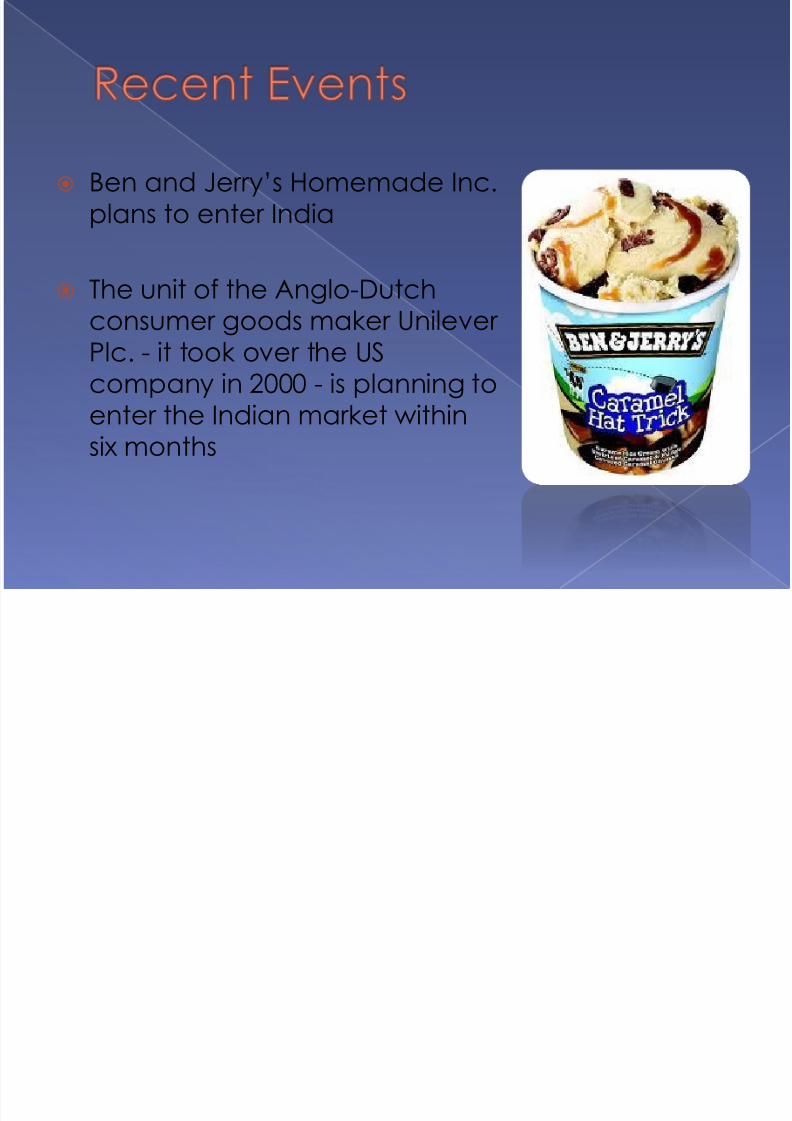
Ben and Jerry’s Homemade Inc.plans to enter India
The unit of the Anglo-Dutchconsumer goods maker UnileverPlc. - it took over the UScompany in 2000 - is planning toenter the Indian market withinsix months

7/23/2019 Food industry Analysis
http://slidepdf.com/reader/full/food-industry-analysis 131/290
Danone entered India to seek potential growth for itsproducts.
The 15 years of learning Indian market allowed Danone to
change from its diversification strategy to being focused in itsBusiness line.
Danone BOP (Base Of Pyramid) India is charged withdeveloping and marketing products to lower income
consumers in smaller towns such as Gurgaon, Faridabad,Panipat, Sonepat and Ambala, before gradually moving toother parts of the country.

7/23/2019 Food industry Analysis
http://slidepdf.com/reader/full/food-industry-analysis 132/290

7/23/2019 Food industry Analysis
http://slidepdf.com/reader/full/food-industry-analysis 133/290

7/23/2019 Food industry Analysis
http://slidepdf.com/reader/full/food-industry-analysis 134/290
Britannia Industries acquires the entire stake of Fonterra, thecompany’s joint venture partner since 2002 in Britannia NewZealand Foods Pvt. Ltd, which is engaged in the dairybusiness.
Britannia Industries entered into an agreement with Fonterra
Brands (Mauritius Holding) Ltd, Mauritius, for acquiring thelatter’s 49 per cent equity and preference shareholding inBritannia New Zealand Foods Pvt. Ltd (BNZF).

7/23/2019 Food industry Analysis
http://slidepdf.com/reader/full/food-industry-analysis 135/290

7/23/2019 Food industry Analysis
http://slidepdf.com/reader/full/food-industry-analysis 136/290
India continued to experience inflation in 2011
In particular, food and oil prices surged in the first half of the year,although the pace of inflation slowed down in the later months
Many packaged food manufacturers reported that rising input costsput pressure on profit margins, and they either had to raise prices ormanage costs more closely
Players in the mass segment also launched low-price variants of
premium products to fatten profit margins
Inflation also reduced consumer spending power. In particular,consumers in the low-income segment were forced to reducespending on non-essential items.
7/23/2019 Food industry Analysis
http://slidepdf.com/reader/full/food-industry-analysis 137/290

7/23/2019 Food industry Analysis
http://slidepdf.com/reader/full/food-industry-analysis 138/290

7/23/2019 Food industry Analysis
http://slidepdf.com/reader/full/food-industry-analysis 139/290
Some manufacturers were reluctant to increaseprice too much for fear of losing customers tocompetitors
These manufacturers looked into more stringentcost controls
Examples included ITC Ltd’s efforts to improveproduction efficiency and Hindustan Unilever Ltd’sefforts to reduce packaging costs.
7/23/2019 Food industry Analysis
http://slidepdf.com/reader/full/food-industry-analysis 140/290

7/23/2019 Food industry Analysis
http://slidepdf.com/reader/full/food-industry-analysis 141/290
Prices of certain food, such as milk and edible oils, remain apotential problem area for inflation
Uncertainties in the global economy are limiting the outlook forexport
Packaged food value sales in North India are projected to see aconstant value CAGR of close to 9% over the forecast period,marginally slower than the national average
The key growth driver will be growing demand for higher qualityproducts (for example richer chocolate, premium offerings, healthierproducts) and the switch from the unorganized segment to theorganized segment due to increases in consumers’ disposableincomes.

7/23/2019 Food industry Analysis
http://slidepdf.com/reader/full/food-industry-analysis 142/290
In response to volatility in commodity prices, manufacturers willcontinue to watch costs closely
Given the forecast slowdown in the economy, consumersentiment may weaken, and manufacturers will be unwilling toraise prices
Leading manufacturers may live with narrow margins and drivevolume sales instead, or they may reduce pack size whilemaintaining same price points
Private label products are not expected to see dynamic growthover the forecast period› This is because margins are very narrow and retailers will not be able
to price private label products much lower than leadingmanufacturers such as ITC
7/23/2019 Food industry Analysis
http://slidepdf.com/reader/full/food-industry-analysis 143/290
Due to urban consumers’ desire for a higher quality of living,premium offerings in packaged food are less likely to beaffected by changes in the economic situation
Hence, manufacturers whose portfolio includes establishedbrands and premium products are expected to perform wellover the forecast period
Small manufacturers will see reductions in value share, as they
have less scale to cushion the impact of high input costs andsoftening consumer demand

7/23/2019 Food industry Analysis
http://slidepdf.com/reader/full/food-industry-analysis 144/290
Segmental Analysis

7/23/2019 Food industry Analysis
http://slidepdf.com/reader/full/food-industry-analysis 145/290
The Drinks Industry is divided into the followingsegments –
1) Soft Drinks:
This segment includes – Bottled Water
Carbonates
Concentrates
Fruit/Vegetable Juices
Ready to Drink (RTD) Coffee
RTD Tea
7/23/2019 Food industry Analysis
http://slidepdf.com/reader/full/food-industry-analysis 146/290
2) Hot Drinks:This segment includes – Tea Coffee Other Hot Drinks
3) Alcoholic BeveragesThis segment includes – Spirits Beer Wine

7/23/2019 Food industry Analysis
http://slidepdf.com/reader/full/food-industry-analysis 147/290

7/23/2019 Food industry Analysis
http://slidepdf.com/reader/full/food-industry-analysis 148/290

7/23/2019 Food industry Analysis
http://slidepdf.com/reader/full/food-industry-analysis 149/290
Fruit/vegetable juice outshines carbonates in terms ofgrowth as beverage companies continuing to invest indiversification away from carbonated beverages and intohealthier sub-sectors
The Indian juice market is a very attractive proposition for juice producers, but the market remains fairly immature.
This immaturity can be linked on the supply side to the highcosts of juice concentrates, transportation and packagingmaterials filter through to higher prices on packaged juice
products, leaving packaged juice producers in a weakerposition to compete against the price-competitiveinformal juice producers
RTD formats becoming popular due to convenience

7/23/2019 Food industry Analysis
http://slidepdf.com/reader/full/food-industry-analysis 150/290
7/23/2019 Food industry Analysis
http://slidepdf.com/reader/full/food-industry-analysis 151/290
Hot Drinks:
Success of retail chains leads to robust growth within hot drinks
Child-specific and female-specific other hot drinks drive volumesales
Hindustan Unilever and GlaxoSmithKline battle for leadership ridingon the popularity of the popularity of brands like Brooke Bond, Bruand Horlicks
Specialty teas and green tea still new but increasingly accepted
Fortified hot drinks still used by manufacturers to enhance productofferings

7/23/2019 Food industry Analysis
http://slidepdf.com/reader/full/food-industry-analysis 152/290
Tea sales growth for 2011 = +6.1% in local currency terms;compound annual average growth to 2015 = +6.7%
Point sales are forecast to reach a value of INR242.8bn(US$6.2bn)
Growth forecasts in the tea sector indicates a maturemarket
Green tea gaining popularity in urban India
Mature tea market prompting local tea manufacturers tolook abroad to specialty tea markets in UK and US

7/23/2019 Food industry Analysis
http://slidepdf.com/reader/full/food-industry-analysis 153/290
Coffee sales growth for 2011 = +10.6% in localcurrency terms; compound annual averagegrowth to 2015 = +11.6%
Point sales to reach INR52.9bn (US$1.3bn)
Growth rates and forecasts indicate a muchless saturated market and continued industrydynamism
The rapidly expanding middle class isembracing café culture

7/23/2019 Food industry Analysis
http://slidepdf.com/reader/full/food-industry-analysis 154/290

7/23/2019 Food industry Analysis
http://slidepdf.com/reader/full/food-industry-analysis 155/290
7/23/2019 Food industry Analysis
http://slidepdf.com/reader/full/food-industry-analysis 156/290

7/23/2019 Food industry Analysis
http://slidepdf.com/reader/full/food-industry-analysis 157/290

7/23/2019 Food industry Analysis
http://slidepdf.com/reader/full/food-industry-analysis 158/290

7/23/2019 Food industry Analysis
http://slidepdf.com/reader/full/food-industry-analysis 159/290

7/23/2019 Food industry Analysis
http://slidepdf.com/reader/full/food-industry-analysis 160/290
The changes in each segment can besummarized graphically as follows

7/23/2019 Food industry Analysis
http://slidepdf.com/reader/full/food-industry-analysis 161/290

7/23/2019 Food industry Analysis
http://slidepdf.com/reader/full/food-industry-analysis 162/290

7/23/2019 Food industry Analysis
http://slidepdf.com/reader/full/food-industry-analysis 163/290

7/23/2019 Food industry Analysis
http://slidepdf.com/reader/full/food-industry-analysis 164/290
7/23/2019 Food industry Analysis
http://slidepdf.com/reader/full/food-industry-analysis 165/290
The Growth drivers vary in each category within each segment. Theycan be listed as follows –
Soft Drinks: Supermarkets and hypermarkets accounted for a combined 9%
share of total volume sales in 2011
Manufacturers can showcase their new variants to capture newconsumers and enable them to understand the options. Thischannel is helping to facilitate the growth of soft drinks
Soft drinks players look towards supermarkets and hypermarketsas ideal channels to cater to the young, fashionable andrelatively wealthy consumer segments
This trend reflects the rise in disposable incomes available to theworking population of India
7/23/2019 Food industry Analysis
http://slidepdf.com/reader/full/food-industry-analysis 166/290
The real driver of growth to 2015 and beyond will be theincreased interest in the non-carbonated, healthy drinkscategory.
Sales of fruit juices and bottled waters are expected to
soar – a consequence of growing consumer interest inhealthy living but also thanks to the promotional, productlaunch and marketing efforts of the industry’s majorplayers, with sales of these higher-priced, higher-profit-margin products much greater contributors to financialperformance than carbonates.
Growth in the soft drinks sector will be supported bycontinued investment from the industry’s leadingplayers – namely US multinationals The Coca-ColaCompany and PepsiCo

7/23/2019 Food industry Analysis
http://slidepdf.com/reader/full/food-industry-analysis 167/290

7/23/2019 Food industry Analysis
http://slidepdf.com/reader/full/food-industry-analysis 168/290

7/23/2019 Food industry Analysis
http://slidepdf.com/reader/full/food-industry-analysis 169/290

7/23/2019 Food industry Analysis
http://slidepdf.com/reader/full/food-industry-analysis 170/290

7/23/2019 Food industry Analysis
http://slidepdf.com/reader/full/food-industry-analysis 171/290
Rising income would encourage the spread of wine consumptionacross India’s secondary and tertiary cities, with the Indian states ofKarnataka, Andhra Pradesh, Orissa, Chhattisgarh and Jharkhandrepresenting the strongest medium- to long-term opportunities
With dynamics such as the maturation of India’s youth population,rising purchasing power, greater exposure to Western influences andgrowing health awareness favouring growth of the domestic winemarket, wine has been steadily increasing its market share againstthe other alcoholic beverages
The strong growth in affluence and a rapid change in socialpatterns and lifestyles provide a strong impetus to international beersales

7/23/2019 Food industry Analysis
http://slidepdf.com/reader/full/food-industry-analysis 172/290
7/23/2019 Food industry Analysis
http://slidepdf.com/reader/full/food-industry-analysis 173/290

7/23/2019 Food industry Analysis
http://slidepdf.com/reader/full/food-industry-analysis 174/290
7/23/2019 Food industry Analysis
http://slidepdf.com/reader/full/food-industry-analysis 175/290

7/23/2019 Food industry Analysis
http://slidepdf.com/reader/full/food-industry-analysis 176/290

7/23/2019 Food industry Analysis
http://slidepdf.com/reader/full/food-industry-analysis 177/290

7/23/2019 Food industry Analysis
http://slidepdf.com/reader/full/food-industry-analysis 178/290

7/23/2019 Food industry Analysis
http://slidepdf.com/reader/full/food-industry-analysis 179/290
7/23/2019 Food industry Analysis
http://slidepdf.com/reader/full/food-industry-analysis 180/290

7/23/2019 Food industry Analysis
http://slidepdf.com/reader/full/food-industry-analysis 181/290

7/23/2019 Food industry Analysis
http://slidepdf.com/reader/full/food-industry-analysis 182/290

7/23/2019 Food industry Analysis
http://slidepdf.com/reader/full/food-industry-analysis 183/290
7/23/2019 Food industry Analysis
http://slidepdf.com/reader/full/food-industry-analysis 184/290
7/23/2019 Food industry Analysis
http://slidepdf.com/reader/full/food-industry-analysis 185/290

7/23/2019 Food industry Analysis
http://slidepdf.com/reader/full/food-industry-analysis 186/290

7/23/2019 Food industry Analysis
http://slidepdf.com/reader/full/food-industry-analysis 187/290

7/23/2019 Food industry Analysis
http://slidepdf.com/reader/full/food-industry-analysis 188/290

7/23/2019 Food industry Analysis
http://slidepdf.com/reader/full/food-industry-analysis 189/290

7/23/2019 Food industry Analysis
http://slidepdf.com/reader/full/food-industry-analysis 190/290

7/23/2019 Food industry Analysis
http://slidepdf.com/reader/full/food-industry-analysis 191/290
7/23/2019 Food industry Analysis
http://slidepdf.com/reader/full/food-industry-analysis 192/290

7/23/2019 Food industry Analysis
http://slidepdf.com/reader/full/food-industry-analysis 193/290

7/23/2019 Food industry Analysis
http://slidepdf.com/reader/full/food-industry-analysis 194/290

7/23/2019 Food industry Analysis
http://slidepdf.com/reader/full/food-industry-analysis 195/290
Food – convenience & various Beverages – Hot Drinks
Annapurna – Atta, Salt Brooke Bond Red label
Kissan – Jam, Ketchup, Squashes Brooke Bond 3 Roses
Knorr – noodles, soups Brooke Bond Taaza
Kwality Wall’s – ice cream Brooke Bond Taj Mahal
Modern Bread Bru – coffee
Lipton – Tea

7/23/2019 Food industry Analysis
http://slidepdf.com/reader/full/food-industry-analysis 196/290

7/23/2019 Food industry Analysis
http://slidepdf.com/reader/full/food-industry-analysis 197/290

7/23/2019 Food industry Analysis
http://slidepdf.com/reader/full/food-industry-analysis 198/290

7/23/2019 Food industry Analysis
http://slidepdf.com/reader/full/food-industry-analysis 199/290

7/23/2019 Food industry Analysis
http://slidepdf.com/reader/full/food-industry-analysis 200/290
HUL is also in a better position than industry players activeonly in a single product category to mitigate their exposure tocommodity price volatility, given their wider range of inputsand product offerings.
So though it is exposed to a greater variety of potentiallyvolatile input costs, the company is not completely exposedto sharp price movements for a single input and this offsetsthe direct impact of commodity price movements
HUL’s price hikes to protect its profit margins and boost valuegrowth, further price increase could frustrate its efforts toreach the rural consumer base given that majority of theIndian population still falls into the lower-income bracket andare unlikely to be able to afford the substantial price increase

7/23/2019 Food industry Analysis
http://slidepdf.com/reader/full/food-industry-analysis 201/290

7/23/2019 Food industry Analysis
http://slidepdf.com/reader/full/food-industry-analysis 202/290
Coca-Cola India, the local subsidiary of USsoft drinks giant The Coca-Cola Company
Market leader in India’s soft drinks industry. Itoperates across all soft drinks sectors in the
country, including carbonated soft drinks,fruit juices, energy drinks and bottled water

7/23/2019 Food industry Analysis
http://slidepdf.com/reader/full/food-industry-analysis 203/290
35
Coca-Cola

7/23/2019 Food industry Analysis
http://slidepdf.com/reader/full/food-industry-analysis 204/290
28
29
30
31
32
33
34
35
2007 2008 2009 2010 2011 2012
Coca-Cola
Turnover in Rs million
Production (Volume in million

7/23/2019 Food industry Analysis
http://slidepdf.com/reader/full/food-industry-analysis 205/290
Production (Volume in million
litres)
23
23.5
24
24.5
25
25.5
26
2007 2008 2009 2010 2011 2012
Coca-Cola
Coca-Cola

7/23/2019 Food industry Analysis
http://slidepdf.com/reader/full/food-industry-analysis 206/290
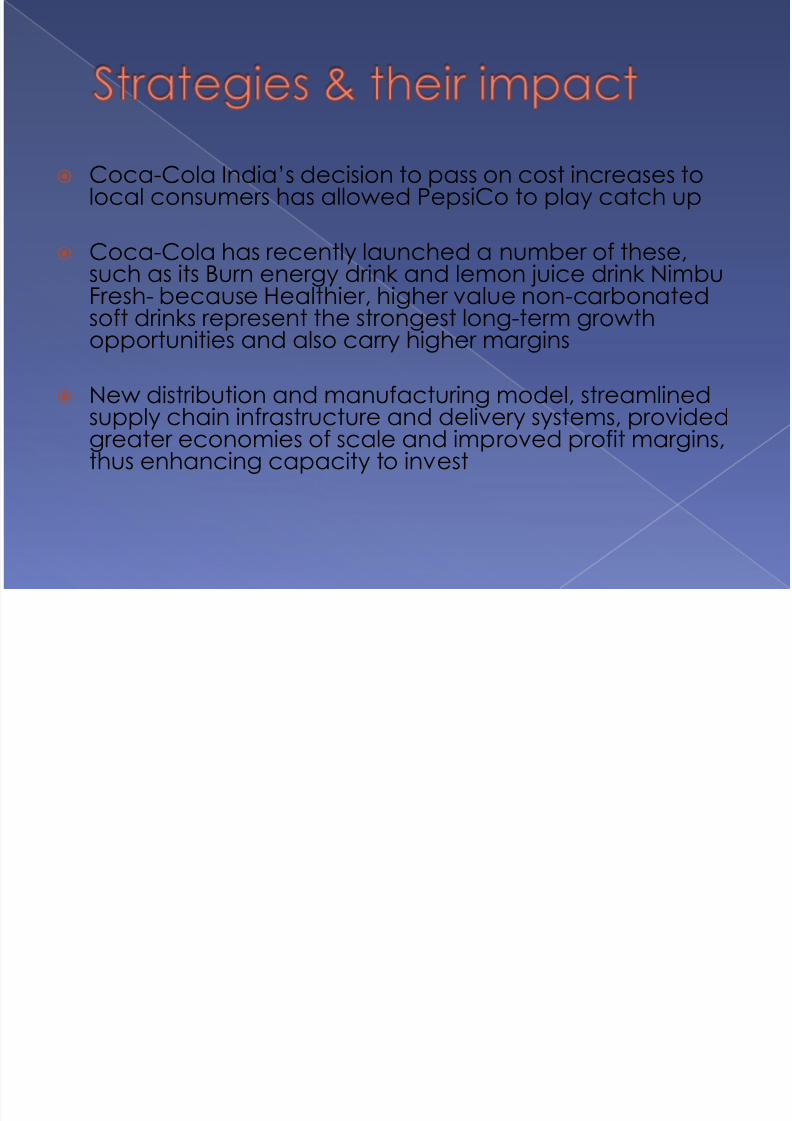
7/23/2019 Food industry Analysis
http://slidepdf.com/reader/full/food-industry-analysis 207/290
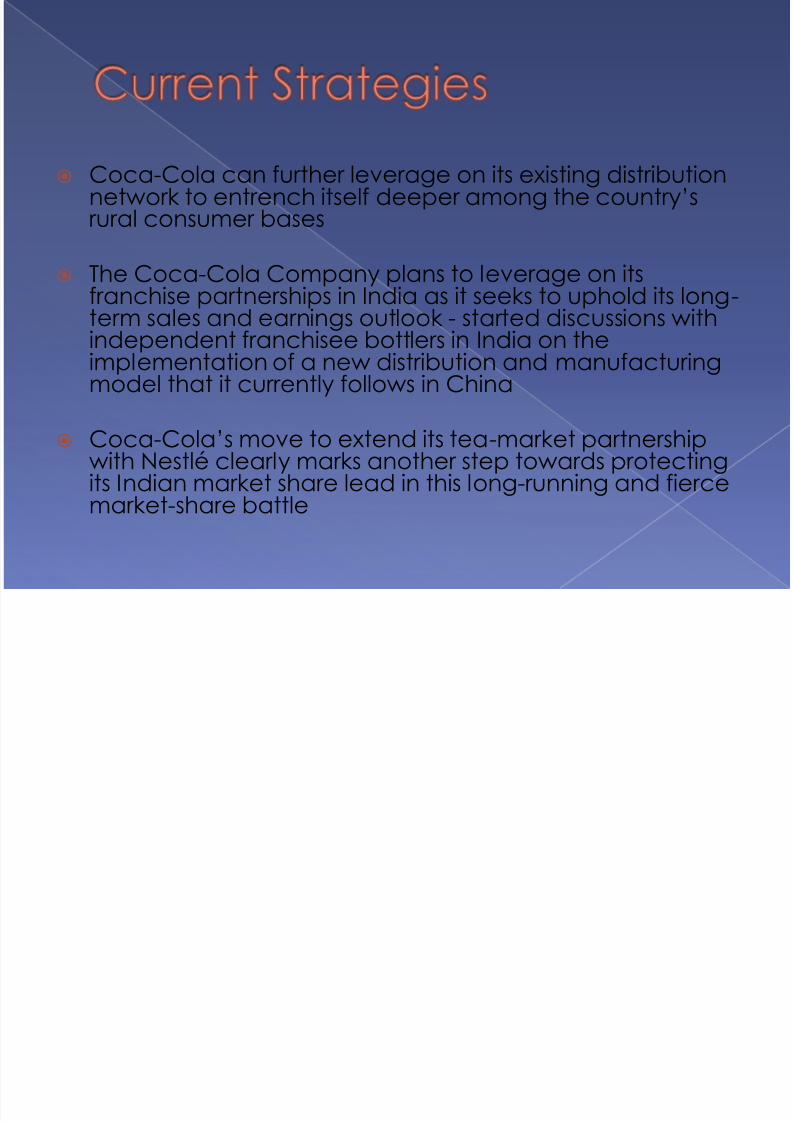
7/23/2019 Food industry Analysis
http://slidepdf.com/reader/full/food-industry-analysis 208/290

7/23/2019 Food industry Analysis
http://slidepdf.com/reader/full/food-industry-analysis 209/290

7/23/2019 Food industry Analysis
http://slidepdf.com/reader/full/food-industry-analysis 210/290
Amul Dairy is one of India’s largest food companies andone of the country’s best-known brands.
Jointly owned by an estimated 2.8 million milk producers,the company produces spreads, cheeses, UHT milk, milkpowder, fresh milk, curd and ice cream
It has been pursuing diversification into the confectionery,beverages and snack foods sub-sectors in recent years.
Amul also has a growing export business, with key marketsat present including Singapore, the US and the Gulfcountries.

7/23/2019 Food industry Analysis
http://slidepdf.com/reader/full/food-industry-analysis 211/290
Year Sales (INR, bn) Turnover (INR,)
Growth(%)
Growth

7/23/2019 Food industry Analysis
http://slidepdf.com/reader/full/food-industry-analysis 212/290
mn)
2010 80 80,053.6 52.2
2009 52.6 67,113.1 22.9
Product Type Retail value share(%) Rank
Confectionery 1.2 11
Dairy 14.6 1
Ice cream 36.3 1
Oils and Fats 10.8 2
Competitive Position, 2010, Foods
7/23/2019 Food industry Analysis
http://slidepdf.com/reader/full/food-industry-analysis 213/290
India’s biggest dairy recording anincrease in 20% of turnover from previousyear (2010-11)
Farmers in Gujarat are rejoicing over a 58per cent increase in their milk prices overthe last three years at a time when their
counterparts in other States werestruggling to make their milk businessviable in the absence of good returns

7/23/2019 Food industry Analysis
http://slidepdf.com/reader/full/food-industry-analysis 214/290

7/23/2019 Food industry Analysis
http://slidepdf.com/reader/full/food-industry-analysis 215/290
In 2011-12, 965 new Amul Parlours havebeen added, taking the total strength to6,315. Apart from the 170 parlours at
railway stations and 303 operating atvarious centres of excellence, Amul alsohas 600 air-conditioned ice-creamscooping parlours, making it the largest
single brand retail in the country

7/23/2019 Food industry Analysis
http://slidepdf.com/reader/full/food-industry-analysis 216/290
Members 13 cooperative milk producers
No of producer members 3.03 million
Procurement

7/23/2019 Food industry Analysis
http://slidepdf.com/reader/full/food-industry-analysis 217/290
No of village societies 15,712Total milk handling capacity 13.67 million litres per day
Milk collection (2010-11) 3.45 billion litres
Milk collection (daily avg) 9.2 million litres
Milk Drying Capacity 647 Mts per day
Cattle feed manufacturingcapacity
3690 Mts per day

7/23/2019 Food industry Analysis
http://slidepdf.com/reader/full/food-industry-analysis 218/290
Product diversification has been integral toAmul’s growth strategy in recent years
Entry into export markets – reduced Amul’s
reliance on the intensely price-sensitive marketof India
Invested in development of its distributionnetwork to enhance distribution efficiency and
increase sales opportunities – was essential andis important due to the perishable nature of thedairy products

7/23/2019 Food industry Analysis
http://slidepdf.com/reader/full/food-industry-analysis 219/290
The company will elevate its milk procurement andsupply chain capacities in order to sustain increasingdemand for branded milk and milk products.Employing a 2-pronged approach, it is likely toconcentrate on expanding its retail reach into ruraland semi-urban India on one hand, and introducingvalue-added dairy based products for urbanconsumers on the other.
Its recent venturing into ice parlour business – investment in new product development in new sub-
sectors to improve chances of poaching marketshare from its competitors

7/23/2019 Food industry Analysis
http://slidepdf.com/reader/full/food-industry-analysis 220/290
Expanding in the high-value sectors to tap on thegrowing affluence among India’s middle classes
Like its rivals, Amul is now struggling in the face ofelevated sugar, cocoa and milk prices – although
being a cooperative and buying directly from itsmembers, it is arguably more immune to rising milkprices than most
Growing importance of exports markets following the
company’s recent decision to implement anaggressive pricing approach that will keep prices in anumber of categories at their current levels.

7/23/2019 Food industry Analysis
http://slidepdf.com/reader/full/food-industry-analysis 221/290

7/23/2019 Food industry Analysis
http://slidepdf.com/reader/full/food-industry-analysis 222/290
Food – Snacks (Frito Lay India) Beverages – Soft Drinks

7/23/2019 Food industry Analysis
http://slidepdf.com/reader/full/food-industry-analysis 223/290
( y ) g
Aliva Pepsi & Diet Pepsi
Cheetos 7 UP
Kurkure Aquafina – drinking water
Lay’s Duke’s - soda
Lehar Namkeen Gatorade – sports drink
Quaker Oats Mirinda
Uncle Chips Mountain Dew
Nimbooz
SliceTropicana & Tropicana 100%- juices
PepsiCo Inc

7/23/2019 Food industry Analysis
http://slidepdf.com/reader/full/food-industry-analysis 224/290
22
22.5
23
23.5
24
24.5
25
25.5
26
26.5
2727.5
2007 2008 2009 2010 2011 2012
PepsiCo Inc
Turnover in Rs million
Production (Volume in million litres)
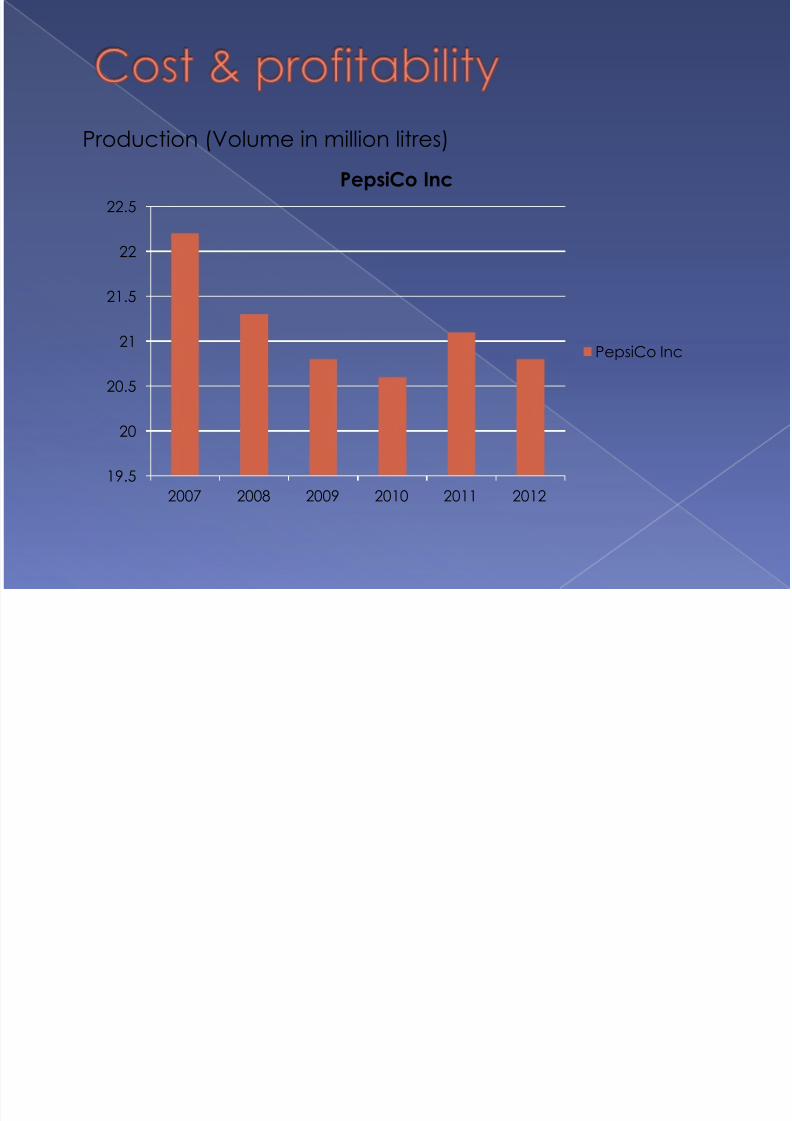
7/23/2019 Food industry Analysis
http://slidepdf.com/reader/full/food-industry-analysis 225/290
19.5
20
20.5
21
21.5
22
22.5
2007 2008 2009 2010 2011 2012
PepsiCo Inc
PepsiCo Inc

7/23/2019 Food industry Analysis
http://slidepdf.com/reader/full/food-industry-analysis 226/290
As part of extensive repositioning of its food & drinksportfolio, PepsiCo’s Frito-Lay plans to launch more than 50new products as it invests in scale and innovation toconsolidate its leading position in the country’s snackmarket
PepsiCo India continues to invest heavily in India, both toprevent Coca-Cola from building on its existing lead andto prevent smaller market players from threatening thedominance of the big two.
Capacity expansions at existing sites and new greenfieldfacilities are a priority, while greater investment in supplychain efficiency, market infrastructure (ie coolers andshelving units) and research and development are alsokey elements of its expansion strategy
7/23/2019 Food industry Analysis
http://slidepdf.com/reader/full/food-industry-analysis 227/290
PepsiCo India’s joint venture with Tata Tea(April 2010), gave access to a vastdistribution network and a strong localbrand name
Piloted the launch of cookies under theQuaker Oats brand› Being a relative latecomer to the Indian biscuits
market (PepsiCo launched its first biscuits brand
Aliva in the country in June 2009), PepsiCo couldface hurdles in building a significant marketfoothold against stiff competition from domesticand multinational confectioners

7/23/2019 Food industry Analysis
http://slidepdf.com/reader/full/food-industry-analysis 228/290
Future Trends

7/23/2019 Food industry Analysis
http://slidepdf.com/reader/full/food-industry-analysis 229/290

7/23/2019 Food industry Analysis
http://slidepdf.com/reader/full/food-industry-analysis 230/290

7/23/2019 Food industry Analysis
http://slidepdf.com/reader/full/food-industry-analysis 231/290

7/23/2019 Food industry Analysis
http://slidepdf.com/reader/full/food-industry-analysis 232/290

7/23/2019 Food industry Analysis
http://slidepdf.com/reader/full/food-industry-analysis 233/290

7/23/2019 Food industry Analysis
http://slidepdf.com/reader/full/food-industry-analysis 234/290

7/23/2019 Food industry Analysis
http://slidepdf.com/reader/full/food-industry-analysis 235/290
Exports growth – 13.7% , Compounded annualgrowth rate till 2015 – 16.2%
Imports growth – 12.1%, Compound growth rate till
2015 – 14.3%
Short term perspective for growth in trade looksbearish
Major challenges include underdevelopedproduction, harvesting and storage infrastructure.

7/23/2019 Food industry Analysis
http://slidepdf.com/reader/full/food-industry-analysis 236/290
Demand among a population with risingpurchasing power will contribute to theneed for more foreign-sourced products.
In particular, Westernised consumptionhabits and the need for ingredients not
widely produced on a local level willstimulate imports.

7/23/2019 Food industry Analysis
http://slidepdf.com/reader/full/food-industry-analysis 237/290
7/23/2019 Food industry Analysis
http://slidepdf.com/reader/full/food-industry-analysis 238/290

7/23/2019 Food industry Analysis
http://slidepdf.com/reader/full/food-industry-analysis 239/290

7/23/2019 Food industry Analysis
http://slidepdf.com/reader/full/food-industry-analysis 240/290
• Government’s recent hiking of diesel and petrolare also likely to put pressure on headlineinflation
• Pepsi Co’s recent outperformance to Coca – Cola India further reflects the heightened pricesensitivity of local consumers which has beendue to Pepsi Co’s willingness to absorb bulk of its
higher input cost.

7/23/2019 Food industry Analysis
http://slidepdf.com/reader/full/food-industry-analysis 241/290
India has a young and rapidly growing population ofmore than 1.2 billion.

7/23/2019 Food industry Analysis
http://slidepdf.com/reader/full/food-industry-analysis 242/290
As youth climbs up the income ranks, opportunitiespresented by the mass market catches the eye.
P & G’s focus on expanding its mass market portfolio istestimony to this view.
P & G plans to enter into new product categories such
as mass skincare products, hair oils and toothpaste in abid to leverage on the stronger rewards in this segment.
7/23/2019 Food industry Analysis
http://slidepdf.com/reader/full/food-industry-analysis 243/290
FDI will bring about positive spill over effects to theother consumer – facing sector in the industry.
The spread of organized retail would improve the
visibility of consumer products and facilitate thedistribution of products to local consumers
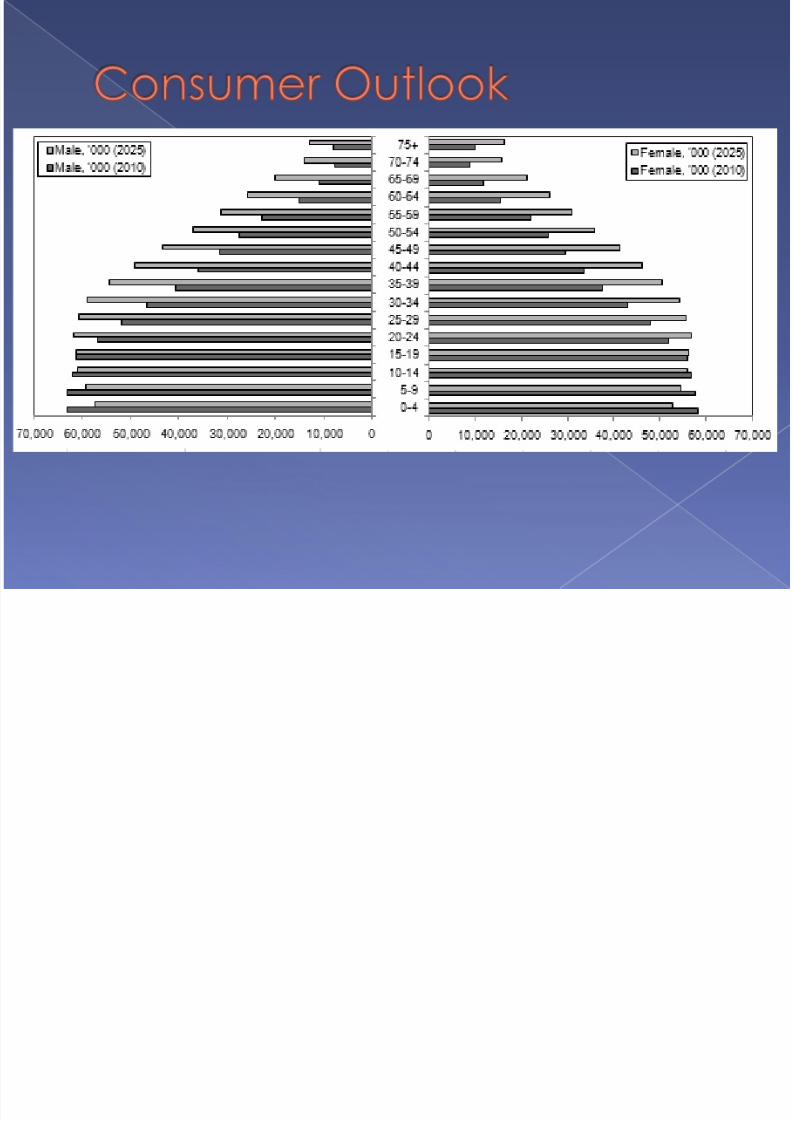
7/23/2019 Food industry Analysis
http://slidepdf.com/reader/full/food-industry-analysis 244/290

7/23/2019 Food industry Analysis
http://slidepdf.com/reader/full/food-industry-analysis 245/290
7/23/2019 Food industry Analysis
http://slidepdf.com/reader/full/food-industry-analysis 246/290
A th f k t i C f ti B d F

7/23/2019 Food industry Analysis
http://slidepdf.com/reader/full/food-industry-analysis 247/290
Among the four key segments, i.e., Confectionary, Bread, Funfood and Snack, and Food Juices and Concentrates; thehighest growth has been seen in the bread segment and theexpected demand in 2014-15 for bread is Rs 26.90 billion.
Food consumption growth rate 5.9%, compounded annualgrowth rate till 2015 = 7%
Per capita food consumption growth rate 3.3% andcompounded annual average growth rate 5.6%
Change of consumption habits over long term due to highdisposable income will lift up consumers ability to trade upexpensive stuff and non – essential purchases.
Th t il i d t i t d t h l

7/23/2019 Food industry Analysis
http://slidepdf.com/reader/full/food-industry-analysis 248/290
The mass grocery retail industry is expected to helpdrive up food consumption by presentingconsumers with wider range of higher-valueproducts
A dynamic industry should fuel competition whichwould in turn heighten marketing and promotionalspending as well as drive down the price of non –
essential items.
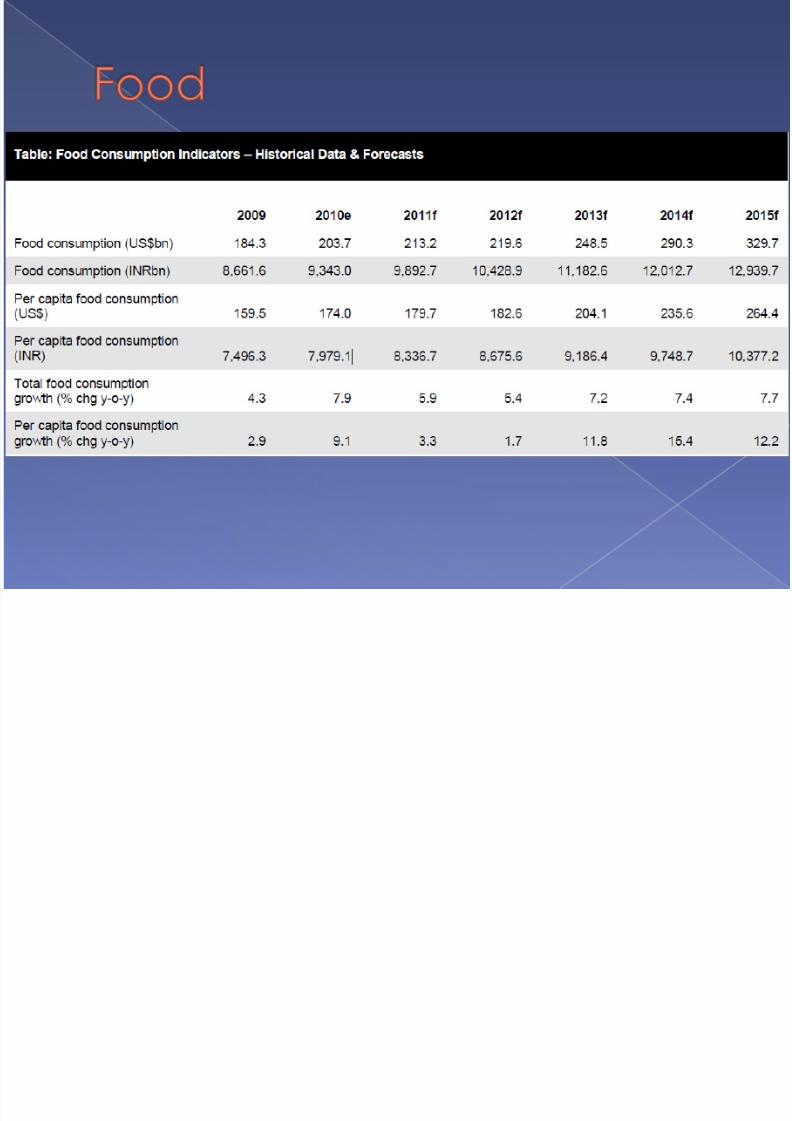
7/23/2019 Food industry Analysis
http://slidepdf.com/reader/full/food-industry-analysis 249/290

7/23/2019 Food industry Analysis
http://slidepdf.com/reader/full/food-industry-analysis 250/290
C f ti l l th 7 2 %

7/23/2019 Food industry Analysis
http://slidepdf.com/reader/full/food-industry-analysis 251/290
Confectionary volume sales growth – 7.2 % .Compound annual average growth rate till 2015 – 7.9%
Confectionary Sales value – 5.9% Compoundedannual growth rate till 2015 – 8.1%
Chocolate is expected to outperform its
counterparts with compounded annual growthrate of 10.3% till 2015
R id i th i i di bl
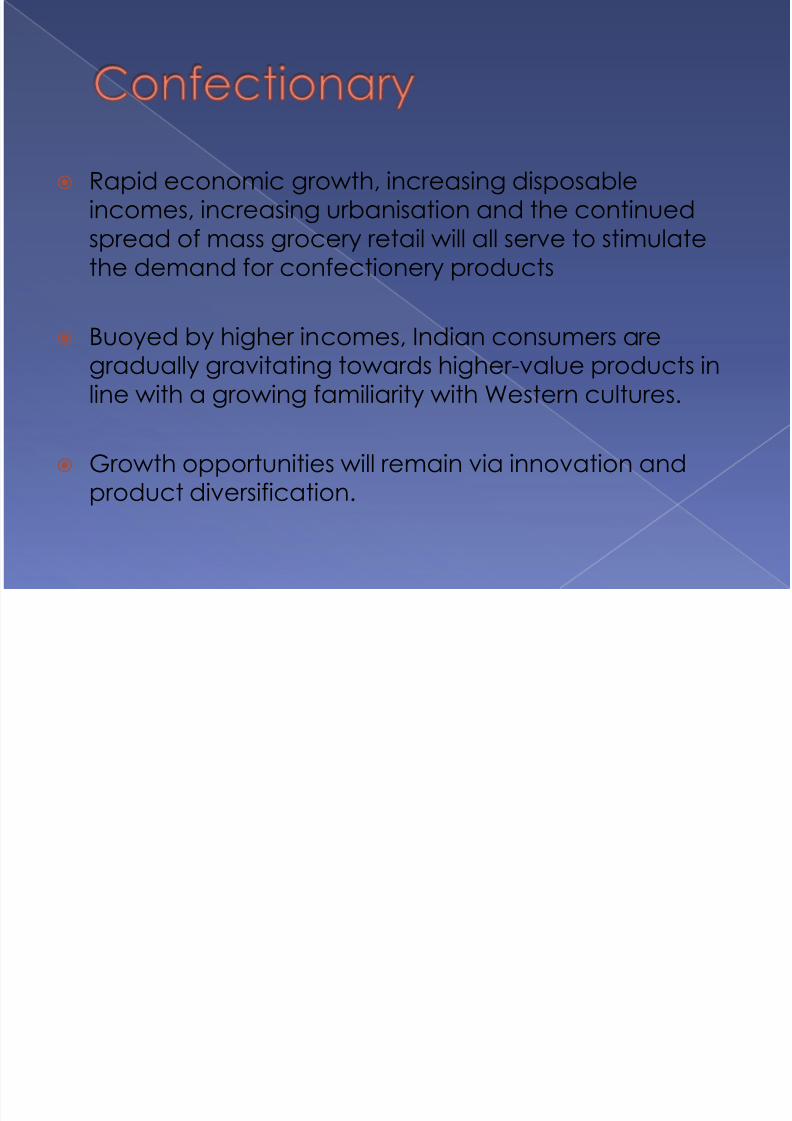
7/23/2019 Food industry Analysis
http://slidepdf.com/reader/full/food-industry-analysis 252/290
Rapid economic growth, increasing disposableincomes, increasing urbanisation and the continuedspread of mass grocery retail will all serve to stimulatethe demand for confectionery products
Buoyed by higher incomes, Indian consumers aregradually gravitating towards higher-value products inline with a growing familiarity with Western cultures.
Growth opportunities will remain via innovation andproduct diversification.
M f t h t t i I di

7/23/2019 Food industry Analysis
http://slidepdf.com/reader/full/food-industry-analysis 253/290
Manufcaturers have to capture unique Indiantastes and preferences.
A recent trend noticed is the nationalisation of
confectionary brands as local confectioners rollout their regional brands
Parle Products launched Top biscuits brand in West
Bengal and Assam to compete with SAJ FoodProducts
Parle Dabur India ITC Foods and Emami are already

7/23/2019 Food industry Analysis
http://slidepdf.com/reader/full/food-industry-analysis 254/290
Parle, Dabur India, ITC Foods and Emami are alreadyenjoying success from the launch of their regional brandsacross the country
Another distinct trend is Indian confectionary sector is
strengthening focus on healthy product offerings.
Britannia sharpen its focus on diabetic-friendly products andKellogs repositioning its brand as tastier and healthier.
Dunkin Donuts plans to set up 25 – 30 stores with the first yearof its partnership

7/23/2019 Food industry Analysis
http://slidepdf.com/reader/full/food-industry-analysis 255/290

7/23/2019 Food industry Analysis
http://slidepdf.com/reader/full/food-industry-analysis 256/290

7/23/2019 Food industry Analysis
http://slidepdf.com/reader/full/food-industry-analysis 257/290
Coffee growth at 10 6% and compounded annual

7/23/2019 Food industry Analysis
http://slidepdf.com/reader/full/food-industry-analysis 258/290
Coffee growth at 10.6% and compounded annualgrowth rate to 2015 – 11.6%
Tea growth at 6.1% and compounded annual
growth rate to 2015 – 6.7%
The Indian tea sector remains fairly mature, giventhe presence of major tea manufacturers such as
Tata Tea and Apeejay
Due to the maturity in the sector it is prompting

7/23/2019 Food industry Analysis
http://slidepdf.com/reader/full/food-industry-analysis 259/290
Due to the maturity in the sector, it is promptinglocal tea manufacturers to look abroad for futuregrowth opportunities, with special focus on US andUK
The outlook for the Indian coffee sector is muchmore attractive as a result of lower levels of marketsaturation and continued industry dynamism
Fresh & Honest’s recent espresso partnership withIlly and the entrance of Starbucks show a cleartrend towards premiumisation of the industry
With this in mind existing coffee players are clearly
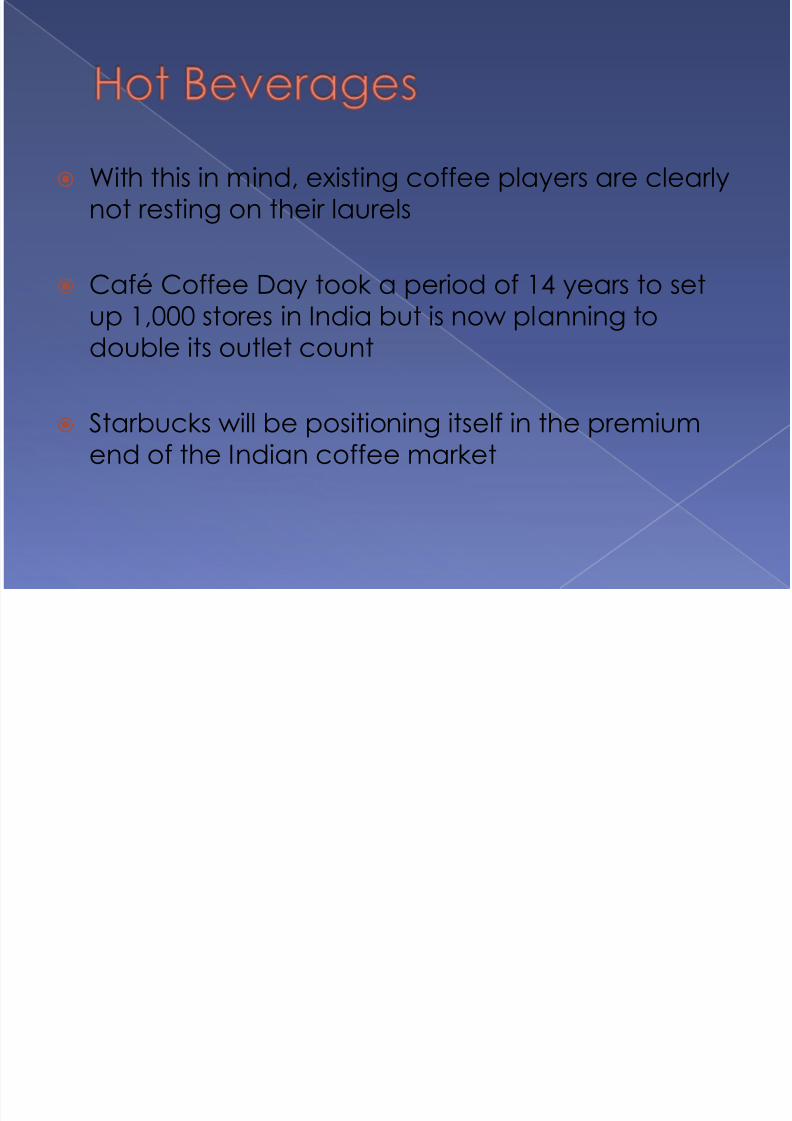
7/23/2019 Food industry Analysis
http://slidepdf.com/reader/full/food-industry-analysis 260/290
With this in mind, existing coffee players are clearlynot resting on their laurels
Café Coffee Day took a period of 14 years to set
up 1,000 stores in India but is now planning todouble its outlet count
Starbucks will be positioning itself in the premium
end of the Indian coffee market
With this in mind existing coffee players are clearly

7/23/2019 Food industry Analysis
http://slidepdf.com/reader/full/food-industry-analysis 261/290
With this in mind, existing coffee players are clearlynot resting on their laurels
Café Coffee Day took a period of 14 years to set
up 1,000 stores in India but is now planning todouble its outlet count
Starbucks will be positioning itself in the premium
end of the Indian coffee market

7/23/2019 Food industry Analysis
http://slidepdf.com/reader/full/food-industry-analysis 262/290

7/23/2019 Food industry Analysis
http://slidepdf.com/reader/full/food-industry-analysis 263/290

7/23/2019 Food industry Analysis
http://slidepdf.com/reader/full/food-industry-analysis 264/290
As one of the fastest growing emerging markets

7/23/2019 Food industry Analysis
http://slidepdf.com/reader/full/food-industry-analysis 265/290
As one of the fastest-growing emerging markets,India’s impressive growth trajectory is supportive ofan acceleration of the premiumisation trend
This strong value growth could also be attributed tothe vast sums being invested by the world’s leadingcompanies into increasing production capacity aswell as marketing and branding initiatives
Continued investments from Asia Pacific Breweries

7/23/2019 Food industry Analysis
http://slidepdf.com/reader/full/food-industry-analysis 266/290
Continued investments from Asia Pacific Breweries,Cobra Beer, Carlsberg and Anheuser-Busch InBevwill only fuel this trend
Beer will continue to dominate the sector in termsof volume, with compound annual averagegrowth forecast at 6.2% to 2015
Indian consumers can pay more than twice asmuch for foreign beer brands than locally brewedbeer brands owing to the 100% import duties leviedon foreign brand
With the Indian alcoholic drinks market traditionally
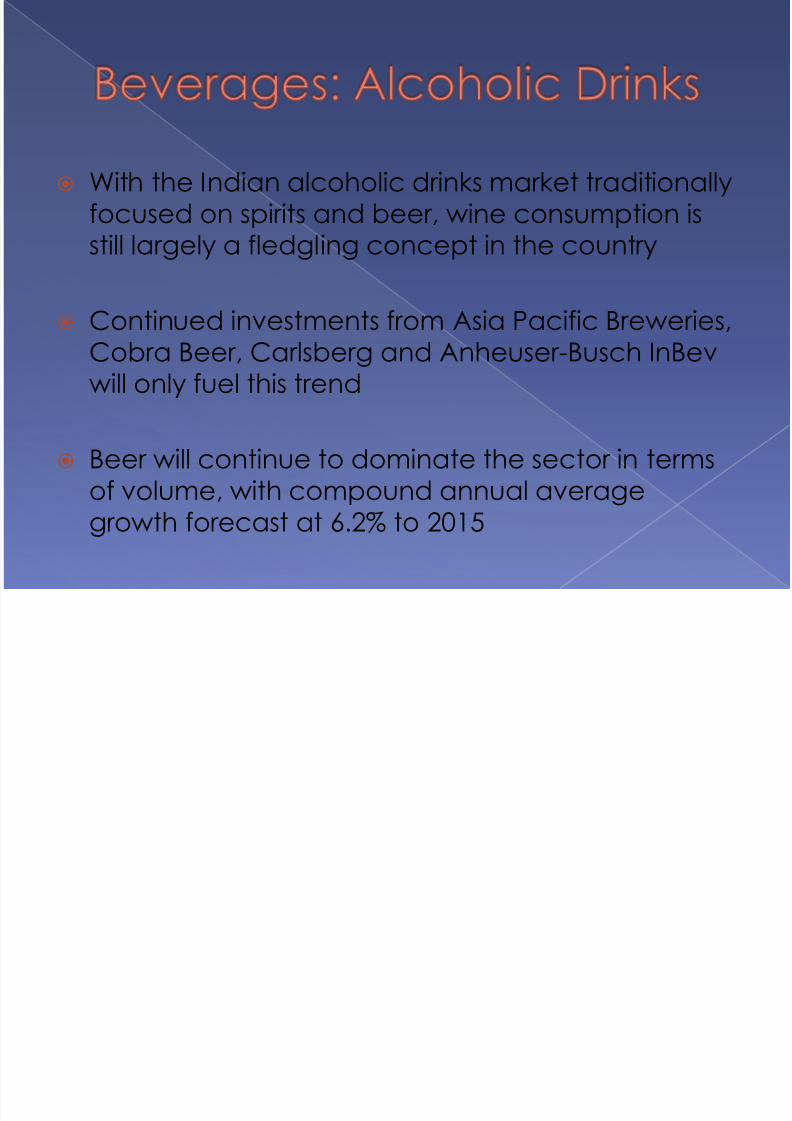
7/23/2019 Food industry Analysis
http://slidepdf.com/reader/full/food-industry-analysis 267/290
With the Indian alcoholic drinks market traditionallyfocused on spirits and beer, wine consumption isstill largely a fledgling concept in the country
Continued investments from Asia Pacific Breweries,Cobra Beer, Carlsberg and Anheuser-Busch InBevwill only fuel this trend
Beer will continue to dominate the sector in termsof volume, with compound annual averagegrowth forecast at 6.2% to 2015
Indian consumers can pay more than twice as much forf i b b d th l ll b d b b d i
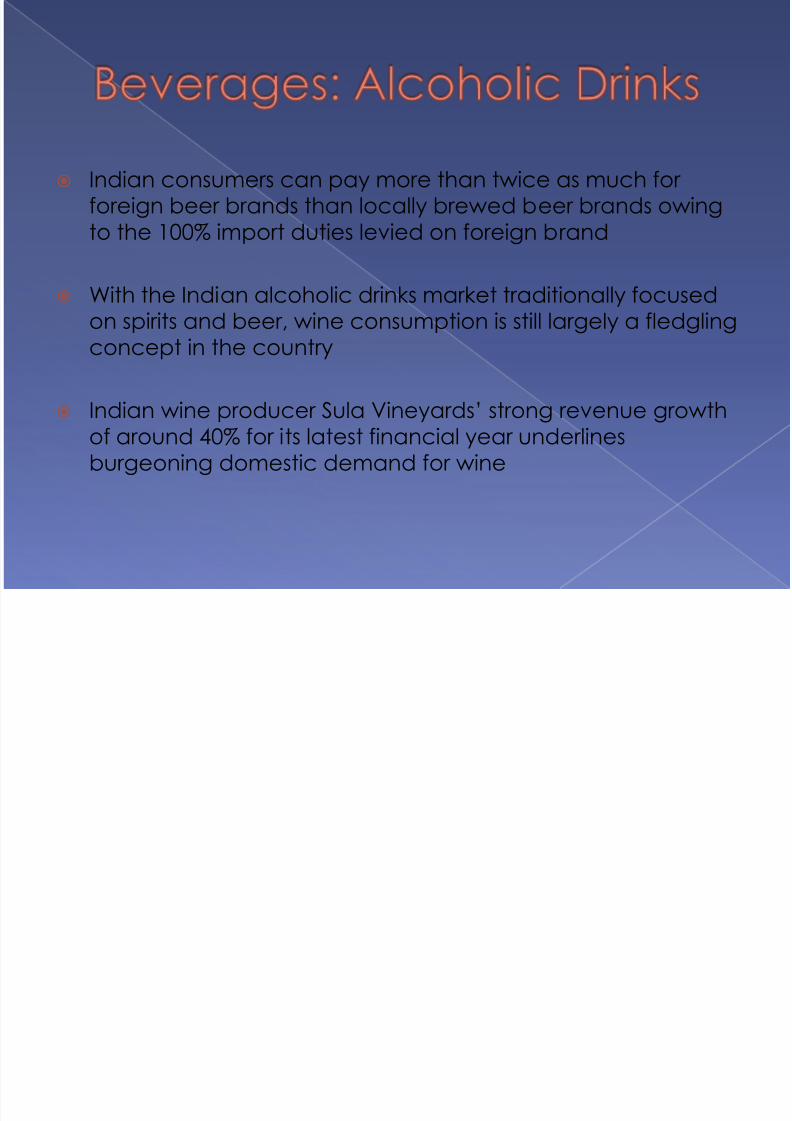
7/23/2019 Food industry Analysis
http://slidepdf.com/reader/full/food-industry-analysis 268/290
Indian consumers can pay more than twice as much forforeign beer brands than locally brewed beer brands owingto the 100% import duties levied on foreign brand
With the Indian alcoholic drinks market traditionally focused
on spirits and beer, wine consumption is still largely a fledglingconcept in the country
Indian wine producer Sula Vineyards’ strong revenue growthof around 40% for its latest financial year underlines
burgeoning domestic demand for wine
India has around 303mn people aged 20-34
7/23/2019 Food industry Analysis
http://slidepdf.com/reader/full/food-industry-analysis 269/290
India has around 303mn people aged 20-34,among which wine is increasingly perceived as asophisticated alcoholic beverage and a symbol ofsocial prestige
Accompanied by growing health awareness,Indian consumers are developing a greaterpenchant for wines
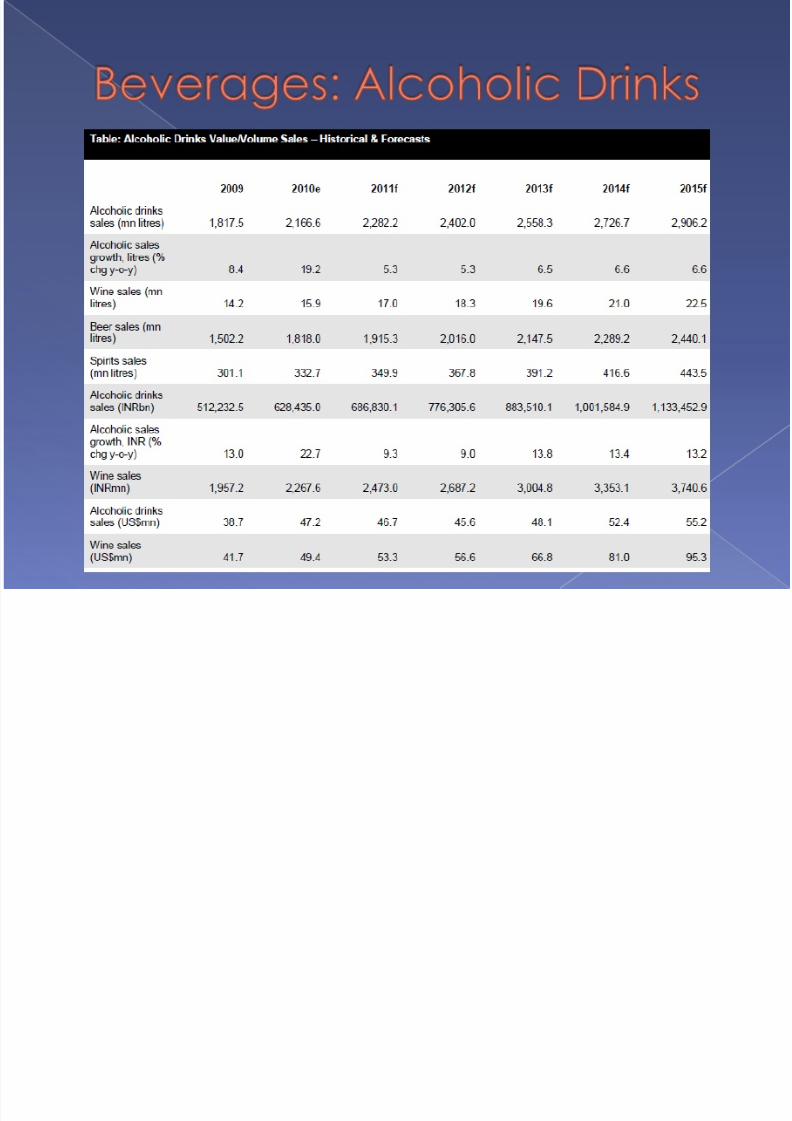
7/23/2019 Food industry Analysis
http://slidepdf.com/reader/full/food-industry-analysis 270/290
Soft drinks growth at 7 5% Compounded annual

7/23/2019 Food industry Analysis
http://slidepdf.com/reader/full/food-industry-analysis 271/290
Soft drinks growth at 7.5%. Compounded annualgrowth rate at 4.9% till 2015
Soft drinks value sale growth at 7.5%. Compounded
annual growth rate at 9% till 2015
India’s soft drinks sector is forecast to experiencebullish growth over our forecast period
Growth in the soft drinks sector will be supported by
7/23/2019 Food industry Analysis
http://slidepdf.com/reader/full/food-industry-analysis 272/290
Growth in the soft drinks sector will be supported bycontinued investment from the industry’s leadingplayers – namely US multinationals The Coca-ColaCompany and PepsiCo.
Both have committed large sums towardsexpansion in India in recent years owing to thepotential that the vast market
The real driver of growth to 2015 and beyond willbe the increased interest in the non-carbonated,healthy drinks category
Sales of fruit juices and bottled waters are expected tosoar a consequence of growing consumer interest in

7/23/2019 Food industry Analysis
http://slidepdf.com/reader/full/food-industry-analysis 273/290
Sales of fruit juices and bottled waters are expected tosoar – a consequence of growing consumer interest inhealthy living
There is no doubt that the Indian juice market is a very
attractive proposition for juice producers, but the marketremains fairly immature
This immaturity can be linked to a combination ofdemand and supply factors
Expensive packaging and transportation costs arearguably the other disincentives for packaged juiceProducers

7/23/2019 Food industry Analysis
http://slidepdf.com/reader/full/food-industry-analysis 274/290

7/23/2019 Food industry Analysis
http://slidepdf.com/reader/full/food-industry-analysis 275/290
Mass grocery retail sales growth +19.7%; compound annualaverage growth rate to2015 = +17 6%

7/23/2019 Food industry Analysis
http://slidepdf.com/reader/full/food-industry-analysis 276/290
g y g ; paverage growth rate to2015 = +17.6%
Indian consumers are still largely familiarising themselves withthe concept of modern retail, which accounts for only 9% of
overall grocery retail sales
Four key modern formats (supermarkets, hypermarkets,convenience and discount stores) are already present withinIndia’s mass grocery retail
Dominant ones being Pantaloon Retail, Reliance Retail, andBig Bazaar.
Low purchasing power, Indian consumers have beenrelatively slow to trade up to modern retailing methods
7/23/2019 Food industry Analysis
http://slidepdf.com/reader/full/food-industry-analysis 277/290
p g p ,relatively slow to trade up to modern retailing methods.
Another factor is the restrictive business environment ofIndia’s MGR sector
Indian consumers are expected to increase their spendingand turn to modern retail formats in search of theconvenience and quality
Global retail giants Walmart and Carrefour, for instance, havealready set up cash-and-carry stores in India throughpartnerships with local conglomerate Bharti Enterprises andFuture Group

7/23/2019 Food industry Analysis
http://slidepdf.com/reader/full/food-industry-analysis 278/290

7/23/2019 Food industry Analysis
http://slidepdf.com/reader/full/food-industry-analysis 279/290
India is one of the world’s major food producers but accountsfor only 1 7% (valued at US$ 7 5 billion) of world trade in this

7/23/2019 Food industry Analysis
http://slidepdf.com/reader/full/food-industry-analysis 280/290
j pfor only 1.7% (valued at US$ 7.5 billion) of world trade in thissector
This share is slated to increase to 3% (US$ 20 billion) by 2015
Sustained by high agricultural output, international demandand a strong domestic market, the Indian food industry offersample scope for large investments in processingtechnologies, skills and equipment, packaging, refrigeration
of frozen food and thermo processing.
Next few years India aims at raising the share ofd f d t 20% i i t t t l i

7/23/2019 Food industry Analysis
http://slidepdf.com/reader/full/food-industry-analysis 281/290
y gprocessed food to 20% in comparison to total agri-produce
Market experts are of the opinion that in future, thefood products is going to increasingly contributetowards India's GDP growth

7/23/2019 Food industry Analysis
http://slidepdf.com/reader/full/food-industry-analysis 282/290

7/23/2019 Food industry Analysis
http://slidepdf.com/reader/full/food-industry-analysis 283/290

7/23/2019 Food industry Analysis
http://slidepdf.com/reader/full/food-industry-analysis 284/290
Adopt proactive product and servicedifferentiation strategies

7/23/2019 Food industry Analysis
http://slidepdf.com/reader/full/food-industry-analysis 285/290
p p pdifferentiation strategies
Focus on successful product lines and global
diversification in order to drive sustainable growth
Focus on product innovation as a long term goalfor a sustaniable competitive edge
Understand the consumer's motivation for buyingyour product
Fear of Greed : These are the primary motivators that impactswhether the consumer will buy your product or not.

7/23/2019 Food industry Analysis
http://slidepdf.com/reader/full/food-industry-analysis 286/290
whether the consumer will buy your product or not.Consumers will be more willing to buy if the producteffectively communicates that it will help avoid a potentialloss or paint or help to deliver a gain or pleasure
Effectively communicate the indirect costs of productswitching
Look for opportunities that will communicate to consumers
that product switching entails a sacrifice. Such cost should bepitched as an investment opportunity to the consumer
Invest in marketing strategies that focuses on yourcore product offering

7/23/2019 Food industry Analysis
http://slidepdf.com/reader/full/food-industry-analysis 287/290
g g ycore product offering
Show that your product is an essential component
of the average consumer's grocery basket
Build brand equity through targeted efforts byMarketing and Sales
Company positioning as a partner to help endusers through this tough economic time
Integration of disparate products into a complete solution

7/23/2019 Food industry Analysis
http://slidepdf.com/reader/full/food-industry-analysis 288/290
Exploit opportunities from consumer feedback
Proactively seek the final consumer's need set and match
product lines to those needs
Establish partnerships with other suppliers
Seek out joint branding with other manufacturers to exploitcomplementary synergies

7/23/2019 Food industry Analysis
http://slidepdf.com/reader/full/food-industry-analysis 289/290

7/23/2019 Food industry Analysis
http://slidepdf.com/reader/full/food-industry-analysis 290/290
Recommended