January 2020
Food & Allied
Poultry Feed Industry

Industry | Process Flow
Oilseed Edible Oil Extraction
Refinery
Edible Oil
Meal Feed Mill
Maize
Farms
Poultry Breeding
Farms
Parent
Stock
Hatchery ChickenBroiler Farms
Layering FarmsEggs
Day Old
Chicks
Consumer
Poultry Feed Industry
Industry | Inputs and Outputs
• Inputs
• Maize
• Soybean and other edible oilseeds meal
• Vitamins & Medicinal premix
• Outputs
• Feed variants
• Types
• Starter feed
• Grower feed
• Layer feed
• Broiler feed
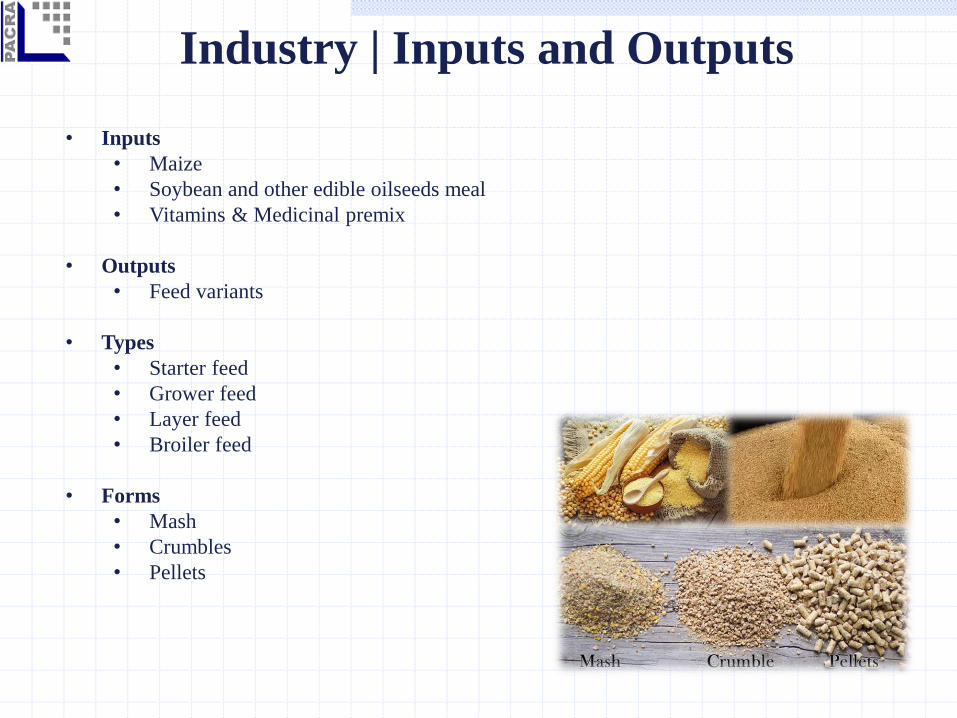
• Forms
• Mash
• Crumbles
• Pellets
Industry | Global Dynamics
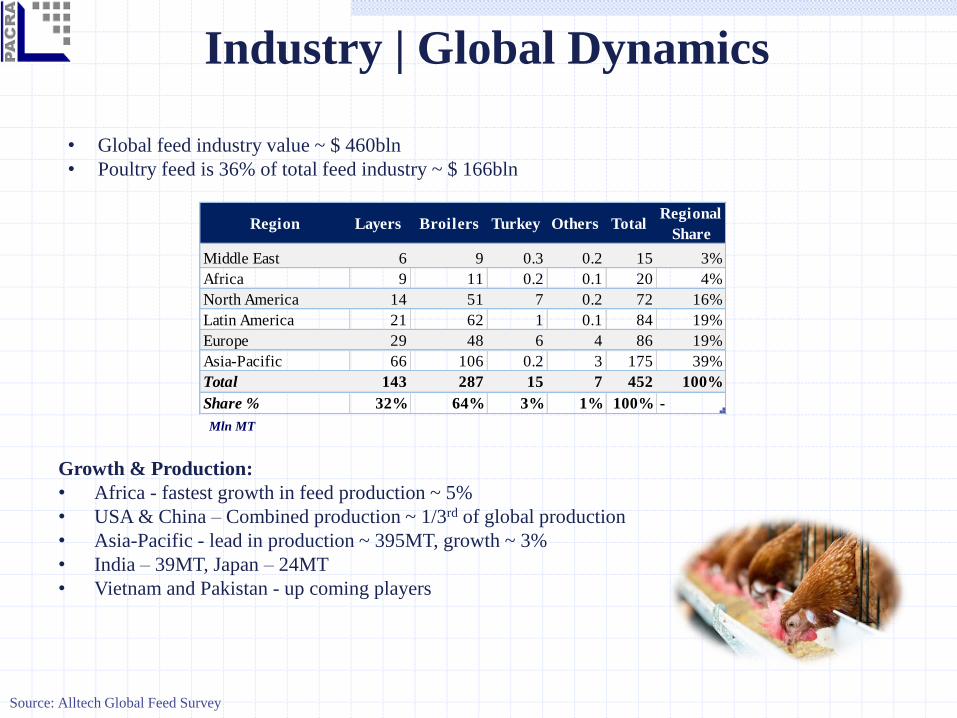
Growth & Production:
• Africa - fastest growth in feed production ~ 5%
• USA & China – Combined production ~ 1/3rd of global production
• Asia-Pacific - lead in production ~ 395MT, growth ~ 3%
• India – 39MT, Japan – 24MT
• Vietnam and Pakistan - up coming players
• Global feed industry value ~ $ 460bln
• Poultry feed is 36% of total feed industry ~ $ 166bln
Mln MT
Source: Alltech Global Feed Survey
Region Layers Broilers Turkey Others Total Regional
Share
Middle East 6 9 0.3 0.2 15 3%
Africa 9 11 0.2 0.1 20 4%
North America 14 51 7 0.2 72 16%
Latin America 21 62 1 0.1 84 19%
Europe 29 48 6 4 86 19%
Asia-Pacific 66 106 0.2 3 175 39%
Total 143 287 15 7 452 100%
Share % 32% 64% 3% 1% 100% -

Poultry Feed | Layer
• Bird’s weight – associated with feed consumed per day
• Diet optimizes egg production – number and size of eggs
• Peak of laying ~ 32 weeks
• Feed consumed per day as per bird’s age (in grams):
• Type of feed consumed as per bird’s age:
Age Feed Consumption (g/day)
Week 1- 17 13-80
Week 18 onwards 100-105
Starter Grower Pre-layer Egg Laying Starts Layer Till Peak Layer Post Peak
Layer 8 weeks 8-16 weeks 16-18 weeks 18 weeks 18-32 weeks after 32 weeks
Source: PACRA Internal & Industry Sources

Poultry Feed | Broiler
• Feed for broiler destined to be sold as whole bird or in pieces will differ from broiler feed destined
to be sold for boneless meat
• Ideal nutrient density ~ 1.5 kg per day consumed by 1 kg bird
• Feed consumed per day as per bird’s age (in grams):
• Type of feed consumed as per bird’s age:
Age Feed Consumption (g/day)
Week 1-5 10 - 100
Week 5-9 100 - 200
Starter Grower Finisher Total Cycle
Broiler 0-2 weeks 2-4 weeks last 10 days 35-45 days
Source: PACRA Internal & Industry Sources

Indgrediants % of
Feed Mix
FY17 FY18 FY19 FY17 FY18 FY19
Maize 50% 24 29 35 12 15 18
Soyabean Meal 28% 52 58 63 15 16 18
Rice Polish 10% 18 18 18 2 2 2
Fish Meal 3% 61 61 61 2 2 2
Sunflower Meal 3% 34 34 34 1 1 1
Medical Premix 3% - - - 0 0 0
Poultry By-Product Meal 2% 59 59 59 1 1 1
Limestone Powder / Granular 1% 3 3 3 0.03 0.03 0.03
Total 100% 251 262 273 33 37 41
Cost as % of Feed
Mix (PKR/kg)
Cost of Ingredient
(PKR/kg)
Poultry Feed | Inputs
• Composition of feed is a very sensitive area, wrong proportion can lead to massive losses
• 20 to 25 ingredients used in poultry feed variants
• Maize and Soybean meal | key ingredients in terms of weight and cost
Sample inclusion percentage of ingredients and cost of feed variant
Source: Agriculture Marketing Information Service, Index Mundi and Industry Sources

Source: Tridge and Index Mundi
Maize
Global Dynamics
• World’s Total Production | Pakistan’s share | 0.6%
• Global Average Maize Price | $ 0.52 per kg
• Price Volatility | +/- 2.3%
Local Dynamics
• Maize Prices | Escalated by 22%
Soybean
• Decline in International Soybean prices
• Rise in PKR due to devaluation
Input | Price Dynamics
500
800
1100
1400
1700
2000
FY16 FY17 FY18 FY19
Input | Maize | Price Trend
Maize - Avg. Import Price (PKR/40kg) Maize - Avg. Local Price (PKR/40kg)
-
10,000
20,000
30,000
40,000
50,000
60,000
FY16 FY17 FY18 FY19
Input | Soybean Seed | Price Trend
Soybean Seed - Avg. International Price (PKR)

-
0
0
1
1
1
1
-
1,000
2,000
3,000
4,000
5,000
6,000
7,000
FY16 FY17 FY18 FY19
Input | Quantity Available
Soybean Seed - Imports ('000' MT) Maize - Area ('000' Hectares) Maize - Production ('000' MT)
Source: Agricultural Statistics of Pakistan and Ministry of National Food Security and Research
85
Production | Province Wise
Punjab Sindh KPK Balochistan
Input | Production Dynamics
Maize
Global Dynamics
• World’s Total Production | Pakistan’s share
| 0.6%
Local Dynamics
• Highest Production Contribution | Punjab |
85%
• During FY19
• Cultivation area | Up by 5 %
• Production | Up by 7 %
Soybean
• Import based market
• Import tilt | Soybean seed

• Registered Feed Mills | 150
• Unregistered Feed Mills | 200
• FY19 | Total Feed Production | 8 MMT
• Current Market Share in the table below:
Source: Pakistan Poultry Association, PACRA Internal and Industry Sources
No. Client Capacity (MT)
1 Sadiq Feeds 1,664,000
2 Islamabad Feeds 500,000
3 Asia Poultry Feed 420,000
4 Hi-Tech Feeds 396,000
5 National Feeds 384,000
6 Big Feeds 336,000
7 Supreme Feeds 336,000
8 Capital Feeds 285,120
9 Sharif Feeds 252,000
10 Lahore Feeds 252,000
Total 5,077,120
Industry Capacity 8,000,000
Market Share | Local Players
Regulatory Structure
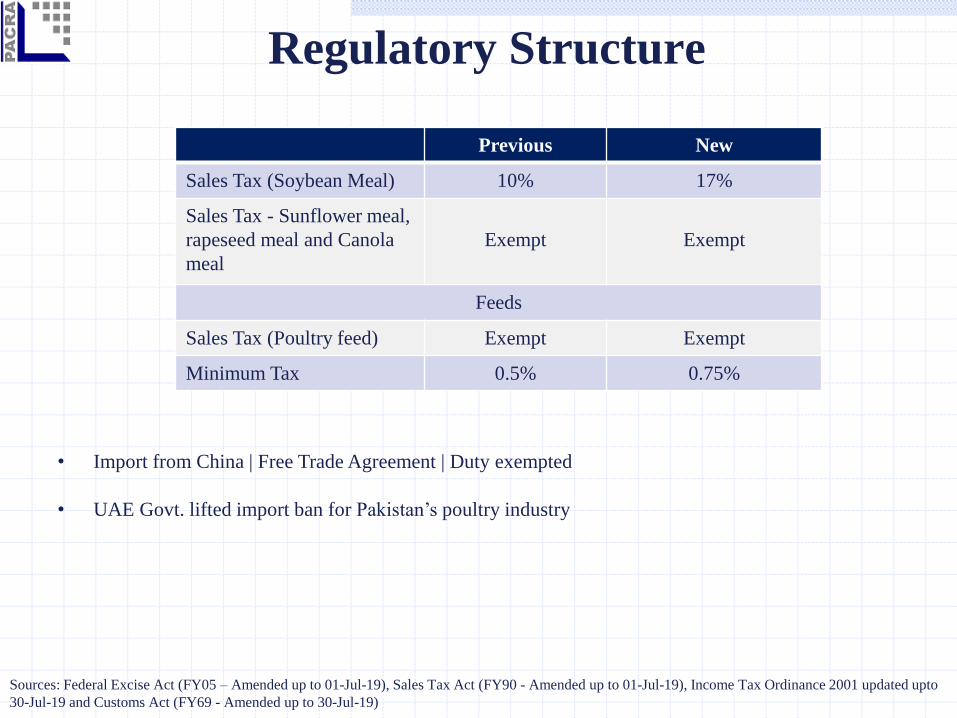
• Import from China | Free Trade Agreement | Duty exempted
• UAE Govt. lifted import ban for Pakistan’s poultry industry
Sources: Federal Excise Act (FY05 – Amended up to 01-Jul-19), Sales Tax Act (FY90 - Amended up to 01-Jul-19), Income Tax Ordinance 2001 updated upto
30-Jul-19 and Customs Act (FY69 - Amended up to 30-Jul-19)
Previous New
Sales Tax (Soybean Meal) 10% 17%
Sales Tax - Sunflower meal,
rapeseed meal and Canola
meal
Exempt Exempt
Feeds
Sales Tax (Poultry feed) Exempt Exempt
Minimum Tax 0.5% 0.75%

DISCLAIMERPACRA has used due care in preparation of this document. Our information has been obtained fromsources we consider to be reliable but its accuracy or completeness is not guaranteed. The informationin this document may be copied or otherwise reproduced, in whole or in part, provided the source isduly acknowledged. The presentation should not be relied upon as professional advice.
Analyst Faiqa Qamar
Contact Number: + 92 42 3586 9504
Recommended
![Original citation - University of Warwickwrap.warwick.ac.uk/62769/7/WRAP_sinclair_boyatt... · 37, 61, 59] Mobile Learning (MobiMOOC) [26, 25, 24]; Critical Literacies (CritLit) [59]](https://img.pdfslide.us/doc/110x75/5e9ed9399bfe045aa639ccf4/original-citation-university-of-37-61-59-mobile-learning-mobimooc-26-25.jpg)


![Character Fill: R=59 G=61 B=48 [P] 11.801 pt Helvetica ... · Fill: R=59 G=61 B=48 [P] 11.801 pt Helvetica Neue LT Pro 45 Light 13.994 pt leading Character Fill: R=59 G=61 B=48 [P]](https://img.pdfslide.us/doc/110x75/5ecc47497831c7695a2e6788/character-fill-r59-g61-b48-p-11801-pt-helvetica-fill-r59-g61-b48.jpg)