Flux Data Server User TutorialDeb Agarwal, Catharine van Ingen, Susan
Holladay, and Misha Krassovski
Berkeley Water Center (UCB, LBL),ORNL, and Microsoft

Typical Data Storage Today• Data retrieved by each
investigator individually• Data corrections and updates
applied individually• Data are often scattered, across a
wide array of locations– Provenance is often not tracked– “Everybody knows” yet no one is
sure
Internet Data Archives
Local Measurements
Large Models
Legacy Sources

Target Data Analysis Flow
Scientific
Data Server
Validate &
Quality Check data
Perform
AnalysisIdentif
y Data Issues
& Obtain Missing Data
Obtain Data from
Source
Track versions, results, andprovenance

Scientific Data Server - Overview
DatabasesData
Cubes
User Interfaces
Data Ingest
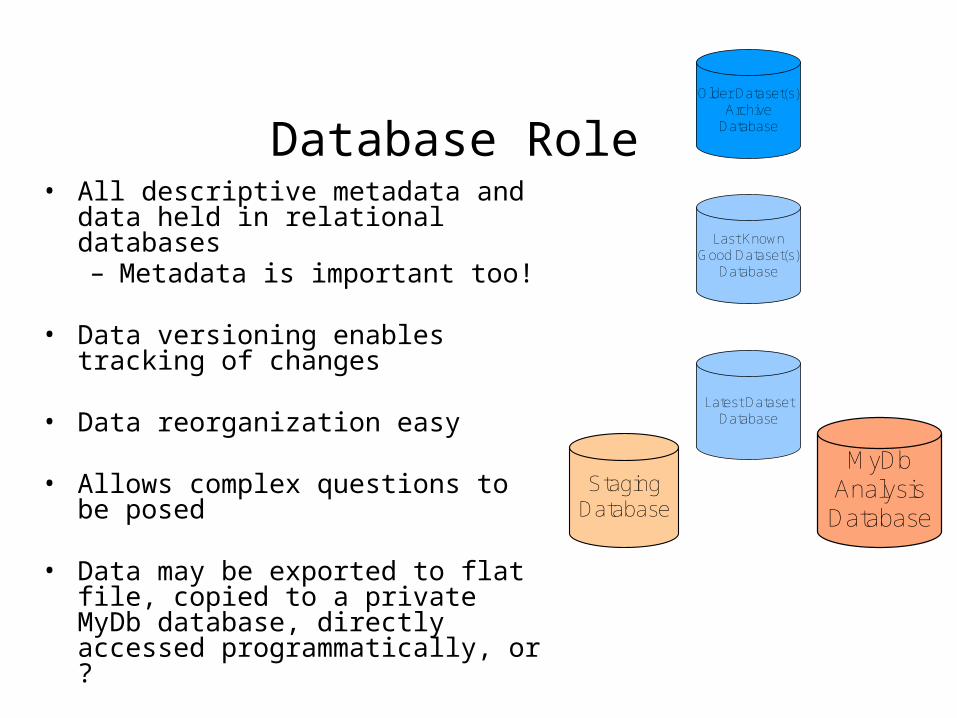
Database Role• All descriptive metadata and data held
in relational databases– Metadata is important too!
• Data versioning enables tracking of changes
• Data reorganization easy
• Allows complex questions to be posed
• Data may be exported to flat file, copied to a private MyDb database, directly accessed programmatically, or ?
Latest DatasetDatabase
Last Known Good Dataset(s)
Database
Older Dataset(s)Archive
Database
MyDbAnalysis
Database
Staging Database

Data Cubes• A data cube is a database specifically
designed for data mining– Simple aggregations (sum, min, or
max) can be pre-computed for speed
– Additional calculations can be computed dynamically or pre-computed (e.g. daily calc, par day)
– Both operate along dimensions such as time, site, or datumtype
– Constructed from a relational database
• Client tool integration is evolving– Excel PivotTables allow simple data
viewing– More powerful analysis and plotting
using Matlab and statistics software

Overview of Data Server Flow
• ORNL Ameriflux• Web Site
• CSV Files
• BWC SQL Server • Database
• Data Cube
• Reports and Excel Pivot • Tables and Charts
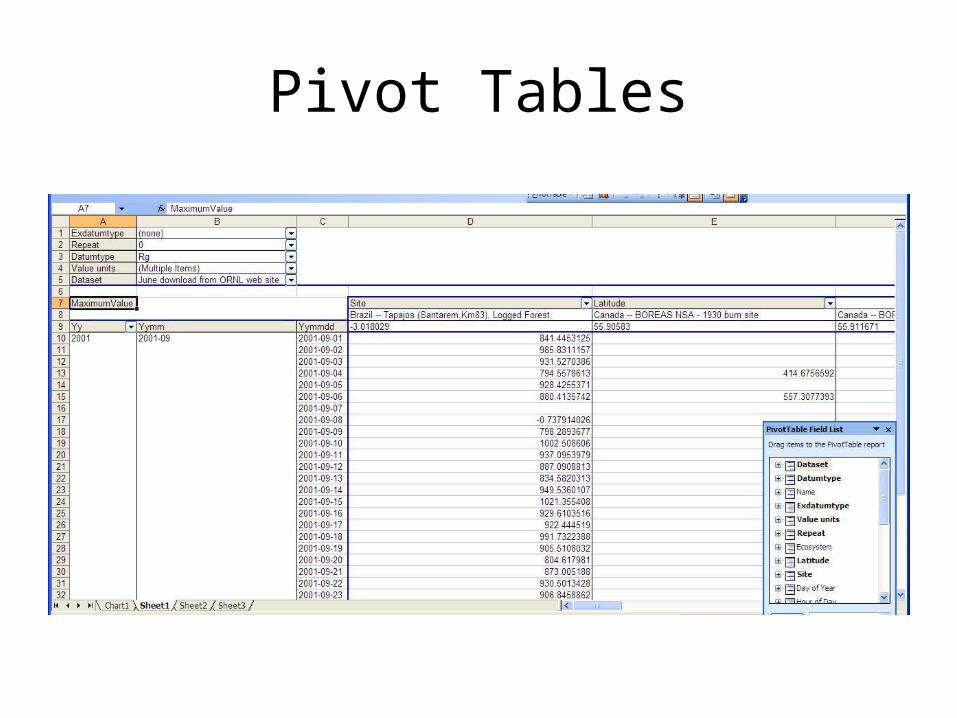
Pivot Tables
Switch to Live demo of Pivot Tables
• Connect up a cube and view data in 2003 and 2007
• Display pivot chart and links to table
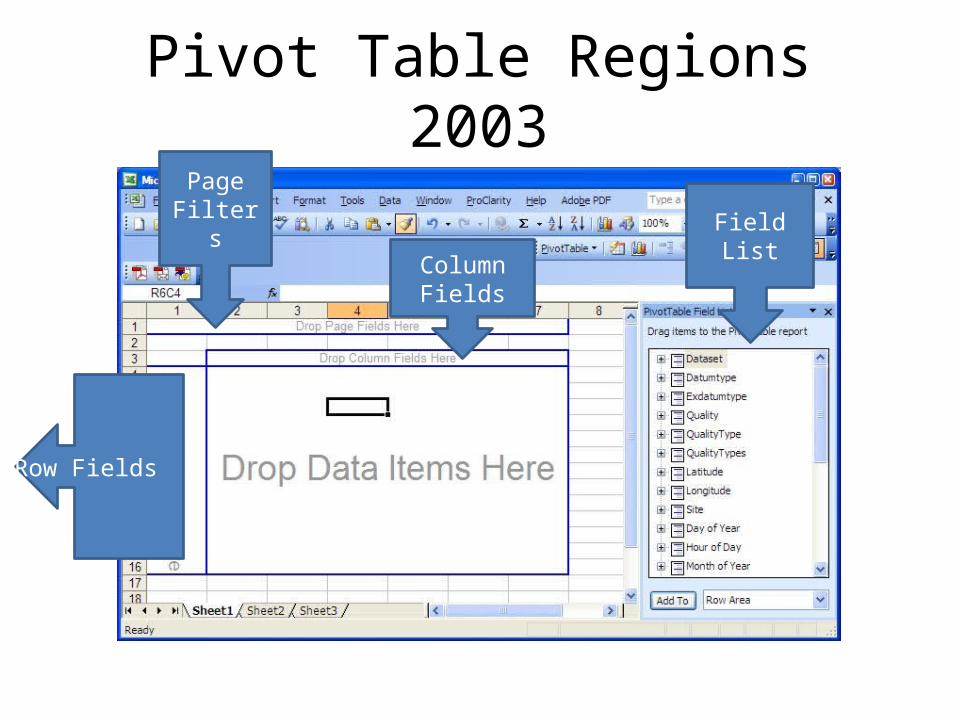
Pivot Table Regions 2003
Page Filters
Column Fields
Row FieldsField List

Pivot Table Regions 2007Pivot Tools
Pivot Field List and Filtering
Pivot Layout and Field Optioons
Data Connections

Pivot Table Regions
• Page Filters– Applied to all data before it goes into the pivot
table• Columns and rows
– Layout the table– Select all or individual items
• Data– Calculated values – average, sum, etc
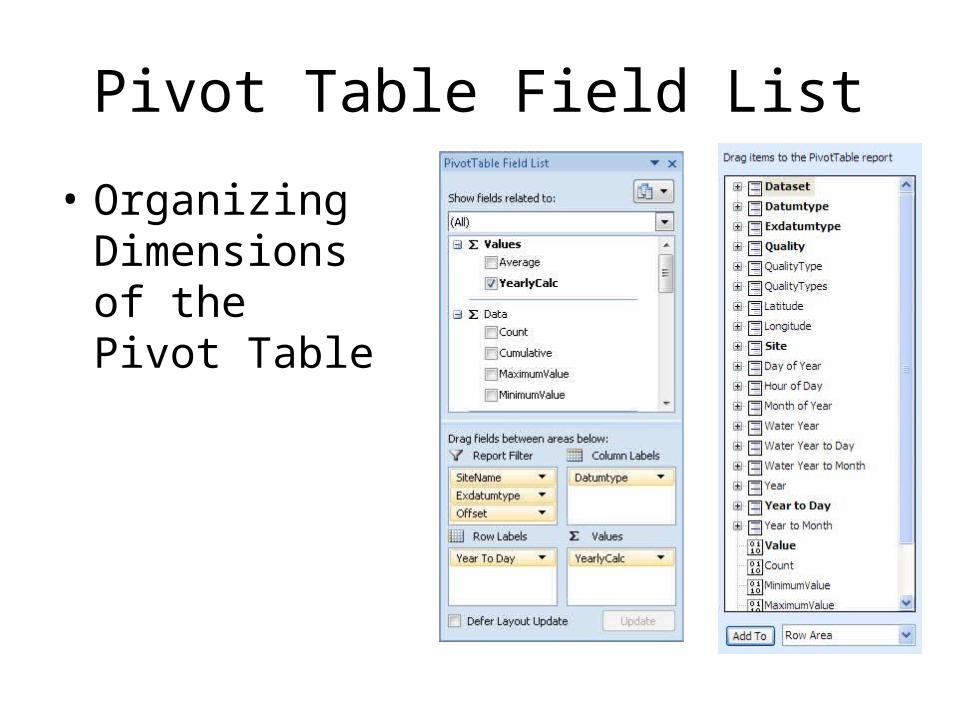
Pivot Table Field List
• Organizing Dimensions of the Pivot Table
Dimension Hierarchies
• Year to Day– Initially displays years– Opening a year gives days– In contrast – Day of Year is a flat dimension giving days
• Year to Month– Initially displays years– Opening a year gives months– Opening a month gives days
• VegType to Site

Exdatumtype and OffsetColumn heading Datumtype Offset Repeat Exdatumtype
TA_7_6 (deg C) TA 7.6 None NoneFC_WPL_H_25 (umol/m2/s) FC None None _WPL_H_25
TA5_F1 TA None 5 _F1RH_FRAC_5_8 (FRACTION) RH 5.8 None _FRAC
PAR_ALB (umol/m2/s) PAR None None _ALB
NEEC_396 (umol/m2/s) None 396 None NEEC

Calculated Measures
• Science variables• Statistics
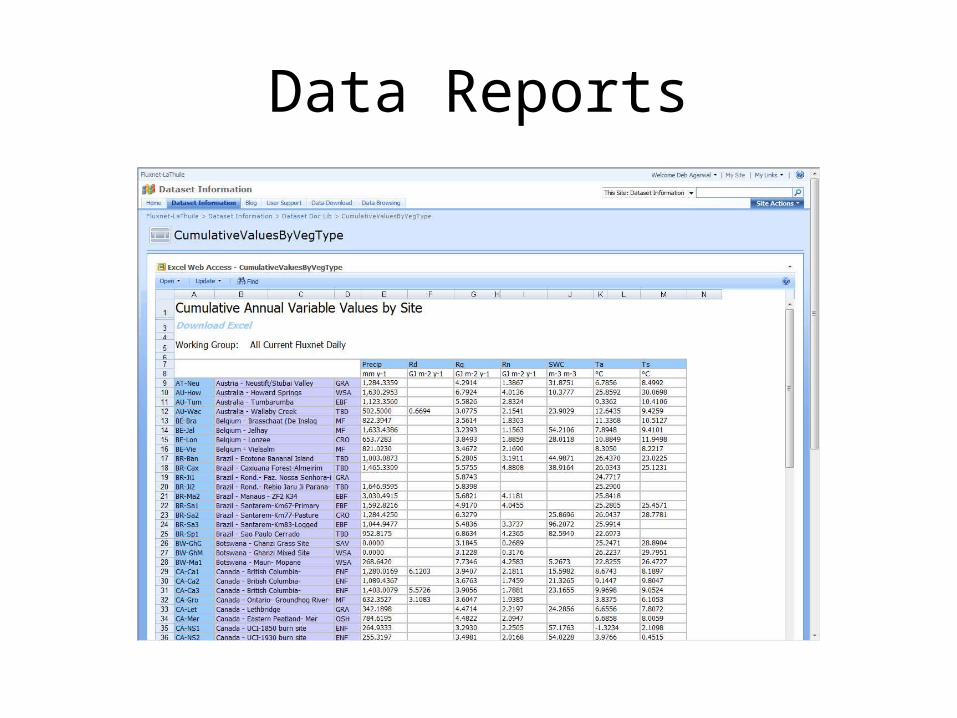
Data Reports

Live demo of data reports

Ancillary Data Reports
• Live demo

User Manual
• Live Demo

Tips and Tricks
• Saving connection information• Grand totals• Field totals• Embedded connection in table

The End

Downloading Data
Recommended