Fluvial Sediment Tracing in the Wensum DTC Richard Cooper | Tobi Krueger | Kevin Hiscock | Barry Rawlins

email: [email protected] www.wensumalliance.org.uk
Research Aims
To use spectroscopy as a novel method of assessing the
dynamics of suspended sediment geochemistry under
a range of in-stream hydrological conditions.
To develop a high-temporal resolution fluvial sediment
source apportionment model for the Blackwater sub-
catchment of the River Wensum.

email: [email protected] www.wensumalliance.org.uk
Why is this Important?
Rivers affected by high sediment volumes suffer from
elevated turbidity, smothering of benthic habitats,
loss of spawning gravels, damage to fish gills, nutrient
enrichment, excessive algal growth, etc.....
Essential to understand where sediment is coming
from to enable mitigation measures to be targeted
accordingly.

email: [email protected] www.wensumalliance.org.uk
Identifying Sources
Topsoils
Road Verges
Channel Banks
Field Drains

email: [email protected] www.wensumalliance.org.uk
Sediment samples collected from each of the 4 potential source areas
and from the river during heavy rainfall events – ISCO automatic
samplers.
All samples vacuum filtered through quartz fibre filter (QFF) papers
to extract the suspended sediments.
Analysing Sediments
Filter papers analysed by X-ray Fluorescence Spectroscopy (XRFS) and
Diffuse reflectance infra-red spectroscopy (DRIFTS) to determine the
concentrations of major elements and compounds – ‘Geochemical
Fingerprints’.

email: [email protected] www.wensumalliance.org.uk
Identifying Fingerprints
Linear Discriminant Analysis
(LDA) employed to determine
the optimum combination of
geochemical fingerprints
capable of differentiating the
source areas.
In Blackwater mini-catchment
A, nine fingerprints proved
most effective (Ca, Ti, Al, Mg,
Na, K, Ce, Fe, P).

email: [email protected] www.wensumalliance.org.uk
Two Mixing Models
Mixing models developed which aim to solve the equation:
Conc. of fingerprints in suspended sediment
Conc. of fingerprints in each source area
% contribution from each source area
Yj = ∑k ( Skj x Pk)
Model 1: Optimisation based on the minimisation of least squares with Monte-Carlo
uncertainty analysis.
Model 2: Bayesian inference using the likelihood function
0< Pk >1
∑ Pk = 1

email: [email protected] www.wensumalliance.org.uk
36.4 mm rainfall
Increase in Topsoil contribution
as rainfall events pass through
the catchment generating
surface runoff.
Declining contribution from
channel banks as successive
precipitation episodes reduce
importance of sub-surface
sources.
Large contributions from field
drains which increases over
time.
24-28th November 2012

email: [email protected] www.wensumalliance.org.uk
10.2 mm rainfall
Similar pattern to November.
Channel bank material
dominates before the event.
Rapid increase in Topsoil
contribution as surface runoff
generated.
Response 1 hour after onset
of heaviest rainfall.
4-5th October 2012

email: [email protected] www.wensumalliance.org.uk
47.4 mm rainfall
Again similar patterns.
Large increase in Topsoil
contribution within first few
hours.
Road verge contribution
increases 12h into event.
Field drains dominate after
~16h post-event onset.
8-10th March 2013
email: [email protected] www.wensumalliance.org.uk
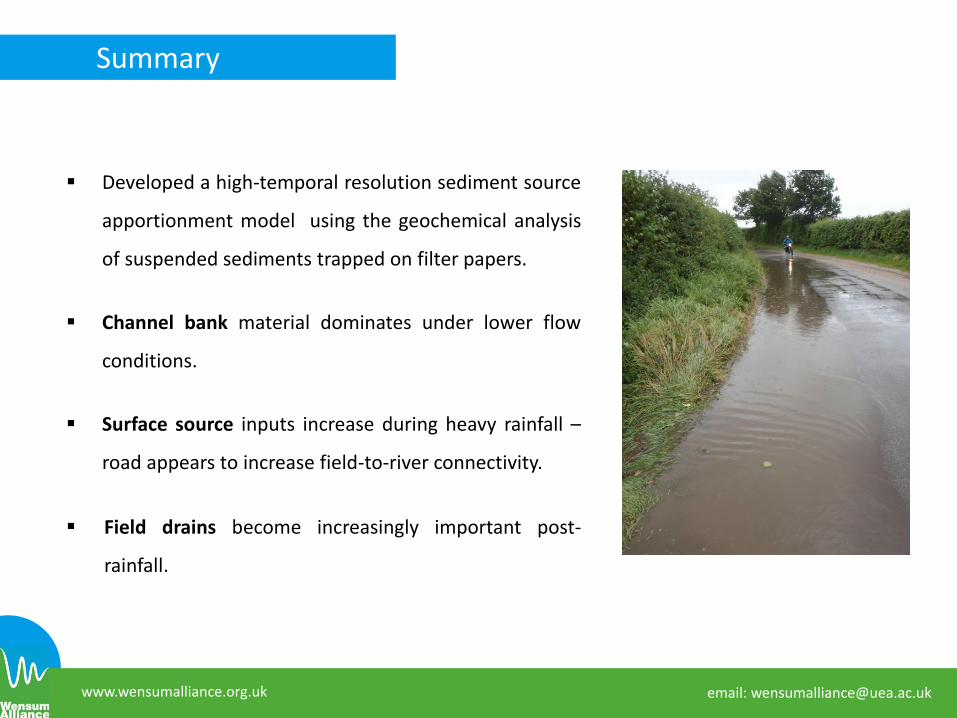
Summary
Developed a high-temporal resolution sediment source
apportionment model using the geochemical analysis
of suspended sediments trapped on filter papers.
Channel bank material dominates under lower flow
conditions.
Surface source inputs increase during heavy rainfall –
road appears to increase field-to-river connectivity.
Field drains become increasingly important post-
rainfall.
Recommended