Atmos. Chem. Phys., 10, 3215–3233, 2010www.atmos-chem-phys.net/10/3215/2010/© Author(s) 2010. This work is distributed underthe Creative Commons Attribution 3.0 License.
AtmosphericChemistry
and Physics
Fluorescent biological aerosol particle concentrations and sizedistributions measured with an Ultraviolet Aerodynamic ParticleSizer (UV-APS) in Central Europe
J. A. Huffman1, B. Treutlein1,2, and U. Poschl1
1Max Planck Institute for Chemistry, Biogeochemistry Department, Becherweg 27, Mainz, 55128, Germany2now at: Ludwig Maximilians University, Institute for Physical Chemistry, Munich, Germany
Received: 24 July 2009 – Published in Atmos. Chem. Phys. Discuss.: 28 August 2009Revised: 5 March 2010 – Accepted: 16 March 2010 – Published: 6 April 2010
Abstract. Primary Biological Aerosol Particles (PBAPs),including bacteria, spores and pollen, are essential for thespread of organisms and disease in the biosphere, and nu-merous studies have suggested that they may be importantfor atmospheric processes, including the formation of cloudsand precipitation. The atmospheric abundance and size dis-tribution of PBAPs, however, are largely unknown. At asemi-urban site in Mainz, Germany we used an UltravioletAerodynamic Particle Sizer (UV-APS) to measure Fluores-cent Biological Aerosol Particles (FBAPs), which provide anestimate of viable bioaerosol particles and can be regardedas an approximate lower limit for the actual abundance ofPBAPs. Fluorescence of non-biological aerosol componentsare likely to influence the measurement results obtained forfine particles (<1 µm), but not for coarse particles (1–20 µm).
Averaged over the four-month measurement period(August–December 2006), the mean number concentrationof coarse FBAPs was∼3×10⁻² cm−3, corresponding to∼4% of total coarse particle number. The mean massconcentration of FBAPs was∼1 µg m−3, corresponding to∼20% of total coarse particle mass. The FBAP number sizedistributions exhibited alternating patterns with peaks at var-ious diameters. A pronounced peak at∼3 µm was essen-tially always observed and can be described by the followingcampaign-average lognormal fit parameters: geometric meandiameter 3.2 µm, geometric standard deviation 1.3, numberconcentration 1.6×10⁻² cm−3. This peak is likely due to
Correspondence to: J. A. Huffman([email protected])
fungal spores or agglomerated bacteria, and it exhibited apronounced diel cycle (24-h) with maximum intensity duringearly/mid-morning. FBAP peaks around∼1.5 µm,∼5 µm,and ∼13 µm were also observed, but less pronounced andless frequent. These may be single bacterial cells, larger fun-gal spores, and pollen grains, respectively.
The observed number concentrations and characteristicsizes of FBAPs are consistent with microscopic, biologicaland chemical analyses of PBAPs in aerosol filter samples.To our knowledge, however, this is the first exploratory studyreporting continuous online measurements of bioaerosol par-ticles over several months and a range of characteristic sizedistribution patterns with a persistent bioaerosol peak at∼3 µm. The measurement results confirm that PBAPs ac-count for a substantial proportion of coarse aerosol particlenumber and mass in continental boundary layer air. More-over, they suggest that the number concentration of viablebioparticles is dominated by fungal spores or agglomeratedbacteria with aerodynamic diameters around 3 µm rather thansingle bacterial cells with diameters around 1 µm.
1 Introduction
Biogenic aerosols are ubiquitous in the Earth’s atmosphereand they play important roles in atmospheric chemical andphysical processes, climate, biological systems, and publichealth (Cox and Wathes, 1995; Poschl, 2005; Jaenicke etal., 2007). Primary Biological Aerosol Particles (PBAPs)are pieces of biological material emitted or suspended di-rectly from the biosphere to the atmosphere. The main types
Published by Copernicus Publications on behalf of the European Geosciences Union.
3216 J. A. Huffman et al.: Fluorescent biological aerosol particle concentrations and size distributions
and characteristic size ranges of PBAP are viruses (0.01–0.3 µm), bacteria (0.1–10 µm), fungal and fern spores (1–30 µm), plant pollen (5–100 µm), and fragments of animaland plant matter (e.g. Gregory, 1978; Simoneit and Mazurek,1982; Matthias-Maser and Jaenicke, 1995; Jones and Harri-son, 2004; Jaenicke, 2005; Elbert et al., 2007; Bauer et al.,2008). PBAPs can play an important role in public health byaffecting allergies (Linskens and Cresti, 2000; Franze et al.,2005) and spreading disease to humans and crops, both natu-rally and as agents of terrorism (e.g. Lacey and Dutkiewicz,1994; Brown and Hovmoller, 2002; Ho and Duncan, 2005).Many organisms rely on bioaerosols for the distribution andtransfer of genetic material for reproductive purposes, as inthe cases of plant pollen and fungal spores, which can alsoundergo transport over long distances (Elbert et al., 2007, andreferencse therein). PBAPs may also influence climate andthe hydrological cycle by initiating the formation of cloudsand precipitation as cloud condensation and ice nuclei (Din-gle, 1966; Schnell and Vali, 1972; Hamilton and Lenton,1998; Diehl et al., 2001; Lohmann and Feichter, 2005; Duseket al., 2006; McFiggans et al., 2006; Sun and Ariya, 2006;Christner et al., 2008; Deguillaume et al., 2008; Morris et al.,2008; Mortazavi et al., 2008; Rosenfeld et al., 2008; Ariya etal., 2009; Bowers et al., 2009; Pratt et al., 2009; Prenni et al.,2009).
Recent studies have found significant concentrations ofDNA (ng m−3) and a wide range of bacteria and fungalspores in fine and coarse particulate matter from urban, ru-ral, and high-alpine air (Wittmaack et al., 2005; Despres etal., 2007; Frohlich-Nowoisky et al., 2009). For tropical rain-forest regions where both physicochemical processes in theatmosphere and biological activity at the Earth’s surface areparticularly intense, Elbert et al. (2007) reported that fun-gal spores account for large fractions of coarse particle massconcentrations (∼30%) and estimated global emission ratesof the order of 50 Tg a−1. Jaenicke et al. (2007) summarizemeasurements covering a variety of geographical locationsand particle size ranges showing that 15–74% of the totalaerosol number as being PBAPs including∼20% in the semi-urban setting in Mainz, Germany. Continuous measurementsof PBAPs have been limited, however, and so actual abun-dances, properties, as well as the origin of PBAPs and theircomponents are still poorly quantified and understood. Re-cent model studies and literature reviews highlight the needfor more measurement data to constrain regional and globalemissions, transport, and abundance of PBAPs in the at-mosphere (Burrows et al., 2009a, b; Heald and Spracklen,2009).
In the past, most PBAP measurements were based onoff-line techniques with low time resolution (hours/days).Within the last decades and motivated by need to detectbioaerosols as possible Bio-Warfare Agents (BWA), the ap-plication of ultraviolet Laser-Induced Fluorescence (LIF) toonline aerosol analysis has enabled the detection of PBAPs inreal-time, with time resolution of minutes or less (Hill et al.,
1995; Pinnick et al., 1995; Hairston et al., 1997; Cheng et al.,1999; Reyes et al., 1999; Seaver et al., 1999; Snyder et al.,2004; Kaye et al., 2005; Jonsson et al., 2006; Cabredo et al.,2007; Manninen et al., 2008; Pan et al., 2009; Sivaprakasamet al., 2009; Bundke et al., 2010). While each independentlydesigned instrument has unique advantages (e.g. detectionof full emission spectra or from multiple fluorescence ex-citation wavelengths), the Ultraviolet Aerodynamic ParticleSizer (UV-APS) was the first such instrument to be madecommercially available and to utilize aerodynamic particlesizing. As a result, the UV-APS, also known as FluorescentAPS (FLAPS), has become available for the investigation ofambient biological aerosol and presents unique opportuni-ties to inform atmospheric science, while other published re-search has focused largely on BWA detection. The UV-APSutilizes a pulsed excitation laser at 355 nm and detects emit-ted fluorescence in the region of 420–575 nm (Hairston et al.,1997; Brosseau et al., 2000). This set of fluorescence wave-lengths enables the detection of reduced pyridine nucleotides(e.g. NAD(P)H) and riboflavin, which are molecules linkedto cellular metabolism and thus specific for living cells (Har-rison and Chance, 1970; Eng et al., 1989; Kell et al., 1991;Li et al., 1991; Iwami et al., 2001; Hill et al., 2009). Ac-cordingly, detection of auto-fluorescence under these condi-tions may indicate the presence of viable biological materialin the aerosol particles (Setlow and Setlow, 1977; Hairstonet al., 1997; Laflamme et al., 2005), though other biologicalmolecules may also auto-fluoresce (e.g. chlorophyll, cellu-lose). Non-viable organic material such as nutrient broth andpeptone water can also exhibit fluorescence in the operatingwavelengths (Agranovski et al., 2003b). These substancesare not likely to occur in the atmosphere, however, and ifso they would most likely be of biological origin (albeit notviable) and thus qualify as components of PBAPs. A num-ber of external factors, such as relative humidity and envi-ronmental stress have been found to influence the fluores-cence of biological organisms, and the fluorescence signalsof NAD(P)H can be affected by binding to proteins (Huberet al., 2000; Agranovski et al., 2003a). Further investigationwill be required to achieve full understanding of the responseof the UV-APS to different types of biogenic aerosol parti-cles and to quantify potential interferences with non-biogenicparticles and particle components (e.g. soot and polycyclicaromatic compounds, PAHs) that may also display fluores-cence. As discussed below, such interferences may indeedinfluence the measurement results obtained for fine aerosolparticles (<1 µm). In the coarse fraction, certain compo-nents of mineral dust (e.g. kaolin) may exhibit weak fluo-rescence, but at significantly lower levels than most types ofbiological particles (Sivaprakasam et al., 2004). In exper-iments with test aerosols in an outdoor environment Ho etal. (1999, 2002) found that fluorescence signals from super-micron aerosols were dominated by viable PBAPs and foundno indications that non-biological materials contributed toaerosol fluorescence at the wavelengths used. Indeed, all
Atmos. Chem. Phys., 10, 3215–3233, 2010 www.atmos-chem-phys.net/10/3215/2010/
J. A. Huffman et al.: Fluorescent biological aerosol particle concentrations and size distributions 3217
available information suggests that coarse fluorescent parti-cles (>1 µm) measured by the UV-APS can be regarded as“Fluorescent Biological Aerosol Particles” (FBAP), whichprovide an estimate of viable bioaerosol particles and whoseabundance represents an approximate lower limit for the ac-tual abundance of primary biological aerosol particles.
Previous work has studied the UV-APS response inthe laboratory to cell viability (Agranovski et al., 2003a;Laflamme et al., 2005), aerosols containing marker biolog-ical molecules (Agranovski et al., 2004b; Agranovski andRistovski, 2005), and also with respect to real-time measure-ment of bacteria (Brosseau et al., 2000; Agranovski et al.,2003a, b) and fungal spores (Kanaani et al., 2007, 2008a,b), but little has been done to utilize the instrument for longterm (> days) ambient measurement. Ho and Spence (1998)used a UV-APS for short periods of time to measure back-ground FBAP concentrations at several military locationswithin Canada, and both Pinnick et al. (2004) and Pan etal. (2007) utilized a LIF spectrometer for detection of FBAPin ambient air in New Mexico and Maryland. A variety ofbioaerosol detection techniques have been utilized to charac-terize bioaerosol emissions from a variety of occupationallyspecific exposure environments, such as from livestock fa-cilities (Agranovski et al., 2004a; Seedorf, 2004; Kim et al.,2007), waste treatment plants (Lavoie et al., 2006; Nikaeen etal., 2009) and in various indoor environments (Burge, 1990;Moschandreas et al., 1996; Law et al., 2001). Recently, flu-orescence measurements of bioparticles have also been re-ported for tropical rainforest air (Gabey et al., 2009; Prenniet al., 2009; Huffman, Garland, Poschl, et al., 2010).
In this study we have applied a UV-APS for the detectionand sizing of FBAPs in urban and rural continental aerosolsover a four-month period from 3 August–4 December 2006.To our knowledge, this represents the first multi-month am-bient measurement study involving an instrument for real-time bioaerosol detection using auto-fluorescence and alsothe first in a semi-urban environment.
2 Methods
2.1 UV-APS operating principles and conditions
An ultraviolet aerodynamic particle sizer (UV-APS; TSIInc. Model 3314, St. Paul, MN) was utilized for this studyfollowing standard, manual-advised procedures. A detaileddescription of the instrument has been given elsewhere(Hairston et al., 1997; Brosseau et al., 2000), and so onlya brief introduction is given here. Aerodynamic particle siz-ing in the diameter range (Da) of 0.54–19.81 µm (geometricmid-point diameter) is performed in the instrument by mea-suring the time of flight between two red (633 nm) He-Nelasers. Fluorescence of individual aerosol particles in thewavelength range of 420–575 nm is measured after excitationby a third ultraviolet laser (Nd:YAG) at 355 nm. The particle
counting efficiency of the instrument drops below unity atDa<0.7 µm (counting efficiency∼0.5 at 0.54 µm), thus con-centration values reported for particles<0.7 µm should beconsidered as lower limit values. The instrument manufac-turer specifies the upper size limit of the UV-APS at 15 µm.Upon manufacturer calibration, however, polystyrene latexspheres (PSL, Duke Scientific) up to 20 µm, were prop-erly sized by the UV-APS, though possibly with lower ef-ficiency. As a result, particles detected between 15–20 µmare included in our analyses, but the reported concentra-tion values should again be considered as lower limit val-ues. Aerosol sampling was performed with a volumetricflow of 5 L min−1 (Lpm) at ambient pressure and temper-ature. Within the instrument, the total flow was split intoan inner sample flow of 1.0±0.1 Lpm passing through thenozzle and optical measurement cell and a sheath flow of4.0±0.1 Lpm (pressure difference feedback control). Theflow rates were regularly checked with external flow meters(TSI Inc. Model 4140 Thermal Mass Flowmeter and Sensi-dyne Gilibrator-2). The inner and total volumetric flow ratesstayed generally within the range of 1.0–1.1 Lpm and 4.9–5.0 Lpm, respectively.
The instrument was controlled and the measurement datawere recorded with an external computer connected via RS-232 ports using the manufacturer’s Aerosol Instrument Man-ager software (TSI AIM). Aerodynamic diameter, side scat-ter intensity, and fluorescence intensity measurements wererecorded, initiated every 5 min and integrated over a samplelength of 299 s. Sample measurements were continuously re-peated over a period of four months from 3 August to 4 De-cember 2006 (122 days, 34 270 data points) and only brieflyinterrupted for maintenance procedures (usually<30 min perweek for flow check and nozzle cleaning as detailed in the in-strument manual). The Local Time (LT) used for data anal-ysis and all times reported here refer to Central EuropeanSummer Time (CEST) from the beginning of the reportedmeasurements in August until 29 October, and thereafter toCentral European Time (CET).
2.2 Measurement location and sampling
The UV-APS instrument was operated in a laboratory onthe third (top) floor of the Max Planck Institute for Chem-istry (∼10 m above ground; eastward-facing location), whichis located on the campus of the Johannes Gutenberg Uni-versity in Mainz, Germany (49◦59′31.07′′ N, 8◦14′14.64′′ E;100 m a.s.l. – above sea level). Towards the north and east,the university campus is surrounded by the city of Mainz andadjacent urban areas in the Rhine-Main metropolitan region.Towards the south and west, the university campus is sur-rounded by farm, grass, and forested land with small villagesand towns in a rural region extending over several hundredkilometres. Thus, air masses advected to the sampling loca-tion during this study can be considered as typical Central
www.atmos-chem-phys.net/10/3215/2010/ Atmos. Chem. Phys., 10, 3215–3233, 2010
3218 J. A. Huffman et al.: Fluorescent biological aerosol particle concentrations and size distributions
European mixtures of air from a metropolitan area and froma rural background region.
The UV-APS instrument was placed next to a window in-side the laboratory, through which ambient air was sampledusing electrically-conductive silicon rubber tubing (length1.6 m, inner diameter 12 mm, sample flow residence time∼2 s). Flow through the tube was considered laminar at alltimes, and so diffusion losses are considered negligible for allsampled particle sizes. From the instrument inlet on top ofthe UV-APS the sampling tube was smoothly bent throughthe window to minimize particle losses due to impaction(curvature radius∼1 m). It is possible that the sampled airmasses were influenced by dynamics involving the buildingstructure, though no evidence of this was observed.
2.3 Data processing and analysis
Kanaani et al. (2007) reported that all viable bioaerosols(“with endogenous metabolites”) they tested were recordedby the UV-APS as having fluorescence in channels 2and above. Agranovski et al. (2004b), however, sug-gested that non-fluorescent background aerosols tested alsoexhibited fluorescence in channel 2. In the presentstudy we calculated number size distributions of flu-orescent aerosol particles, dNF/dlogDa, for each sizebin from the sum of the particle number concentra-tions from fluorescence channels 3–64, and we calcu-lated the total particle size distributions dNT/dlogDa,from channels 1–64. For comparison we also calculateddNF/dlogDa using channels 2–64 as illustrated in supple-mental Figs. S2–S4:http://www.atmos-chem-phys.net/10/3215/2010/acp-10-3215-2010-supplement.pdf. These showthe enhancement of dNF/dlogDa is strongly size dependent(Fig. S4), decreasing from a factor of 3.4 at 0.6 µm to a factorof 1.1 at 20 µm. As a result, by excluding fluorescence chan-nel 2 we expect to obtain a reasonable estimate and avoidover-counting the abundance of FBAPs, which in turn can beregarded as an approximate lower limit for the atmosphericabundance of PBAPs. Whether the fluorescent bioparticlesare indeed viable is less well understood and needs to be fur-ther addressed as discussed below. The integrated numberconcentration of coarse fluorescent particles (NF,c>1 µm)calculated by including fluorescence channel 2 is on average1.5 times higher than the integratedNF,c excluding fluores-cence channel 2 (Fig. S3a).
Some fraction of non-biological aerosol particles, includ-ing soot, PAHs, and cigarette smoke (Pan et al., 1999) exhibitfluorescence and could be erroneously counted as FBAPs bythis technique. This is most likely to occur at small (<1 µm)particle sizes where contribution from anthropogenic parti-cles from combustion sources is dominant (Okada and Mat-sunum, 1974). If, for example, only a very small amount(e.g. 0.1%) of a non-biological particle mode with peakof 100 cm−3 at 0.75 µm exhibited fluorescence, a peak of0.1 cm−3 would appear in the fluorescent particle number
distribution. This peak may often be large enough to appearas a distinct peak in the distribution of fluorescent particles(Sect. 3.2). To investigate the contribution of non-biologicalparticles that are counted by this technique (only consideringfluorescence channels> 3) the correlations between the in-tegrated number concentrations of fluorescent particles (NF)and total particles (NT) were plotted separately for particlesless than 1.0 µm and greater than 1.0 µm (Fig. S5). The cor-relation of the submicron particles is systematically linear(R2=0.51, 34 270 data points), with most outliers groupedas individual particle events, whereas the correlation of thesupermicron particles is more random (R2=0.17). Super-micron primary biological particles are likely to have dif-ferent sources and suspension mechanisms from the major-ity of the anthropogenic source-dominated submicron parti-cles observed in this semi-urban location. As a result, cor-relation ofNF with NT indicates that a large percentage ofsubmicron particles exhibiting fluorescence may have an-thropogenic sources, but this is not the case for supermi-cron particles. Similar correlations were also performed forsmaller cut sizes. Goodness of fit values for these correla-tions increased with decreasing cut size, indicating an in-creasing influence of anthropogenic sources for submicronparticles (e.g., Fig. S6 withR2=0.86 for submicron parti-cles<0.723 mm).
To avoid/minimize interference with non-biological fluo-rescent particles and for simplicity, therefore, we focus ouranalysis here on coarse particles (>1 µm), and we excludefine particles (<1 µm) from the discussion of integral num-ber concentrations. Accordingly, we take the integral numberconcentration of fluorescent particles larger than 1 µm,NF,c,as the concentration of coarse FBAP. Similarly,NT,c refers tothe total integral number concentration of particles detectedby the UV-APS larger than 1 µm. Particle mass size distri-butions (dM/dlogDa) were calculated for each size channelby multiplication of dN /dlogDa with the volume of an aero-dynamically equivalent sphere with the geometric midpointdiameter (Da,g) assuming a density of 1 g cm−3 and a shapefactor of 1. Integral mass concentrations of coarse FBAPs(MF,c) and total coarse particles (MT,c) were also calculatedby integration of particle mass>1 µm, though these shouldbe taken as a first approximation as a result of unknown par-ticle density and shape. Comparison of UV-APS measure-ments with filters analyzed with SEM-EDX from Amazoniashow similar trends in PBAP size distribution as well as innumber and mass concentration, suggesting that, under cer-tain conditions, the UV-APS FBAP measurement has no sig-nificant bias with respect to PBAP (Poschl, Sinha, Martin, etal., 2010).
By plotting UV-APS diagnostic parameters after the mea-surement study was over, a correlation between logged In-strument Temperature (IT) and several instrument parame-ters (UV laser Power – UVP, Red Laser Current– RLC) wasdetected. Over the course of the 4-month measurement pe-riod,R2 values for the correlations were 0.12 for IT-UVP and
Atmos. Chem. Phys., 10, 3215–3233, 2010 www.atmos-chem-phys.net/10/3215/2010/
J. A. Huffman et al.: Fluorescent biological aerosol particle concentrations and size distributions 3219
101 N
100
m-3
) (a) August101 N
100
m-3
) (b) September
10-3 10-1 10 N
F,c / NT,c
10-4
10-2
NF,
c (cm
810
2 0.120.080.040
NF,cNF,c / NT,c
dNF/dlogDa (cm-3)
10-3 10-1 10 N
F,c / NF,c
10-4
10-2
NF,
c (cm
810
2 0.120.080.040
8/1 8/8 8/15 8/22 8/29Date
68
1
2
4
68
Da
(μm
)
9/1 9/8 9/15 9/22 9/29Date
68
1
2
4
68
Da
(μm
)
0 0
10-3 10-1 101 N
F,c / NT,c
10-4
10-2
100
NF,
c (cm
-3)
2 0.120.080.040
(c) October
10-3 10-1 101 N
F,c / NT,c
10-4
10-2
100
NF,
c (cm
-3)
2 0.120.080.040
(d) November
10/1 10/8 10/15 10/22 10/29Date
68
1
2
4
68
10
Da
(μm
)
11/1 11/8 11/15 11/22 11/29Date
68
1
2
4
68
10
Da
(μm
)
10/1 10/8 10/15 10/22 10/29Date 11/1 11/8 11/15 11/22 11/29Date
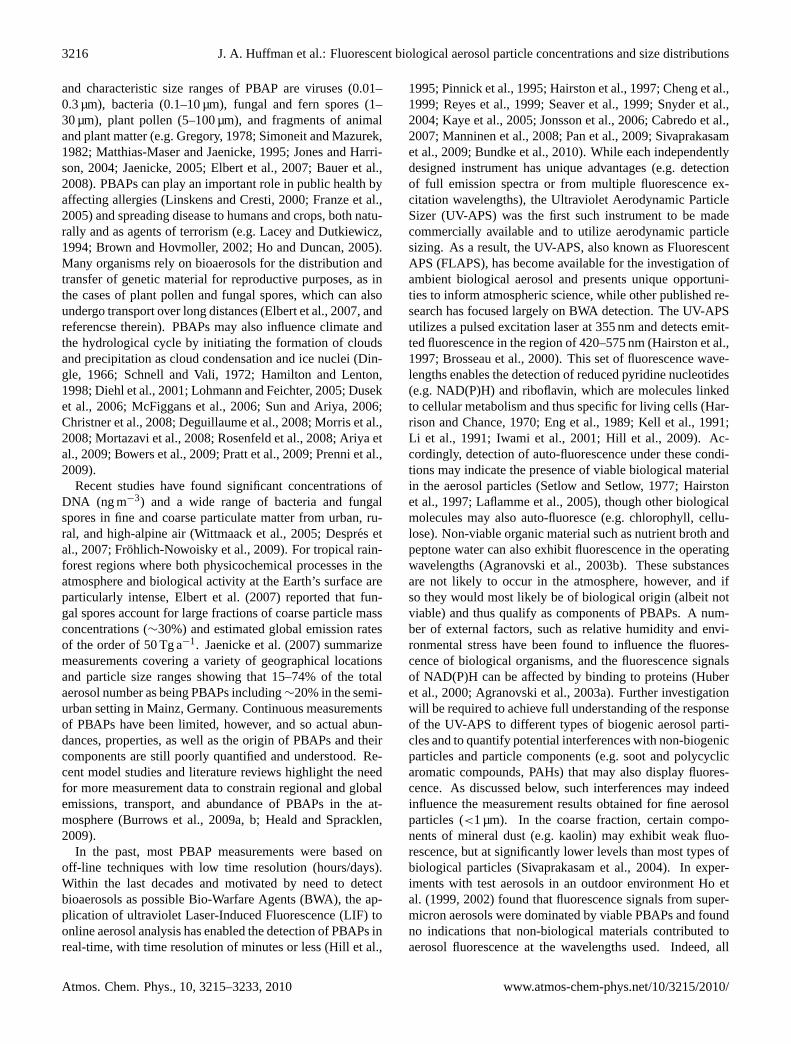
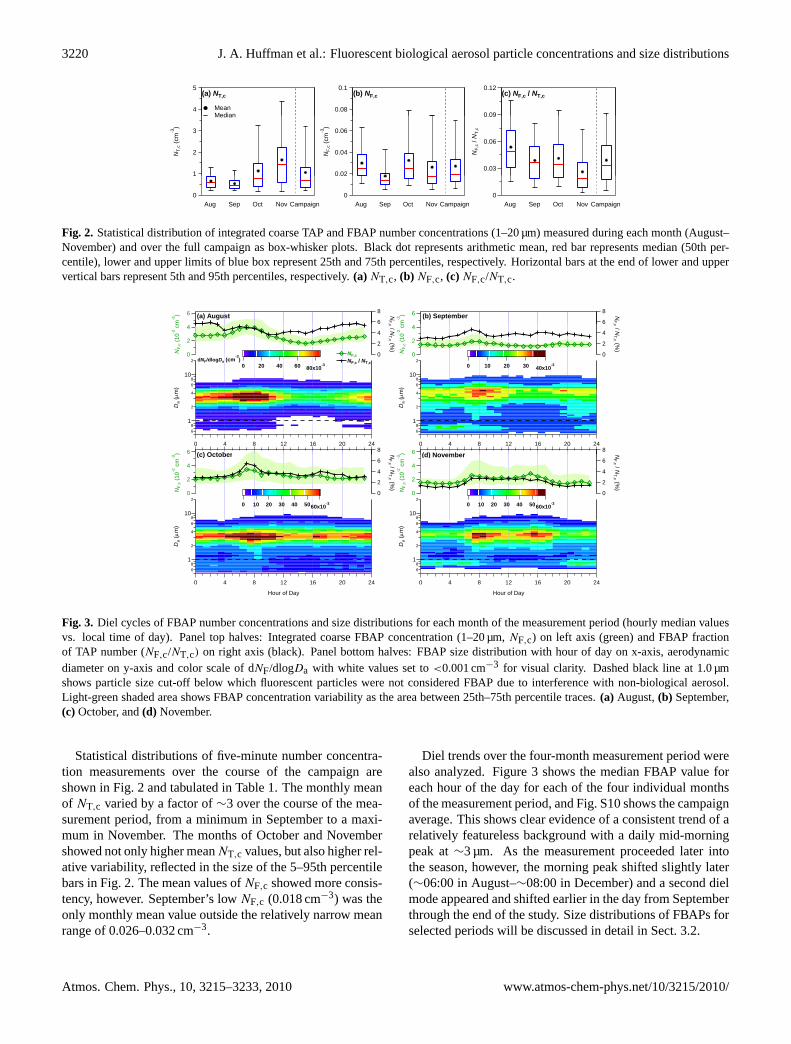
Fig. 1. Time series of fluorescent biological aerosol particle concentrations. Panel upper left: Integrated total coarse FBAP number (NF,c),green markers. Panel upper right: Number ratio of integrated coarse FBAP to TAP (NF,c/NT,c), black markers. Panel lower half: Size-resolved measurements (dNF/dlogDa) for each 5-min sample over entire measurement period:(a) August,(b) September,(c) October, and(d) November (extending to 4 December).
0.78 for IT-RLC. Correlations between FBAP concentrationand each of these parameters were also observed, but veryweak (R2=0.0004, 0.07, and 0.004 for IT, UVP, and RLC,respectively). We, therefore, suggest that it is important tomonitor and consider these parameters for UV-APS oper-ation and comparison of measurement data from differentcampaigns and instruments. It is possible that the absolutevalue of the FBAP signals could be affected by such instru-mental parameters under certain conditions, but size distri-butions, trends and the main conclusions of this study areunlikely to be affected.
For the interpretation and scaling of size distribution dataand plots (Sect. 3.2) we have calculated the limit of detec-tion for concentrations measurable in each size channel ofthe UV-APS. These results are shown in the SOM.
3 Results and discussion
3.1 Particle number and mass concentrations
3.1.1 Overview of number concentrations
To our knowledge, no other time series of bioaerosol mea-surements with such high time and size resolution extendingover a similarly long period have been reported previously.Thus, we first outline characteristic features of the time series
(Figs. 1, S7) in a general way to help the reader gain anoverview of the observed concentration levels, trends, andvariability before moving on to a more formal statisticaltreatment of the data (Fig. 2) and more detailed size-resolvedanalysis. Figure 1 shows time series of FBAP number con-centrations and size distributions measured with the UV-APSfor each month of the study.
Through-out the measurement period the total coarse par-ticle number concentration,NT,c exhibited highly variablelarge spikes and strong diel (24-h) and day-to-day varia-tions. Background concentrations consistently dropped to<0.4 cm−3 between morning peaks during most of the cam-paign, and the highest total particle number concentrationswere observed in November, with daily peaks above 8 cm−3.In contrast to total particles, the FBAP number concentration,NF,c, exhibited less pronounced spikes and showed moreconsistent diel and day-to-day behavior. The highestNF,cconcentrations were observed in late October, with maximaup to 0.85 cm−3. The relative contribution of FBAP to TAPnumber, NF,c/NT,c showed similar temporal behaviour toNF,c, but with more pronounced extremes due to the vari-ability of the total number of coarse particles. In general,NT,c andNF,c/NT,c were inversely correlated, but with rel-atively high scatter: asNT,c increases,NF,c/NT,c decreases.More detailed trends are discussed in the SOM, and shownin Figs. S8–S9.
www.atmos-chem-phys.net/10/3215/2010/ Atmos. Chem. Phys., 10, 3215–3233, 2010
3220 J. A. Huffman et al.: Fluorescent biological aerosol particle concentrations and size distributions
5
4
(a) NT,c
MeanMedian
0.1
0.08
(b) NF,c0.12
0 09
(c) NF,c / NT,c
3
2
1N
T,c (
cm-3
)
Median
0.06
0.04
0.02
NF,
c (cm
-3)
0.09
0.06
0.03
NF,
c / N
T,c
1
0Aug Sep Oct Nov Campaign
0.02
0Aug Sep Oct Nov Campaign
0Aug Sep Oct Nov Campaign
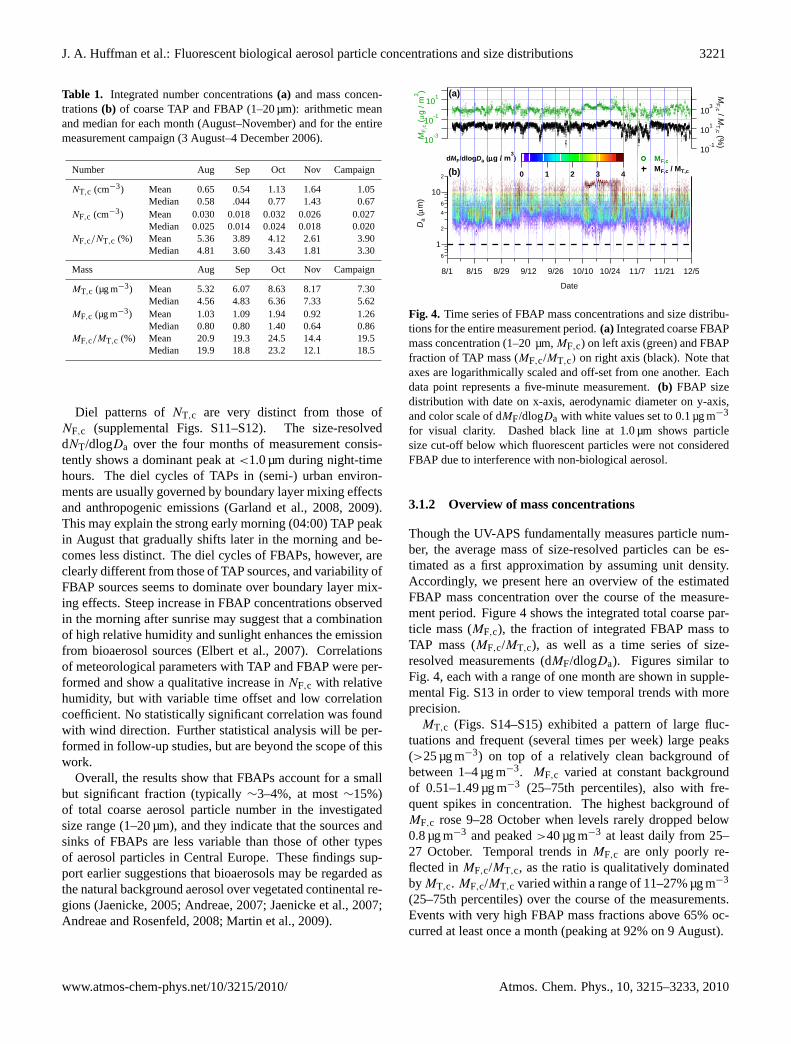
Fig. 2. Statistical distribution of integrated coarse TAP and FBAP number concentrations (1–20 µm) measured during each month (August–November) and over the full campaign as box-whisker plots. Black dot represents arithmetic mean, red bar represents median (50th per-centile), lower and upper limits of blue box represent 25th and 75th percentiles, respectively. Horizontal bars at the end of lower and uppervertical bars represent 5th and 95th percentiles, respectively.(a) NT,c, (b) NF,c, (c) NF,c/NT,c.
6
m-3
) 8
6
NF,
(a) August 6
m-3
) 8
6
NF,
(b) September4
2
0NF,
c (10
-2 c
m
4
2
0
c / NT,c (%
)
68
10
2
)
80x10-36040200 dNF/dlogDa (cm-3
)NF,cNF,c / NT,c
4
2
0NF,
c (10
-2 c
m
4
2
0
c / NT,c (%
)
68
10
2
)
40x10-33020100
24201612840
68
1
2
4
Da
(μm
24201612840
68
1
2
4
Da
(μm
6) 8(c) October 6) 8
(d) November4
2
0NF,
c (10
-2 c
m-3
)
6
4
2
0
NF,c / N
T,c (%)
810
2
60x10-350403020100
(c) October4
2
0NF,
c (10
-2 c
m-3
)
6
4
2
0
NF,c / N
T,c (%)
810
2
60x10-350403020100
(d) November
24201612840
68
1
2
4
6
Da
(μm
)
24201612840
68
1
2
4
6
Da
(μm
)
Hour of Day Hour of Day
Fig. 3. Diel cycles of FBAP number concentrations and size distributions for each month of the measurement period (hourly median valuesvs. local time of day). Panel top halves: Integrated coarse FBAP concentration (1–20 µm,NF,c) on left axis (green) and FBAP fractionof TAP number (NF,c/NT,c) on right axis (black). Panel bottom halves: FBAP size distribution with hour of day on x-axis, aerodynamicdiameter on y-axis and color scale of dNF/dlogDa with white values set to<0.001 cm−3 for visual clarity. Dashed black line at 1.0 µmshows particle size cut-off below which fluorescent particles were not considered FBAP due to interference with non-biological aerosol.Light-green shaded area shows FBAP concentration variability as the area between 25th–75th percentile traces.(a) August,(b) September,(c) October, and(d) November.
Statistical distributions of five-minute number concentra-tion measurements over the course of the campaign areshown in Fig. 2 and tabulated in Table 1. The monthly meanof NT,c varied by a factor of∼3 over the course of the mea-surement period, from a minimum in September to a maxi-mum in November. The months of October and Novembershowed not only higher meanNT,c values, but also higher rel-ative variability, reflected in the size of the 5–95th percentilebars in Fig. 2. The mean values ofNF,c showed more consis-tency, however. September’s lowNF,c (0.018 cm−3) was theonly monthly mean value outside the relatively narrow meanrange of 0.026–0.032 cm−3.
Diel trends over the four-month measurement period werealso analyzed. Figure 3 shows the median FBAP value foreach hour of the day for each of the four individual monthsof the measurement period, and Fig. S10 shows the campaignaverage. This shows clear evidence of a consistent trend of arelatively featureless background with a daily mid-morningpeak at∼3 µm. As the measurement proceeded later intothe season, however, the morning peak shifted slightly later(∼06:00 in August–∼08:00 in December) and a second dielmode appeared and shifted earlier in the day from Septemberthrough the end of the study. Size distributions of FBAPs forselected periods will be discussed in detail in Sect. 3.2.
Atmos. Chem. Phys., 10, 3215–3233, 2010 www.atmos-chem-phys.net/10/3215/2010/
J. A. Huffman et al.: Fluorescent biological aerosol particle concentrations and size distributions 3221
Table 1. Integrated number concentrations(a) and mass concen-trations(b) of coarse TAP and FBAP (1–20 µm): arithmetic meanand median for each month (August–November) and for the entiremeasurement campaign (3 August–4 December 2006).
Number Aug Sep Oct Nov Campaign
NT,c (cm−3) Mean 0.65 0.54 1.13 1.64 1.05Median 0.58 .044 0.77 1.43 0.67
NF,c (cm−3) Mean 0.030 0.018 0.032 0.026 0.027Median 0.025 0.014 0.024 0.018 0.020
NF,c/NT,c (%) Mean 5.36 3.89 4.12 2.61 3.90Median 4.81 3.60 3.43 1.81 3.30
Mass Aug Sep Oct Nov Campaign
MT,c (µg m−3) Mean 5.32 6.07 8.63 8.17 7.30Median 4.56 4.83 6.36 7.33 5.62
MF,c (µg m−3) Mean 1.03 1.09 1.94 0.92 1.26Median 0.80 0.80 1.40 0.64 0.86
MF,c/MT,c (%) Mean 20.9 19.3 24.5 14.4 19.5Median 19.9 18.8 23.2 12.1 18.5
Diel patterns ofNT,c are very distinct from those ofNF,c (supplemental Figs. S11–S12). The size-resolveddNT/dlogDa over the four months of measurement consis-tently shows a dominant peak at<1.0 µm during night-timehours. The diel cycles of TAPs in (semi-) urban environ-ments are usually governed by boundary layer mixing effectsand anthropogenic emissions (Garland et al., 2008, 2009).This may explain the strong early morning (04:00) TAP peakin August that gradually shifts later in the morning and be-comes less distinct. The diel cycles of FBAPs, however, areclearly different from those of TAP sources, and variability ofFBAP sources seems to dominate over boundary layer mix-ing effects. Steep increase in FBAP concentrations observedin the morning after sunrise may suggest that a combinationof high relative humidity and sunlight enhances the emissionfrom bioaerosol sources (Elbert et al., 2007). Correlationsof meteorological parameters with TAP and FBAP were per-formed and show a qualitative increase inNF,c with relativehumidity, but with variable time offset and low correlationcoefficient. No statistically significant correlation was foundwith wind direction. Further statistical analysis will be per-formed in follow-up studies, but are beyond the scope of thiswork.
Overall, the results show that FBAPs account for a smallbut significant fraction (typically∼3–4%, at most∼15%)of total coarse aerosol particle number in the investigatedsize range (1–20 µm), and they indicate that the sources andsinks of FBAPs are less variable than those of other typesof aerosol particles in Central Europe. These findings sup-port earlier suggestions that bioaerosols may be regarded asthe natural background aerosol over vegetated continental re-gions (Jaenicke, 2005; Andreae, 2007; Jaenicke et al., 2007;Andreae and Rosenfeld, 2008; Martin et al., 2009).
103
MF,c / 1
101
μg /
m3 ) (a)
10-1 101
MT,c (%
)10-3
10-1
MF,
c (μ
MF cdMF/dlogDa (μg / m3)
6
10
2
m)
43210
F,c MF,c / MT,c
F g a (μg )
(b)
1
2
4
Da
(μm
8/1 8/15 8/29 9/12 9/26 10/10 10/24 11/7 11/21 12/5
Date
6
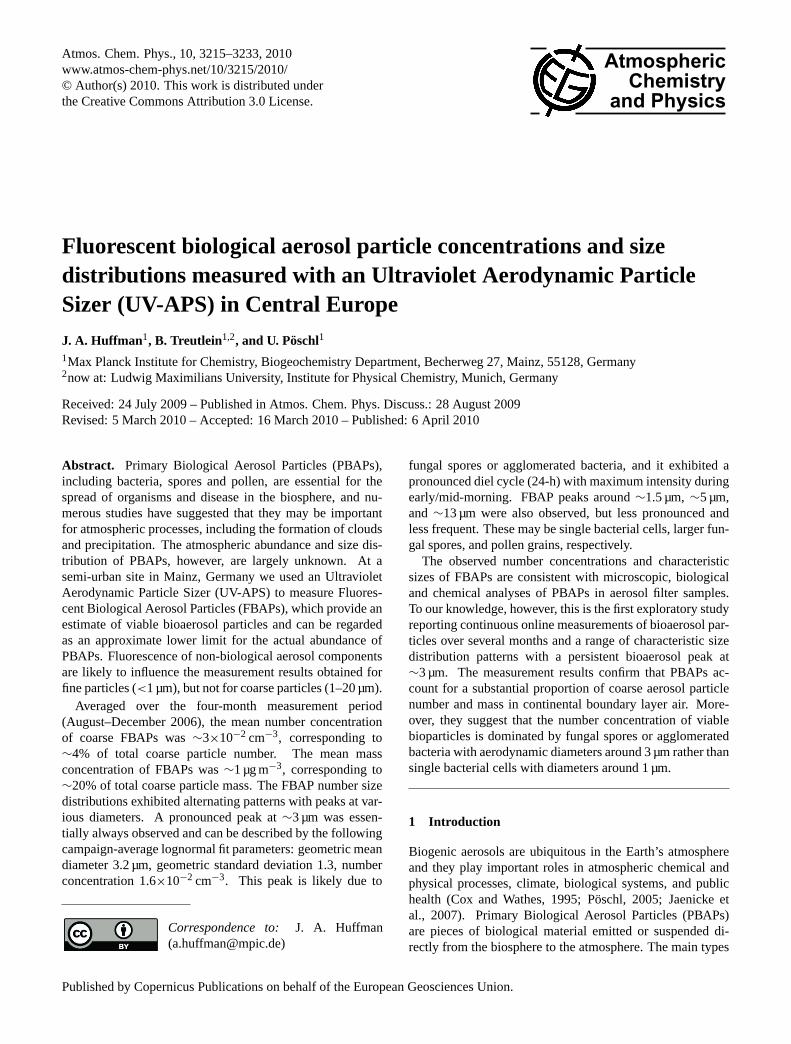
Fig. 4. Time series of FBAP mass concentrations and size distribu-tions for the entire measurement period.(a) Integrated coarse FBAPmass concentration (1–20 µm,MF,c) on left axis (green) and FBAPfraction of TAP mass (MF,c/MT,c) on right axis (black). Note thataxes are logarithmically scaled and off-set from one another. Eachdata point represents a five-minute measurement.(b) FBAP sizedistribution with date on x-axis, aerodynamic diameter on y-axis,and color scale of dMF/dlogDa with white values set to 0.1 µg m−3
for visual clarity. Dashed black line at 1.0 µm shows particlesize cut-off below which fluorescent particles were not consideredFBAP due to interference with non-biological aerosol.
3.1.2 Overview of mass concentrations
Though the UV-APS fundamentally measures particle num-ber, the average mass of size-resolved particles can be es-timated as a first approximation by assuming unit density.Accordingly, we present here an overview of the estimatedFBAP mass concentration over the course of the measure-ment period. Figure 4 shows the integrated total coarse par-ticle mass (MF,c), the fraction of integrated FBAP mass toTAP mass (MF,c/MT,c), as well as a time series of size-resolved measurements (dMF/dlogDa). Figures similar toFig. 4, each with a range of one month are shown in supple-mental Fig. S13 in order to view temporal trends with moreprecision.
MT,c (Figs. S14–S15) exhibited a pattern of large fluc-tuations and frequent (several times per week) large peaks(>25 µg m−3) on top of a relatively clean background ofbetween 1–4 µg m−3. MF,c varied at constant backgroundof 0.51–1.49 µg m−3 (25–75th percentiles), also with fre-quent spikes in concentration. The highest background ofMF,c rose 9–28 October when levels rarely dropped below0.8 µg m−3 and peaked>40 µg m−3 at least daily from 25–27 October. Temporal trends inMF,c are only poorly re-flected inMF,c/MT,c, as the ratio is qualitatively dominatedbyMT,c. MF,c/MT,c varied within a range of 11–27% µg m−3
(25–75th percentiles) over the course of the measurements.Events with very high FBAP mass fractions above 65% oc-curred at least once a month (peaking at 92% on 9 August).
www.atmos-chem-phys.net/10/3215/2010/ Atmos. Chem. Phys., 10, 3215–3233, 2010
3222 J. A. Huffman et al.: Fluorescent biological aerosol particle concentrations and size distributions
20
15
(a) MT,c
MeanMedian
4(b) MF,c
0.5
0.4
(c) MF,c / MT,c
15
10
5M
T,c (μg
/ m
3 )
Median3
2
1
MF,
c (μg
/ m
3 )
0.3
0.2
0.1
MF,
c / M
T,c
0Aug Sep Oct Nov Campaign
0Aug Sep Oct Nov Campaign
0.1
0Aug Sep Oct Nov Campaign
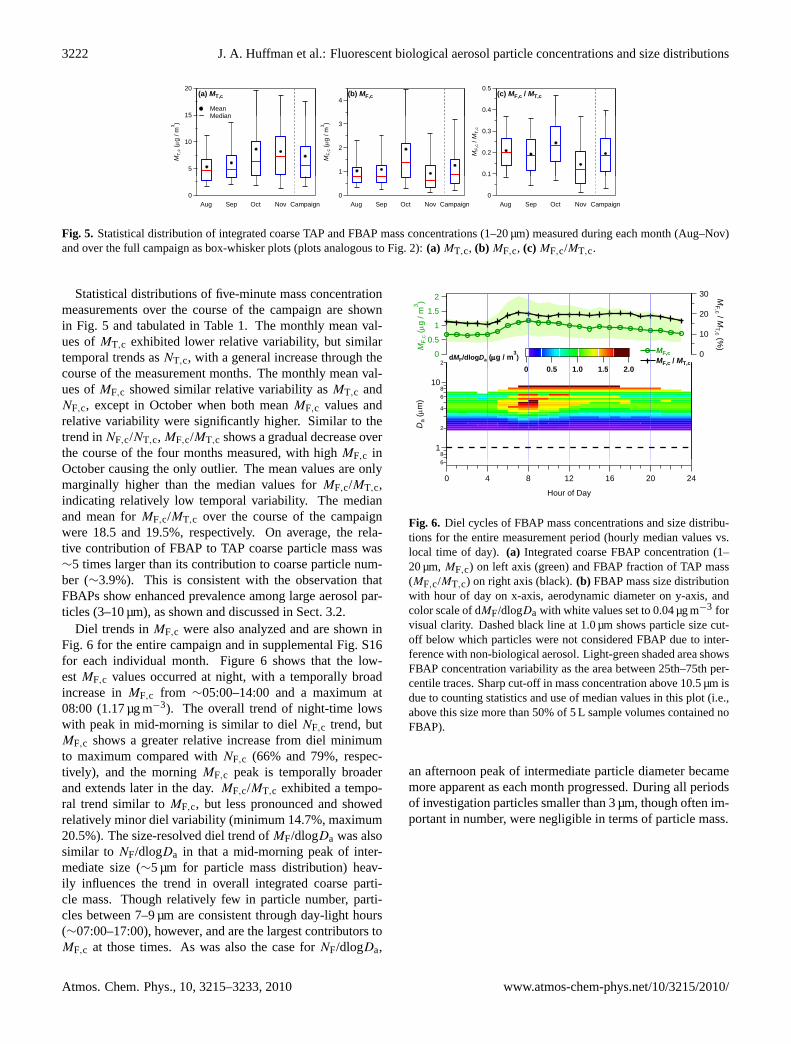
Fig. 5. Statistical distribution of integrated coarse TAP and FBAP mass concentrations (1–20 µm) measured during each month (Aug–Nov)and over the full campaign as box-whisker plots (plots analogous to Fig. 2):(a) MT,c, (b) MF,c, (c) MF,c/MT,c.
Statistical distributions of five-minute mass concentrationmeasurements over the course of the campaign are shownin Fig. 5 and tabulated in Table 1. The monthly mean val-ues ofMT,c exhibited lower relative variability, but similartemporal trends asNT,c, with a general increase through thecourse of the measurement months. The monthly mean val-ues ofMF,c showed similar relative variability asMT,c andNF,c, except in October when both meanMF,c values andrelative variability were significantly higher. Similar to thetrend inNF,c/NT,c, MF,c/MT,c shows a gradual decrease overthe course of the four months measured, with highMF,c inOctober causing the only outlier. The mean values are onlymarginally higher than the median values forMF,c/MT,c,indicating relatively low temporal variability. The medianand mean forMF,c/MT,c over the course of the campaignwere 18.5 and 19.5%, respectively. On average, the rela-tive contribution of FBAP to TAP coarse particle mass was∼5 times larger than its contribution to coarse particle num-ber (∼3.9%). This is consistent with the observation thatFBAPs show enhanced prevalence among large aerosol par-ticles (3–10 µm), as shown and discussed in Sect. 3.2.
Diel trends inMF,c were also analyzed and are shown inFig. 6 for the entire campaign and in supplemental Fig. S16for each individual month. Figure 6 shows that the low-estMF,c values occurred at night, with a temporally broadincrease inMF,c from ∼05:00–14:00 and a maximum at08:00 (1.17 µg m−3). The overall trend of night-time lowswith peak in mid-morning is similar to dielNF,c trend, butMF,c shows a greater relative increase from diel minimumto maximum compared withNF,c (66% and 79%, respec-tively), and the morningMF,c peak is temporally broaderand extends later in the day.MF,c/MT,c exhibited a tempo-ral trend similar toMF,c, but less pronounced and showedrelatively minor diel variability (minimum 14.7%, maximum20.5%). The size-resolved diel trend ofMF/dlogDa was alsosimilar to NF/dlogDa in that a mid-morning peak of inter-mediate size (∼5 µm for particle mass distribution) heav-ily influences the trend in overall integrated coarse parti-cle mass. Though relatively few in particle number, parti-cles between 7–9 µm are consistent through day-light hours(∼07:00–17:00), however, and are the largest contributors toMF,c at those times. As was also the case forNF/dlogDa,
2
1.5
1g / m
3 )
30
20
MF,c / M
1
0.5
0
MF,
c (μg
10
0
MT,c (%
)
22 01 51 00 50
dMF/dlogDa (μg / m3)
MF,cMF,c / MT,c
4
68
10
μm)
2.01.51.00.50
81
2Da
(μ
24201612840
Hour of Day
6
Fig. 6. Diel cycles of FBAP mass concentrations and size distribu-tions for the entire measurement period (hourly median values vs.local time of day). (a) Integrated coarse FBAP concentration (1–20 µm,MF,c) on left axis (green) and FBAP fraction of TAP mass(MF,c/MT,c) on right axis (black).(b) FBAP mass size distributionwith hour of day on x-axis, aerodynamic diameter on y-axis, andcolor scale of dMF/dlogDa with white values set to 0.04 µg m−3 forvisual clarity. Dashed black line at 1.0 µm shows particle size cut-off below which particles were not considered FBAP due to inter-ference with non-biological aerosol. Light-green shaded area showsFBAP concentration variability as the area between 25th–75th per-centile traces. Sharp cut-off in mass concentration above 10.5 µm isdue to counting statistics and use of median values in this plot (i.e.,above this size more than 50% of 5 L sample volumes contained noFBAP).
an afternoon peak of intermediate particle diameter becamemore apparent as each month progressed. During all periodsof investigation particles smaller than 3 µm, though often im-portant in number, were negligible in terms of particle mass.
Atmos. Chem. Phys., 10, 3215–3233, 2010 www.atmos-chem-phys.net/10/3215/2010/
J. A. Huffman et al.: Fluorescent biological aerosol particle concentrations and size distributions 3223
103
NF,c
100
m-3
) (a) Period 1: 13 Aug 01:08 - 10:030.25
(b) Mean Median
10-1 101
/ NT,c (%
)10-4
10-2
NF,
c (cm
40.120.080.040
NF,cNF,c / NT,c
dNF/dlogDa (cm-3)
0.2
0.15
ogD
a (c
m-3
)
Median 25 - 75th Percent. 5 - 95th Percent.
61
2
46
102
Da
(μm
)
0.1
0.05
0
dNF/
dlo
12:00 AM8/13
6:00 AM 12:00 PM 6:00 PMDate
6
1 103
NF,c / N
T10-2
100
,c (c
m-3
) (c) Period 2: 2 Sept 18:40 - 3 Sept 06:45
05 6 7 8 9
12 3 4 5 6 7 8 9
102
Da (μm)0.25
0 2
(d) Mean Median25 - 75th Percent
10-1 101 T,c (%
)10-4 N
F,
2
4
)
0.120.080.040
NF,cNF,c / NT,c
dNF/dlogDa (cm-3)
0.2
0.15
0.1
F/dl
ogD
a (c
m-3
)
25 75 Percent. 5 - 95th Percent.
12:00 PM 6:00 PM 12:00 AM 6:00 AM
61
2
46
10
Da
(μm
)
0.05
0
dNF
5 6 7 8 91
2 3 4 5 6 7 8 910
212:00 PM
9/26:00 PM 12:00 AM
9/36:00 AM
Date1 10
Da (μm)
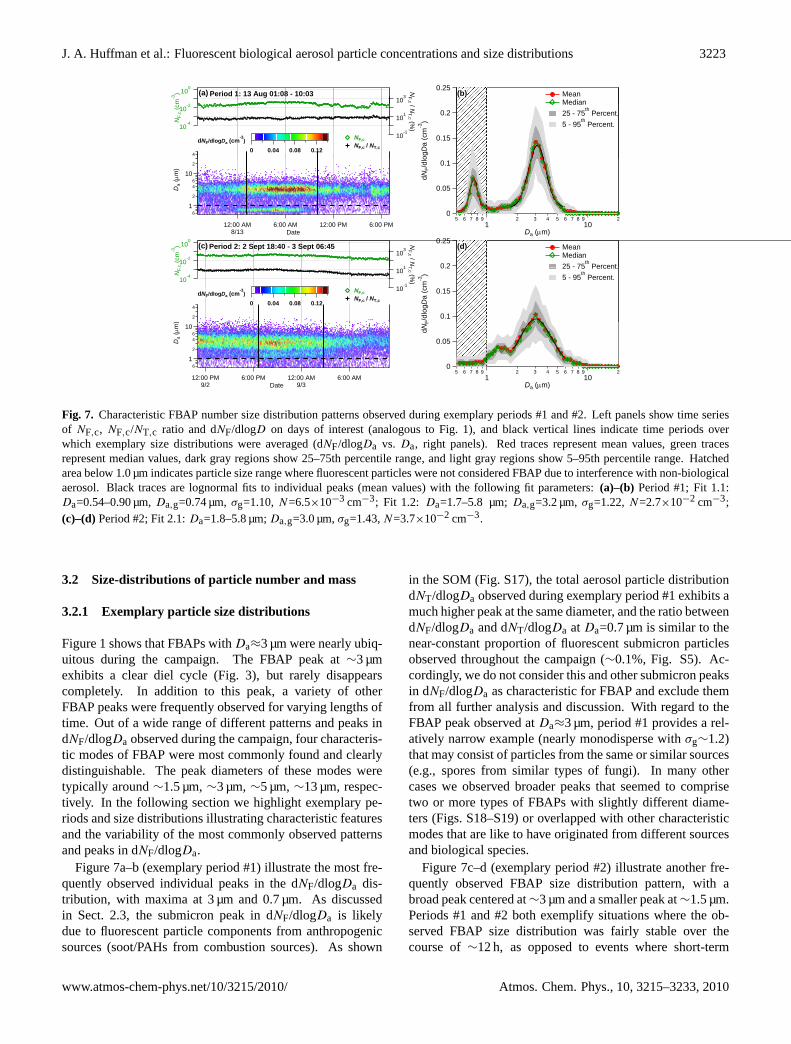
Fig. 7. Characteristic FBAP number size distribution patterns observed during exemplary periods #1 and #2. Left panels show time seriesof NF,c, NF,c/NT,c ratio and dNF/dlogD on days of interest (analogous to Fig. 1), and black vertical lines indicate time periods overwhich exemplary size distributions were averaged (dNF/dlogDa vs. Da, right panels). Red traces represent mean values, green tracesrepresent median values, dark gray regions show 25–75th percentile range, and light gray regions show 5–95th percentile range. Hatchedarea below 1.0 µm indicates particle size range where fluorescent particles were not considered FBAP due to interference with non-biologicalaerosol. Black traces are lognormal fits to individual peaks (mean values) with the following fit parameters:(a)–(b) Period #1; Fit 1.1:Da=0.54–0.90 µm,Da,g=0.74 µm,σg=1.10,N=6.5×10⁻³ cm−3; Fit 1.2: Da=1.7–5.8 µm;Da,g=3.2 µm,σg=1.22,N=2.7×10⁻² cm−3;(c)–(d)Period #2; Fit 2.1:Da=1.8–5.8 µm;Da,g=3.0 µm,σg=1.43,N=3.7×10⁻² cm−3.
3.2 Size-distributions of particle number and mass
3.2.1 Exemplary particle size distributions
Figure 1 shows that FBAPs withDa≈3 µm were nearly ubiq-uitous during the campaign. The FBAP peak at∼3 µmexhibits a clear diel cycle (Fig. 3), but rarely disappearscompletely. In addition to this peak, a variety of otherFBAP peaks were frequently observed for varying lengths oftime. Out of a wide range of different patterns and peaks indNF/dlogDa observed during the campaign, four characteris-tic modes of FBAP were most commonly found and clearlydistinguishable. The peak diameters of these modes weretypically around∼1.5 µm,∼3 µm,∼5 µm,∼13 µm, respec-tively. In the following section we highlight exemplary pe-riods and size distributions illustrating characteristic featuresand the variability of the most commonly observed patternsand peaks in dNF/dlogDa.
Figure 7a–b (exemplary period #1) illustrate the most fre-quently observed individual peaks in the dNF/dlogDa dis-tribution, with maxima at 3 µm and 0.7 µm. As discussedin Sect. 2.3, the submicron peak in dNF/dlogDa is likelydue to fluorescent particle components from anthropogenicsources (soot/PAHs from combustion sources). As shown
in the SOM (Fig. S17), the total aerosol particle distributiondNT/dlogDa observed during exemplary period #1 exhibits amuch higher peak at the same diameter, and the ratio betweendNF/dlogDa and dNT/dlogDa at Da=0.7 µm is similar to thenear-constant proportion of fluorescent submicron particlesobserved throughout the campaign (∼0.1%, Fig. S5). Ac-cordingly, we do not consider this and other submicron peaksin dNF/dlogDa as characteristic for FBAP and exclude themfrom all further analysis and discussion. With regard to theFBAP peak observed atDa≈3 µm, period #1 provides a rel-atively narrow example (nearly monodisperse withσg∼1.2)that may consist of particles from the same or similar sources(e.g., spores from similar types of fungi). In many othercases we observed broader peaks that seemed to comprisetwo or more types of FBAPs with slightly different diame-ters (Figs. S18–S19) or overlapped with other characteristicmodes that are like to have originated from different sourcesand biological species.
Figure 7c–d (exemplary period #2) illustrate another fre-quently observed FBAP size distribution pattern, with abroad peak centered at∼3 µm and a smaller peak at∼1.5 µm.Periods #1 and #2 both exemplify situations where the ob-served FBAP size distribution was fairly stable over thecourse of∼12 h, as opposed to events where short-term
www.atmos-chem-phys.net/10/3215/2010/ Atmos. Chem. Phys., 10, 3215–3233, 2010
3224 J. A. Huffman et al.: Fluorescent biological aerosol particle concentrations and size distributions
103
NF,c
100
m-3
) (a)Period 3: 13 Sept 08:57 - 13:370.16
0 14(b)
Mean
10-1 101
/ NT,c (%
)10-4
10-2
NF,
c (cm
40.120.080.040
NF,cNF,c / NT,c
dNF/dlogDa (cm-3)
0.14
0.12
0.1
0.08
ogD
a (c
m-3
)
Mean Median 25 - 75th Percent. 5 - 95th Percent.
61
2
46
102
Da
(μm
) 0.06
0.04
0.02
0
dNF/
dlo
12:00 AM9/13
6:00 AM 12:00 PM 6:00 PM 12:00 AM9/14Date
6 05 6 7 8 9
12 3 4 5 6 7 8 9
102
Da (μm)
1 103
NF,c / N
T10-2
100
,c (c
m-3
) (c) Period 4: 17 Aug 07:04 - 07:390.5
0 4
(d) Mean Median25 - 75th Percent
10-1 101 T,c (%
)10-4 N
F,
2
4
)
0.120.080.040
NF,cNF,c / NT,c
dNF/dlogDa (cm-3)
0.4
0.3
0.2
F/dl
ogD
a (c
m-3
)
25 75 Percent. 5 - 95th Percent.
12:00 AM 6:00 AM 12:00 PM 6:00 PM 12:00 AM
61
2
46
10
Da
(μm
)
0.1
0
dNF
5 6 7 8 91
2 3 4 5 6 7 8 910
212:00 AM
8/176:00 AM 12:00 PM 6:00 PM 12:00 AM
8/18Date1 10
Da (μm)
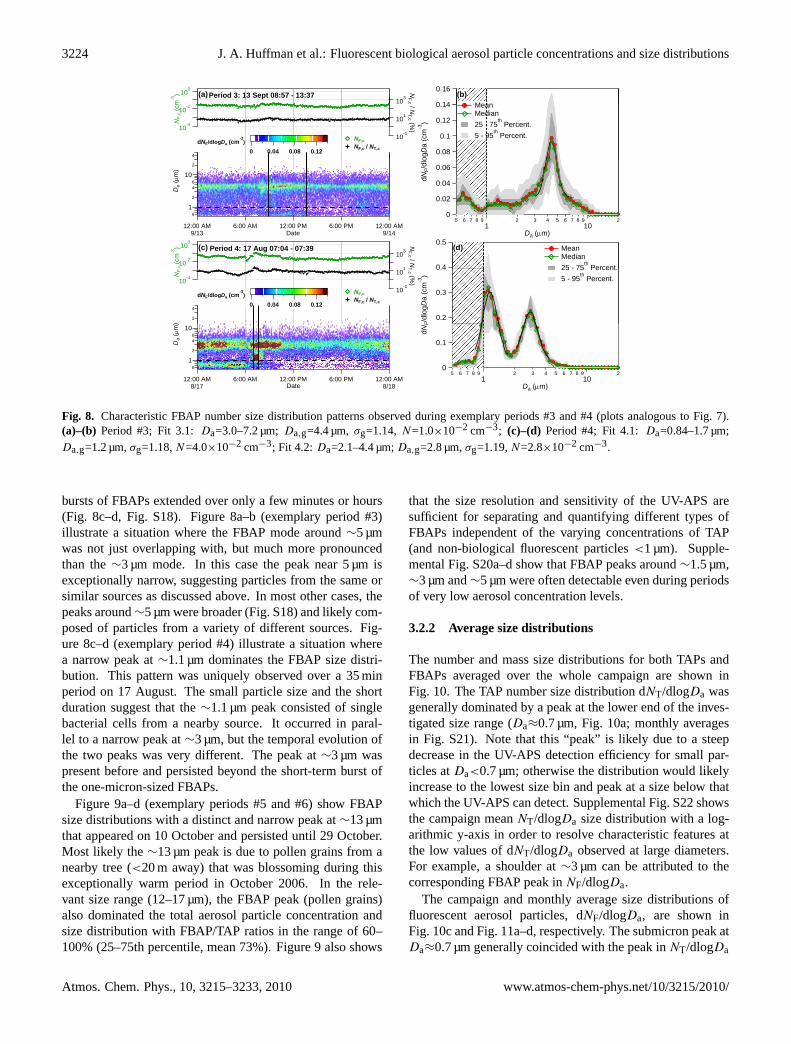
Fig. 8. Characteristic FBAP number size distribution patterns observed during exemplary periods #3 and #4 (plots analogous to Fig. 7).(a)–(b) Period #3; Fit 3.1:Da=3.0–7.2 µm;Da,g=4.4 µm,σg=1.14, N=1.0×10⁻² cm−3; (c)–(d) Period #4; Fit 4.1:Da=0.84–1.7 µm;Da,g=1.2 µm,σg=1.18,N=4.0×10⁻² cm−3; Fit 4.2: Da=2.1–4.4 µm;Da,g=2.8 µm,σg=1.19,N=2.8×10⁻² cm−3.
bursts of FBAPs extended over only a few minutes or hours(Fig. 8c–d, Fig. S18). Figure 8a–b (exemplary period #3)illustrate a situation where the FBAP mode around∼5 µmwas not just overlapping with, but much more pronouncedthan the∼3 µm mode. In this case the peak near 5 µm isexceptionally narrow, suggesting particles from the same orsimilar sources as discussed above. In most other cases, thepeaks around∼5 µm were broader (Fig. S18) and likely com-posed of particles from a variety of different sources. Fig-ure 8c–d (exemplary period #4) illustrate a situation wherea narrow peak at∼1.1 µm dominates the FBAP size distri-bution. This pattern was uniquely observed over a 35 minperiod on 17 August. The small particle size and the shortduration suggest that the∼1.1 µm peak consisted of singlebacterial cells from a nearby source. It occurred in paral-lel to a narrow peak at∼3 µm, but the temporal evolution ofthe two peaks was very different. The peak at∼3 µm waspresent before and persisted beyond the short-term burst ofthe one-micron-sized FBAPs.
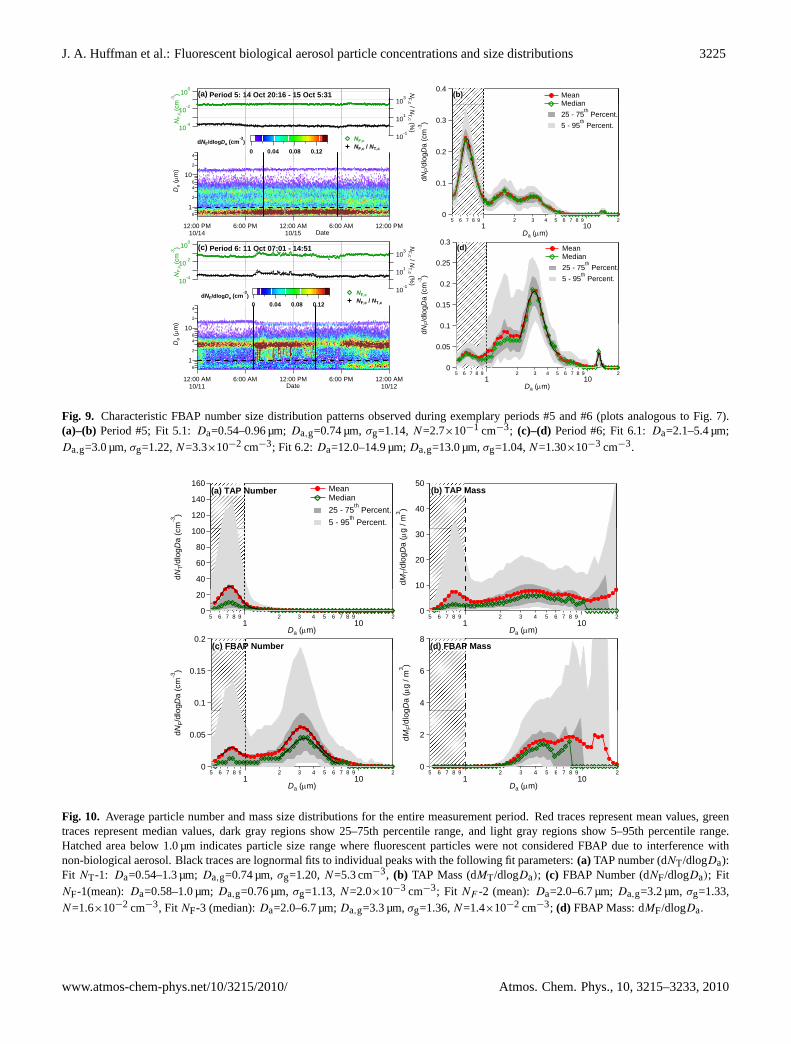
Figure 9a–d (exemplary periods #5 and #6) show FBAPsize distributions with a distinct and narrow peak at∼13 µmthat appeared on 10 October and persisted until 29 October.Most likely the∼13 µm peak is due to pollen grains from anearby tree (<20 m away) that was blossoming during thisexceptionally warm period in October 2006. In the rele-vant size range (12–17 µm), the FBAP peak (pollen grains)also dominated the total aerosol particle concentration andsize distribution with FBAP/TAP ratios in the range of 60–100% (25–75th percentile, mean 73%). Figure 9 also shows
that the size resolution and sensitivity of the UV-APS aresufficient for separating and quantifying different types ofFBAPs independent of the varying concentrations of TAP(and non-biological fluorescent particles<1 µm). Supple-mental Fig. S20a–d show that FBAP peaks around∼1.5 µm,∼3 µm and∼5 µm were often detectable even during periodsof very low aerosol concentration levels.
3.2.2 Average size distributions
The number and mass size distributions for both TAPs andFBAPs averaged over the whole campaign are shown inFig. 10. The TAP number size distribution dNT/dlogDa wasgenerally dominated by a peak at the lower end of the inves-tigated size range (Da≈0.7 µm, Fig. 10a; monthly averagesin Fig. S21). Note that this “peak” is likely due to a steepdecrease in the UV-APS detection efficiency for small par-ticles atDa<0.7 µm; otherwise the distribution would likelyincrease to the lowest size bin and peak at a size below thatwhich the UV-APS can detect. Supplemental Fig. S22 showsthe campaign meanNT/dlogDa size distribution with a log-arithmic y-axis in order to resolve characteristic features atthe low values of dNT/dlogDa observed at large diameters.For example, a shoulder at∼3 µm can be attributed to thecorresponding FBAP peak inNF/dlogDa.
The campaign and monthly average size distributions offluorescent aerosol particles, dNF/dlogDa, are shown inFig. 10c and Fig. 11a–d, respectively. The submicron peak atDa≈0.7 µm generally coincided with the peak inNT/dlogDa
Atmos. Chem. Phys., 10, 3215–3233, 2010 www.atmos-chem-phys.net/10/3215/2010/
J. A. Huffman et al.: Fluorescent biological aerosol particle concentrations and size distributions 3225
103
NF,c
100
m-3
) (a) Period 5: 14 Oct 20:16 - 15 Oct 5:310.4
(b) Mean Median
10-1 101
/ NT,c (%
)10-4
10-2
NF,
c (cm
40.120.080.040
NF,cNF,c / NT,c
dNF/dlogDa (cm-3)
0.3
0.2
ogD
a (c
m-3
)
Median 25 - 75th Percent. 5 - 95th Percent.
61
2
46
102
Da
(μm
)0.1
0
dNF/
dlo
12:00 PM10/14
6:00 PM 12:00 AM10/15
6:00 AM 12:00 PMDate
6 05 6 7 8 9
12 3 4 5 6 7 8 9
102
Da (μm)
1 103
NF,c / N
T10-2
100
,c (c
m-3
) Period 6: 11 Oct 07:01 - 14:51(c)0.3
0.25
(d) Mean Median25 - 75th Percent
10-1 101 T,c (%
)10-4 N
F,
2
4
)
0.120.080.040
NF,cNF,c / NT,c
dNF/dlogDa (cm-3)
0.2
0.15
0 1F/dl
ogD
a (c
m-3
)
25 75 Percent. 5 - 95th Percent.
12:00 AM 6:00 AM 12:00 PM 6:00 PM 12:00 AM
61
2
46
10
Da
(μm
) 0.1
0.05
0
dNF
5 6 7 8 91
2 3 4 5 6 7 8 910
212:00 AM
10/116:00 AM 12:00 PM 6:00 PM 12:00 AM
10/12Date1 10
Da (μm)
Fig. 9. Characteristic FBAP number size distribution patterns observed during exemplary periods #5 and #6 (plots analogous to Fig. 7).(a)–(b) Period #5; Fit 5.1:Da=0.54–0.96 µm;Da,g=0.74 µm,σg=1.14,N=2.7×10⁻¹ cm−3; (c)–(d) Period #6; Fit 6.1:Da=2.1–5.4 µm;Da,g=3.0 µm,σg=1.22,N=3.3×10⁻² cm−3; Fit 6.2: Da=12.0–14.9 µm;Da,g=13.0 µm,σg=1.04,N=1.30×10⁻³ cm−3.
160
140
120
100m-3
)
Mean Median 25 - 75th Percent. 5 - 95th Percent.
(a) TAP Number50
40
/ m
3 )
(b) TAP Mass
100
80
60
40dNT/
dlog
Da
(c 30
20
10dMT/
dlog
Da
(μg
20
05 6 7 8 9
12 3 4 5 6 7 8 9
102
Da (μm)
05 6 7 8 9
12 3 4 5 6 7 8 9
102
Da (μm)0.2
(c) FBAP Number8
(d) FBAP Mass
0.15
0.1
ogD
a (c
m-3
)
( )
6
4
gDa
(μg
/ m3 )
( )
0.05
0
dNF/
dlo
5 6 7 8 9 2 3 4 5 6 7 8 9 2
2
0
dMF/
dlog
5 6 7 8 9 2 3 4 5 6 7 8 9 25 6 7 8 91
2 3 4 5 6 7 8 910
2
Da (μm)
5 6 7 8 91
2 3 4 5 6 7 8 910
2
Da (μm)
Fig. 10. Average particle number and mass size distributions for the entire measurement period. Red traces represent mean values, greentraces represent median values, dark gray regions show 25–75th percentile range, and light gray regions show 5–95th percentile range.Hatched area below 1.0 µm indicates particle size range where fluorescent particles were not considered FBAP due to interference withnon-biological aerosol. Black traces are lognormal fits to individual peaks with the following fit parameters:(a) TAP number (dNT/dlogDa):Fit NT-1: Da=0.54–1.3 µm;Da,g=0.74 µm,σg=1.20,N=5.3 cm−3, (b) TAP Mass (dMT/dlogDa); (c) FBAP Number (dNF/dlogDa); FitNF-1(mean):Da=0.58–1.0 µm;Da,g=0.76 µm,σg=1.13,N=2.0×10⁻³ cm−3; Fit NF -2 (mean):Da=2.0–6.7 µm;Da,g=3.2 µm,σg=1.33,N=1.6×10⁻² cm−3, Fit NF-3 (median):Da=2.0–6.7 µm;Da,g=3.3 µm,σg=1.36,N=1.4×10⁻² cm−3; (d) FBAP Mass: dMF/dlogDa.
www.atmos-chem-phys.net/10/3215/2010/ Atmos. Chem. Phys., 10, 3215–3233, 2010
3226 J. A. Huffman et al.: Fluorescent biological aerosol particle concentrations and size distributions
0.2
0.15
m-3
)
(a) August0.2
0.15
m-3
)
(b) September
0.1
0.05dNF/
dlog
Da
(c
0.1
0.05dNF/
dlog
Da
(c
05 6 7 8 9
12 3 4 5 6 7 8 9
102
Da (μm)
05 6 7 8 9
12 3 4 5 6 7 8 9
102
Da (μm)0.2
(c) October0.2
(d) November
0.15
0.1
ogD
a (c
m-3
)
( )
0.15
0.1
ogD
a (c
m-3
)
( )
0.05
0
dNF/
dlo
5 6 7 8 9 2 3 4 5 6 7 8 9 2
0.05
0
dNF/
dlo
5 6 7 8 9 2 3 4 5 6 7 8 9 25 6 7 8 91
2 3 4 5 6 7 8 910
2
Da (μm)
5 6 7 8 91
2 3 4 5 6 7 8 910
2
Da (μm)
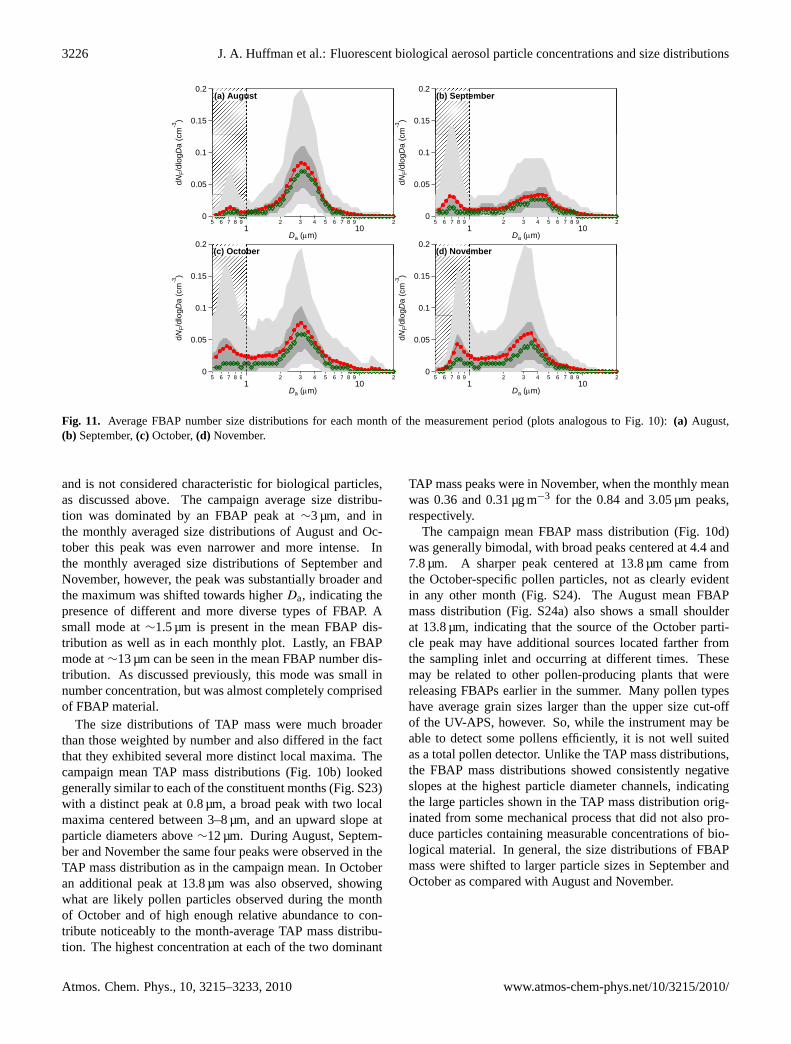
Fig. 11. Average FBAP number size distributions for each month of the measurement period (plots analogous to Fig. 10):(a) August,(b) September,(c) October,(d) November.
and is not considered characteristic for biological particles,as discussed above. The campaign average size distribu-tion was dominated by an FBAP peak at∼3 µm, and inthe monthly averaged size distributions of August and Oc-tober this peak was even narrower and more intense. Inthe monthly averaged size distributions of September andNovember, however, the peak was substantially broader andthe maximum was shifted towards higherDa, indicating thepresence of different and more diverse types of FBAP. Asmall mode at∼1.5 µm is present in the mean FBAP dis-tribution as well as in each monthly plot. Lastly, an FBAPmode at∼13 µm can be seen in the mean FBAP number dis-tribution. As discussed previously, this mode was small innumber concentration, but was almost completely comprisedof FBAP material.
The size distributions of TAP mass were much broaderthan those weighted by number and also differed in the factthat they exhibited several more distinct local maxima. Thecampaign mean TAP mass distributions (Fig. 10b) lookedgenerally similar to each of the constituent months (Fig. S23)with a distinct peak at 0.8 µm, a broad peak with two localmaxima centered between 3–8 µm, and an upward slope atparticle diameters above∼12 µm. During August, Septem-ber and November the same four peaks were observed in theTAP mass distribution as in the campaign mean. In Octoberan additional peak at 13.8 µm was also observed, showingwhat are likely pollen particles observed during the monthof October and of high enough relative abundance to con-tribute noticeably to the month-average TAP mass distribu-tion. The highest concentration at each of the two dominant
TAP mass peaks were in November, when the monthly meanwas 0.36 and 0.31 µg m−3 for the 0.84 and 3.05 µm peaks,respectively.
The campaign mean FBAP mass distribution (Fig. 10d)was generally bimodal, with broad peaks centered at 4.4 and7.8 µm. A sharper peak centered at 13.8 µm came fromthe October-specific pollen particles, not as clearly evidentin any other month (Fig. S24). The August mean FBAPmass distribution (Fig. S24a) also shows a small shoulderat 13.8 µm, indicating that the source of the October parti-cle peak may have additional sources located farther fromthe sampling inlet and occurring at different times. Thesemay be related to other pollen-producing plants that werereleasing FBAPs earlier in the summer. Many pollen typeshave average grain sizes larger than the upper size cut-offof the UV-APS, however. So, while the instrument may beable to detect some pollens efficiently, it is not well suitedas a total pollen detector. Unlike the TAP mass distributions,the FBAP mass distributions showed consistently negativeslopes at the highest particle diameter channels, indicatingthe large particles shown in the TAP mass distribution orig-inated from some mechanical process that did not also pro-duce particles containing measurable concentrations of bio-logical material. In general, the size distributions of FBAPmass were shifted to larger particle sizes in September andOctober as compared with August and November.
Atmos. Chem. Phys., 10, 3215–3233, 2010 www.atmos-chem-phys.net/10/3215/2010/
J. A. Huffman et al.: Fluorescent biological aerosol particle concentrations and size distributions 3227
3.2.3 Ratio of fluorescent bioparticles to total particles
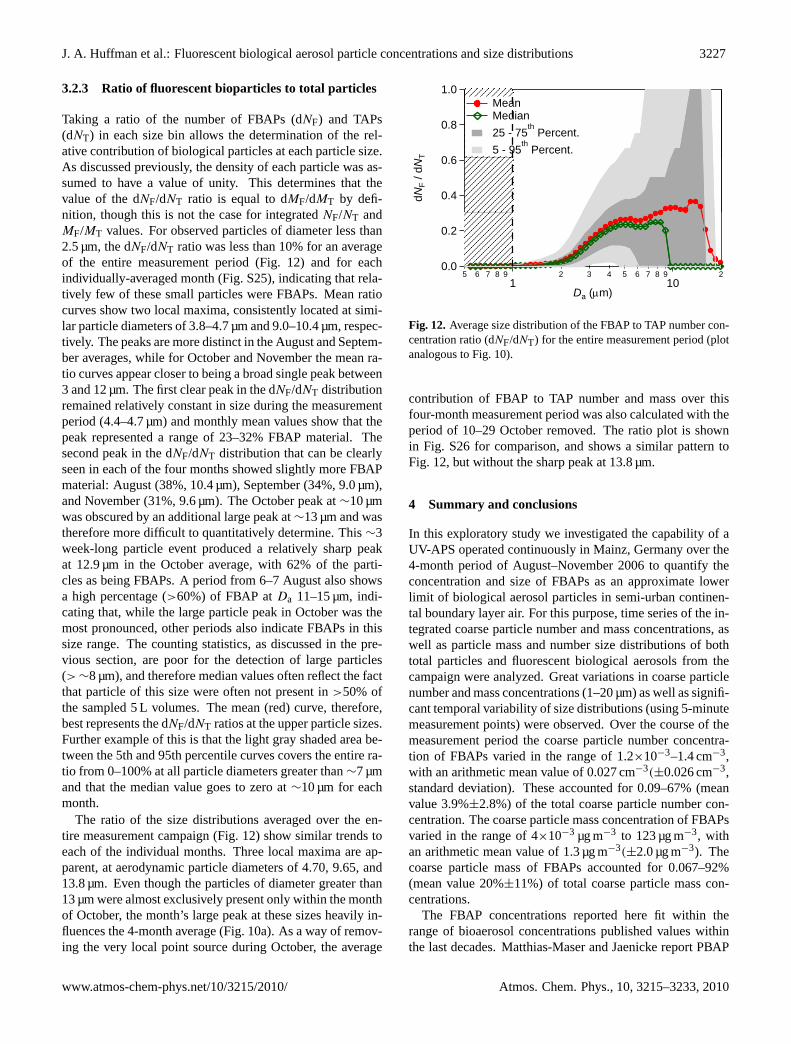
Taking a ratio of the number of FBAPs (dNF) and TAPs(dNT) in each size bin allows the determination of the rel-ative contribution of biological particles at each particle size.As discussed previously, the density of each particle was as-sumed to have a value of unity. This determines that thevalue of the dNF/dNT ratio is equal to dMF/dMT by defi-nition, though this is not the case for integratedNF/NT andMF/MT values. For observed particles of diameter less than2.5 µm, the dNF/dNT ratio was less than 10% for an averageof the entire measurement period (Fig. 12) and for eachindividually-averaged month (Fig. S25), indicating that rela-tively few of these small particles were FBAPs. Mean ratiocurves show two local maxima, consistently located at simi-lar particle diameters of 3.8–4.7 µm and 9.0–10.4 µm, respec-tively. The peaks are more distinct in the August and Septem-ber averages, while for October and November the mean ra-tio curves appear closer to being a broad single peak between3 and 12 µm. The first clear peak in the dNF/dNT distributionremained relatively constant in size during the measurementperiod (4.4–4.7 µm) and monthly mean values show that thepeak represented a range of 23–32% FBAP material. Thesecond peak in the dNF/dNT distribution that can be clearlyseen in each of the four months showed slightly more FBAPmaterial: August (38%, 10.4 µm), September (34%, 9.0 µm),and November (31%, 9.6 µm). The October peak at∼10 µmwas obscured by an additional large peak at∼13 µm and wastherefore more difficult to quantitatively determine. This∼3week-long particle event produced a relatively sharp peakat 12.9 µm in the October average, with 62% of the parti-cles as being FBAPs. A period from 6–7 August also showsa high percentage (>60%) of FBAP atDa 11–15 µm, indi-cating that, while the large particle peak in October was themost pronounced, other periods also indicate FBAPs in thissize range. The counting statistics, as discussed in the pre-vious section, are poor for the detection of large particles(> ∼8 µm), and therefore median values often reflect the factthat particle of this size were often not present in>50% ofthe sampled 5 L volumes. The mean (red) curve, therefore,best represents the dNF/dNT ratios at the upper particle sizes.Further example of this is that the light gray shaded area be-tween the 5th and 95th percentile curves covers the entire ra-tio from 0–100% at all particle diameters greater than∼7 µmand that the median value goes to zero at∼10 µm for eachmonth.
The ratio of the size distributions averaged over the en-tire measurement campaign (Fig. 12) show similar trends toeach of the individual months. Three local maxima are ap-parent, at aerodynamic particle diameters of 4.70, 9.65, and13.8 µm. Even though the particles of diameter greater than13 µm were almost exclusively present only within the monthof October, the month’s large peak at these sizes heavily in-fluences the 4-month average (Fig. 10a). As a way of remov-ing the very local point source during October, the average
1.0Mean
0.8
0 6T
Mean Median 25 - 75th Percent. 5 - 95th Percent.
0.6
0.4dNF
/ dN
T
0.2
0 00.05 6 7 8 9
12 3 4 5 6 7 8 9
102
Da (μm)
Fig. 12.Average size distribution of the FBAP to TAP number con-centration ratio (dNF/dNT) for the entire measurement period (plotanalogous to Fig. 10).
contribution of FBAP to TAP number and mass over thisfour-month measurement period was also calculated with theperiod of 10–29 October removed. The ratio plot is shownin Fig. S26 for comparison, and shows a similar pattern toFig. 12, but without the sharp peak at 13.8 µm.
4 Summary and conclusions
In this exploratory study we investigated the capability of aUV-APS operated continuously in Mainz, Germany over the4-month period of August–November 2006 to quantify theconcentration and size of FBAPs as an approximate lowerlimit of biological aerosol particles in semi-urban continen-tal boundary layer air. For this purpose, time series of the in-tegrated coarse particle number and mass concentrations, aswell as particle mass and number size distributions of bothtotal particles and fluorescent biological aerosols from thecampaign were analyzed. Great variations in coarse particlenumber and mass concentrations (1–20 µm) as well as signifi-cant temporal variability of size distributions (using 5-minutemeasurement points) were observed. Over the course of themeasurement period the coarse particle number concentra-tion of FBAPs varied in the range of 1.2×10⁻³–1.4 cm−3,with an arithmetic mean value of 0.027 cm−3(±0.026 cm−3,standard deviation). These accounted for 0.09–67% (meanvalue 3.9%±2.8%) of the total coarse particle number con-centration. The coarse particle mass concentration of FBAPsvaried in the range of 4×10⁻³ µg m−3 to 123 µg m−3, withan arithmetic mean value of 1.3 µg m−3(±2.0 µg m−3). Thecoarse particle mass of FBAPs accounted for 0.067–92%(mean value 20%±11%) of total coarse particle mass con-centrations.
The FBAP concentrations reported here fit within therange of bioaerosol concentrations published values withinthe last decades. Matthias-Maser and Jaenicke report PBAP
www.atmos-chem-phys.net/10/3215/2010/ Atmos. Chem. Phys., 10, 3215–3233, 2010
3228 J. A. Huffman et al.: Fluorescent biological aerosol particle concentrations and size distributions
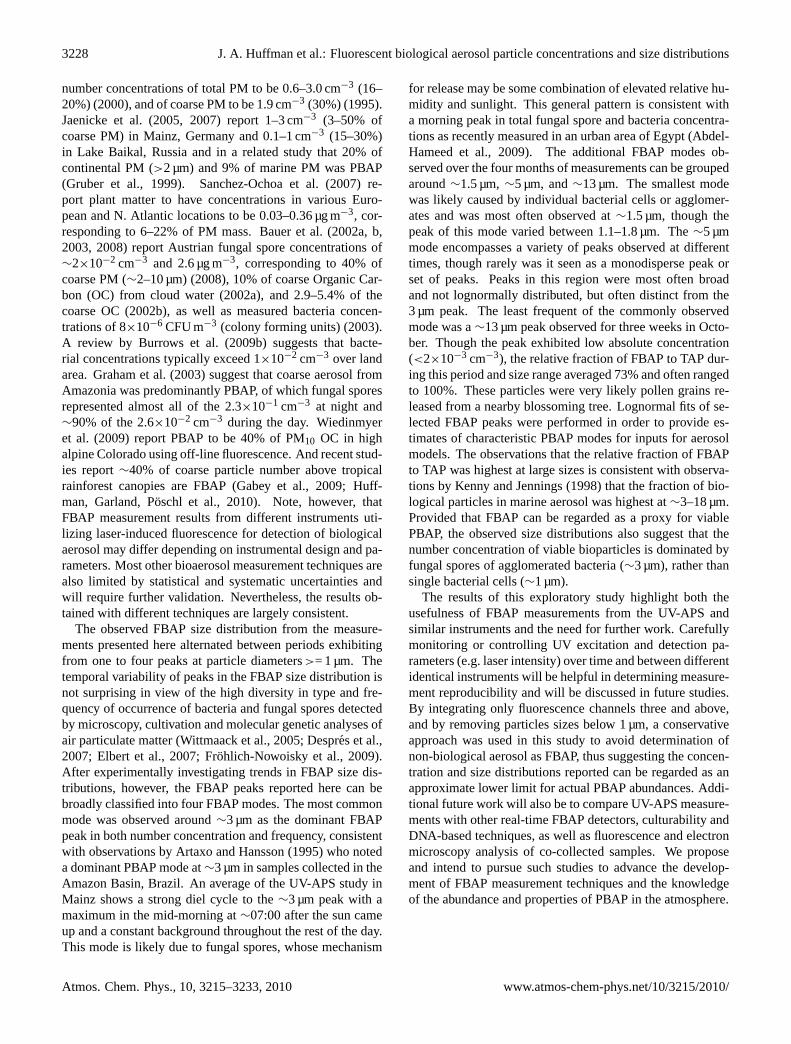
number concentrations of total PM to be 0.6–3.0 cm−3 (16–20%) (2000), and of coarse PM to be 1.9 cm−3 (30%) (1995).Jaenicke et al. (2005, 2007) report 1–3 cm−3 (3–50% ofcoarse PM) in Mainz, Germany and 0.1–1 cm−3 (15–30%)in Lake Baikal, Russia and in a related study that 20% ofcontinental PM (>2 µm) and 9% of marine PM was PBAP(Gruber et al., 1999). Sanchez-Ochoa et al. (2007) re-port plant matter to have concentrations in various Euro-pean and N. Atlantic locations to be 0.03–0.36 µg m−3, cor-responding to 6–22% of PM mass. Bauer et al. (2002a, b,2003, 2008) report Austrian fungal spore concentrations of∼2×10⁻² cm−3 and 2.6 µg m−3, corresponding to 40% ofcoarse PM (∼2–10 µm) (2008), 10% of coarse Organic Car-bon (OC) from cloud water (2002a), and 2.9–5.4% of thecoarse OC (2002b), as well as measured bacteria concen-trations of 8×10⁻⁶ CFU m−3 (colony forming units) (2003).A review by Burrows et al. (2009b) suggests that bacte-rial concentrations typically exceed 1×10⁻² cm−3 over landarea. Graham et al. (2003) suggest that coarse aerosol fromAmazonia was predominantly PBAP, of which fungal sporesrepresented almost all of the 2.3×10⁻¹ cm−3 at night and∼90% of the 2.6×10⁻² cm−3 during the day. Wiedinmyeret al. (2009) report PBAP to be 40% of PM10 OC in highalpine Colorado using off-line fluorescence. And recent stud-ies report∼40% of coarse particle number above tropicalrainforest canopies are FBAP (Gabey et al., 2009; Huff-man, Garland, Poschl et al., 2010). Note, however, thatFBAP measurement results from different instruments uti-lizing laser-induced fluorescence for detection of biologicalaerosol may differ depending on instrumental design and pa-rameters. Most other bioaerosol measurement techniques arealso limited by statistical and systematic uncertainties andwill require further validation. Nevertheless, the results ob-tained with different techniques are largely consistent.
The observed FBAP size distribution from the measure-ments presented here alternated between periods exhibitingfrom one to four peaks at particle diameters>= 1 µm. Thetemporal variability of peaks in the FBAP size distribution isnot surprising in view of the high diversity in type and fre-quency of occurrence of bacteria and fungal spores detectedby microscopy, cultivation and molecular genetic analyses ofair particulate matter (Wittmaack et al., 2005; Despres et al.,2007; Elbert et al., 2007; Frohlich-Nowoisky et al., 2009).After experimentally investigating trends in FBAP size dis-tributions, however, the FBAP peaks reported here can bebroadly classified into four FBAP modes. The most commonmode was observed around∼3 µm as the dominant FBAPpeak in both number concentration and frequency, consistentwith observations by Artaxo and Hansson (1995) who noteda dominant PBAP mode at∼3 µm in samples collected in theAmazon Basin, Brazil. An average of the UV-APS study inMainz shows a strong diel cycle to the∼3 µm peak with amaximum in the mid-morning at∼07:00 after the sun cameup and a constant background throughout the rest of the day.This mode is likely due to fungal spores, whose mechanism
for release may be some combination of elevated relative hu-midity and sunlight. This general pattern is consistent witha morning peak in total fungal spore and bacteria concentra-tions as recently measured in an urban area of Egypt (Abdel-Hameed et al., 2009). The additional FBAP modes ob-served over the four months of measurements can be groupedaround∼1.5 µm,∼5 µm, and∼13 µm. The smallest modewas likely caused by individual bacterial cells or agglomer-ates and was most often observed at∼1.5 µm, though thepeak of this mode varied between 1.1–1.8 µm. The∼5 µmmode encompasses a variety of peaks observed at differenttimes, though rarely was it seen as a monodisperse peak orset of peaks. Peaks in this region were most often broadand not lognormally distributed, but often distinct from the3 µm peak. The least frequent of the commonly observedmode was a∼13 µm peak observed for three weeks in Octo-ber. Though the peak exhibited low absolute concentration(<2×10⁻³ cm−3), the relative fraction of FBAP to TAP dur-ing this period and size range averaged 73% and often rangedto 100%. These particles were very likely pollen grains re-leased from a nearby blossoming tree. Lognormal fits of se-lected FBAP peaks were performed in order to provide es-timates of characteristic PBAP modes for inputs for aerosolmodels. The observations that the relative fraction of FBAPto TAP was highest at large sizes is consistent with observa-tions by Kenny and Jennings (1998) that the fraction of bio-logical particles in marine aerosol was highest at∼3–18 µm.Provided that FBAP can be regarded as a proxy for viablePBAP, the observed size distributions also suggest that thenumber concentration of viable bioparticles is dominated byfungal spores of agglomerated bacteria (∼3 µm), rather thansingle bacterial cells (∼1 µm).
The results of this exploratory study highlight both theusefulness of FBAP measurements from the UV-APS andsimilar instruments and the need for further work. Carefullymonitoring or controlling UV excitation and detection pa-rameters (e.g. laser intensity) over time and between differentidentical instruments will be helpful in determining measure-ment reproducibility and will be discussed in future studies.By integrating only fluorescence channels three and above,and by removing particles sizes below 1 µm, a conservativeapproach was used in this study to avoid determination ofnon-biological aerosol as FBAP, thus suggesting the concen-tration and size distributions reported can be regarded as anapproximate lower limit for actual PBAP abundances. Addi-tional future work will also be to compare UV-APS measure-ments with other real-time FBAP detectors, culturability andDNA-based techniques, as well as fluorescence and electronmicroscopy analysis of co-collected samples. We proposeand intend to pursue such studies to advance the develop-ment of FBAP measurement techniques and the knowledgeof the abundance and properties of PBAP in the atmosphere.
Atmos. Chem. Phys., 10, 3215–3233, 2010 www.atmos-chem-phys.net/10/3215/2010/
J. A. Huffman et al.: Fluorescent biological aerosol particle concentrations and size distributions 3229
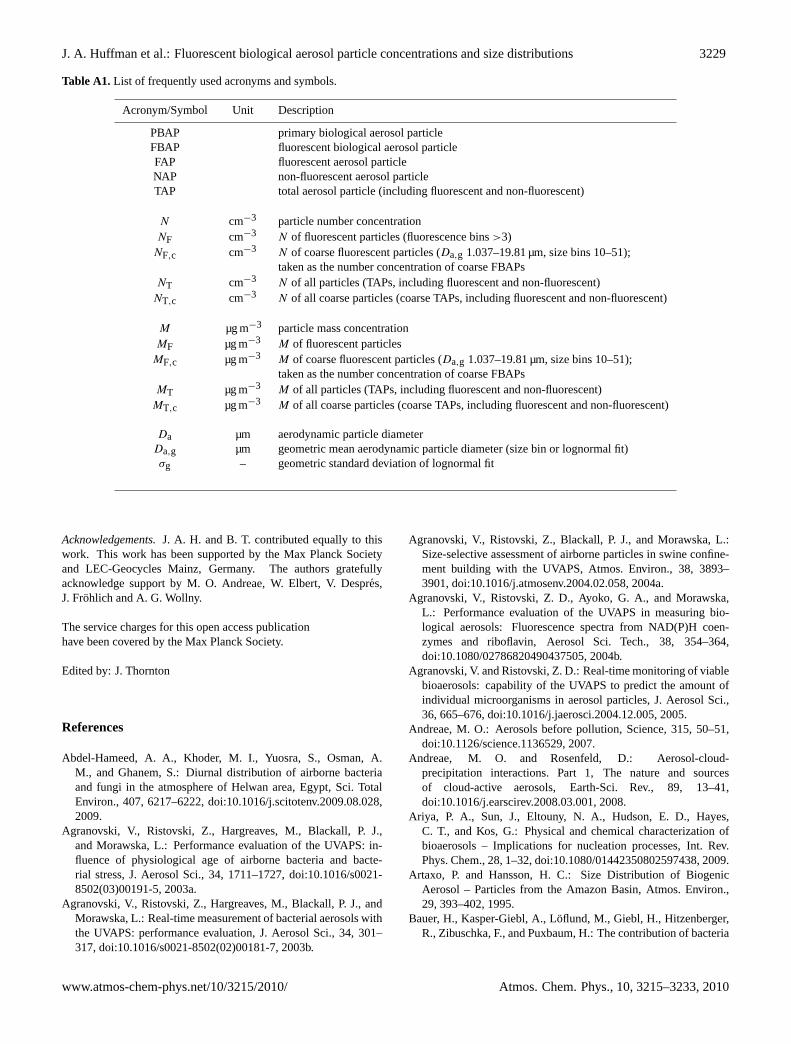
Table A1. List of frequently used acronyms and symbols.
Acronym/Symbol Unit Description
PBAP primary biological aerosol particleFBAP fluorescent biological aerosol particleFAP fluorescent aerosol particleNAP non-fluorescent aerosol particleTAP total aerosol particle (including fluorescent and non-fluorescent)
N cm−3 particle number concentrationNF cm−3 N of fluorescent particles (fluorescence bins>3)NF,c cm−3 N of coarse fluorescent particles (Da,g 1.037–19.81 µm, size bins 10–51);
taken as the number concentration of coarse FBAPsNT cm−3 N of all particles (TAPs, including fluorescent and non-fluorescent)NT,c cm−3 N of all coarse particles (coarse TAPs, including fluorescent and non-fluorescent)
M µg m−3 particle mass concentrationMF µg m−3 M of fluorescent particlesMF,c µg m−3 M of coarse fluorescent particles (Da,g 1.037–19.81 µm, size bins 10–51);
taken as the number concentration of coarse FBAPsMT µg m−3 M of all particles (TAPs, including fluorescent and non-fluorescent)MT,c µg m−3 M of all coarse particles (coarse TAPs, including fluorescent and non-fluorescent)
Da µm aerodynamic particle diameterDa,g µm geometric mean aerodynamic particle diameter (size bin or lognormal fit)σg – geometric standard deviation of lognormal fit
Acknowledgements.J. A. H. and B. T. contributed equally to thiswork. This work has been supported by the Max Planck Societyand LEC-Geocycles Mainz, Germany. The authors gratefullyacknowledge support by M. O. Andreae, W. Elbert, V. Despres,J. Frohlich and A. G. Wollny.
The service charges for this open access publicationhave been covered by the Max Planck Society.
Edited by: J. Thornton
References
Abdel-Hameed, A. A., Khoder, M. I., Yuosra, S., Osman, A.M., and Ghanem, S.: Diurnal distribution of airborne bacteriaand fungi in the atmosphere of Helwan area, Egypt, Sci. TotalEnviron., 407, 6217–6222, doi:10.1016/j.scitotenv.2009.08.028,2009.
Agranovski, V., Ristovski, Z., Hargreaves, M., Blackall, P. J.,and Morawska, L.: Performance evaluation of the UVAPS: in-fluence of physiological age of airborne bacteria and bacte-rial stress, J. Aerosol Sci., 34, 1711–1727, doi:10.1016/s0021-8502(03)00191-5, 2003a.
Agranovski, V., Ristovski, Z., Hargreaves, M., Blackall, P. J., andMorawska, L.: Real-time measurement of bacterial aerosols withthe UVAPS: performance evaluation, J. Aerosol Sci., 34, 301–317, doi:10.1016/s0021-8502(02)00181-7, 2003b.
Agranovski, V., Ristovski, Z., Blackall, P. J., and Morawska, L.:Size-selective assessment of airborne particles in swine confine-ment building with the UVAPS, Atmos. Environ., 38, 3893–3901, doi:10.1016/j.atmosenv.2004.02.058, 2004a.
Agranovski, V., Ristovski, Z. D., Ayoko, G. A., and Morawska,L.: Performance evaluation of the UVAPS in measuring bio-logical aerosols: Fluorescence spectra from NAD(P)H coen-zymes and riboflavin, Aerosol Sci. Tech., 38, 354–364,doi:10.1080/02786820490437505, 2004b.
Agranovski, V. and Ristovski, Z. D.: Real-time monitoring of viablebioaerosols: capability of the UVAPS to predict the amount ofindividual microorganisms in aerosol particles, J. Aerosol Sci.,36, 665–676, doi:10.1016/j.jaerosci.2004.12.005, 2005.
Andreae, M. O.: Aerosols before pollution, Science, 315, 50–51,doi:10.1126/science.1136529, 2007.
Andreae, M. O. and Rosenfeld, D.: Aerosol-cloud-precipitation interactions. Part 1, The nature and sourcesof cloud-active aerosols, Earth-Sci. Rev., 89, 13–41,doi:10.1016/j.earscirev.2008.03.001, 2008.
Ariya, P. A., Sun, J., Eltouny, N. A., Hudson, E. D., Hayes,C. T., and Kos, G.: Physical and chemical characterization ofbioaerosols – Implications for nucleation processes, Int. Rev.Phys. Chem., 28, 1–32, doi:10.1080/01442350802597438, 2009.
Artaxo, P. and Hansson, H. C.: Size Distribution of BiogenicAerosol – Particles from the Amazon Basin, Atmos. Environ.,29, 393–402, 1995.
Bauer, H., Kasper-Giebl, A., Loflund, M., Giebl, H., Hitzenberger,R., Zibuschka, F., and Puxbaum, H.: The contribution of bacteria
www.atmos-chem-phys.net/10/3215/2010/ Atmos. Chem. Phys., 10, 3215–3233, 2010
3230 J. A. Huffman et al.: Fluorescent biological aerosol particle concentrations and size distributions
and fungal spores to the organic carbon content of cloud water,precipitation and aerosols, Atmos. Res., 64, 109–119, 2002a.
Bauer, H., Kasper-Giebl, A., Zibuschka, F., Hitzenberger, R.,Kraus, G. F., and Puxbaum, H.: Determination of the carboncontent of airborne fungal spores, Anal. Chem., 74, 91–95,doi:10.1021/ac010331+, 2002b.
Bauer, H., Giebl, H., Hitzenberger, R., Kasper-Giebl, A., Reis-chl, G., Zibuschka, F., and Puxbaum, H.: Airborne bacteria ascloud condensation nuclei, J. Geophys. Res.-Atmos., 108, 4658,doi:10.1029/2003jd003545, 2003.
Bauer, H., Schueller, E., Weinke, G., Berger, A., Hitzenberger, R.,Marr, I. L., and Puxbaum, H.: Significant contributions of fungalspores to the organic carbon and to the aerosol mass balance ofthe urban atmospheric aerosol, Atmos. Environ., 42, 5542–5549,doi:10.1016/j.atmosenv.2008.03.019, 2008.
Bowers, R. M., Lauber, C. L., Wiedinmyer, C., Hamady, M., Hallar,A. G., Fall, R., Knight, R., and Fierer, N.: Characterization ofAirborne Microbial Communities at a High-Elevation Site andTheir Potential To Act as Atmospheric Ice Nuclei, Appl. Environ.Microb., 75, 5121–5130, doi:10.1128/AEM.00447-09, 2009.
Brosseau, L. M., Vesley, D., Rice, N., Goodell, K., Nellis, M.,and Hairston, P.: Differences in detected fluorescence amongseveral bacterial species measured with a direct-reading particlesizer and fluorescence detector, Aerosol Sci. Tech., 32, 545–558,2000.
Brown, J. K. M. and Hovmoller, M. S.: Epidemiology – Aerial dis-persal of pathogens on the global and continental scales and itsimpact on plant disease, Science, 297, 537–541, 2002.
Bundke, U., Reimann, B., Nillius, B., Jaenicke, R., and Binge-mer, H.: Development of a Bioaerosol single particle detector(BIO IN) for the Fast Ice Nucleus CHamber FINCH, Atmos.Meas. Tech., 3, 263–271, 2010,http://www.atmos-meas-tech.net/3/263/2010/.
Burge, H.: Bioaerosols – Prevalence and Health Effects in the In-door Environment, J. Allergy Clin. Immun., 86, 687–701, 1990.
Burrows, S. M., Butler, T., Jockel, P., Tost, H., Kerkweg, A., Poschl,U., and Lawrence, M. G.: Bacteria in the global atmosphere -Part 2: Modeling of emissions and transport between differentecosystems, Atmos. Chem. Phys., 9, 9281–9297, 2009a,http://www.atmos-chem-phys.net/9/9281/2009/.
Burrows, S. M., Elbert, W., Lawrence, M. G., and Poschl, U.: Bac-teria in the global atmosphere - Part 1: Review and synthesis ofliterature data for different ecosystems, Atmos. Chem. Phys., 9,9263–9280, 2009,http://www.atmos-chem-phys.net/9/9263/2009/.
Cabredo, S., Parra, A., and Anzano, J.: Bacteria spectra ob-tained by laser induced fluorescence, J. Fluoresc., 17, 171–180,doi:10.1007/s10895-007-0155-7, 2007.
Cheng, Y. S., Barr, E. B., Fan, B. J., Hargis, P. J., Rader, D. J.,O’Hern, T. J., Torczynski, J. R., Tisone, G. C., Preppernau, B.L., Young, S. A., and Radloff, R. J.: Detection of bioaerosolsusing multiwavelength UV fluorescence spectroscopy, AerosolSci. Tech., 30, 186–201, 1999.
Christner, B. C., Morris, C. E., Foreman, C. M., Cai, R. M., andSands, D. C.: Ubiquity of biological ice nucleators in snowfall,Science, 319, 1214, doi:10.1126/science.1149757, 2008.
Cox, C. S. and Wathes, C. M.: Bioaerosols handbook, Lewis, BocaRaton, 1995.
Deguillaume, L., Leriche, M., Amato, P., Ariya, P. A., Delort, A.-M., Poschl, U., Chaumerliac, N., Bauer, H., Flossmann, A. I.,and Morris, C. E.: Microbiology and atmospheric processes:chemical interactions of primary biological aerosols, Biogeo-sciences, 5, 1073–1084, 2008,http://www.biogeosciences.net/5/1073/2008/.
Despres, V. R., Nowoisky, J. F., Klose, M., Conrad, R., Andreae, M.O., and Poschl, U.: Characterization of primary biogenic aerosolparticles in urban, rural, and high-alpine air by DNA sequenceand restriction fragment analysis of ribosomal RNA genes, Bio-geosciences, 4, 1127–1141, 2007,http://www.biogeosciences.net/4/1127/2007/.
Diehl, K., Quick, C., Matthias-Maser, S., Mitra, S. K., and Jaenicke,R.: The ice nucleating ability of pollen – Part I: Laboratory stud-ies in deposition and condensation freezing modes, Atmos. Res.,58, 75–87, 2001.
Dingle, A. N.: Pollens as condensation nuclei, Journal deRecherches Atmospheriques, 2, 231–237, 1966.
Dusek, U., Frank, G. P., Hildebrandt, L., Curtius, J., Schneider, J.,Walter, S., Chand, D., Drewnick, F., Hings, S., Jung, D., Bor-rmann, S., and Andreae, M. O.: Size matters more than chem-istry for cloud-nucleating ability of aerosol particles, Science,312, 1375–1378, doi:10.1126/science.1125261, 2006.
Elbert, W., Taylor, P. E., Andreae, M. O., and Poschl, U.: Contribu-tion of fungi to primary biogenic aerosols in the atmosphere: wetand dry discharged spores, carbohydrates, and inorganic ions, At-mos. Chem. Phys., 7, 4569–4588, 2007,http://www.atmos-chem-phys.net/7/4569/2007/.
Eng, J., Lynch, R. M., and Balaban, R. S.: Nicotinamide AdenineDinucleotide Fluorescence Spectroscopy and Imaging of IsolatedCardiac Myocytes, Biophys. J., 55, 621–630, 1989.
Franze, T., Weller, M. G., Niessner, R., and Poschl, U.: Proteinnitration by polluted air, Environ. Sci. Technol., 39, 1673–1678,doi:10.1021/es0488737, 2005.
Frohlich-Nowoisky, J., Pickersgill, D. A., Despres, V. R.,and Poschl, U.: High diversity of fungi in air par-ticulate matter, P. Natl. Acad. Sci., 106, 12814–12819,doi:10.1073/pnas.0811003106, 2009.
Gabey, A. M., Gallagher, M. W., Whitehead, J., and Dorsey, J.:Measurements of coarse mode and primary biological aerosoltransmission through a tropical forest canopy using a dual-channel fluorescence aerosol spectrometer, Atmos. Chem. Phys.Discuss., 9, 18965–18984, 2009,http://www.atmos-chem-phys-discuss.net/9/18965/2009/.
Garland, R. M., Yang, H., Schmid, O., Rose, D., Nowak, A.,Achtert, P., Wiedensohler, A., Takegawa, N., Kita, K., Miyazaki,Y., Kondo, Y., Hu, M., Shao, M., Zeng, L. M., Zhang, Y. H., An-dreae, M. O., and Poschl, U.: Aerosol optical properties in a ruralenvironment near the mega-city Guangzhou, China: implicationsfor regional air pollution, radiative forcing and remote sensing,Atmos. Chem. Phys., 8, 5161–5186, 2008,http://www.atmos-chem-phys.net/8/5161/2008/.
Garland, R. M., Schmid, O., Nowak, A., Achtert, P., Wieden-sohler, A., Gunthe, S. S., Takegawa, N., Kita, K., Kondo, Y.,Hu, M., Shao, M., Zeng, L. M., Zhu, T., Andreae, M. O., andPoschl, U.: Aerosol optical properties observed during Cam-paign of Air Quality Research in Beijing 2006 (CAREBeijing-2006): Characteristic differences between the inflow and out-flow of Beijing city air, J. Geophys. Res.-Atmos., 114, D00G04,
Atmos. Chem. Phys., 10, 3215–3233, 2010 www.atmos-chem-phys.net/10/3215/2010/
J. A. Huffman et al.: Fluorescent biological aerosol particle concentrations and size distributions 3231
doi:10.1029/2008jd010780, 2009.Graham, B., Guyon, P., Maenhaut, W., Taylor, P. E., Ebert,
M., Matthias-Maser, S., Mayol-Bracero, O. L., and Godoi,R. H. M.: Composition and diurnal variability of thenatural Amazonian aerosol, J. Geophys. Res., 108, 4765,doi:10.1029/2003JD004049, 2003.
Gregory, P. H.: Distribution of Airborne Pollen and Spores and theirLong-Distance Transport, Pure Appl. Geophys., 116, 309–315,1978.
Gruber, S., Matthias-Maser, S., and Jaenicke, R.: Concentrationand Chemical Composition of Aerosol Particles in Marine andContinental Air, J. Aerosol Sci., 30, S9–S10, 1999.
Hairston, P. P., Ho, J., and Quant, F. R.: Design of an instrument forreal-time detection of bioaerosols using simultaneous measure-ment of particle aerodynamic size and intrinsic fluorescence, J.Aerosol Sci., 28, 471–482, 1997.
Hamilton, W. D. and Lenton, T. M.: Spora and Gaia: How microbesfly with their clouds, Ethol. Ecol. Evol., 10, 1–16, 1998.
Harrison, D. E. and Chance, B.: Fluorimetric Technique for Mon-itoring Changes in Level of Reduced Nicotinamide Nucleotidesin Continuous Cultures of Microorganisms, Appl. Microbiol., 19,446–450, 1970.
Heald, C. L. and Spracklen, D. V.: Atmospheric budget of primarybiological aerosol particles from fungal spores, Geophys. Res.Lett., 36, L09806, doi:10.1029/2009gl037493, 2009.
Hill, S. C., Pinnick, R. G., Nachman, P., Chen, G., Chang, R. K.,Mayo, M. W., and Fernandez, G. L.: Aerosol-fluorescence spec-trum analyzer: real-time measurement of emission spectra of air-borne biological particles, Appl. Optics, 34, 7149–7155, 1995.
Ho, J., Spence, M., and Hairston, P.: Measurement of biologicalaerosol with a fluorescent aerodynamic particle sizer (FLAPS):correlation of optical data with biological data, Aerobiologia, 15,281–291, 1999.
Ho, J.: Future of biological aerosol detection, Anal. Chim. Acta,457, 125–148, 2002.
Ho, J. and Duncan, S.: Estimating aerosol hazardsfrom an anthrax letter, J. Aerosol Sci., 36, 701–719,doi:10.1016/j.jaerosci.2004.11.019, 2005.
Huber, R., Buchner, M., Li, H. G., Schlieter, M., Speerfeld, A. D.,and Riepe, M. W.: Protein binding of NADH on chemical pre-conditioning, J. Neurochem., 75, 329–335, 2000.
Huffman, J. A., Garland, R. M., Poschl, U., et al.: Fluorescentbiological aerosol particle concentrations and size distributionsmeasured in pristine tropical rainforest air during AMAZE-08,in preparation, 2010.
Iwami, Y., Takahashi-Abbe, S., Takahashi, N., Yamada, T., Kano,N., and Mayanagi, H.: The time-course of acid excretion, lev-els of fluorescence dependent on cellular nicotinamide adeninenucleotide and glycolytic intermediates of Streptococcus mutanscells exposed and not exposed to air in the presence of glucoseand sorbitol, Oral Microbiol. Immun., 16, 34–39, 2001.
Jaenicke, R.: Abundance of cellular material and proteins in theatmosphere, Science, 308, 73, doi:10.1126/science.1106335,2005.
Jaenicke, R., Matthias-Maser, S., and Gruber, S.: Omnipresence ofbiological material in the atmosphere, Environ. Chem., 4, 217–220, doi:10.1071/en07021, 2007.
Jones, A. M. and Harrison, R. M.: The effects of me-teorological factors on atmospheric bioaerosol concentra-tions – a review, Sci. Total Environ., 326, 151–180,doi:10.1016/j.scitotenv.2003.11.021, 2004.
Jonsson, P., Kullander, F., Vahlberg, C., Jelger, P., Tiihonen, M.,Wasterby, P., Tjarnhage, T., and Lindgren, M.: Spectral de-tection of ultraviolet laser induced fluorescence from individualbioaerosol particles, in: Optically Based Biological and Chem-ical Detection for Defence III, edited by: Carrano, J. C. andZukauskas, A., Proceedings of the Society of Photo-Optical In-strumentation Engineers (SPIE), Spie-Int. Soc. Optical Engineer-ing, Bellingham, U83–U94, 2006.
Kanaani, H., Hargreaves, M., Ristovski, Z., and Morawska,L.: Performance assessment of UVAPS: Influence of fun-gal spore age and air exposure, J. Aerosol Sci., 38, 83–96,doi:10.1016/j.jaerosci.2006.10.003, 2007.
Kanaani, H., Hargreaves, M., Ristovski, Z., and Morawska,L.: Deposition rates of fungal spores in indoor en-vironments, factors effecting them and comparison withnon-biological aerosols, Atmos. Environ., 42, 7141–7154,doi:10.1016/j.atmosenv.2008.05.059, 2008a.
Kanaani, H., Hargreaves, M., Smith, J., Ristovski, Z., Agranovski,V., and Morawska, L.: Performance of UVAPS with respectto detection of airborne fungi, J. Aerosol Sci., 39, 175–189,doi:10.1016/j.jaerosci.2007.10.007, 2008b.
Kaye, P. H., Stanley, W. R., Hirst, E., Foot, E. V., Baxter, K. L.,and Barrington, S. J.: Single particle multichannel bio-aerosolfluorescence sensor, Opt. Express, 13, 3583–3593, 2005.
Kell, D. B., Ryder, H. M., Kaprelyants, A. S., and Westerhoff, H.V.: Quantifying Heterogeneity – Flow Cytometry of BacterialCultures, Van Leeuwenhoek, A., Int. J. Gen. Mol. Microbiol.,60, 145–158, 1991.
Kenny, C. M. and Jennings, S. G.: Background bioaerosol mea-surements at Mace Head, J. Aerosol Sci., 29, S779–S780,doi:10.1016/S0021-8502(98)90572-9, 1998.
Kim, K. Y., Ko, H. J., Kim, H. T., Kim, Y. S., Roh, Y. M., Lee, C.M., and Kim, C. N.: Monitoring of aerial pollutants emitted fromswine houses in Korea, Environ. Monit. Assess., 133, 255–266,doi:10.1007/s10661-006-9578-x, 2007.
Lacey, J. and Dutkiewicz, J.: Bioaerosols and Occupational LungDisease, J. Aerosol Sci., 25, 1371–1404, 1994.
Laflamme, C., Verreault, D., Lavigne, S., Trudel, L., Ho, J., andDuchaine, C.: Autofluorescence as a viability marker for detec-tion of bacterial spores, Front. Biosci., 10, 1647-1653, 2005.
Lavoie, J., Dunkerley, C. J., Kosatsky, T., and Dufresne,A.: Exposure to aerosolized bacteria and fungi amongcollectors of commercial, mixed residential, recyclableand compostable waste, Sci. Total Environ., 370, 23–28,doi:10.1016/j.scitotenv.2006.05.016, 2006.
Law, A. K. Y., Chau, C. K., and Chan, G. Y. S.: Characteristicsof bioaerosol profile in office buildings in Hong Kong, Build.Environ., 36, 527–541, 2001.
Li, J. K., Asali, E. C., and Humphrey, A. E.: Monitoring CellConcentration and Activity by Multiple Excitation Flourometry,Biotechnol. Progr., 7, 21–27, 1991.
Linskens, H. F. and Cresti, M.: Pollen-allergy as an ecological phe-nomenon: a review, Plant Biosyst., 134, 341–352, 2000.
www.atmos-chem-phys.net/10/3215/2010/ Atmos. Chem. Phys., 10, 3215–3233, 2010
3232 J. A. Huffman et al.: Fluorescent biological aerosol particle concentrations and size distributions
Lohmann, U. and Feichter, J.: Global indirect aerosol effects: areview, Atmos. Chem. Phys., 5, 715–737, 2005,http://www.atmos-chem-phys.net/5/715/2005/.
Manninen, A., Putkiranta, M., Rostedt, A., Saarela, J., Laurila, T.,Marjamaki, M., Keskinen, J., and Hernberg, R.: Instrumentationfor measuring fluorescence cross sections from airborne micro-sized particles, Appl. Optics, 47, 110–115, 2008.
Martin, S. T., Andreae, M. O., Artaxo, P., Baumgartner, D., Chen,Q., Goldstein, A. H., Guenther, A., Heald, C. L., Mayol-Bracero, O. L., McMurry, P. H., Pauliquevis, T., Poschl, U.,Prather, K. A., Roberts, G. C., Saleska, S. R., Dias, M. A. S.,Spracklen, D. V., Swietlicki, E., and Trebs, I.: Sources and Prop-erties of Amazonian Aerosol Particles, Rev. Geophys., in press,doi:10.1029/2008RG000280, 2010.
Matthias-Maser, S. and Jaenicke, R.: The size distribution of pri-mary biological aerosol particles with radii>0.2 mum in an ur-ban rural influenced region, Atmos. Res., 39, 279–286, 1995.
Matthias-Maser, S. and Jaenicke, R.: The size distribution of pri-mary biological aerosol particles in the multiphase atmosphere,Aerobiologia, 16, 207–210, 2000.
McFiggans, G., Artaxo, P., Baltensperger, U., Coe, H., Facchini, M.C., Feingold, G., Fuzzi, S., Gysel, M., Laaksonen, A., Lohmann,U., Mentel, T. F., Murphy, D. M., O’Dowd, C. D., Snider, J.R., and Weingartner, E.: The effect of physical and chemi-cal aerosol properties on warm cloud droplet activation, Atmos.Chem. Phys., 6, 2593–2649, 2006,http://www.atmos-chem-phys.net/6/2593/2006/.
Morris, C. E., Sands, D. C., Bardin, M., Jaenicke, R., Vogel, B.,Leyronas, C., Ariya, P. A., and Psenner, R.: Microbiology andatmospheric processes: an upcoming era of research on bio-meteorology, Biogeosciences Discuss., 5, 191–212, 2008,http://www.biogeosciences-discuss.net/5/191/2008/.
Mortazavi, R., Hayes, C. T., and Ariya, P. A.: Ice nucleationactivity of bacteria isolated from snow compared with or-ganic and inorganic substrates, Environ. Chem., 5, 373–381,doi:10.1071/en08055, 2008.
Moschandreas, D. J., Cha, D. K., and Qian, J.: Measurement ofindoor bioaerosol levels by a direct counting method, J. Environ.Eng.-ASCE, 122, 374–378, 1996.
Nikaeen, M., Hatamzadeh, M., Hasanzadeh, A., Sahami, E.,and Joodan, I.: Bioaerosol emissions arising during applica-tion of municipal solid-waste compost, Aerobiologia, 25, 1–6,doi:10.1007/s10453-008-9102-6, 2009.
Okada, T. and Matsunum, K.: Determination of particle-size distri-bution and concentration of cigarette-smoke by a light-scatteringmethod, J. Colloid Interf. Sci., 48, 461–469, 1974.
Pan, Y. L., Holler, S., Chang, R. K., Hill, S. C., Pinnick, R. G.,Niles, S., Bottiger, J. R., and Bronk, B. V.: Real-time detec-tion and characterization of individual flowing airborne biologi-cal particles: fluorescence spectra and elastic scattering measure-ments, P. Soc. Photo-Ot. Ins., 3855, 117–125, 1999.
Pan, Y. L., Pinnick, R. G., Hill, S. C., Rosen, J. M., andChang, R. K.: Single-particle laser-induced-fluorescence spec-tra of biological and other organic-carbon aerosols in the at-mosphere: Measurements at New Haven, Connecticut, andLas Cruces, New Mexico, J. Geophys. Res.-Atmos., 112(15),D24s19, doi:10.1029/2007jd008741, 2007.
Pan, Y. L., Pinnick, R. G., Hill, S. C., and Chang, R.K.: Particle-Fluorescence Spectrometer for Real-Time Single-Particle Measurements of Atmospheric Organic Carbon andBiological Aerosol, Environ. Sci. Technol., 43, 429–434,doi:10.1021/es801544y, 2009.
Pinnick, R. G., Hill, S. C., Nachman, P., Pendleton, J. D., Fernan-dez, G. L., Mayo, M. W., and Bruno, J. G.: Fluorescence ParticleCounter for Detecting Airborne Bacteria and Other BiologicalParticles, Aerosol Sci. Tech., 23, 653–664, 1995.
Pinnick, R. G., Hill, S. C., Pan, Y. L., and Chang, R. K.: Flu-orescence spectra of atmospheric aerosol at Adelphi, Mary-land, USA: measurement and classification of single particlescontaining organic carbon, Atmos. Environ., 38, 1657–1672,doi:10.1016/j.atmosenv.2003.11.017, 2004.
Poschl, U.: Atmospheric aerosols: Composition, transformation,climate and health effects, Angew. Chem. Int. Edit., 44, 7520–7540, doi:10.1002/anie.200501122, 2005.
Poschl, U., Sinha, B. W., Martin, S. T., et al.: Biogenic nuclei forclouds and precipitation over the Amazonian rainforest, in prepa-ration, 2010.
Pratt, K. A., DeMott, P. J., French, J. R., Wang, Z., Westphal, D. L.,Heymsfield, A. J., Twohy, C. H., Prenni, A. J., and Prather, K.A.: In situ detection of biological particles in cloud ice-crystals,Nat. Geosci., 2, 397–400, doi:10.1038/ngeo521, 2009.
Prenni, A. J., Petters, M. D., Kreidenweis, S. M., Heald, C. L.,Martin, S. T., Artaxo, P., Garland, R. M., Wollny, A. G., andPoschl, U.: Relative roles of biogenic emissions and Saharandust as ice nuclei in the Amazon basin, Nat. Geosci., 2, 401–404,doi:10.1038/ngeo517, 2009.
Reyes, F. L., Jeys, T. H., Newbury, N. R., Primmerman, C. A.,Rowe, G. S., and Sanchez, A.: Bio-aerosol fluorescence sensor,Field Anal. Chem. Tech., 3, 240–248, 1999.
Rosenfeld, D., Lohmann, U., Raga, G. B., O’Dowd, C. D., Kul-mala, M., Fuzzi, S., Reissell, A., and Andreae, M. O.: Floodor drought: How do aerosols affect precipitation?, Science, 321,1309–1313, doi:10.1126/science.1160606, 2008.
Sanchez-Ochoa, A., Kasper-Giebl, A., Puxbaum, H., Gelencser,A., Legrand, M., and Pio, C.: Concentration of atmosphericcellulose: A proxy for plant debris across a west-east tran-sect over Europe, J. Geophys. Res.-Atmos., 112, D23s08,doi:10.1029/2006jd008180, 2007.
Schnell, R. C. and Vali, G.: Atmospheric Ice Nuclei from Decom-posing Vegetation, Nature, 236, 163–165, 1972.
Seaver, M., Eversole, J. D., Hardgrove, J. J., Cary, W. K., andRoselle, D. C.: Size and fluorescence measurements for field de-tection of biological aerosols, Aerosol Sci. Tech., 30, 174–185,1999.
Seedorf, J.: An emission inventory of livestock-related bioaerosolsfor Lower Saxony, Germany, Atmos. Environ., 38, 6565–6581,doi:10.1016/j.atmosenv.2004.08.023, 2004.
Setlow, B. and Setlow, P.: Levels of Oxidized and Reduced Pyri-dine Nucleotides in Dormant Spores and During Growth, Sporu-lation, and Spore Germination ofBacillus megaterium, J. Bacte-riol., 129, 857–865, 1977.
Simoneit, B. R. T. and Mazurek, M. A.: Organic Matter of the Tro-posphere – II. Natural Background of Biogenic Lipid Matter inAerosols Over the Rural Western United States, Atmos. Environ.,16, 2139–2159, 1982.
Atmos. Chem. Phys., 10, 3215–3233, 2010 www.atmos-chem-phys.net/10/3215/2010/
J. A. Huffman et al.: Fluorescent biological aerosol particle concentrations and size distributions 3233
Sivaprakasam, V., Huston, A. L., Scotto, C., and Eversole, J.D.: Multiple UV wavelength excitation and fluorescence ofbioaerosols, Opt. Express, 12, 4457–4466, 2004.
Sivaprakasam, V., Pletcher, T., Tucker, J. E., Huston, A. L.,McGinn, J., Keller, D., and Eversole, J. D.: Classification andselective collection of individual aerosol particles using laser-induced fluorescence, Appl. Optics, 48, B126–B136, 2009.
Snyder, A. P., Maswadeh, W. M., Tripathi, A., Eversole, J., Ho, J.,and Spence, M.: Orthogonal analysis of mass and spectral basedtechnologies for the field detection of bioaerosols, Anal. Chim.Acta, 513, 365–377, doi:10.1016/j.aca.2004.03.003, 2004.
Sun, J. M. and Ariya, P. A.: Atmospheric organic and bio-aerosolsas cloud condensation nuclei (CCN): A review, Atmos. Environ.,40, 795–820, doi:10.1016/j.atmosenv.2005.05.052, 2006.
Wiedinmyer, C., Bowers, R. M., Fierer, N., Horanyi, E., Hannigan,M., Hallar, A. G., McCubbin, I., and Baustian, K.: The contribu-tion of biological particles to observed particulate organic carbonat a remote high altitude site, Atmos. Environ., 43, 4278–4282,doi:10.1016/j.atmosenv.2009.06.012, 2009.
Wittmaack, K., Wehnes, H., Heinzmann, U., and Agerer,R.: An overview on bioaerosols viewed by scanningelectron microscopy, Sci. Total Environ., 346, 244–255,doi:10.1016/j.scitotenv.2004.11.009, 2005.
www.atmos-chem-phys.net/10/3215/2010/ Atmos. Chem. Phys., 10, 3215–3233, 2010
Recommended