Flow-Induced Crystallization in the Injection Molding ofPolymers: A Thermodynamic Approach
Kyuk Hyun Kim, A. I. Isayev, Keehae Kwon
Institute of Polymer Engineering, University of Akron, Akron, Ohio 44325-0301
Received 7 May 2004; accepted 6 July 2004DOI 10.1002/app.21228Published online in Wiley InterScience (www.interscience.wiley.com).
ABSTRACT: The prediction of the crystallinity and micro-structure that develop in injection molding is very importantfor satisfying the required specifications of molded prod-ucts. A novel approach to the numerical simulation of theskin-layer thickness and crystallinity in moldings of semi-crystalline polymers is proposed. The approach is based onthe calculation of the entropy reduction in the oriented meltand the elevated equilibrium melting temperature by meansof a nonlinear viscoelastic constitutive equation. The eleva-tion of the equilibrium melting temperature that resultsfrom the entropy reduction between the oriented and unori-ented melts is used to determine the occurrence of flow-induced crystallization. The crystallization rate enhanced by
the flow effect is obtained by the inclusion of the elevatedequilibrium melting temperature in the modified Hoffman–Lauritzen equation. Injection-molding experiments at vari-ous processing conditions were carried out on polypro-pylenes of various molecular weights. The thickness of thehighly oriented skin layer and the crystallinity in the mold-ings were measured. The measured data for the microstruc-tures in the moldings agree well with the simulated results.© 2004 Wiley Periodicals, Inc. J Appl Polym Sci 95: 502–523, 2005
Key words: crystallization; injection molding; layer growth;poly(propylene) (PP); rheology
INTRODUCTION
In polymer processing operations such as injectionmolding, fiber spinning, film blowing, and casting, themolten polymer is subjected to intense shear and elon-gational flow and crystallizes during the imposition offlow. Because of the flow-induced crystallization, themorphology of the semicrystalline polymer that de-velops in the final product is typically very differentfrom what is observed as a result of quiescent crystal-lization of the same polymer. The reduction of entropybetween the oriented and unoriented melts, which isdue to the molecular chain orientation of the melts,increases the equilibrium melting temperature (Tm
0 ),and so the crystallization behavior becomes differentfrom that of the unoriented polymer melts. The extentof the Tm
0 increase depends on the degree of orienta-tion in the polymer melt. In other words, the crystal-lization kinetics are affected by a flow field in the caseof an oriented polymer melt.
A number of mathematical models have been pro-posed for the simulation of quiescent crystalliza-tion.1–8 Most of the nonisothermal crystallization the-ories2–4 have been developed from the Avrami–Kol-mogoroff theory for isothermal crystallization.5–8
Schneider et al.4 proposed a system of differentialfirst-order rate equations for describing the noniso-thermal crystallization kinetics by combining the workof Avrami and Kolmogoroff.5–8 They developed thekinetics by considering both the formation and growthof nuclei in terms of the system of rate equations. Inthe limiting case of very fast nucleation with respect tothe growth rate, the system of rate equations wouldreduce to a single rate equation, that is, the Avramiequation for isothermal crystallization.
Nakamura and coworkers2,3 extended the theoriesof isothermal crystallization of Avrami and Kolmog-oroff5–8 and Evans9 on the basis of isokinetic condi-tions. They suggested a kinetic model of nonisother-mal quiescent crystallization, which is customarilycited in the literature as the Nakamura model.
Most of the scientific studies on flow-induced crys-tallization have been mainly concerned with experi-mental elucidation and qualitative understanding. Al-though the basic features of flow-induced crystalliza-tion are well known, the quantitative modeling of theprocess has not been developed significantly. Experi-mental investigations and theoretical work concerningthe development of the morphology and kinetics offlow-induced crystallization have been made bySchultz and coworkers,10–13 McHugh and cowork-ers,14–18 Ziabicki and coworkers,19–22 and Janeschitz-Kriegl and coworkers.23–26
The theoretical work devoted to studying the devel-opment of the microstructure associated with flow-
Correspondence to: A. I. Isayev ([email protected])
Journal of Applied Polymer Science, Vol. 95, 502–523 (2005)© 2004 Wiley Periodicals, Inc.
induced crystallization can be broadly classified intothree categories: statistical mechanical models de-voted to the equilibrium properties of stretched poly-mer networks,27,28 statistical mechanical and classicalthermodynamic models devoted to the kinetic prop-erties of the crystallization process,19 and models con-necting the evolution of the morphology with the flowand transport phenomena.13
The statistical mechanical model expressing themelting temperature (T0) elevation was first quantifiedby Flory27 in his classic derivation of the equilibriumtransition temperature for a stretched, crosslinked sys-tem. This model was later modified by Gaylord,28 whoapplied the concepts of irreversible thermodynamicsto determine the crystallization rates.
Ziabicki19 and later Janeschitz-Kriegl et al.25 devel-oped continuum models for flow-induced crystalliza-tion based on modifications of the Avrami equation,which contains a phenomenological orientation factorfor the effect of flow. Although this approach repre-sents an important advance with respect to the T0elevation theory, the resulting models do not couplethe rheology of a semicrystalline system with the crys-talline kinetics in a predictive way.
Advances in connecting the morphology with themacroscopic properties were made by Schultz,13 whotreated the heat transfer away from a growing crystalfront as a rate-determining step.
Shimizu et al.,29 Katayama and Yoon,30 and Chenand Spruiell31 developed mathematical models forflow-induced crystallization to simulate the high-speed fiber-spinning process.
McHugh et al.14,15,18 developed a model for flow-induced crystallization with the Hamiltonian bracketformulation with the Avrami equation. The model hasa number of parameters that can be obtained fromrheological measurements and quiescent crystalliza-tion experiments.
Yeh and coworkers32–35 carried out research onflow-induced crystallization from a morphologicalpoint of view. They observed a thermally reversibletransformation from a fibrillar morphology to a lamel-lar crystalline morphology in strain-crystallized poly-mers. They discovered the existence of a nodularstructure within perpendicularly oriented lamellae ina glassy, amorphous state.
The flow-induced crystallization behavior is of greatindustrial importance because solidification phenom-ena usually take place from a strained melt. A com-prehensive study of polyethylene films crystallizedfrom a strained melt has shown a shish-kebab struc-ture similar to that of samples obtained from a stirreddilute solution.36
According to the rubber elasticity theory,37 the mo-lecular origin of elastic force exhibited by a deformedelastomeric network can be expressed by the summa-tion of the internal energy and entropy change contri-
bution. For the formation of temporary entanglementsin an elastic liquid, the change in the conformationalentropy makes an overwhelming contribution to thevariation of the free energy.37,38
Haas and Maxwell39 and Ishizuka and Koyama40
approached flow-induced crystallization phenomenafrom a thermodynamic point of view. When polymerchains are under stress influence, entropy reductiontakes place. In an oriented melt state, this results in theelevation of Tm
0 . By using this elevated melting tem-perature (Tm), they could determine the flow-en-hanced crystallization rate constants.40
A great deal of related research has been conductedby Isayev and coworkers.41–46 They first proposed amethod41,42 for predicting the skin-layer thickness inthe injection moldings of isotactic polypropylene (iPP)with the modification of the Janeschitz-Kriegl modelof flow-induced crystallization23–25 and with the Na-kamura model of nonisothermal quiescent crystalliza-tion.2,3 They assumed that during the injection-mold-ing process at any material point, there existed a com-petition between the initiation of flow-induced andquiescent crystallization. In addition, they47–50 sug-gested a unified approach to crystallization phenom-ena under processing conditions. In their model, purequiescent crystallization is a special case of flow-in-duced crystallization.
According to their model, the flow-induced crystal-lization process may take place under or after shear-ing, being dependent on the effect of supercooling andthe intensity of shearing or the evolution of the shear-ing prehistory during the induction period of crystal-lization. Flow-induced crystallization can produce ahighly oriented shish-kebab crystallite microstructure.However, in the Janeschitz-Kriegl model and its de-rivative attributable to Isayev et al.,41,42 flow-inducedcrystallization is specifically used to refer to cases inwhich highly oriented lamellar crystallites are pro-duced. In addition, the determination of the modelparameters related to flow-induced crystallization re-quires a tremendous amount of experimental workwith a special kind of extrusion experiment.
Recently, Isayev and coworkers51,52 approached theflow-induced crystallization phenomena from a ther-modynamic point of view. They calculated Tm due tothe reduction of entropy between the oriented andunoriented melts with the nonlinear viscoelastic con-stitutive equation.53 They showed some preliminaryresults for the prediction of the skin-layer thicknessand crystallinity development where the flow-inducedcrystallization takes place during the filling stage ininjection moldings.51,52
In this research, a more detailed account is providedon the further development of the model of flow-induced crystallization based on a thermodynamicpoint of view and a nonlinear viscoelastic constitutiveequation along with an increased crystallization rate.
FLOW-INDUCED CRYSTALLIZATION 503
In agreement with Flory,27 the elevation of Tm0 , which
results from the entropy reduction between the unori-ented and oriented melts, has been used to determinethe occurrence of flow-induced crystallization and theenhancement of the crystallization rate by flow. Thecrystallization rate enhanced by flow has been in-cluded by the incorporation of Tm into the Hoffman–Lauritzen equation.1 A nonlinear viscoelastic constitu-tive equation53 has been used to determine the en-tropy change and to calculate Tm.
THEORETICAL
Governing equations
The general behavior of the process is described bytransport equations: conservation of mass, momen-tum, and energy. The continuity equation for the flowis
��
�t � ��v � 0 (1)
where � is the density and v is the velocity vector.The momentum equation in a fluid with no body
forces is
��v�t � v � ��v � ��P � �� (2)
where P is the pressure and � is the stress tensor.A Leonov multimode nonlinear constitutive equa-
tion has been used to describe the rheological behaviorof polymer melts:53
C�
k �1
2�k�Ck
2 �13 �IIC
k � ICk �Ck � I� � 0 (3)
where I is the identity tensor; ICk and IIC
k are the firstand second invariants of the elastic strain tensor (Ck),respectively; �k is the relaxation time; and C
�
k is theJaumann derivative.
In the nonisothermal flow under consideration, theenergy equation is
�Cp��T�t � v � �T� � k�2T � � � Q̇ (4)
where T is the temperature, Cp is the specific heat, k isthe thermal conductivity, � is the energy dissipation,and Q̇ is the rate of heat release due to crystallizationper unit of volume. This latter quantity is definedaccording to the crystallization kinetics as follows:
Q̇ � �X��Hc
d�
dt (5)
where X� is the ultimate degree of crystallinity, �Hc isthe heat of fusion for the pure crystal, and � is therelative degree of crystallinity.
For a viscoelastic flow, � is54
� � 2s�0tr�E2� � �k�1
N�k
4�k2 �IC
k �IICk � IC
k �
3 � tr�Ck2� � 3�
(6)
where E is the deformation-rate tensor, s is the dimen-sionless rheological parameter lying between zero andunity, �k is the shear viscosity of the kth mode, and �0is the zero-shear-rate viscosity.
E and �0 may be expressed as follows:
E �12 �v � ��v�T (7)
�0�T� �¥k�1
N �k�T�
1 � s (8)
�k and �k are assumed to have an Arrhenius-typetemperature dependence:
�k�T� � Akexp�Tb
T� (9)
�k�T� � Bkexp�Tb
T� (10)
where Tb is the temperature sensitivity of the param-eters and is related to the activation energy and Ak andBk are constants.
These values may increase dramatically as the poly-mer crystallizes.55 However, for simplicity, the crys-tallinity effect on the viscosity and relaxation time hasnot been considered in this study.
For simple shear, Ck has the following form:
Ck � � C11,k C12,k 0C12,k C22,k 0
0 0 1� (11)
In this research, the following assumptions have beenmade for the simulation of the filling stage in aninjection-molding process:
1. The thin-film approximation is employed.2. There is a no-slip condition at the wall.3. The inertial and body force in the momentum
equation are neglected.4. The pressure is independent of the thickness di-
rection.
504 KIM, ISAYEV, AND KWON
5. Thermal conduction in the flow direction is neg-ligible with respect to conduction in the thicknessdirection.
6. No fountain flow effect at the melt front is con-sidered.
For one-dimensional flow in Cartesian coordinatesin the filling stage, the conservation of mass and mo-mentum may be expressed as follows:56
�
�x �S�P�x� � 0 (12)
where x is the flow direction and S, the fluidity, isdefined as
S � �0
b y2
�dy in Cartesian coordinates (13)
S �12 �
0
b r3
�dr in cylindrical coordinates
The boundary and initial conditions for the tempera-ture and flow velocity are given by
T�y, t 0� � T0, T�b, t 0� � Tw,
�T�y �0, t� � 0, vx�b, t� �
�vx
�y �0, t� � 0 (14)
where b is the half-gap of the cavity, Tw is the walltemperature, and vx is the velocity in the flow direc-tion.
The average velocity (U) can be expressed as fol-lows:
U �1b �
0
b
vxdy (15)
According to the N-mode Leonov model, � is thengiven by
��y, t� � 2��1�T�s�̇ � 0 1 01 0 00 0 0
�� 2 �
k�1
N
�k�T�� C11,k C12,k 0C12,k C22,k 0
0 0 1� (16)
where �̇ � �(�vx/�y) is the shear rate and �k ��k/(2�k) is the modulus of the kth mode [� � �0/(2�1)].
The governing equations for Ck in eq. (3) can beexpressed as follows:
DC11,k
Dt � 2C12,k
�vx
�y �1
2�k�C11,k
2 � C12,k2 � 1� � 0 (17)
DC12,k
Dt � C22,k
�vx
�y �1
2�k�C11,k � C22,k�C12,k � 0 (18)
C11,kC22,k � C12,k2 � 1 (19)
where D/Dt is the material derivative operator.With the addition of a pressure gradient (�x), the
shear stress ( 12) can be expressed as follows:
12 � �xy � ��̇, �x � ��P�x (20)
On the other hand, by integrating eq. (15) by part andeliminating �̇ with eq. (20), we find that
U ��x
b �0
b y2
�dy �
�x
b S (21)
Accordingly, from eqs. (15), (16), and (20), �x can beexpressed as follows:
�x�t� �
�2�sbU � 2 ¥k�1N �k �
0
b yC12,k
�1dy�
�0
b y2
�1dy
(22)
The elastic strain tensor components at a steady-stateflow (Ck
st) can be expressed as follows:
C11,kst �
�2Xk
�1 � Xk(23)
C12,kst �
2�̇Xk
1 � Xk(24)
C22,kst �
�2
�1 � Xk(25)
where Xk is equal to 1 � �1 � 3��̇�k�2.
The shear viscosity (�) can be expressed as follows:
� � �0s � �k�1
N 2�k
1 � �1 � 4��̇�k�2 (26)
For the calculation of Ck during the cooling stage, thegoverning equations for Ck in eqs. (17)–(19) have beensolved by the shear rate being set to zero.
FLOW-INDUCED CRYSTALLIZATION 505
Onset of flow-induced crystallization
For simplicity, instantaneous nucleation is assumed,and this makes the use of a detailed nucleation modelunnecessary. Such an assumption has been proposedfor flow-induced crystallization in which the crystal-lization driving forces are large.57,58
To determine the highly oriented skin layer devel-oped during the molding process, we must know theonset of flow-induced crystallization. For an orientedpolymer melt, the reduction in entropy, due to theorientation of polymer molecules under flow, causesthe elevation of Tm
0 . According to Flory,27 Tm can becalculated as follows:
1Tm
�1
Tm0 �
�Sel
�Hf(27)
where �Sel is the change in the entropy and �Hf is thechange in the enthalpy of crystallization. The value of�Hf is the difference between the heat released bycrystallization (�Hf
m) and the created interfacial en-ergy (�Hf
A):
�Hf � �Hfm � �Hf
A � fcr�Hfm (28)
The crystallization factor (fcr) is introduced as the crys-tallization enthalpy change divided by the heat ofcrystallization. Evidently, fcr is affected by the createdinterfacial energy. Therefore, this value, which is un-known, is very important in flow-induced crystalliza-tion. As a result, the temperature elevation by theoriented polymer melt can be expressed through thecombination of the entropy reduction and heat of crys-tallization:51,52
1Tm
�1
Tm0 �
�Sel
fcr�Hfm (29)
The entropy reduction in eq. (29) is related to the firstinvariant of the kth mode of Ck (IC
k ):51,52
�Sel � �k
�k
T��IC
k � 3 (30)
where ICk is equal to C11,k � C22,k � C33,k. This invariant
can be obtained by the solution of governing equa-tions for Ck during filling and cooling stages.
The Flory equation [eq. (27)] is based on equilibriumstatistical physics. On the other hand, eq. (30), used forthe calculation of entropy reduction, is based on thestrain invariant derived from the constitutive equationobtained from irreversible thermodynamics. There-fore, in applying eq. (27), we assume that the nonequi-librium process under any flow condition is driven byundercooling determined from Tm
0 .
Flow-enhanced crystallization rate constant
A number of publications concerning various effectsobserved during the crystallization of polymers inoriented or deformed states have been published. Athermodynamic description, first presented by Flory,27
was extended by Kobayashi and Nagasawa59 andGaylord.28 These theories predict an increase in Tm
0
mainly due to the entropy reduction of the deformedmacromolecular system.
Another attempt at the flow-induced crystallizationrate has been reported in the literature; it takes intoaccount the effect of external stress on the rate ofcrystallization.21,30,60,61 On a qualitative basis, this ef-fect has been confirmed by many experiments.40,62,63
For an oriented melt, the flow-induced crystalliza-tion takes place as soon as Tm reaches the local tem-perature. Tm increases the degree of supercooling and,therefore, speeds up the crystallization process. Thismeans that the elevation of T0 has the same effect asthe supercooling does in the crystallization kinetics.This supercooling effect of flow on the crystallizationrate can be incorporated into the nonisothermal Na-kamura equation2,3 through the rate constant deter-mined from the modified Hoffman–Lauritzen equa-tion1 by the replacement of Tm
0 with Tm.Ishizuka and Koyama40 estimated the orientation
dependence of the nucleation and growth ratethrough the replacement of the isotropic T0 in thenonisothermal crystallization equation with Tm due tothe orientation.
Dunning64 expressed the rate of nucleation as afunction of the degree of supercooling by replacing theisotropic T0 in the nonisothermal crystallization equa-tion with Tm due to the extension and compared thisfunction with experimental data.
Guo and Narh65 and Isayev et al.52 applied themodified Hoffman–Lauritzen equation and Naka-mura equation to simulate the flow-induced crystalli-zation in the injection-molding process as follows.
The modified Nakamura equation is
D�
Dt � nKs�T, �̇��1 � ����ln�1 � �� �n�1�/n (31)
where n is the Avrami exponent. Ks(T, �̇) is the mod-ified nonisothermal crystallization rate constant af-fected by the shear rate:
Ks�T, �̇� � �ln 2�1/n� 1t1/2
�0
exp��U*/RT � T�
�� exp��
Kk
T�Tm�T, �̇� � T�f� (32)
with f �2T
T � Tm�T, �̇�, T� � Tg � 30 (33)
506 KIM, ISAYEV, AND KWON
where Tm is from eq. (29), f is the correction factor forthe reduction in the latent heat of fusion as the tem-perature is decreased, R is the universal gas constant,U* is the activation energy for the segmental jump ofpolymer molecules and may be assigned a universalvalue of 6284 J/mol, (1/t1/2)0 is the pre-exponentialfactor that includes all terms influencing the crystalli-zation process but is independent of temperature, andKk is the nucleation exponent. From eq. (32), it isevident that Tm increases the degree of supercoolingand, therefore, the crystallization rate.
EXPERIMENTAL
Materials and sample preparation
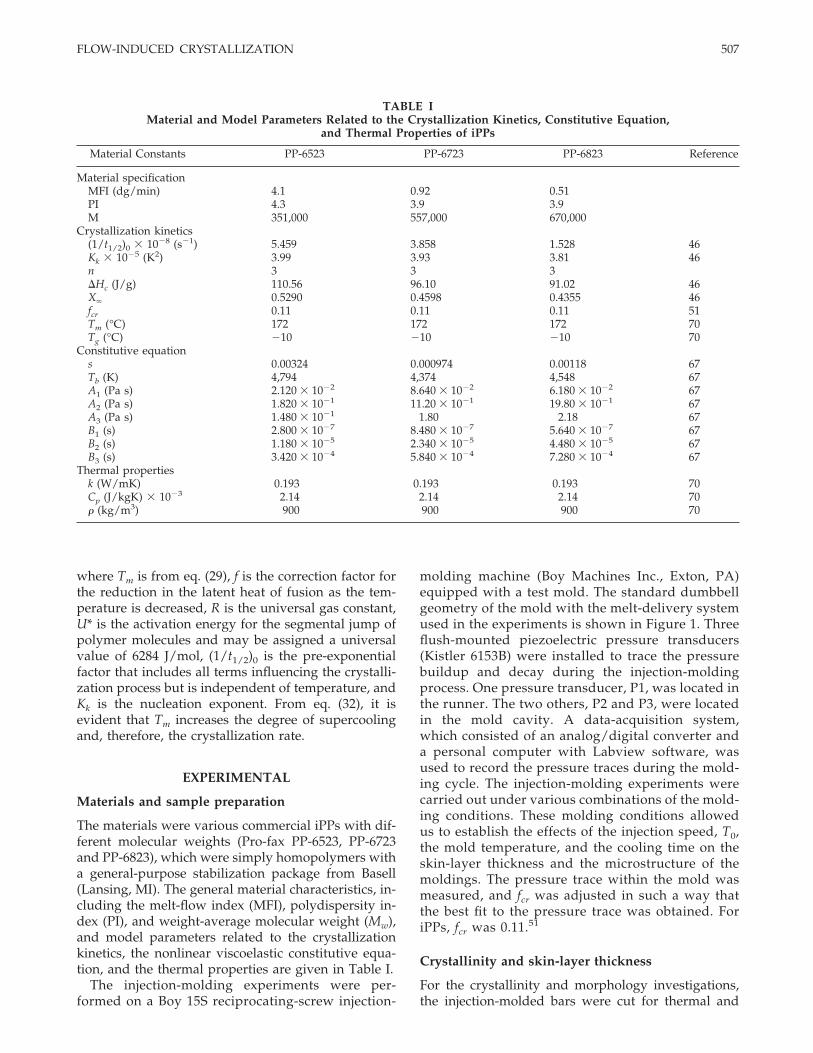
The materials were various commercial iPPs with dif-ferent molecular weights (Pro-fax PP-6523, PP-6723and PP-6823), which were simply homopolymers witha general-purpose stabilization package from Basell(Lansing, MI). The general material characteristics, in-cluding the melt-flow index (MFI), polydispersity in-dex (PI), and weight-average molecular weight (Mw),and model parameters related to the crystallizationkinetics, the nonlinear viscoelastic constitutive equa-tion, and the thermal properties are given in Table I.
The injection-molding experiments were per-formed on a Boy 15S reciprocating-screw injection-
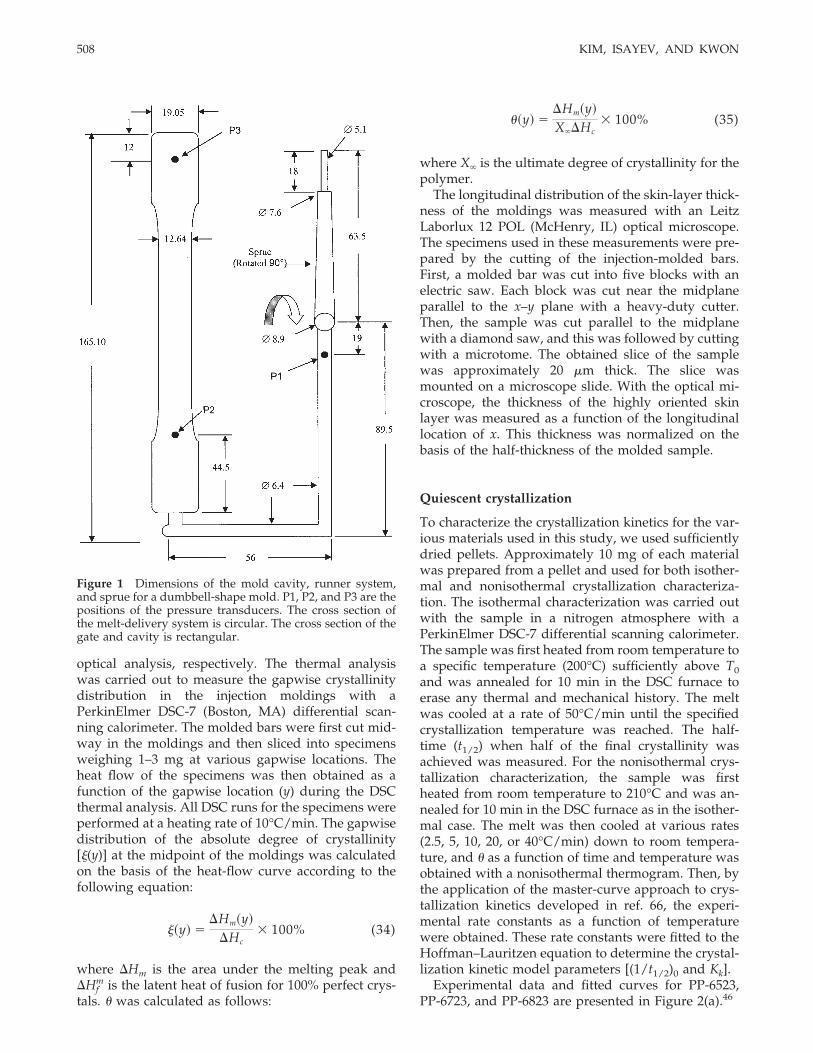
molding machine (Boy Machines Inc., Exton, PA)equipped with a test mold. The standard dumbbellgeometry of the mold with the melt-delivery systemused in the experiments is shown in Figure 1. Threeflush-mounted piezoelectric pressure transducers(Kistler 6153B) were installed to trace the pressurebuildup and decay during the injection-moldingprocess. One pressure transducer, P1, was located inthe runner. The two others, P2 and P3, were locatedin the mold cavity. A data-acquisition system,which consisted of an analog/digital converter anda personal computer with Labview software, wasused to record the pressure traces during the mold-ing cycle. The injection-molding experiments werecarried out under various combinations of the mold-ing conditions. These molding conditions allowedus to establish the effects of the injection speed, T0,the mold temperature, and the cooling time on theskin-layer thickness and the microstructure of themoldings. The pressure trace within the mold wasmeasured, and fcr was adjusted in such a way thatthe best fit to the pressure trace was obtained. ForiPPs, fcr was 0.11.51
Crystallinity and skin-layer thickness
For the crystallinity and morphology investigations,the injection-molded bars were cut for thermal and
TABLE IMaterial and Model Parameters Related to the Crystallization Kinetics, Constitutive Equation,
and Thermal Properties of iPPs
Material Constants PP-6523 PP-6723 PP-6823 Reference
Material specificationMFI (dg/min) 4.1 0.92 0.51PI 4.3 3.9 3.9M 351,000 557,000 670,000
Crystallization kinetics(1/t1/2)0 � 10�8 (s�1) 5.459 3.858 1.528 46Kk � 10�5 (K2) 3.99 3.93 3.81 46n 3 3 3�Hc (J/g) 110.56 96.10 91.02 46X� 0.5290 0.4598 0.4355 46fcr 0.11 0.11 0.11 51Tm (°C) 172 172 172 70Tg (°C) �10 �10 �10 70
Constitutive equations 0.00324 0.000974 0.00118 67Tb (K) 4,794 4,374 4,548 67A1 (Pa s) 2.120 � 10�2 8.640 � 10�2 6.180 � 10�2 67A2 (Pa s) 1.820 � 10�1 11.20 � 10�1 19.80 � 10�1 67A3 (Pa s) 1.480 � 10�1 1.80 2.18 67B1 (s) 2.800 � 10�7 8.480 � 10�7 5.640 � 10�7 67B2 (s) 1.180 � 10�5 2.340 � 10�5 4.480 � 10�5 67B3 (s) 3.420 � 10�4 5.840 � 10�4 7.280 � 10�4 67
Thermal propertiesk (W/mK) 0.193 0.193 0.193 70Cp (J/kgK) � 10�3 2.14 2.14 2.14 70� (kg/m3) 900 900 900 70
FLOW-INDUCED CRYSTALLIZATION 507
optical analysis, respectively. The thermal analysiswas carried out to measure the gapwise crystallinitydistribution in the injection moldings with aPerkinElmer DSC-7 (Boston, MA) differential scan-ning calorimeter. The molded bars were first cut mid-way in the moldings and then sliced into specimensweighing 1–3 mg at various gapwise locations. Theheat flow of the specimens was then obtained as afunction of the gapwise location (y) during the DSCthermal analysis. All DSC runs for the specimens wereperformed at a heating rate of 10°C/min. The gapwisedistribution of the absolute degree of crystallinity[�(y)] at the midpoint of the moldings was calculatedon the basis of the heat-flow curve according to thefollowing equation:
��y� ��Hm�y�
�Hc� 100% (34)
where �Hm is the area under the melting peak and�Hf
m is the latent heat of fusion for 100% perfect crys-tals. � was calculated as follows:
��y� ��Hm�y�
X��Hc� 100% (35)
where X� is the ultimate degree of crystallinity for thepolymer.
The longitudinal distribution of the skin-layer thick-ness of the moldings was measured with an LeitzLaborlux 12 POL (McHenry, IL) optical microscope.The specimens used in these measurements were pre-pared by the cutting of the injection-molded bars.First, a molded bar was cut into five blocks with anelectric saw. Each block was cut near the midplaneparallel to the x–y plane with a heavy-duty cutter.Then, the sample was cut parallel to the midplanewith a diamond saw, and this was followed by cuttingwith a microtome. The obtained slice of the samplewas approximately 20 �m thick. The slice wasmounted on a microscope slide. With the optical mi-croscope, the thickness of the highly oriented skinlayer was measured as a function of the longitudinallocation of x. This thickness was normalized on thebasis of the half-thickness of the molded sample.
Quiescent crystallization
To characterize the crystallization kinetics for the var-ious materials used in this study, we used sufficientlydried pellets. Approximately 10 mg of each materialwas prepared from a pellet and used for both isother-mal and nonisothermal crystallization characteriza-tion. The isothermal characterization was carried outwith the sample in a nitrogen atmosphere with aPerkinElmer DSC-7 differential scanning calorimeter.The sample was first heated from room temperature toa specific temperature (200°C) sufficiently above T0and was annealed for 10 min in the DSC furnace toerase any thermal and mechanical history. The meltwas cooled at a rate of 50°C/min until the specifiedcrystallization temperature was reached. The half-time (t1/2) when half of the final crystallinity wasachieved was measured. For the nonisothermal crys-tallization characterization, the sample was firstheated from room temperature to 210°C and was an-nealed for 10 min in the DSC furnace as in the isother-mal case. The melt was then cooled at various rates(2.5, 5, 10, 20, or 40°C/min) down to room tempera-ture, and � as a function of time and temperature wasobtained with a nonisothermal thermogram. Then, bythe application of the master-curve approach to crys-tallization kinetics developed in ref. 66, the experi-mental rate constants as a function of temperaturewere obtained. These rate constants were fitted to theHoffman–Lauritzen equation to determine the crystal-lization kinetic model parameters [(1/t1/2)0 and Kk].
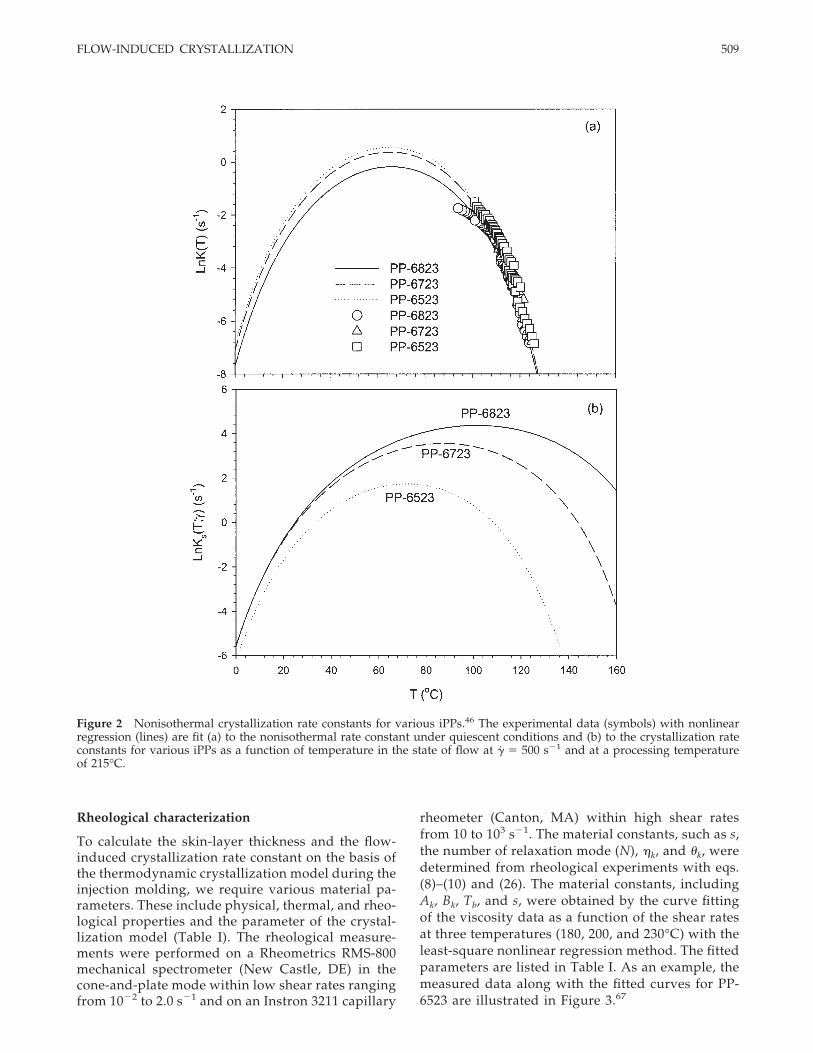
Experimental data and fitted curves for PP-6523,PP-6723, and PP-6823 are presented in Figure 2(a).46
Figure 1 Dimensions of the mold cavity, runner system,and sprue for a dumbbell-shape mold. P1, P2, and P3 are thepositions of the pressure transducers. The cross section ofthe melt-delivery system is circular. The cross section of thegate and cavity is rectangular.
508 KIM, ISAYEV, AND KWON
Rheological characterization
To calculate the skin-layer thickness and the flow-induced crystallization rate constant on the basis ofthe thermodynamic crystallization model during theinjection molding, we require various material pa-rameters. These include physical, thermal, and rheo-logical properties and the parameter of the crystal-lization model (Table I). The rheological measure-ments were performed on a Rheometrics RMS-800mechanical spectrometer (New Castle, DE) in thecone-and-plate mode within low shear rates rangingfrom 10�2 to 2.0 s�1 and on an Instron 3211 capillary
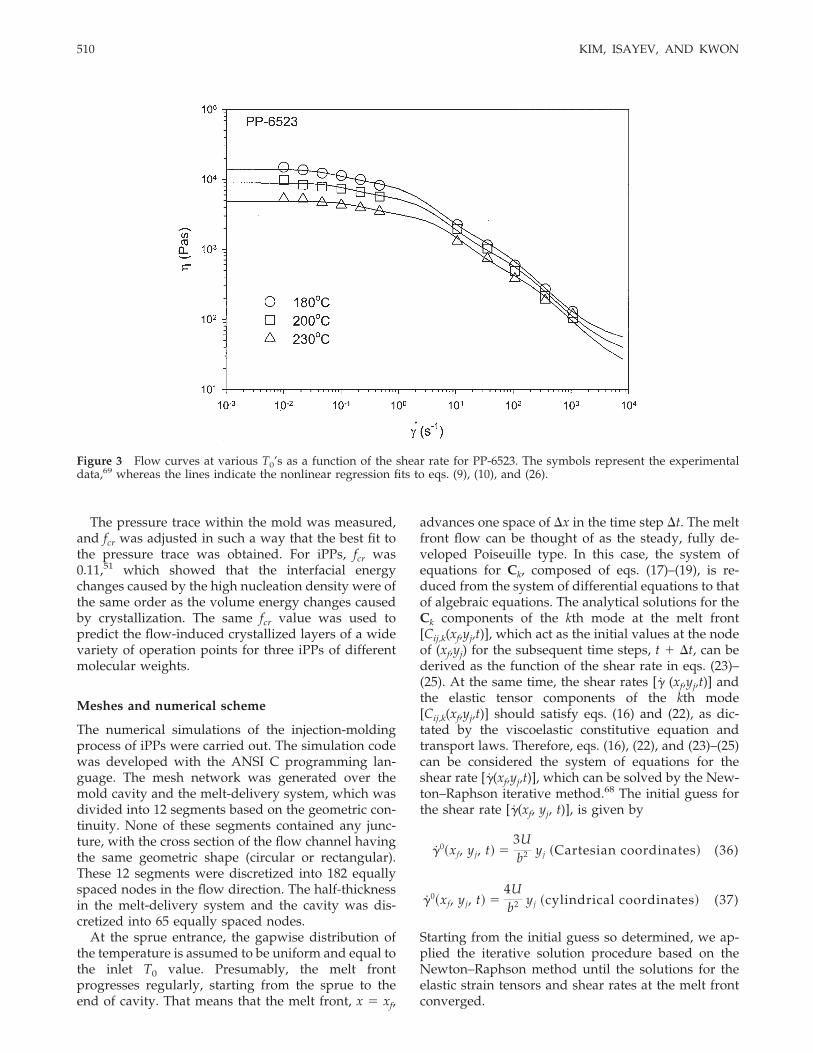
rheometer (Canton, MA) within high shear ratesfrom 10 to 103 s�1. The material constants, such as s,the number of relaxation mode (N), �k, and �k, weredetermined from rheological experiments with eqs.(8)–(10) and (26). The material constants, includingAk, Bk, Tb, and s, were obtained by the curve fittingof the viscosity data as a function of the shear ratesat three temperatures (180, 200, and 230°C) with theleast-square nonlinear regression method. The fittedparameters are listed in Table I. As an example, themeasured data along with the fitted curves for PP-6523 are illustrated in Figure 3.67
Figure 2 Nonisothermal crystallization rate constants for various iPPs.46 The experimental data (symbols) with nonlinearregression (lines) are fit (a) to the nonisothermal rate constant under quiescent conditions and (b) to the crystallization rateconstants for various iPPs as a function of temperature in the state of flow at �̇ � 500 s�1 and at a processing temperatureof 215°C.
FLOW-INDUCED CRYSTALLIZATION 509
The pressure trace within the mold was measured,and fcr was adjusted in such a way that the best fit tothe pressure trace was obtained. For iPPs, fcr was0.11,51 which showed that the interfacial energychanges caused by the high nucleation density were ofthe same order as the volume energy changes causedby crystallization. The same fcr value was used topredict the flow-induced crystallized layers of a widevariety of operation points for three iPPs of differentmolecular weights.
Meshes and numerical scheme
The numerical simulations of the injection-moldingprocess of iPPs were carried out. The simulation codewas developed with the ANSI C programming lan-guage. The mesh network was generated over themold cavity and the melt-delivery system, which wasdivided into 12 segments based on the geometric con-tinuity. None of these segments contained any junc-ture, with the cross section of the flow channel havingthe same geometric shape (circular or rectangular).These 12 segments were discretized into 182 equallyspaced nodes in the flow direction. The half-thicknessin the melt-delivery system and the cavity was dis-cretized into 65 equally spaced nodes.
At the sprue entrance, the gapwise distribution ofthe temperature is assumed to be uniform and equal tothe inlet T0 value. Presumably, the melt frontprogresses regularly, starting from the sprue to theend of cavity. That means that the melt front, x � xf,
advances one space of �x in the time step �t. The meltfront flow can be thought of as the steady, fully de-veloped Poiseuille type. In this case, the system ofequations for Ck, composed of eqs. (17)–(19), is re-duced from the system of differential equations to thatof algebraic equations. The analytical solutions for theCk components of the kth mode at the melt front[Cij,k(xf,yj,t)], which act as the initial values at the nodeof (xf,yj) for the subsequent time steps, t � �t, can bederived as the function of the shear rate in eqs. (23)–(25). At the same time, the shear rates [�̇ (xf,yj,t)] andthe elastic tensor components of the kth mode[Cij,k(xf,yj,t)] should satisfy eqs. (16) and (22), as dic-tated by the viscoelastic constitutive equation andtransport laws. Therefore, eqs. (16), (22), and (23)–(25)can be considered the system of equations for theshear rate [�̇(xf,yj,t)], which can be solved by the New-ton–Raphson iterative method.68 The initial guess forthe shear rate [�̇(xf, yj, t)], is given by
�̇0�xf, yj, t� �3Ub2 yj �Cartesian coordinates� (36)
�̇0�xf, yj, t� �4Ub2 yj �cylindrical coordinates� (37)
Starting from the initial guess so determined, we ap-plied the iterative solution procedure based on theNewton–Raphson method until the solutions for theelastic strain tensors and shear rates at the melt frontconverged.
Figure 3 Flow curves at various T0’s as a function of the shear rate for PP-6523. The symbols represent the experimentaldata,69 whereas the lines indicate the nonlinear regression fits to eqs. (9), (10), and (26).
510 KIM, ISAYEV, AND KWON
In computation, the melt front moves along the flowdirection until it reaches the end of the cavity. Fornodes other than those at the melt front and the gate inthe flow domain, (xi,yi) with i � f, which are termedinternal nodes, the iterative method with the numericalrelaxation must be used to directly solve the system ofequations composed of eqs. (16), (22), and (17)–(19),with Cij,k(xi,yj,t) and �̇(xi,yj,t) at the node as the un-knowns. The initial guess for each of the unknowns isits value at the previous time, namely, Cij,k(xi,yj,t � �t)and �̇(xi,yj,t � �t). The shear rates and the elastic straintensor components are numerically determined withthe convergence parameters.
The convective term in eqs. (17) and (18) was han-dled with newly calculated time step, �t�, by the con-sideration of flow in the filling stage:
�t� �1
1/�t � u�xi, yj, t�/�x (38)
With the converged value of Cij,k(xi,yj,t), �(xi,yj,t),�Sel(xi,yj,t), v(xi,yj,t), and �(xi,yj,t) can be updated. Af-ter the mold cavity is filled completely, the coolingstage starts.
In the cooling stage, the flow field presumably van-ishes. The velocity and shear rates are set to zero. The
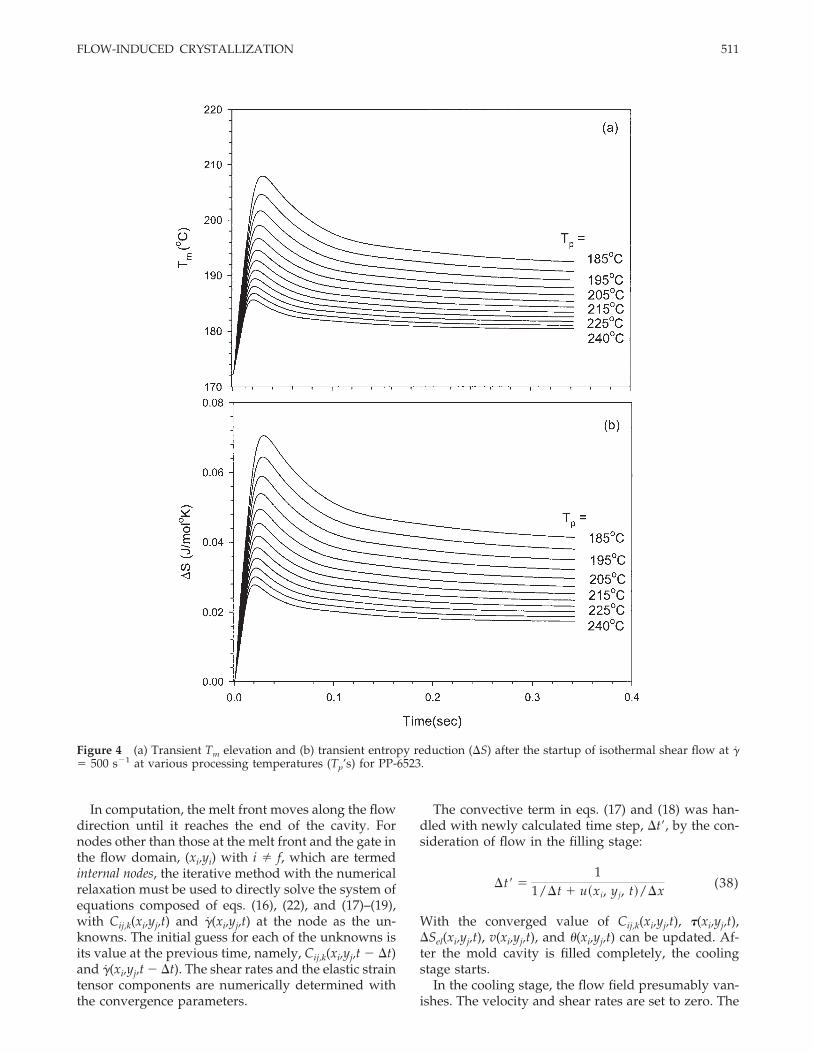
Figure 4 (a) Transient Tm elevation and (b) transient entropy reduction (�S) after the startup of isothermal shear flow at �̇� 500 s�1 at various processing temperatures (Tp’s) for PP-6523.
FLOW-INDUCED CRYSTALLIZATION 511
flow stresses that developed during the filling stagerelax, governed by the viscoelastic constitutive equa-tion [eqs. (17)–(19)]. Therefore, the numerical compu-tation scheme for the relaxation of the flow stresses isgreatly simplified in comparison with that of the fill-ing stage. The computational procedure is similar tothat explained in the filling stage, except that the cal-culations related to the flow field disappear with �̇� �x § 0.
The skin-layer thickness was determined by a com-parison of Tm determined from eq. (29) with the localT0 value calculated from eq. (4). When Tm is equal tothe local temperature, flow-induced crystallization
takes place. For fast-crystallizing polymers such asiPP, the viscosity increases tremendously, and the ori-entation and elastic strain that result from the stress atthat moment freezes, and a highly oriented skin layerforms. Because of the elevation of Tm
0 , the degree ofsupercooling increases, and so the rate of crystalliza-tion increases conspicuously. The simulated resultsunder various molding conditions for various iPPswere compared with the measured data in an attemptto understand the mechanism for the development ofthe skin layer and crystallinity. The influences of themolecular weight and the molding conditions on thefinal morphology were investigated.
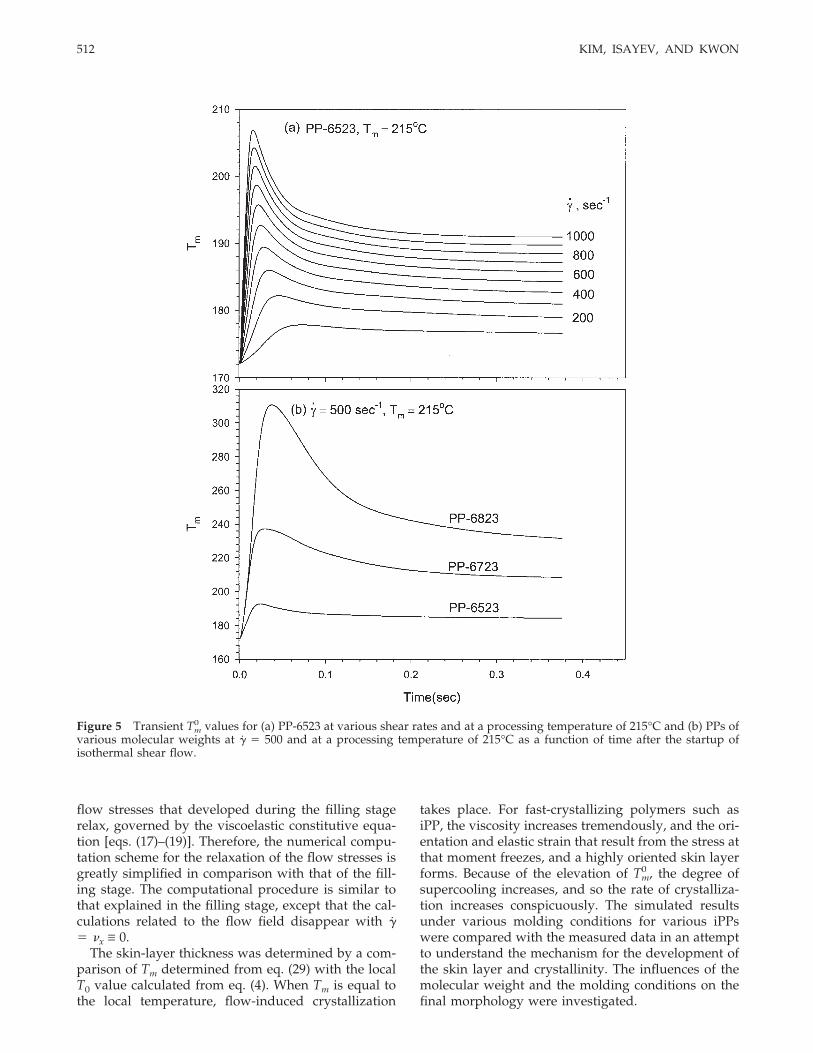
Figure 5 Transient Tm0 values for (a) PP-6523 at various shear rates and at a processing temperature of 215°C and (b) PPs of
various molecular weights at �̇ � 500 and at a processing temperature of 215°C as a function of time after the startup ofisothermal shear flow.
512 KIM, ISAYEV, AND KWON
RESULTS AND DISCUSSION
Tm0 elevation under isothermal conditions
The entropy change (�Sel) reflects the energy changeassociated with the change in the molecular arrange-
ments. The higher the orientation is of the polymermelts, the lower the number is of possible arrange-ments available to the segments of the polymer mol-ecules. The degree of orientation affects the entropybetween the unoriented and oriented melt in the equi-librium state.
The entropy reduction can be obtained from eq. (30)on the basis of the calculated first invariant of Ck. Ck isa function of time, temperature, and shear rate. Figure4 illustrates the transient Tm values according to eqs.(29) and (30) and the transient entropy reduction dueto eq. (30) after the startup of isothermal shear flow atthe constant shear rate of 500 s�1 and at various pro-cessing temperatures for PP-6523. Figure 4(a) showsthat the transient Tm
0 value first increases linearly withtime at small times, then deviates from the linearityand overshoots, and finally reaches a steady-statevalue, which is higher at the lower processing temper-ature. The sharp increase in the entropy reductionduring the early stage, shown in Figure 4(b), comesfrom the elasticity of the polymer melt, whereas thesteady-state entropy change happens when the relax-ation behavior is completed. The tendencies of en-tropy reduction and Tm
0 elevation are very similarbecause the Tm elevation is calculated from the en-tropy reduction.
Figure 5(a) shows the transient Tm0 elevation as a
function of time for PP-6523 at various shear rates anda constant processing temperature of 215°C. Tm
0 in-creases with the shear rate because at high shear ratesstresses increase and induce high molecular orienta-tion and, therefore, entropy change. The degree of T0elevation is predominant for high-molecular-weightPP-6823. This is shown in Figure 5(b), which indicatesthe transient Tm
0 values of polypropylenes (PPs) ofvarious molecular weights at a constant shear rate of500 s�1 and at a processing temperature of 215°C.Evidently, the entropy reduction level increases withthe molecular weight and the magnitude of the shearrate and decreases with an increase in the processingtemperature. A higher stress level is needed to achievethe same magnitude of the shear rate for high-molec-ular-weight PP. This high stress level increases thedegree of Tm elevation.
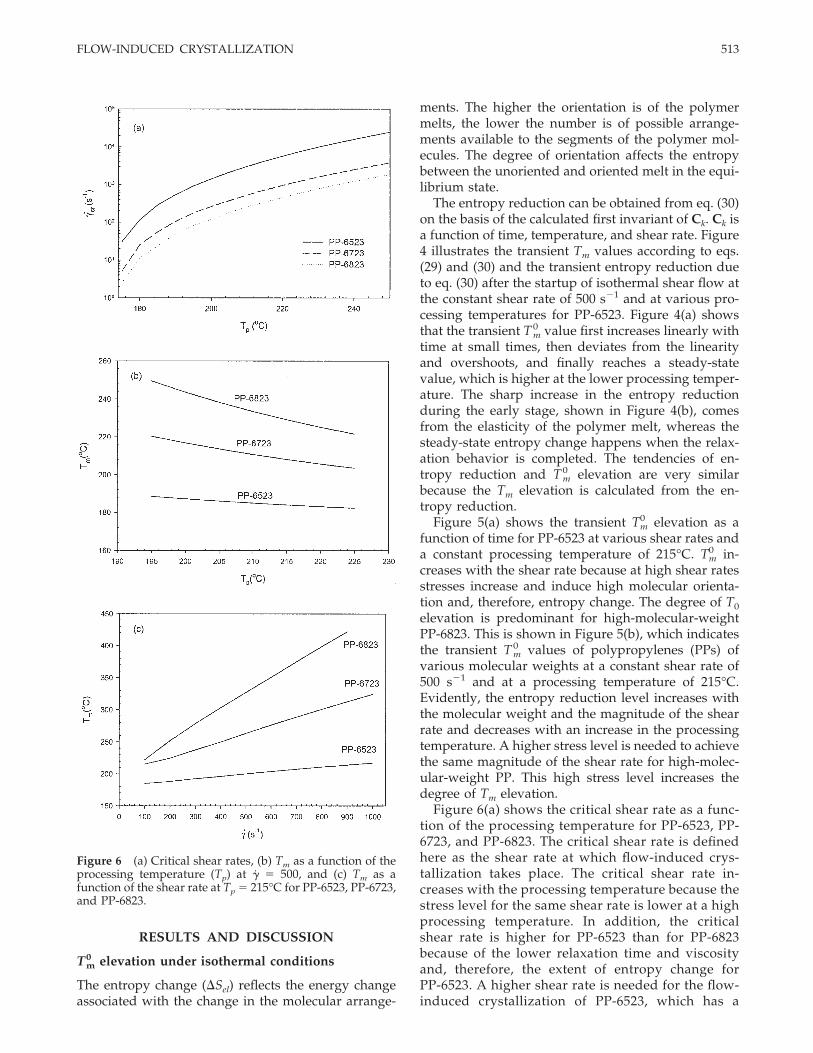
Figure 6(a) shows the critical shear rate as a func-tion of the processing temperature for PP-6523, PP-6723, and PP-6823. The critical shear rate is definedhere as the shear rate at which flow-induced crys-tallization takes place. The critical shear rate in-creases with the processing temperature because thestress level for the same shear rate is lower at a highprocessing temperature. In addition, the criticalshear rate is higher for PP-6523 than for PP-6823because of the lower relaxation time and viscosityand, therefore, the extent of entropy change forPP-6523. A higher shear rate is needed for the flow-induced crystallization of PP-6523, which has a
Figure 6 (a) Critical shear rates, (b) Tm as a function of theprocessing temperature (Tp) at �̇ � 500, and (c) Tm as afunction of the shear rate at Tp � 215°C for PP-6523, PP-6723,and PP-6823.
FLOW-INDUCED CRYSTALLIZATION 513
lower relaxation time. The effect of the molecularweight on the elevation of Tm
0 versus the processingtemperature at a constant shear rate of 500 s�1 isillustrated in Figure 6(b). Clearly, the extent of ele-vation of T m
0 increases with an increase in the mo-lecular weight. The extent of elevation of Tm
0 ofPP-6523 is lesser because of the lower stress levelattained in the sample of the low molecular weight,and it becomes smaller at a higher processing tem-perature for the same reason.
Figure 6(c) demonstrates the elevation of Tm0 as a
function of the shear rates for PP-6523, PP-6723, andPP-6823 at a constant processing temperature of215°C. At the same shear rate, the elevation of Tm
0 ishigher for higher molecular weight PP and increaseswith the shear rate. High-molecular-weight PP, suchas PP-6823, has a higher relaxation time, and the ex-tent of the elevation of Tm
0 is higher than that oflow-molecular-weight PP.
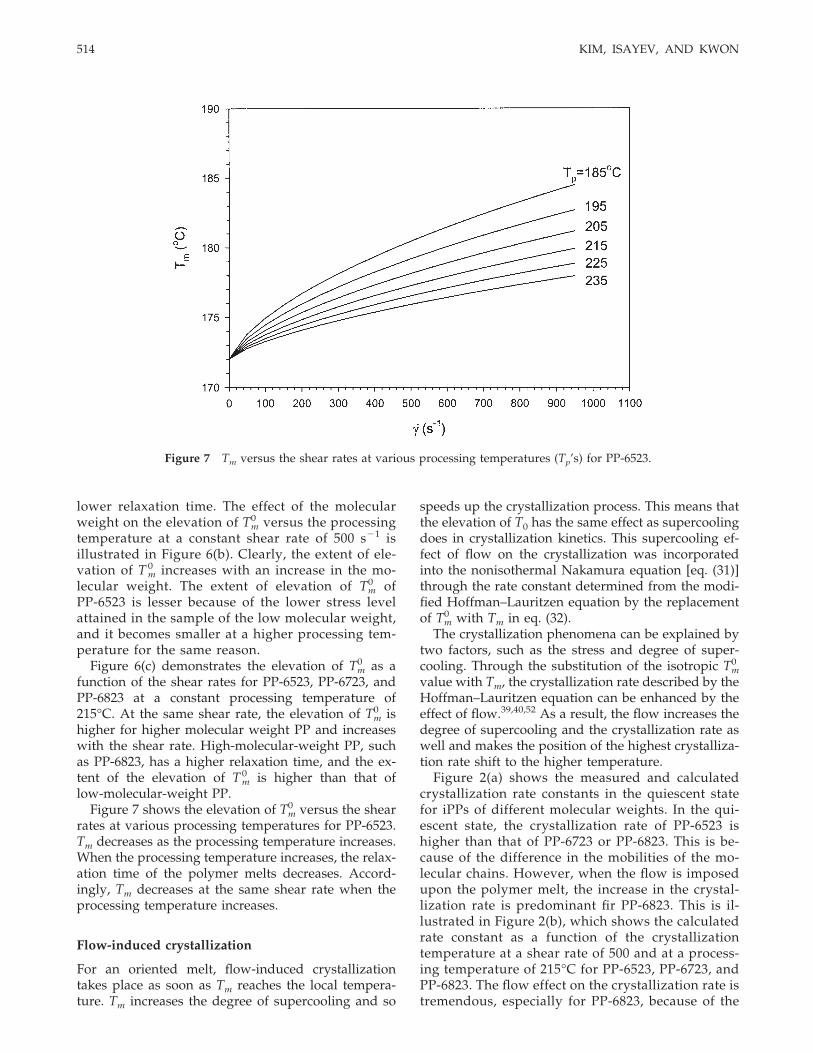
Figure 7 shows the elevation of Tm0 versus the shear
rates at various processing temperatures for PP-6523.Tm decreases as the processing temperature increases.When the processing temperature increases, the relax-ation time of the polymer melts decreases. Accord-ingly, Tm decreases at the same shear rate when theprocessing temperature increases.
Flow-induced crystallization
For an oriented melt, flow-induced crystallizationtakes place as soon as Tm reaches the local tempera-ture. Tm increases the degree of supercooling and so
speeds up the crystallization process. This means thatthe elevation of T0 has the same effect as supercoolingdoes in crystallization kinetics. This supercooling ef-fect of flow on the crystallization was incorporatedinto the nonisothermal Nakamura equation [eq. (31)]through the rate constant determined from the modi-fied Hoffman–Lauritzen equation by the replacementof Tm
0 with Tm in eq. (32).The crystallization phenomena can be explained by
two factors, such as the stress and degree of super-cooling. Through the substitution of the isotropic Tm
0
value with Tm, the crystallization rate described by theHoffman–Lauritzen equation can be enhanced by theeffect of flow.39,40,52 As a result, the flow increases thedegree of supercooling and the crystallization rate aswell and makes the position of the highest crystalliza-tion rate shift to the higher temperature.
Figure 2(a) shows the measured and calculatedcrystallization rate constants in the quiescent statefor iPPs of different molecular weights. In the qui-escent state, the crystallization rate of PP-6523 ishigher than that of PP-6723 or PP-6823. This is be-cause of the difference in the mobilities of the mo-lecular chains. However, when the flow is imposedupon the polymer melt, the increase in the crystal-lization rate is predominant fir PP-6823. This is il-lustrated in Figure 2(b), which shows the calculatedrate constant as a function of the crystallizationtemperature at a shear rate of 500 and at a process-ing temperature of 215°C for PP-6523, PP-6723, andPP-6823. The flow effect on the crystallization rate istremendous, especially for PP-6823, because of the
Figure 7 Tm versus the shear rates at various processing temperatures (Tp’s) for PP-6523.
514 KIM, ISAYEV, AND KWON
higher relaxation time and greater enhancement ofthe rate constant than for low-molecular-weight PP-6523.
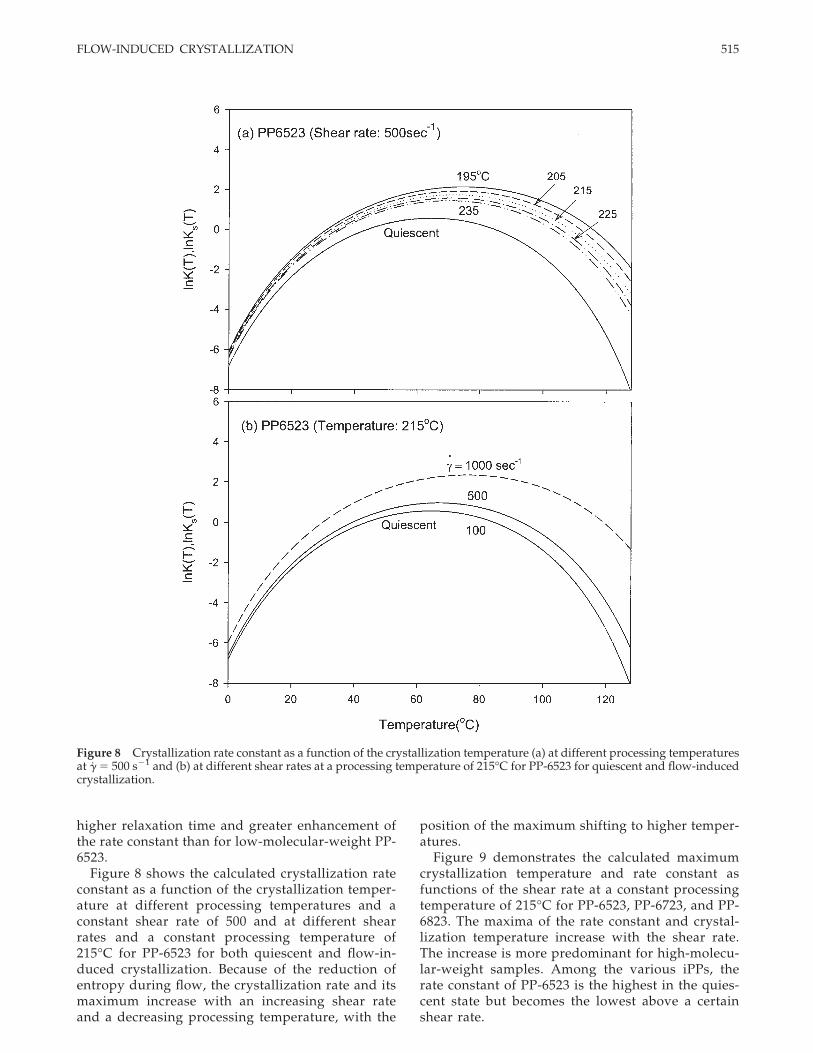
Figure 8 shows the calculated crystallization rateconstant as a function of the crystallization temper-ature at different processing temperatures and aconstant shear rate of 500 and at different shearrates and a constant processing temperature of215°C for PP-6523 for both quiescent and flow-in-duced crystallization. Because of the reduction ofentropy during flow, the crystallization rate and itsmaximum increase with an increasing shear rateand a decreasing processing temperature, with the
position of the maximum shifting to higher temper-atures.
Figure 9 demonstrates the calculated maximumcrystallization temperature and rate constant asfunctions of the shear rate at a constant processingtemperature of 215°C for PP-6523, PP-6723, and PP-6823. The maxima of the rate constant and crystal-lization temperature increase with the shear rate.The increase is more predominant for high-molecu-lar-weight samples. Among the various iPPs, therate constant of PP-6523 is the highest in the quies-cent state but becomes the lowest above a certainshear rate.
Figure 8 Crystallization rate constant as a function of the crystallization temperature (a) at different processing temperaturesat �̇ � 500 s�1 and (b) at different shear rates at a processing temperature of 215°C for PP-6523 for quiescent and flow-inducedcrystallization.
FLOW-INDUCED CRYSTALLIZATION 515
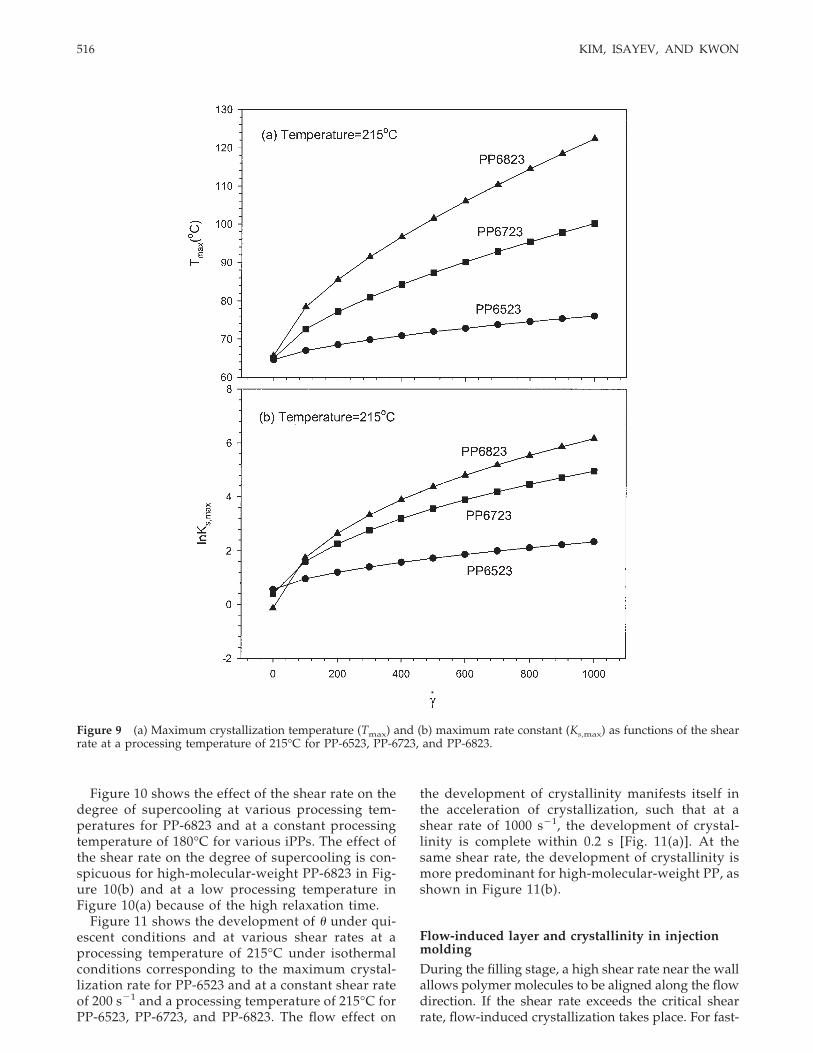
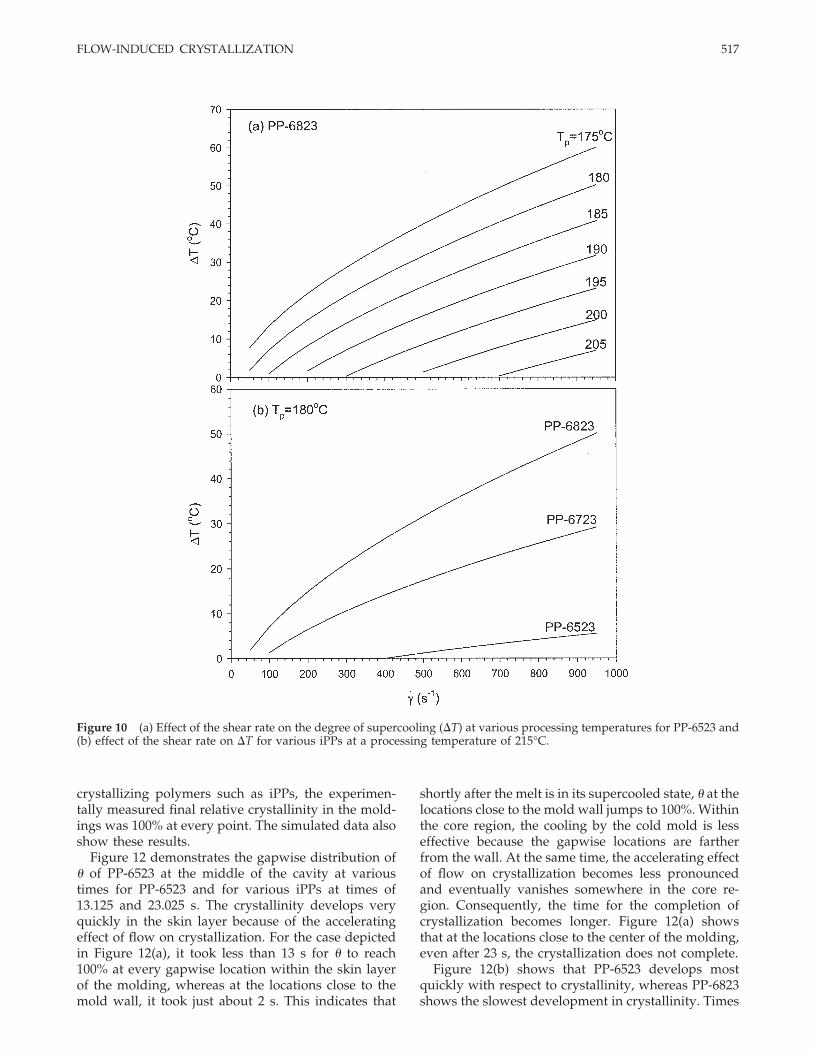
Figure 10 shows the effect of the shear rate on thedegree of supercooling at various processing tem-peratures for PP-6823 and at a constant processingtemperature of 180°C for various iPPs. The effect ofthe shear rate on the degree of supercooling is con-spicuous for high-molecular-weight PP-6823 in Fig-ure 10(b) and at a low processing temperature inFigure 10(a) because of the high relaxation time.
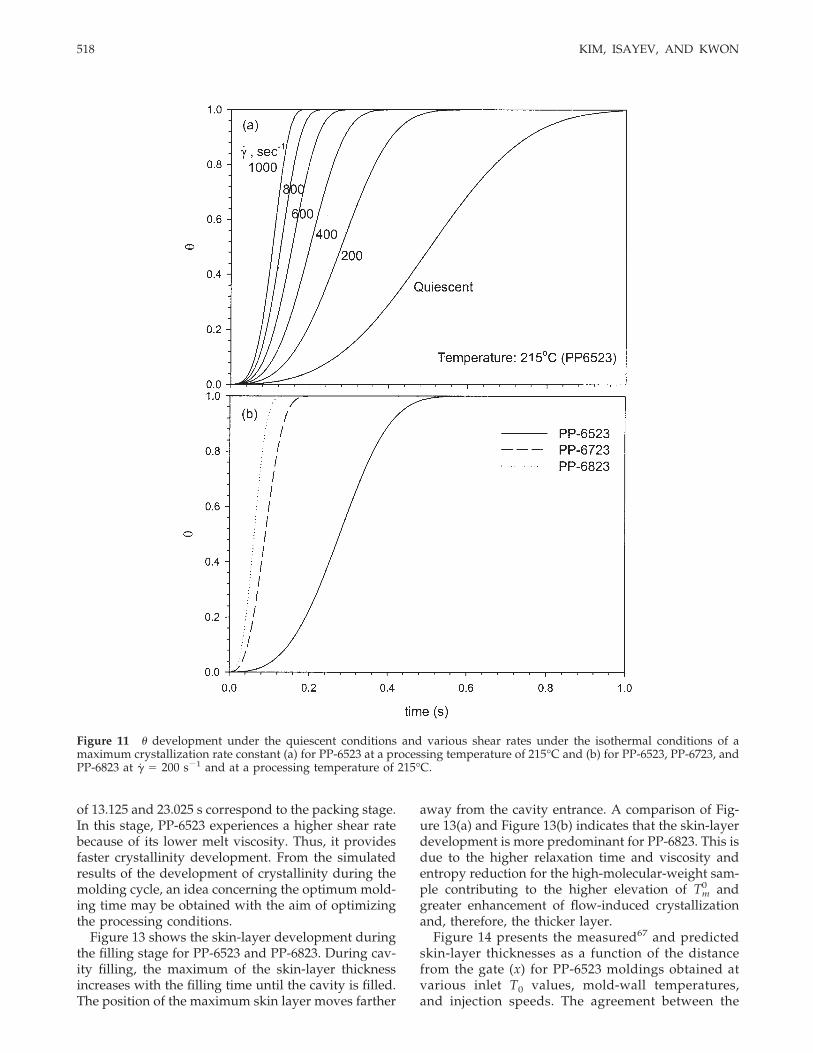
Figure 11 shows the development of � under qui-escent conditions and at various shear rates at aprocessing temperature of 215°C under isothermalconditions corresponding to the maximum crystal-lization rate for PP-6523 and at a constant shear rateof 200 s�1 and a processing temperature of 215°C forPP-6523, PP-6723, and PP-6823. The flow effect on
the development of crystallinity manifests itself inthe acceleration of crystallization, such that at ashear rate of 1000 s�1, the development of crystal-linity is complete within 0.2 s [Fig. 11(a)]. At thesame shear rate, the development of crystallinity ismore predominant for high-molecular-weight PP, asshown in Figure 11(b).
Flow-induced layer and crystallinity in injectionmolding
During the filling stage, a high shear rate near the wallallows polymer molecules to be aligned along the flowdirection. If the shear rate exceeds the critical shearrate, flow-induced crystallization takes place. For fast-
Figure 9 (a) Maximum crystallization temperature (Tmax) and (b) maximum rate constant (Ks,max) as functions of the shearrate at a processing temperature of 215°C for PP-6523, PP-6723, and PP-6823.
516 KIM, ISAYEV, AND KWON
crystallizing polymers such as iPPs, the experimen-tally measured final relative crystallinity in the mold-ings was 100% at every point. The simulated data alsoshow these results.
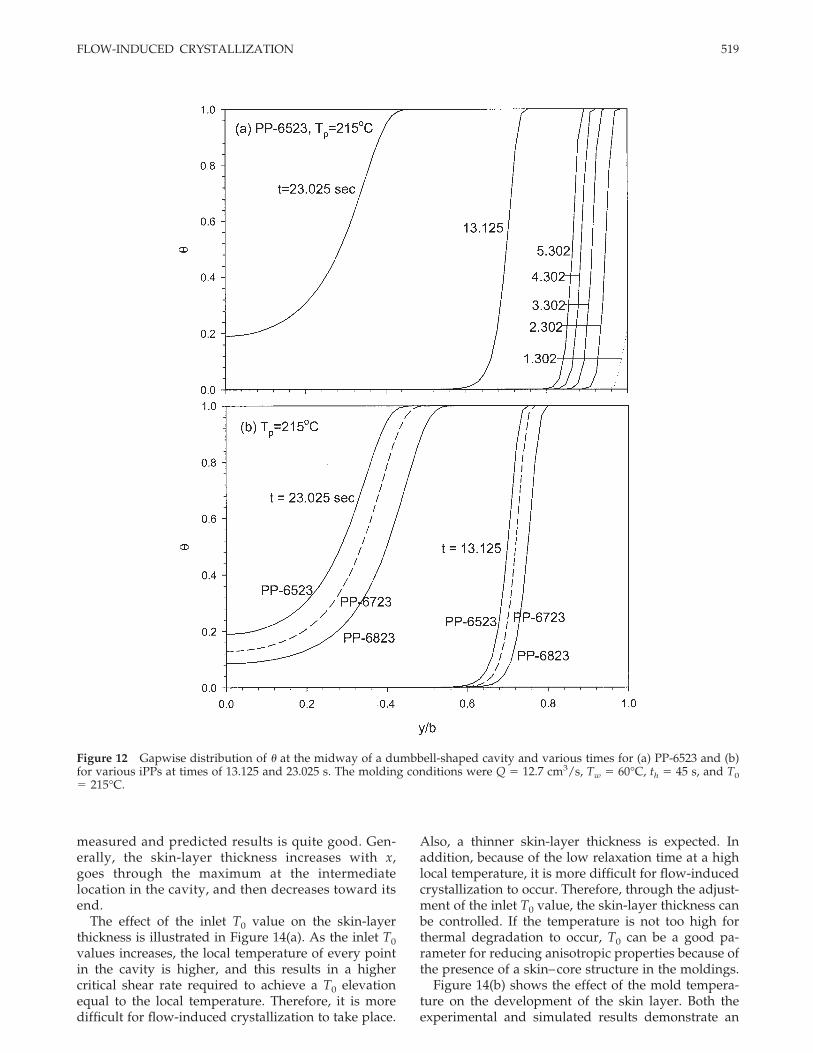
Figure 12 demonstrates the gapwise distribution of� of PP-6523 at the middle of the cavity at varioustimes for PP-6523 and for various iPPs at times of13.125 and 23.025 s. The crystallinity develops veryquickly in the skin layer because of the acceleratingeffect of flow on crystallization. For the case depictedin Figure 12(a), it took less than 13 s for � to reach100% at every gapwise location within the skin layerof the molding, whereas at the locations close to themold wall, it took just about 2 s. This indicates that
shortly after the melt is in its supercooled state, � at thelocations close to the mold wall jumps to 100%. Withinthe core region, the cooling by the cold mold is lesseffective because the gapwise locations are fartherfrom the wall. At the same time, the accelerating effectof flow on crystallization becomes less pronouncedand eventually vanishes somewhere in the core re-gion. Consequently, the time for the completion ofcrystallization becomes longer. Figure 12(a) showsthat at the locations close to the center of the molding,even after 23 s, the crystallization does not complete.
Figure 12(b) shows that PP-6523 develops mostquickly with respect to crystallinity, whereas PP-6823shows the slowest development in crystallinity. Times
Figure 10 (a) Effect of the shear rate on the degree of supercooling (�T) at various processing temperatures for PP-6523 and(b) effect of the shear rate on �T for various iPPs at a processing temperature of 215°C.
FLOW-INDUCED CRYSTALLIZATION 517
of 13.125 and 23.025 s correspond to the packing stage.In this stage, PP-6523 experiences a higher shear ratebecause of its lower melt viscosity. Thus, it providesfaster crystallinity development. From the simulatedresults of the development of crystallinity during themolding cycle, an idea concerning the optimum mold-ing time may be obtained with the aim of optimizingthe processing conditions.
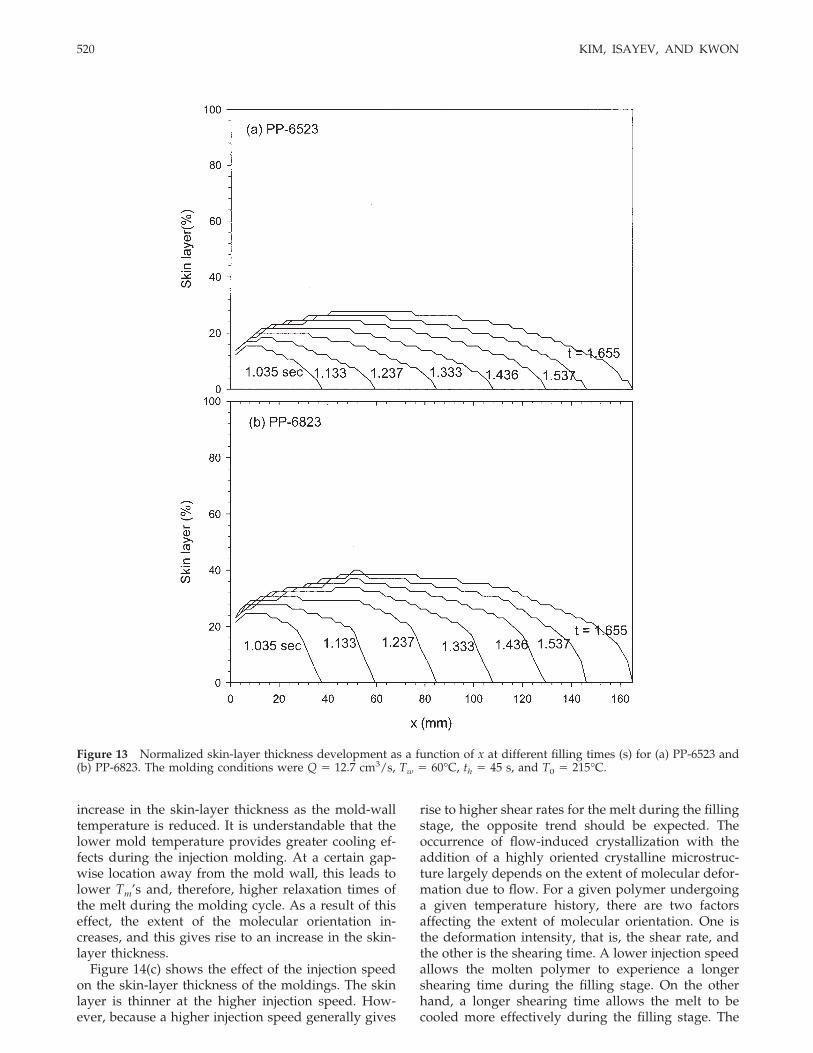
Figure 13 shows the skin-layer development duringthe filling stage for PP-6523 and PP-6823. During cav-ity filling, the maximum of the skin-layer thicknessincreases with the filling time until the cavity is filled.The position of the maximum skin layer moves farther
away from the cavity entrance. A comparison of Fig-ure 13(a) and Figure 13(b) indicates that the skin-layerdevelopment is more predominant for PP-6823. This isdue to the higher relaxation time and viscosity andentropy reduction for the high-molecular-weight sam-ple contributing to the higher elevation of Tm
0 andgreater enhancement of flow-induced crystallizationand, therefore, the thicker layer.
Figure 14 presents the measured67 and predictedskin-layer thicknesses as a function of the distancefrom the gate (x) for PP-6523 moldings obtained atvarious inlet T0 values, mold-wall temperatures,and injection speeds. The agreement between the
Figure 11 � development under the quiescent conditions and various shear rates under the isothermal conditions of amaximum crystallization rate constant (a) for PP-6523 at a processing temperature of 215°C and (b) for PP-6523, PP-6723, andPP-6823 at �̇ � 200 s�1 and at a processing temperature of 215°C.
518 KIM, ISAYEV, AND KWON
measured and predicted results is quite good. Gen-erally, the skin-layer thickness increases with x,goes through the maximum at the intermediatelocation in the cavity, and then decreases toward itsend.
The effect of the inlet T0 value on the skin-layerthickness is illustrated in Figure 14(a). As the inlet T0values increases, the local temperature of every pointin the cavity is higher, and this results in a highercritical shear rate required to achieve a T0 elevationequal to the local temperature. Therefore, it is moredifficult for flow-induced crystallization to take place.
Also, a thinner skin-layer thickness is expected. Inaddition, because of the low relaxation time at a highlocal temperature, it is more difficult for flow-inducedcrystallization to occur. Therefore, through the adjust-ment of the inlet T0 value, the skin-layer thickness canbe controlled. If the temperature is not too high forthermal degradation to occur, T0 can be a good pa-rameter for reducing anisotropic properties because ofthe presence of a skin–core structure in the moldings.
Figure 14(b) shows the effect of the mold tempera-ture on the development of the skin layer. Both theexperimental and simulated results demonstrate an
Figure 12 Gapwise distribution of � at the midway of a dumbbell-shaped cavity and various times for (a) PP-6523 and (b)for various iPPs at times of 13.125 and 23.025 s. The molding conditions were Q � 12.7 cm3/s, Tw � 60°C, th � 45 s, and T0� 215°C.
FLOW-INDUCED CRYSTALLIZATION 519
increase in the skin-layer thickness as the mold-walltemperature is reduced. It is understandable that thelower mold temperature provides greater cooling ef-fects during the injection molding. At a certain gap-wise location away from the mold wall, this leads tolower Tm’s and, therefore, higher relaxation times ofthe melt during the molding cycle. As a result of thiseffect, the extent of the molecular orientation in-creases, and this gives rise to an increase in the skin-layer thickness.
Figure 14(c) shows the effect of the injection speedon the skin-layer thickness of the moldings. The skinlayer is thinner at the higher injection speed. How-ever, because a higher injection speed generally gives
rise to higher shear rates for the melt during the fillingstage, the opposite trend should be expected. Theoccurrence of flow-induced crystallization with theaddition of a highly oriented crystalline microstruc-ture largely depends on the extent of molecular defor-mation due to flow. For a given polymer undergoinga given temperature history, there are two factorsaffecting the extent of molecular orientation. One isthe deformation intensity, that is, the shear rate, andthe other is the shearing time. A lower injection speedallows the molten polymer to experience a longershearing time during the filling stage. On the otherhand, a longer shearing time allows the melt to becooled more effectively during the filling stage. The
Figure 13 Normalized skin-layer thickness development as a function of x at different filling times (s) for (a) PP-6523 and(b) PP-6823. The molding conditions were Q � 12.7 cm3/s, Tw � 60°C, th � 45 s, and T0 � 215°C.
520 KIM, ISAYEV, AND KWON
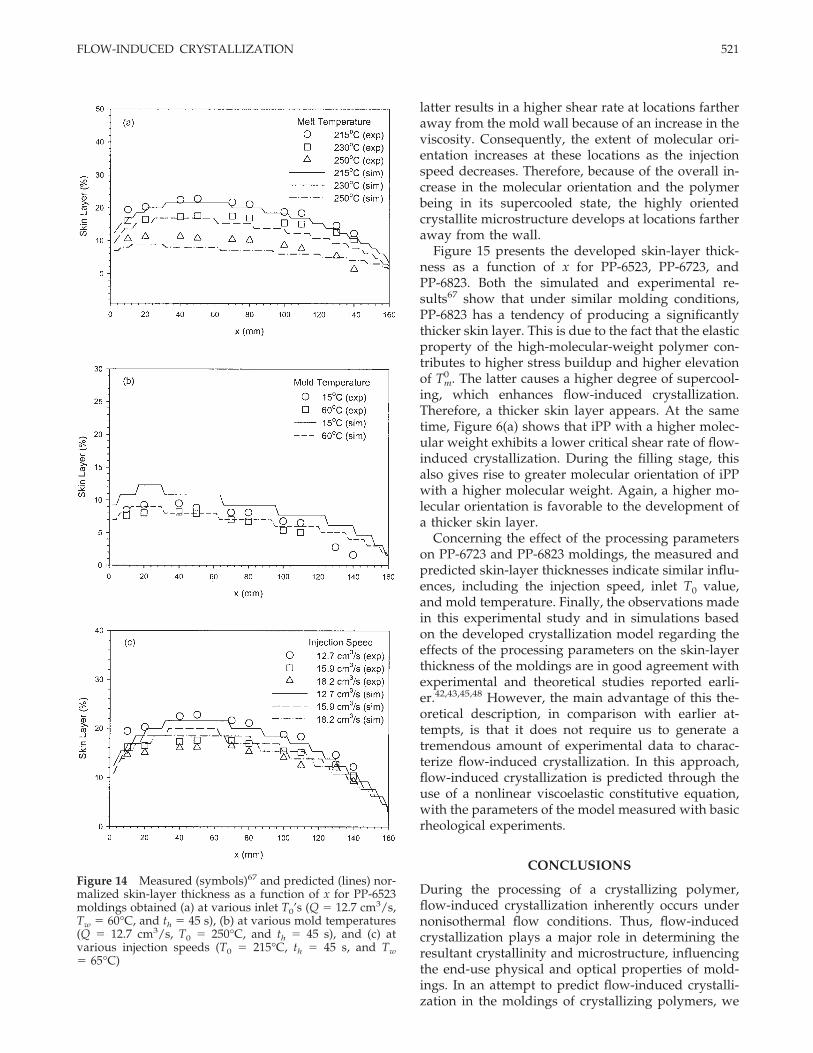
latter results in a higher shear rate at locations fartheraway from the mold wall because of an increase in theviscosity. Consequently, the extent of molecular ori-entation increases at these locations as the injectionspeed decreases. Therefore, because of the overall in-crease in the molecular orientation and the polymerbeing in its supercooled state, the highly orientedcrystallite microstructure develops at locations fartheraway from the wall.
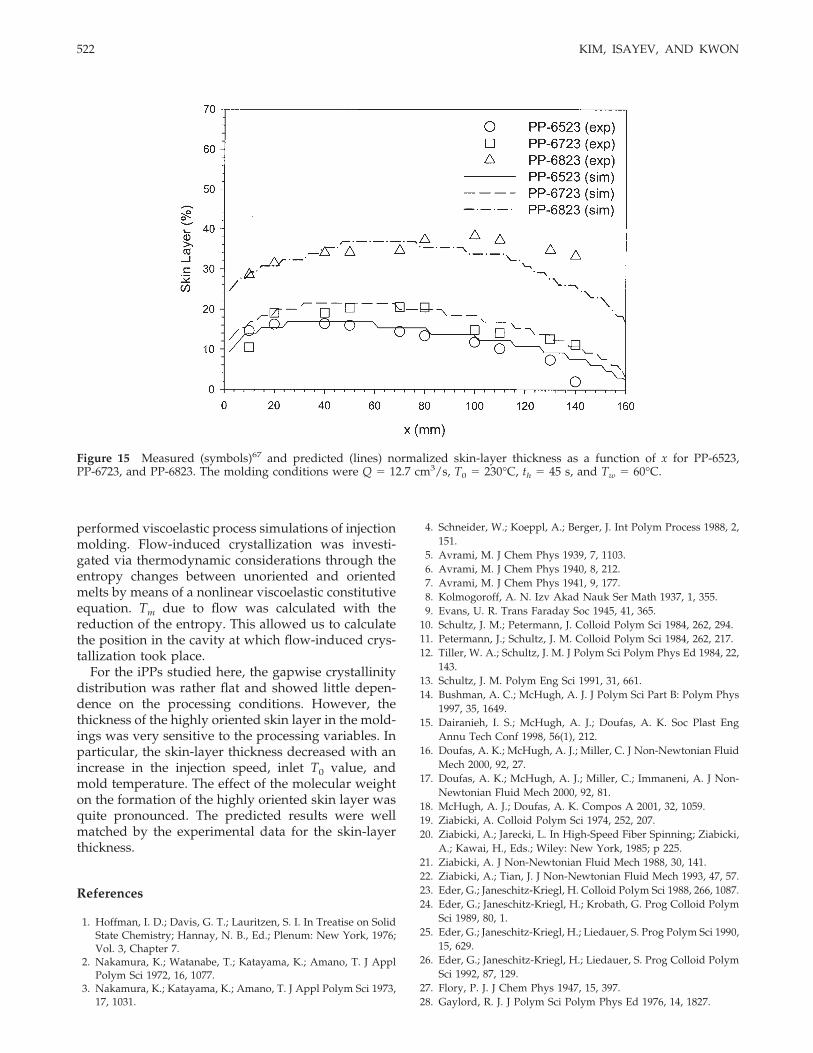
Figure 15 presents the developed skin-layer thick-ness as a function of x for PP-6523, PP-6723, andPP-6823. Both the simulated and experimental re-sults67 show that under similar molding conditions,PP-6823 has a tendency of producing a significantlythicker skin layer. This is due to the fact that the elasticproperty of the high-molecular-weight polymer con-tributes to higher stress buildup and higher elevationof Tm
0 . The latter causes a higher degree of supercool-ing, which enhances flow-induced crystallization.Therefore, a thicker skin layer appears. At the sametime, Figure 6(a) shows that iPP with a higher molec-ular weight exhibits a lower critical shear rate of flow-induced crystallization. During the filling stage, thisalso gives rise to greater molecular orientation of iPPwith a higher molecular weight. Again, a higher mo-lecular orientation is favorable to the development ofa thicker skin layer.
Concerning the effect of the processing parameterson PP-6723 and PP-6823 moldings, the measured andpredicted skin-layer thicknesses indicate similar influ-ences, including the injection speed, inlet T0 value,and mold temperature. Finally, the observations madein this experimental study and in simulations basedon the developed crystallization model regarding theeffects of the processing parameters on the skin-layerthickness of the moldings are in good agreement withexperimental and theoretical studies reported earli-er.42,43,45,48 However, the main advantage of this the-oretical description, in comparison with earlier at-tempts, is that it does not require us to generate atremendous amount of experimental data to charac-terize flow-induced crystallization. In this approach,flow-induced crystallization is predicted through theuse of a nonlinear viscoelastic constitutive equation,with the parameters of the model measured with basicrheological experiments.
CONCLUSIONS
During the processing of a crystallizing polymer,flow-induced crystallization inherently occurs undernonisothermal flow conditions. Thus, flow-inducedcrystallization plays a major role in determining theresultant crystallinity and microstructure, influencingthe end-use physical and optical properties of mold-ings. In an attempt to predict flow-induced crystalli-zation in the moldings of crystallizing polymers, we
Figure 14 Measured (symbols)67 and predicted (lines) nor-malized skin-layer thickness as a function of x for PP-6523moldings obtained (a) at various inlet T0’s (Q � 12.7 cm3/s,Tw � 60°C, and th � 45 s), (b) at various mold temperatures(Q � 12.7 cm3/s, T0 � 250°C, and th � 45 s), and (c) atvarious injection speeds (T0 � 215°C, th � 45 s, and Tw� 65°C)
FLOW-INDUCED CRYSTALLIZATION 521
performed viscoelastic process simulations of injectionmolding. Flow-induced crystallization was investi-gated via thermodynamic considerations through theentropy changes between unoriented and orientedmelts by means of a nonlinear viscoelastic constitutiveequation. Tm due to flow was calculated with thereduction of the entropy. This allowed us to calculatethe position in the cavity at which flow-induced crys-tallization took place.
For the iPPs studied here, the gapwise crystallinitydistribution was rather flat and showed little depen-dence on the processing conditions. However, thethickness of the highly oriented skin layer in the mold-ings was very sensitive to the processing variables. Inparticular, the skin-layer thickness decreased with anincrease in the injection speed, inlet T0 value, andmold temperature. The effect of the molecular weighton the formation of the highly oriented skin layer wasquite pronounced. The predicted results were wellmatched by the experimental data for the skin-layerthickness.
References
1. Hoffman, I. D.; Davis, G. T.; Lauritzen, S. I. In Treatise on SolidState Chemistry; Hannay, N. B., Ed.; Plenum: New York, 1976;Vol. 3, Chapter 7.
2. Nakamura, K.; Watanabe, T.; Katayama, K.; Amano, T. J ApplPolym Sci 1972, 16, 1077.
3. Nakamura, K.; Katayama, K.; Amano, T. J Appl Polym Sci 1973,17, 1031.
4. Schneider, W.; Koeppl, A.; Berger, J. Int Polym Process 1988, 2,151.
5. Avrami, M. J Chem Phys 1939, 7, 1103.6. Avrami, M. J Chem Phys 1940, 8, 212.7. Avrami, M. J Chem Phys 1941, 9, 177.8. Kolmogoroff, A. N. Izv Akad Nauk Ser Math 1937, 1, 355.9. Evans, U. R. Trans Faraday Soc 1945, 41, 365.
10. Schultz, J. M.; Petermann, J. Colloid Polym Sci 1984, 262, 294.11. Petermann, J.; Schultz, J. M. Colloid Polym Sci 1984, 262, 217.12. Tiller, W. A.; Schultz, J. M. J Polym Sci Polym Phys Ed 1984, 22,
143.13. Schultz, J. M. Polym Eng Sci 1991, 31, 661.14. Bushman, A. C.; McHugh, A. J. J Polym Sci Part B: Polym Phys
1997, 35, 1649.15. Dairanieh, I. S.; McHugh, A. J.; Doufas, A. K. Soc Plast Eng
Annu Tech Conf 1998, 56(1), 212.16. Doufas, A. K.; McHugh, A. J.; Miller, C. J Non-Newtonian Fluid
Mech 2000, 92, 27.17. Doufas, A. K.; McHugh, A. J.; Miller, C.; Immaneni, A. J Non-
Newtonian Fluid Mech 2000, 92, 81.18. McHugh, A. J.; Doufas, A. K. Compos A 2001, 32, 1059.19. Ziabicki, A. Colloid Polym Sci 1974, 252, 207.20. Ziabicki, A.; Jarecki, L. In High-Speed Fiber Spinning; Ziabicki,
A.; Kawai, H., Eds.; Wiley: New York, 1985; p 225.21. Ziabicki, A. J Non-Newtonian Fluid Mech 1988, 30, 141.22. Ziabicki, A.; Tian, J. J Non-Newtonian Fluid Mech 1993, 47, 57.23. Eder, G.; Janeschitz-Kriegl, H. Colloid Polym Sci 1988, 266, 1087.24. Eder, G.; Janeschitz-Kriegl, H.; Krobath, G. Prog Colloid Polym
Sci 1989, 80, 1.25. Eder, G.; Janeschitz-Kriegl, H.; Liedauer, S. Prog Polym Sci 1990,
15, 629.26. Eder, G.; Janeschitz-Kriegl, H.; Liedauer, S. Prog Colloid Polym
Sci 1992, 87, 129.27. Flory, P. J. J Chem Phys 1947, 15, 397.28. Gaylord, R. J. J Polym Sci Polym Phys Ed 1976, 14, 1827.
Figure 15 Measured (symbols)67 and predicted (lines) normalized skin-layer thickness as a function of x for PP-6523,PP-6723, and PP-6823. The molding conditions were Q � 12.7 cm3/s, T0 � 230°C, th � 45 s, and Tw � 60°C.
522 KIM, ISAYEV, AND KWON
29. Shimizu, J.; Okui, N.; Kikutani, T. In High-Speed Fiber Spinning;Ziabicki, A.; Kawai, H., Eds.; Wiley: New York, 1985; p 173.
30. Katayama, K.; Yoon, M. G. In High-Speed Fiber Spinning; Zi-abicki, A.; Kawai, H., Eds.; Wiley: New York, 1985; p 207.
31. Chen, S.; Yu, W.; Spruiell, J. E. J Appl Polym Sci 1987, 34, 1477.32. Yeh, G. S. Y. Polym Eng Sci 1976, 16, 145.33. Yeh, G. S. Y. Polym Eng Sci 1976, 16, 138.34. Yeh, G. S. Y.; Hong, K. Z. Polym Eng Sci 1979, 19, 395.35. Yeh, G. S. Y.; Hong, K. Z.; Krueger, D. L. Polym Eng Sci 1979, 19,
401.36. Keller, A.; Machin, M. J. J Macromol Sci Phys 1967, 1, 41.37. Treloar, L. R. G. The Physics of Rubber Elasticity, 2nd ed.;
Clarendon: Oxford, 1958; p 342.38. Mark, J. E. J Chem Educ 1981, 58, 898.39. Haas, T. W.; Maxwell, B. Polym Eng Sci 1969, 9, 225.40. Ishizuka, O.; Koyama, K. Polymer 1977, 18, 913.41. Isayev, A. I.; Chan, T. W.; Shimojo, K.; Gmerek, M. J Appl Polym
Sci 1995, 55, 807.42. Isayev, A. I.; Chan, T. W.; Gmerek, M.; Shimojo, K. J Appl Polym
Sci 1995, 55, 821.43. Demiray, M.; Isayev, A. I. Soc Plast Eng Annu Tech Conf 1996,
54(2), 1576.44. Chan, T. W.; Isayev, A. I. Polym Eng Sci 1994, 34, 461.45. Isayev, A. I.; Guo, X.; Guo, L.; Demiray, M. Soc Plast Eng Annu
Tech Conf 1997, 55(2), 1517.46. Isayev, A. I.; Catignani, B. F. Polym Eng Sci 1997, 37, 1526.47. Guo, X.; Isayev, A. I.; Guo, L. Polym Eng Sci 1999, 39, 2096.48. Guo, X.; Isayev, A. I.; Demiray, M. Polym Eng Sci 1999, 39, 2132.49. Guo, X.; Isayev, A. I. Int Polym Process 1999, 14, 377.50. Guo, X.; Isayev, A. I. Int Polym Process 1999, 14, 387.51. Palluch, K. P.; Isayev, A. I. Proceedings of the 13th International
Congress on Rheology, Cambridge, England, 2000; Vol. 2, p 94.
52. Kim, K. H.; Isayev, A. I.; Kwon, K. Soc Plast Eng Annu TechConf 2003, 61(1), 713.
53. Leonov, A. I. Rheol Acta 1976, 15, 85.54. Sobhanie, M.; Isayev, A. I. Rubber Chem Technol 1989, 62, 939.55. Ziabicki, A.; Jarecki, L.; Wasiak, A. Comput Theor Polym Sci
1998, 8, 143.56. Injection and Compression Molding Fundamentals; Isayev,
A. I., Ed.; Marcel Dekker: New York, 1987.57. Hoffman, J. D. Soc Plast Eng Trans 1964, 4, 315.58. George, H. H. In High-Speed Fiber Spinning; Ziabicki, A.;
Kawai, H., Eds.; Wiley: New York, 1985; p 271.59. Kobayashi, K.; Nagasawa, T. J Macromol Sci Phys 1970, 4,
331.60. Hay, I. L.; Jaffe, M.; Wissbrun, K. F. J Macromol Sci Phys 1976,
12, 423.61. Alfonso, G. C.; Grimaldi, D.; Turturro, A. Conv Ital Sci Macro-
mol 1977, 3, 144.62. Oono, R.; Miasaka, K.; Ishikawa, K. J Polym Sci Polym Phys Ed
1973, 11, 1477.63. Kraus, G.; Gruver, J. T. J Polym Sci Polym Phys Ed 1972, 10,
2009.64. Dunning, W. J. Trans Faraday Soc 1954, 50, 1115.65. Guo, J.; Narh, K. A. Adv Polym Technol 2002, 21, 214.66. Chan, T. V.; Shyu, G. D.; Isayev, A. I. Polym Eng Sci 1995, 35,
733.67. Guo, X. Ph.D. Thesis, University of Akron, 1999.68. Evens, G. A. Practical Numerical Analysis; Wiley: New York,
1995.69. Catignani, B. M.S. Thesis, University of Akron, 1996.70. Van Krevelen, D. W. Properties of Polymers; Elsevier: Amster-
dam, 1990.
FLOW-INDUCED CRYSTALLIZATION 523
Recommended