14th Int Symp on Applications of Laser Techniques to Fluid Mechanics Lisbon, Portugal, 7-10 July, 2008
- 1 -
Flow control on a high thickness airfoil
by a trapped vortex cavity.
Fabrizio De Gregorio1 , Giuseppe Fraioli
2
1: LMSA/IWTU laboratory, Centro Italiano Ricerche Aerospaziali (CIRA), Capua, Italy, [email protected]
2: Dept. Mechanics and Aeronautics, University of Rome “La Sapienza”, Rome, Italy, [email protected]
Abstract This paper summarises the experimental campaign performed at CIRA CT-1 wind tunnel aimed to investigate the potential benefit obtainable using a trapping vortex cell system on a high thickness airfoil with and without steady suction and/or injection mass flow.
The behaviour of a 2D model, equipped with a span wise oriented circular cavity, has been investigated. Pressure distribution on the model surface and inside the cavity and the complete flow field around the model and inside the cavity have been measured.
An extensive test campaign has been carried out in the CT-1, an open circuit wind tunnel, with test section size of 305x305x600 mm
3 and maximum speed of 55 m/s. Due to the limited dimensions of the WT, the
model has been mounted on the bottom wall of the wind tunnel in order to avoid blockage problems. The model represents a two dimensional high thickness airfoil with a chord length of 350mm. The model angle of attack ranges between 5.66° to 12.66° with a step of 1°.
The installation of the model on the wind tunnel bottom wall presented heavy flow instability under the front part of the model. The flow instability has been solved applying a flow suction in front the model trough a porous wall installed on the bottom WT wall. The cavity has been realized with transparent material in order to allow optical access and consequently PIV measurements. The model has been designed in order to permit flow suction and/or blowing inside the cavity.
The influence of different parameters has been investigated. Tests have been performed varying the wind tunnel speed (form 15 m/s, to 30 m/s), varying the suction mass flow (from 0 m
3/h to 25 m
3/h) varying the
blowing mass flow (from 0 m3/h to 50 m
3/h) applying suction and blowing at the same time, and varying the
model angle of attack (AoA).
In the paper the performed test campaign, the adopted experimental set-up, the data post-processing and the results’ description are reported.
1. Introduction
To ensure an high lift-to-drag ratio, wing of modern airplanes are thin and streamlined. However
the tendency to design commercial aircraft of ever-larger dimensions, or innovative configuration as
Blended-Wing-Body airplanes requests innovative solution in the field of wing structures. In order
to carry a larger load having thick wing would be beneficial. The drawback of this type of airfoils is
a low efficiency due to high value of the drag coefficient. These airfoils are affected by early flow
separation phenomenon even for small incidence angle.
Figure 1: Trapped vortex concept
Nowadays many research activities are aimed to investigate system dedicated to flow control. As a
scientific discipline and as a technological curiosity, flow control is perhaps more hotly pursued by
scientists and engineers than any other area in fluid mechanics (see Gad-el Hak 1996).
14th Int Symp on Applications of Laser Techniques to Fluid Mechanics Lisbon, Portugal, 7-10 July, 2008
- 2 -
Flow control involves passive or active devices to effect a beneficial change in wall bounded or
free-shear flows.
The ability to manipulate a flow field to effect a desired change is of immense practical importance.
An external wall-bounded flow, such as that developing on the exterior surface of an aircraft or a
submarine, can be manipulated to achieve transition delay, separation postponement, lift increase,
skin-friction and pressure drag reduction, turbulence augmentation, heat transfer enhancement, or
noise suppression. By preventing separation, lift is enhanced, stall is delayed, pressure recovery is
improved and form drag is reduced. The challenge in choosing a flow control scheme is of course to
achieve a beneficial goal at a minimum cost, without adversely affecting another goal. An ideal
method of control that is simple, is inexpensive to build and to operate, and does not have any
trade-off does not exist, and the skilled engineer has to make continuous compromises to achieve a
particular design objective.
There are different classification schemes for flow control methods. One is to consider whether the
technique is applied at the wall or away from it, we shall deal with the first one. Surface parameters
that can influence the flow include roughness, shape, curvature, rigid-wall motion, temperature, and
porosity. Heating and cooling of the surface can influence the flow via the resulting viscosity and
density gradients. Mass transfer can take place through a porous wall or a wall with slots. Suction
and injection of primary fluid can have significant effects on the flow field, influencing particularly
the shape of the velocity profile near the wall and thus the boundary layer susceptibility to transition
and separation. Momentum transfer by synthetic jet actuators or plasma actuators operates as well
on the flow field energising the boundary layer.
A second scheme for classifying flow control methods considers energy expenditure and the control
loop involved. A control device can be passive, requiring no auxiliary power, or active, requiring
energy expenditure. Active control is further divided into predetermined or reactive. Predetermined
control includes the application of steady or unsteady energy input without regard to the particular
state of the flow. The control loop in this case is open, and no sensors are required. Reactive control
is a special class of active control where the control input is continuously adjusted based on
measurements of some kind. The control loop in this case can either be an open, feedforward one or
a closed, feedback loop. Classical control theory deals, for the most part, with reactive control.
Future possibilities for aeronautical applications of flow separation control include providing
structurally efficient alternatives to flaps or slats; cruise application on conventional takeoff and
landing aircraft including boundary-layer control (BLC) on thick spanloader wings; as well as
cruise application on high-speed civil transports for favorable interference wave-drag reduction,
increased leadingedge thrust, and enhanced fuselage and upper surface lift. In fact, much of the
remaining gains to be made in aerodynamics appear to involve various types of flow control,
including separated flow control. Typical, in some cases serious, problems associated with flow
separation control include parasitic device drag or energy consumption; system weight, volume,
complexity, reliability or cost; performance sensitivity to body attitude or orientation.
At the end of 2005, VortexCell2050, an European research project, has been launched with the
scope of investigate the possibility to control the flow separation using trapped vortex cavities and
active control.
Basic concept of the trapped vortex cavities (TVC) is shown in figure 1. The flow otherwise
separated is forced to remain attached by an intense vortex anchored in the cavity. One of the
critical point is to maintain the vortex stable in the cavity, and with a sufficient strength to forcing
the flow reattachment. The idea of trapping a vortex is old, and it is not easy to find out who first
suggested it (Ringleb F.O. 1961). A trapped vortex could be just a steady separation eddy above an
aerofoil at high angle of attack, but the use of a vortex cell helps. Practical implementation of the
trapped-vortex idea is tricky, since the trapped vortex needs to be almost steady in the sense that it
should remain in the close vicinity of the body. The first successful use of a trapped vortex in a
flight experiment was claimed by W.A.Kasper in the seventies with is well know wing. Figure 2
14th Int Symp on Applications of Laser Techniques to Fluid Mechanics Lisbon, Portugal, 7-10 July, 2008
- 3 -
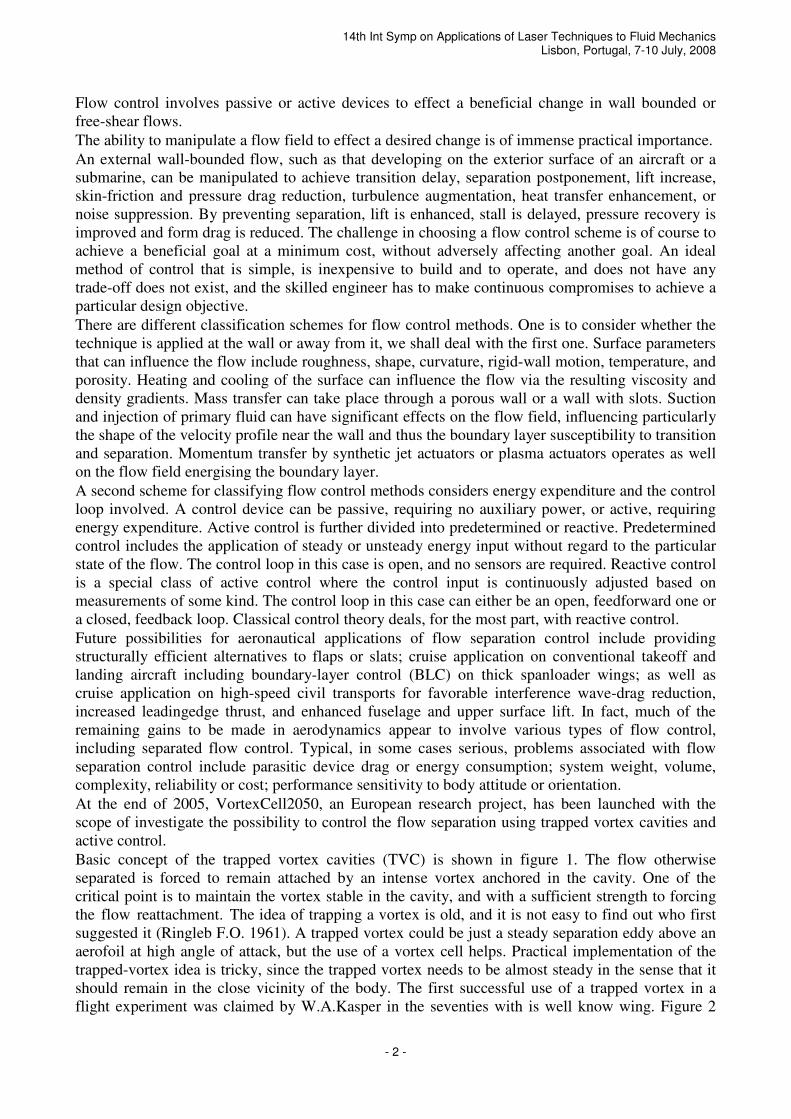
shows the ideal concept of the Kaspar wing. Experimental tests aimed to verify the Kaspar wing
behaviour (Kruppa in 1977) showed the presence of vortex shedding instead of steady vortex and
any lift enouncement was observed. The same Kruppa reported in his paper some promising results
obtained by researchers of Saab-Scania (1974) on a wing presenting a vortex cavity and blowing
applying flow injection in the cavity (figure 3).
Figure 2: Kasper wing concept Figure 3: Saab vortex airfoil
The potential advantage to use TVC is that the presence of the cavity on the wing surface naturally
induces the vortex formation inducing flow reattachment requiring no auxiliary power. But the
analysis of the few available data shows that stable flows with trapped vortex are rare, for this
reason an active flow control is necessary, but the energy expenditure should be limited.
For gaining a better understanding of the impact of TVC on an airfoil and overcome the lack of
experimental data an extensive test campaign has been performed. In order to maintain low the cost
of the basic investigations, the measurements have been performed in the small CT-1 wind tunnel
(WT). Furthermore, the necessity to mount the trapped cavities and to simulate a Reynolds’ number
up to one million requested to built a model with a chord length of at least 350mm. For fulfil the
above mentioned requeriments and install the model in the CT-1 avoiding blockage problems, the
model has been mounted on the bottom wall of the wind tunnel. A first measurement campaign has
been carried out for characterising the flow and pressure distribution behaviour of a clean high thick
airfoil. The tests were mainly focused to characterise the flow separation behaviour for different test
conditions (De Gregorio F. and others. 2007). Once the aerodynamic characteristics of the clean
airfoil have been detected, the behaviour of the airfoil housing a trapped vortex cavity has been
investigated. A second test campaign has been aimed to investigate the influence on the airfoil
aerodynamic of passive/active TVC flow control, i.e. without/with steady suction and/or injection
inside the cavity. The tests have foreseen pressure and flow field measurements on the model
surface and inside the cavity. This second test activity is the object of this work. As future activity,
the project foresees to test the TVC system on a two dimensional model in a large wind tunnel in
order to evaluate the benefit in terms of efficiency.
2. Experimental apparatus
The experimental apparatus, including the test facility, test models and instrumentation are
described in the following.
2.1 Test facility
The tests have been carried out in the CT-1 (fig.4), an open circuit wind tunnel, with test section
size of 305x305x600 mm3, maximum speed of 55 m/s, nozzle contraction rate of 16:1 and
maximum value of turbulence level at 50 m/s flow speed of 0.1%.
The wind tunnel bottom has been modified in order to accommodate the model. Furthermore the

14th Int Symp on Applications of Laser Techniques to Fluid Mechanics Lisbon, Portugal, 7-10 July, 2008
- 4 -
peculiar configuration showed intense flow instability due to the formation of a strong re-circulating
zone located under the leading edge of the model. In order to reduce the flow unsteadiness, flow
suction is applied in front the test article, in concomitance of the circulation region, in order to
confine/eliminate the circulation zone and neglect vortex shedding along the model. Figure 5
provides a detailed view of test section with the model mounted on the bottom wall and the adopted
reference system. Two porous plates, with a solidity ratio of 9.8% are mounted on the bottom wall
in front the model, spaced by a small set of transparent material in order to allow the illumination of
the model lower region for detecting the stagnation point by PIV technique. The porous plates are
connected via a transparent collector to a centrifugal pump. In order to evaluate the suction mass
flow trough the porous wall, the static pressure step between the test section and the collector has
been measured. For this purpose 4 pressure ports are located on the porous walls and 6 pressure taps
are mounted on the side walls of the collector.
Figure 4: CT-1 wind tunnel Figure 5: Test bed mounted on the WT bottom wall
2.2 Test article
The model represents a two dimensional airfoil, it is characterized by a chord length of 350mm and
a spanwise length of 305mm. The model angle of attack (AoA) ranges between 5.66° to 12.66° with
a step of 1°. The cavity shape has been designed starting from the data of the pressure surface
distribution measured on the clean airfoil and by a numerical potential code as described by
Cherniyshenko and other 2007.
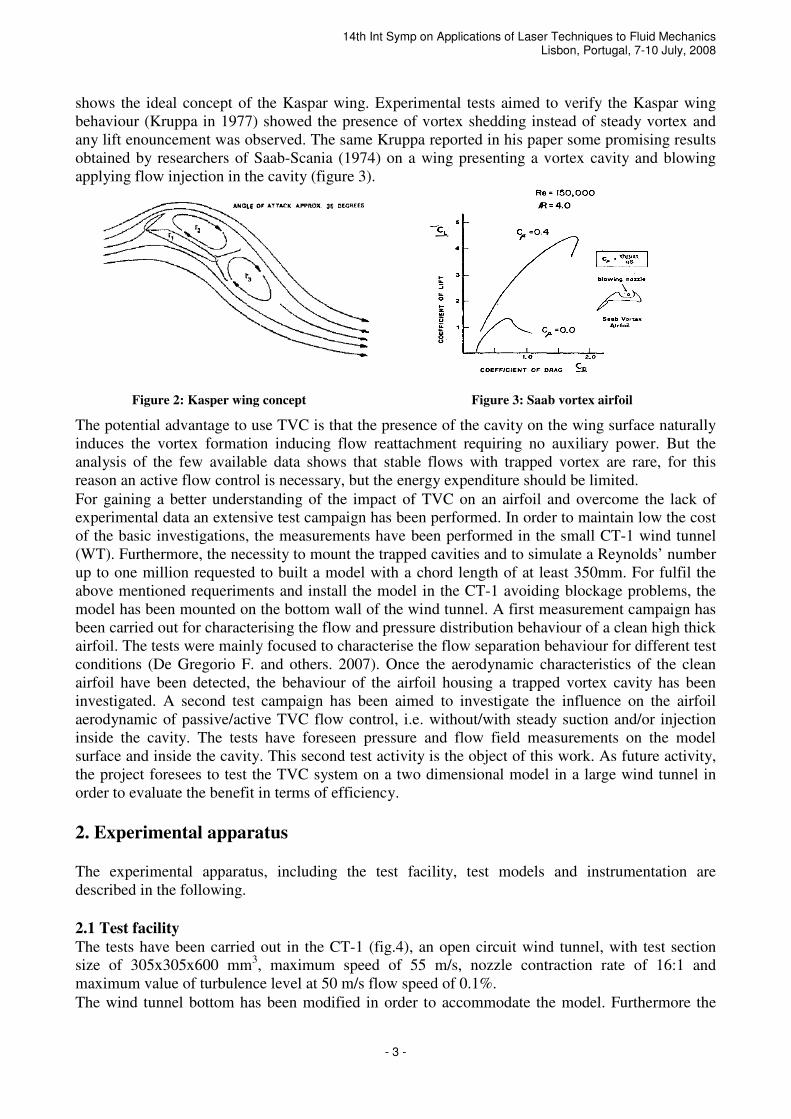
The TVC has been designed and built in order to apply inside the cavity flow suction and blowing.
The internal zone of the cavity oriented toward the leading edge presents 906 passing holes with a
diameter of 1mm. These holes are connected to three different collectors in order to apply different
suction mass flow values. Each collector is singularly connected by dedicated circuit to a vacuum
pump. Each circuit is equipped with a partial valve in order to vary the mass flow rate and with a
flow meter for measuring and storing the data. Hereinafter the suction regions shall be named as
CAV1, CAV2 and CAV3. The backward zone of the cavity presents 126 passing holes of 1 mm
diameter connected to a collector as well. From here the mass flow is injected. The holes have been
designed as much as possible tangential to the cavity surface. The blowing collector is supplied by
pressurised compress air via an independent circuit equipped by partial valve and flow meter
devise. The blowing region in the following shall be indicated as CAV4. The geometry of the
trapped cavity and the location of the suction and injection porous region are described in fig. 6.
The model is equipped with 37 pressure taps (PTS), 33PTS longitudinal spaced and 4 PTS spanwise
located inside the TVC. Figure 7 shows the model geometry at 7.66° of AoA with the longitudinal
PTS locations. The cavity has been instrumented by 15 PTS in order to monitor the behaviour of the
vortex flow.
The vortex cavity has been realized by transparent material in order to allow the illumination of the
flow region inside the cavity and perform PIV measurement.
Z
X
Y
14th Int Symp on Applications of Laser Techniques to Fluid Mechanics Lisbon, Portugal, 7-10 July, 2008
- 5 -
Pressure Taps Location
0
50
100
150
200
250
50 100 150 200 250 300 350 400 450
X [mm]
Z [
mm
]
PTS
Model geometry AoA:7.66°
Figure 6: TVC drawing Figure 7: Model geometry with PTS location
2.3 Measurement instrumentations
The values of the pressure taps located on the model test-bed and the static pressure in the test
section upstream the model have been acquired by means of the Hyscan 2000 system. Pressure taps
were connected to a Scanivalve ZOC 22B electronic pressure scanner, characterised by: full scale
ranges of ±1 psid, an accuracy value of ± 0.15% F.S., Scan Rate value of 20 kHz and Temp.
Sensitivity of 0.05 %F.S./°C.
The flow field measurements have been carried out by means of Particle Image Velocimetry
technique. The recording region is illuminated by two Nd-Yag resonator heads providing a laser
beam energy of about 300mJ each at a wave length of 532 nm.
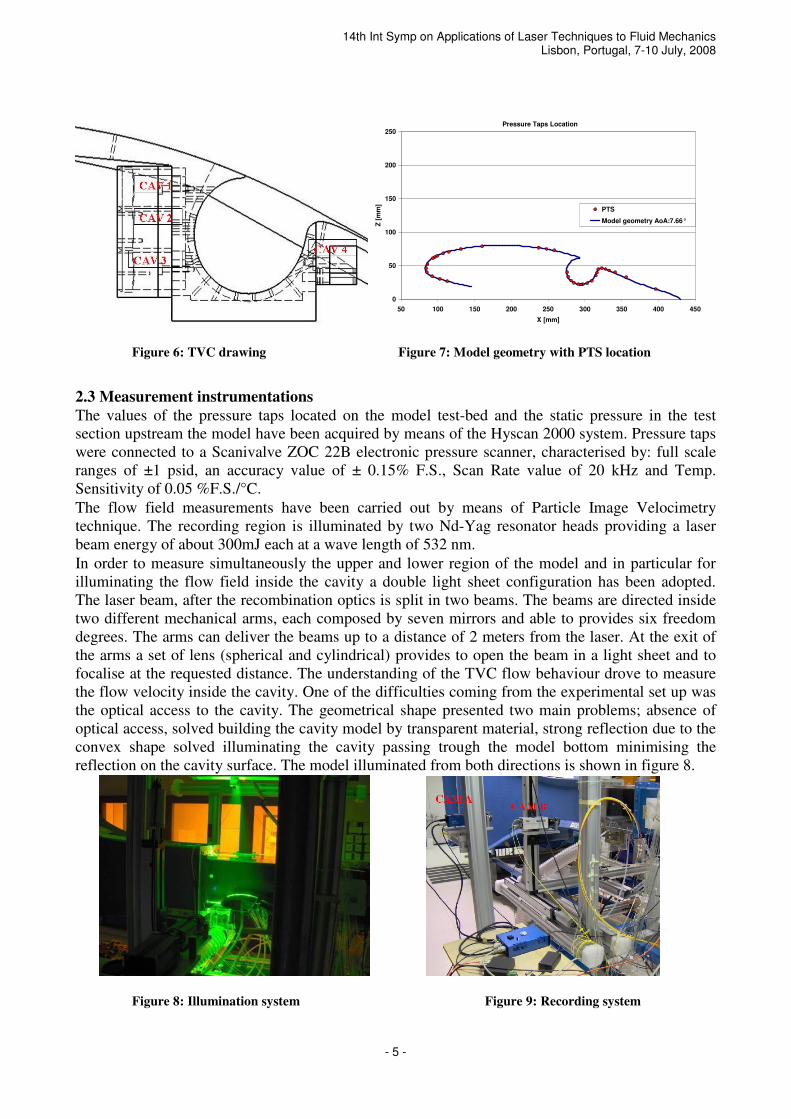
In order to measure simultaneously the upper and lower region of the model and in particular for
illuminating the flow field inside the cavity a double light sheet configuration has been adopted.
The laser beam, after the recombination optics is split in two beams. The beams are directed inside
two different mechanical arms, each composed by seven mirrors and able to provides six freedom
degrees. The arms can deliver the beams up to a distance of 2 meters from the laser. At the exit of
the arms a set of lens (spherical and cylindrical) provides to open the beam in a light sheet and to
focalise at the requested distance. The understanding of the TVC flow behaviour drove to measure
the flow velocity inside the cavity. One of the difficulties coming from the experimental set up was
the optical access to the cavity. The geometrical shape presented two main problems; absence of
optical access, solved building the cavity model by transparent material, strong reflection due to the
convex shape solved illuminating the cavity passing trough the model bottom minimising the
reflection on the cavity surface. The model illuminated from both directions is shown in figure 8.
Figure 8: Illumination system Figure 9: Recording system

14th Int Symp on Applications of Laser Techniques to Fluid Mechanics Lisbon, Portugal, 7-10 July, 2008
- 6 -
The recording system has been improved. CCD cameras with higher pixel resolution have been
used (2048x2048 px). Two cameras have been used and mostly simultaneously. One camera
mounted a 100 mm lens providing a measurement area of about 65x65 mm2 and higher spatial
resolution (0.5 mm/vector). This camera has been used for measuring the vortex in the cavity and
the flow field close to the model surface. In order to allow a fine positioning, the camera has been
mounted on a 2D linear traversing system remotely controlled. This camera is indicated as CAM B.
The second camera has been mounted on an optical bench at larger distance from the model. The
camera mounted a 60mm focal lens and acquired a wider region of the order of 270 x 270 mm2
characterised by a spatial resolution of 2.1 mm/vector. The second camera was aimed to measure
the external flow above the full model. Hereinafter this camera is named CAM A. Figure 9 shows
the recording set up. The image focusing was adjusted by means of a remote control system.
3. Experimental test
The measurements have been aimed to investigate the influence of the suction and blowing on the
behaviour of the vortex inside the cavity and the influence on the external flow, i.e. if the trapped
vortex was able to delay or even avoid the flow separation. The influence of different parameter has
been investigated. Test have been performed varying the wind tunnel speed (15 m/s, 20 m/s, 25 m/s,
26.5 m/s, 28 m/s and 30 m/s), varying the mass flow suction (from 3 m3/h to 25 m
3/h) varying the
blowing mass flow (from 3 m3/h to 50 m
3/h) applying suction and blowing at the same time, and
varying the model angle of attach. Scope of the tests was also to individuate the minimum value of
the blowing coefficient (Cµ) able to stabilize/trap the vortex in the cavity and induce the flow
reattachment. Preliminary flow visualization tests using micro-taft demonstrated that for a wind
speed of 15 m/s the flow is steady applying a flow suction in front the model of 0.096 kg/s
corresponding to a pump speed value of 740 rpm, whereas at 30 m/s the flow is stabilised imposing
0.145 Kg/s suction mass (1100 rpm). Imposing the above mentioned mass flow values, the vortex
shedding from the lower part of the model leading edge area was eliminated. Once stabilised the
basic flow, the bi-dimentionality of the experiment has been verified performing PIV measurement
on parallel horizontal planes. The position of the horizontal planes is shown in figure 10.
0
50
100
150
200
250
300
0 50 100 150 200 250 300 350 400 450 500
X (mm)
Z (
mm
)
Model at AoA:7.66°
0
50
100
150
200
250
300
0 50 100 150 200 250 300 350 400 450 500
X (mm)
Z (
mm
)
Model at AoA:7.66°
Figure 10: Horizontal Illumination system Figure 11: Recording system
PIV measurements have been performed on the vertical plane of symmetry of the test section long
the main flow direction. Different regions have been recorded with different magnification factors.
Figure 11 shows the zone acquired by both cameras. Global overview of the flow field has been
detected by CAM A recording three different regions. Details of the flow has been detected by the
CAM B, and in particular the lower front region where the stagnation point is located, the region
inside the cavity for measuring the trapped vortex and the region immediately downstream the
cavity for verify if flow reattachment occured. For each test condition together with the PIV images
the model pressure data, the wind tunnel data (in term of wind speed, total temperature (T0), total
14th Int Symp on Applications of Laser Techniques to Fluid Mechanics Lisbon, Portugal, 7-10 July, 2008
- 7 -
pressure (P0), and dynamic pressure), the static pressure drop on the porous wall and the mass flow
values applied inside the cavity have been recorded.
4. Data processing
In this section the data processing is described. Together with image pre-processing and image
analysis, the procedures adopted in order to: evaluate the steadiness of the flow separation, to
detecte the flow separation and stagnation point locations, the position of the centre of the vortex,
the extrapolation of the tangential and radial velocity components and the interaction with the
external shear layer are described.
4.1 PIV images pre-process and analysis
For each test condition al least 150 couples of PIV images have been acquired. The images have
been filtered by subtracting the minimum image calculated on the complete set of image samples
for test case. This pre-process function allows reducing the background noise of the PIV images and
increasing the signal to noise ratio. Moreover all the recordings acquired on the model have been
masked for increasing the results reliability close to the model surface. The images have been
analysed by means of PivView 2C v2.46 software. The selected analysis algorithm was Multigrid
interrogation for all the PIV images. The algorithm uses a pyramid approach by starting off with
larger interrogation windows (128 x 128 px) on a coarse grid and refining the windows (down to 32
x 32 px) and grid (16 x 16 px) with each pass. For each test condition all the single velocity fields
have been evaluated. From the instantaneous velocity fields the ensemble average velocity field, the
root mean square (rms) and the relative turbulence level (RTL), have been calculated. Furthermore
out of plane component of the vorticity, shear stress and normal stress have been evaluated.
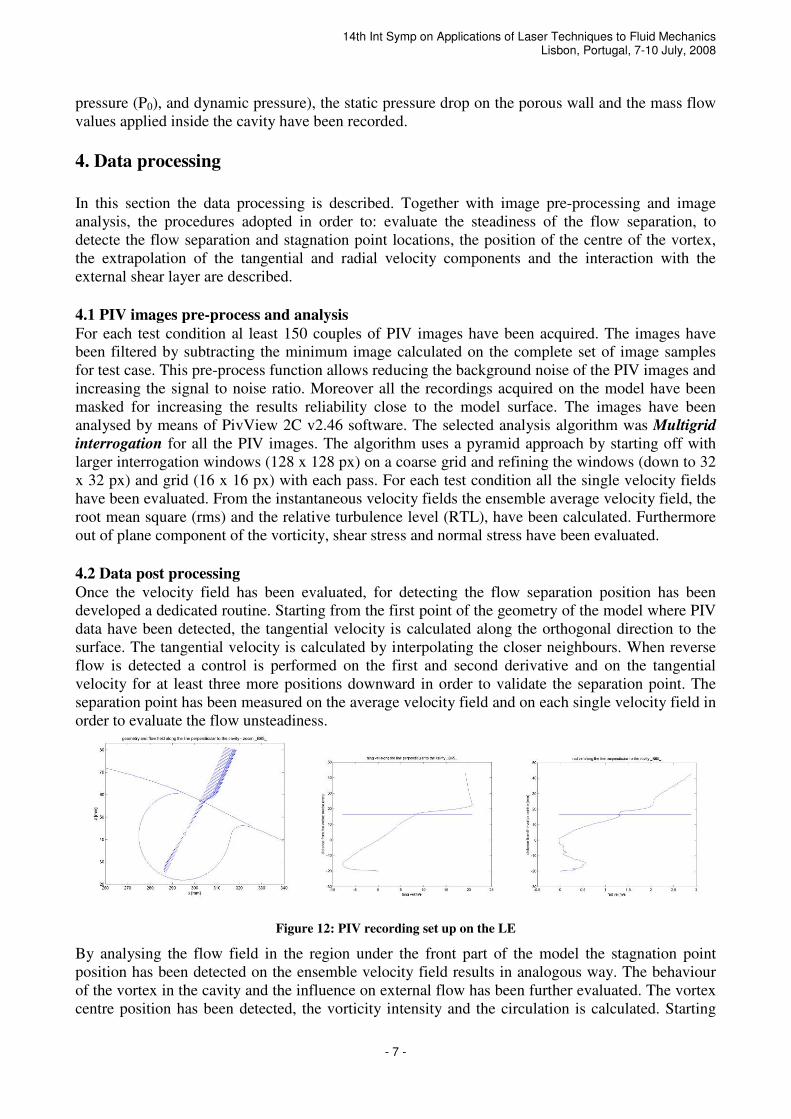
4.2 Data post processing
Once the velocity field has been evaluated, for detecting the flow separation position has been
developed a dedicated routine. Starting from the first point of the geometry of the model where PIV
data have been detected, the tangential velocity is calculated along the orthogonal direction to the
surface. The tangential velocity is calculated by interpolating the closer neighbours. When reverse
flow is detected a control is performed on the first and second derivative and on the tangential
velocity for at least three more positions downward in order to validate the separation point. The
separation point has been measured on the average velocity field and on each single velocity field in
order to evaluate the flow unsteadiness.
Figure 12: PIV recording set up on the LE
By analysing the flow field in the region under the front part of the model the stagnation point
position has been detected on the ensemble velocity field results in analogous way. The behaviour
of the vortex in the cavity and the influence on external flow has been further evaluated. The vortex
centre position has been detected, the vorticity intensity and the circulation is calculated. Starting
14th Int Symp on Applications of Laser Techniques to Fluid Mechanics Lisbon, Portugal, 7-10 July, 2008
- 8 -
from the vortex centre, the tangential and radial velocity is calculated along the line passing trough
the vortex centre and orthogonal to the ideal polynomial curve that connect the tip of cavity with the
downstream surface (figure 12). The velocity behaviour provides clear information of the
interaction between the external flow and the internal vortex.
The values of the pressure distribution are presented in terms of pressure coefficient Cp defined as:
q
ppCP
∞−
= where 2
2
1∞
= Vq ρ is the dynamic pressure obtained by the WT data acquisition
system, p is the pressure on the model and ∞
p is the static pressure to the test section entrance.
The influence of the suction and blowing mass flow in the cavity is defined by dimensionless
magnitude, the blowing coefficient (Cµ), defined as: qS
Vm
qS
TC
&==
µ, where T is the thrust, S is the
model surface, m& is the mass flow suction/blowing in the cavity measured by the flow meters and
V is the flow speed trough the cavity porous regions (CAV1,2,3 and 4).
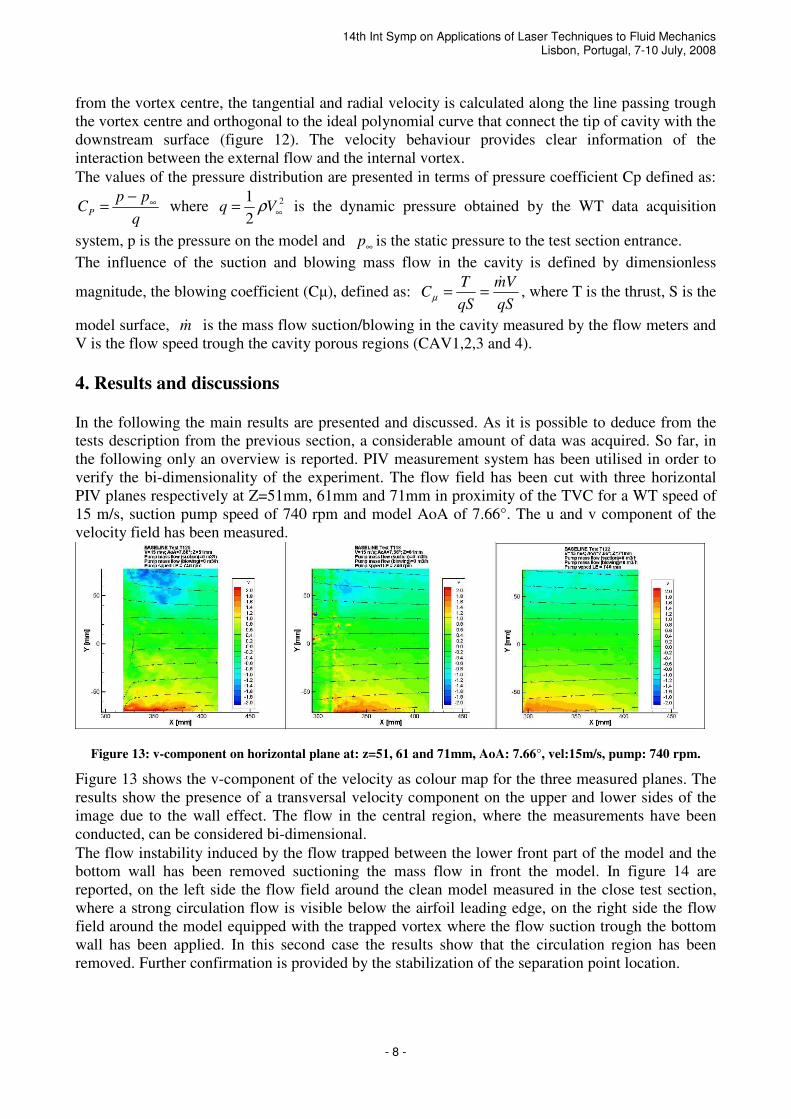
4. Results and discussions
In the following the main results are presented and discussed. As it is possible to deduce from the
tests description from the previous section, a considerable amount of data was acquired. So far, in
the following only an overview is reported. PIV measurement system has been utilised in order to
verify the bi-dimensionality of the experiment. The flow field has been cut with three horizontal
PIV planes respectively at Z=51mm, 61mm and 71mm in proximity of the TVC for a WT speed of
15 m/s, suction pump speed of 740 rpm and model AoA of 7.66°. The u and v component of the
velocity field has been measured.
Figure 13: v-component on horizontal plane at: z=51, 61 and 71mm, AoA: 7.66°, vel:15m/s, pump: 740 rpm.
Figure 13 shows the v-component of the velocity as colour map for the three measured planes. The
results show the presence of a transversal velocity component on the upper and lower sides of the
image due to the wall effect. The flow in the central region, where the measurements have been
conducted, can be considered bi-dimensional.
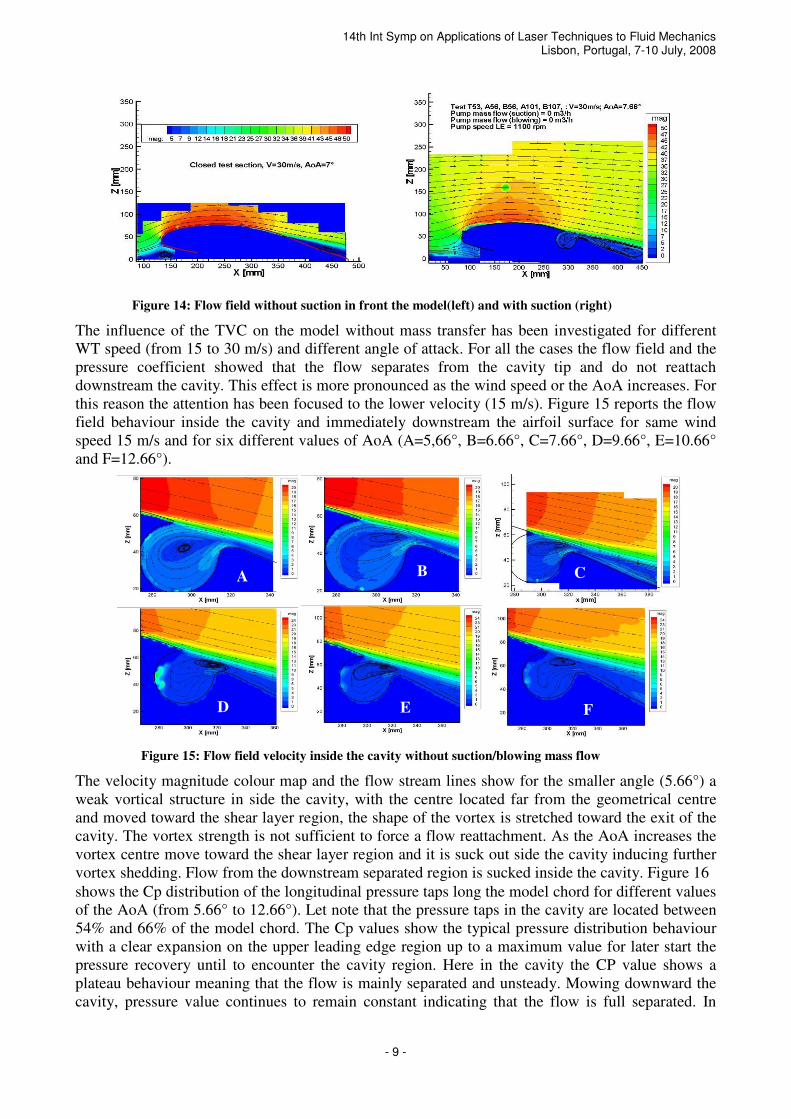
The flow instability induced by the flow trapped between the lower front part of the model and the
bottom wall has been removed suctioning the mass flow in front the model. In figure 14 are
reported, on the left side the flow field around the clean model measured in the close test section,
where a strong circulation flow is visible below the airfoil leading edge, on the right side the flow
field around the model equipped with the trapped vortex where the flow suction trough the bottom
wall has been applied. In this second case the results show that the circulation region has been
removed. Further confirmation is provided by the stabilization of the separation point location.
14th Int Symp on Applications of Laser Techniques to Fluid Mechanics Lisbon, Portugal, 7-10 July, 2008
- 9 -
Figure 14: Flow field without suction in front the model(left) and with suction (right)
The influence of the TVC on the model without mass transfer has been investigated for different
WT speed (from 15 to 30 m/s) and different angle of attack. For all the cases the flow field and the
pressure coefficient showed that the flow separates from the cavity tip and do not reattach
downstream the cavity. This effect is more pronounced as the wind speed or the AoA increases. For
this reason the attention has been focused to the lower velocity (15 m/s). Figure 15 reports the flow
field behaviour inside the cavity and immediately downstream the airfoil surface for same wind
speed 15 m/s and for six different values of AoA (A=5,66°, B=6.66°, C=7.66°, D=9.66°, E=10.66°
and F=12.66°).
Figure 15: Flow field velocity inside the cavity without suction/blowing mass flow
The velocity magnitude colour map and the flow stream lines show for the smaller angle (5.66°) a
weak vortical structure in side the cavity, with the centre located far from the geometrical centre
and moved toward the shear layer region, the shape of the vortex is stretched toward the exit of the
cavity. The vortex strength is not sufficient to force a flow reattachment. As the AoA increases the
vortex centre move toward the shear layer region and it is suck out side the cavity inducing further
vortex shedding. Flow from the downstream separated region is sucked inside the cavity. Figure 16
shows the Cp distribution of the longitudinal pressure taps long the model chord for different values
of the AoA (from 5.66° to 12.66°). Let note that the pressure taps in the cavity are located between
54% and 66% of the model chord. The Cp values show the typical pressure distribution behaviour
with a clear expansion on the upper leading edge region up to a maximum value for later start the
pressure recovery until to encounter the cavity region. Here in the cavity the CP value shows a
plateau behaviour meaning that the flow is mainly separated and unsteady. Mowing downward the
cavity, pressure value continues to remain constant indicating that the flow is full separated. In
B A
D
E
C
F

14th Int Symp on Applications of Laser Techniques to Fluid Mechanics Lisbon, Portugal, 7-10 July, 2008
- 10 -
figure 17 the values of the tangential velocity in the cavity varying the angle of attack are reported.
As already noted, the intensity of the velocity is really weak, only for the angle 5.66° and 6.66° is
possible to individuate the typical behaviour of a vortical structure.
15 m/s - 740 rpm - Baselines-5
-4
-3
-2
-1
0
1
2
0 10 20 30 40 50 60 70 80 90 100X/C [%]
Cp
5,66° - (T_251)6,66° - (T_213)7,66° - (T_174)8,66° - (T_190)9,66° - (T_219)10,66° - (T_220)11,66° - (T_221)12,66° - (T_222)
TANG VEL - AoA influence; V=15m/s ; Baseline
-30
-20
-10
0
10
20
30
40
50
-10 -5 0 5 10 15 20 25
tang. vel. [m/s]
dis
tan
ce f
rom
th
e o
rig
in [
mm
]
B70 - AoA=5.66° B69 - AoA=6.66° T11 - AoA=7.66° T27 - AoA=8.66° T38 - AoA=9.66°T39 - AoA=10.66°T40 - AoA=11.66°T41 - AoA=12.66°line intersection with interpolied surface
Figure 16: Cp distribution varying the AoA for V=15m/s Figure 17: Tangential velocity inside the cavity
Active flow control has been applied imposing flow suction inside the cavity in order to stabilise
the vortex. Different values of mass flow have been applied. Figure 18 shows the velocity field
inside the cavity for the following values of mass flow and blowing coefficient (Cµ) (Image A
m& =4.5 m3/h and Cµ=0.000189, image B m& =9 m3/h and Cµ=0.000756, image C m& =15 m3/h and
Cµ=0.0021 and image D m& =25.4 m3/h and Cµ=0.0059). The case A, characterised by the lowest
value of Cµ, shows a small improvement respect the baseline, the applied suction is not enough to
impose flow reattachment. Increasing the suction to a value of 9 m3/h, the flow is forced to reattach
for a while for separating again to the 75% of the chord. In this case the trapped vortex is stable
inside the cavity and the vortex centre is located almost in the geometrical centre of the cavity.
Further increasing the value of Cµ, case C and D, the vortex strength increases and induce a full
reattachment of the flow to the end of the airfoil.
Figure 18: Velocity magnitude varying flow suction. Figure 19: Vortiticy varying flow suction.
This effect is clearly visible by the increment of the velocity magnitude in the cavity and by the
reattachment of the stream lines. In order to provide a better understanding of the vortex strength in
figure 19 the correspondent vorticity values are also reported.
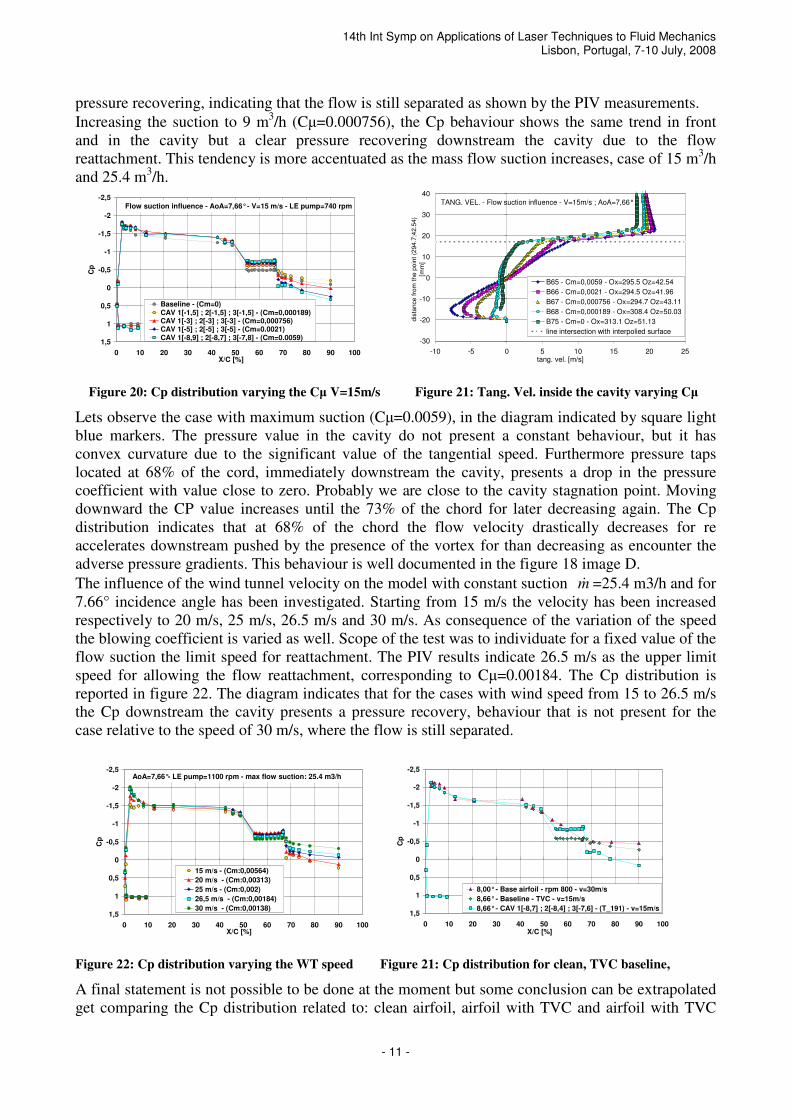
In figure 20, the Cp behaviours for the baseline condition, i.e. without any mass transfer, and the
cases with different flow suction values are reported. Respect the baseline diagram the Cp
distribution for the case of 4.5 m3/h (Cµ=0.000189) presents an increment of Cp immediately ahead
the cavity, indicating a flow velocity increment induced by the presence of the vortex. The Cp
values in the cavity are still flat but shifted toward higher values in absolute terms, meaning that the
flow velocity in the cavity is higher. The values of Cp downstream the cavity do not show a
D C
A B A B
C D
14th Int Symp on Applications of Laser Techniques to Fluid Mechanics Lisbon, Portugal, 7-10 July, 2008
- 11 -
pressure recovering, indicating that the flow is still separated as shown by the PIV measurements.
Increasing the suction to 9 m3/h (Cµ=0.000756), the Cp behaviour shows the same trend in front
and in the cavity but a clear pressure recovering downstream the cavity due to the flow
reattachment. This tendency is more accentuated as the mass flow suction increases, case of 15 m3/h
and 25.4 m3/h.
Flow suction influence - AoA=7,66° - V=15 m/s - LE pump=740 rpm-2,5
-2
-1,5
-1
-0,5
0
0,5
1
1,5
0 10 20 30 40 50 60 70 80 90 100X/C [%]
Cp
Baseline - (Cm=0)CAV 1[-1,5] ; 2[-1,5] ; 3[-1,5] - (Cm=0,000189)CAV 1[-3] ; 2[-3] ; 3[-3] - (Cm=0,000756)CAV 1[-5] ; 2[-5] ; 3[-5] - (Cm=0.0021)CAV 1[-8,9] ; 2[-8,7] ; 3[-7,8] - (Cm=0.0059)
TANG. VEL. - Flow suction influence - V=15m/s ; AoA=7,66° ;
-30
-20
-10
0
10
20
30
40
-10 -5 0 5 10 15 20 25tang. vel. [m/s]
dis
tance f
rom
the p
oin
t (2
94.7
;42.5
4)
[mm
]
B65 - Cm=0,0059 - Ox=295.5 Oz=42.54
B66 - Cm=0,0021 - Ox=294.5 Oz=41.96
B67 - Cm=0,000756 - Ox=294.7 Oz=43.11
B68 - Cm=0,000189 - Ox=308.4 Oz=50.03
B75 - Cm=0 - Ox=313.1 Oz=51.13
line intersection with interpolied surface
Figure 20: Cp distribution varying the Cµ V=15m/s Figure 21: Tang. Vel. inside the cavity varying Cµ
Lets observe the case with maximum suction (Cµ=0.0059), in the diagram indicated by square light
blue markers. The pressure value in the cavity do not present a constant behaviour, but it has
convex curvature due to the significant value of the tangential speed. Furthermore pressure taps
located at 68% of the cord, immediately downstream the cavity, presents a drop in the pressure
coefficient with value close to zero. Probably we are close to the cavity stagnation point. Moving
downward the CP value increases until the 73% of the chord for later decreasing again. The Cp
distribution indicates that at 68% of the chord the flow velocity drastically decreases for re
accelerates downstream pushed by the presence of the vortex for than decreasing as encounter the
adverse pressure gradients. This behaviour is well documented in the figure 18 image D.
The influence of the wind tunnel velocity on the model with constant suction m& =25.4 m3/h and for
7.66° incidence angle has been investigated. Starting from 15 m/s the velocity has been increased
respectively to 20 m/s, 25 m/s, 26.5 m/s and 30 m/s. As consequence of the variation of the speed
the blowing coefficient is varied as well. Scope of the test was to individuate for a fixed value of the
flow suction the limit speed for reattachment. The PIV results indicate 26.5 m/s as the upper limit
speed for allowing the flow reattachment, corresponding to Cµ=0.00184. The Cp distribution is
reported in figure 22. The diagram indicates that for the cases with wind speed from 15 to 26.5 m/s
the Cp downstream the cavity presents a pressure recovery, behaviour that is not present for the
case relative to the speed of 30 m/s, where the flow is still separated.
AoA=7,66°- LE pump=1100 rpm - max flow suction: 25.4 m3/h -2,5
-2
-1,5
-1
-0,5
0
0,5
1
1,5
0 10 20 30 40 50 60 70 80 90 100X/C [%]
Cp
15 m/s - (Cm:0,00564)
20 m/s - (Cm:0,00313)
25 m/s - (Cm:0,002)
26,5 m/s - (Cm:0,00184)
30 m/s - (Cm:0,00138)
-2,5
-2
-1,5
-1
-0,5
0
0,5
1
1,5
0 10 20 30 40 50 60 70 80 90 100X/C [%]
Cp
8,00° - Base airfoil - rpm 800 - v=30m/s
8,66° - Baseline - TVC - v=15m/s
8,66° - CAV 1[-8,7] ; 2[-8,4] ; 3[-7,6] - (T_191) - v=15m/s
Figure 22: Cp distribution varying the WT speed Figure 21: Cp distribution for clean, TVC baseline,
A final statement is not possible to be done at the moment but some conclusion can be extrapolated
get comparing the Cp distribution related to: clean airfoil, airfoil with TVC and airfoil with TVC
14th Int Symp on Applications of Laser Techniques to Fluid Mechanics Lisbon, Portugal, 7-10 July, 2008
- 12 -
and Cµ=0.0059. The comparison is shown in figure 21. The three different cases show almost the
same maximum Cp value. The clean airfoil presents a flow separation at 70% of the chord. The
TVC passive flow control is characterised by a flow separation from the cavity tip (54% of the
chord) and globalilly the behaviour is worst of the clean configuration. The TVC active flow
control for Cµ=0.0059 presents a flow fully attached with a noticeable decrement on the pressure
drag.
5. Conclusions and future activities
An extensive test campaign has been successfully performed in order to investigate the potentiality
of trapped vortex cavity flow control. The TVC has been investigated as passive and active method,
i.e. without and with mass transport. The full pressure and flow characterization has been detected
for the base clean airfoil and for the model modified for carrying the flow control device. A
complex experimental set up has been realised composed by different elements: the suction system
for removing the unsteady circulation region in front the model, the suction/injection systems for
active flow control in the cavity, the measurement system for recording all the boundary condition.
From the showed results the following conclusions can be draw. Passive TVC flow control is not
able to control the flow separation. The vortex is not confined in the cavity and vortex shedding is
present decreasing the aerodynamic characteristics of the original airfoil. Active TVC flow control
is able to control the flow separation, for limited values of the blowing coefficient full reattachment
has been obtained. These first experiments provided really encouraging result. The campaign shall
provide unique experimental data to the numerical colleague for code validation. As future activities
the project foresees that CIRA shall test the TVC concept in a large wind tunnel on a real 2D model
wing in order to evaluate the benefit in terms of aerodynamic coefficients.
Acknowledgements This work has been partially funded by European Commission in the frame work of the
VortexCell2050 research project (contract number AST4-CT-2005-012139). The authors wish to
acknowledge the valuable contributions enabling the success of this investigation by Prof. S.
Chernyshenko for the efforts in the VCELL co-ordination, and dr. R. Donelli in co-ordinating the
internal CIRA activities.
References Gad-el-Hak, M. (1996) Modern development in flow control. Applied Mechanics Reviews, vol. 49,
pp. 365–379.
Ringleb F.O. (1961). Separation control by trapped vortices. In: Boundary Layer and Flow Control,
Ed. Lachmann G.V., Pergamon Press.)
Kasper W.A. Some Ideas of Vortex Lift. Society of Automotive Engineers, Inc., Warrendale, PA,
Paper 750547, no date, pp 12
Kruppa E.W. (1977) A Wind Tunnel Investigation of the Kasper Vortex Concept. AIAA, Paper 77-
310, pp. 10
De Gregorio F., Albano F., Lupo M., (2007) Flow separation investigation by PIV technique, proc.
of 7th
International Symposium on Particle Image Velocimetry, Sept. 11-14, 2007 Rome, Italy.
Chernyshenko S., Donelli R., Iannelli P., Iollo A., Zanetti L., (2007) Flow models for a Vortex Cell,
submitted to AIAA Journal
Adrian R.J., (1991) Particle imaging techniques for experimental fluid mechanics, Annual Review
of Fluid Mechanics, Vol. 22, , pp. 261-304.
Raffel M., Willert C.E. and Kompenhans J., (1998) Particle Image Velocimetry, Springer-Verlag
Recommended

![MACH NUMBER, RELATIVE THICKNESS, SWEEP AND · PDF fileAN EMPIRICAL INVESTIGATION OF PARAMETERS AND EQUATIONS ... and type of airfoil. ... Explanation of . M. CC [4]](https://img.pdfslide.us/doc/110x75/5a7328967f8b9ac0538e6b19/mach-number-relative-thickness-sweep-and-an-empirical-investigation-of.jpg)