2010-2011 School Improvement Plan (SIP)-Form SIP-1
June 2010 1 Rule 6A-1.099811 Revised May 28, 2010
FLORIDA DEPARTMENT OF EDUCATION
Differentiated Accountability
School Improvement Plan (SIP)
Form SIP-1
Proposed for 2010-2011
2010-2011 School Improvement Plan (SIP)-Form SIP-1
June 2010 2 Rule 6A-1.099811 Revised May 28, 2010
2010 – 2011 SCHOOL IMPROVEMENT PLAN
PART I: SCHOOL INFORMATION
School Name: Spruce Creek High School District Name: Volusia
Principal: Dr. Todd J. Sparger Superintendent: Dr. Margaret Smith
SAC Chair: Leesa Holloway Date of School Board Approval: Pending School Board Action on November 9th, 2010.
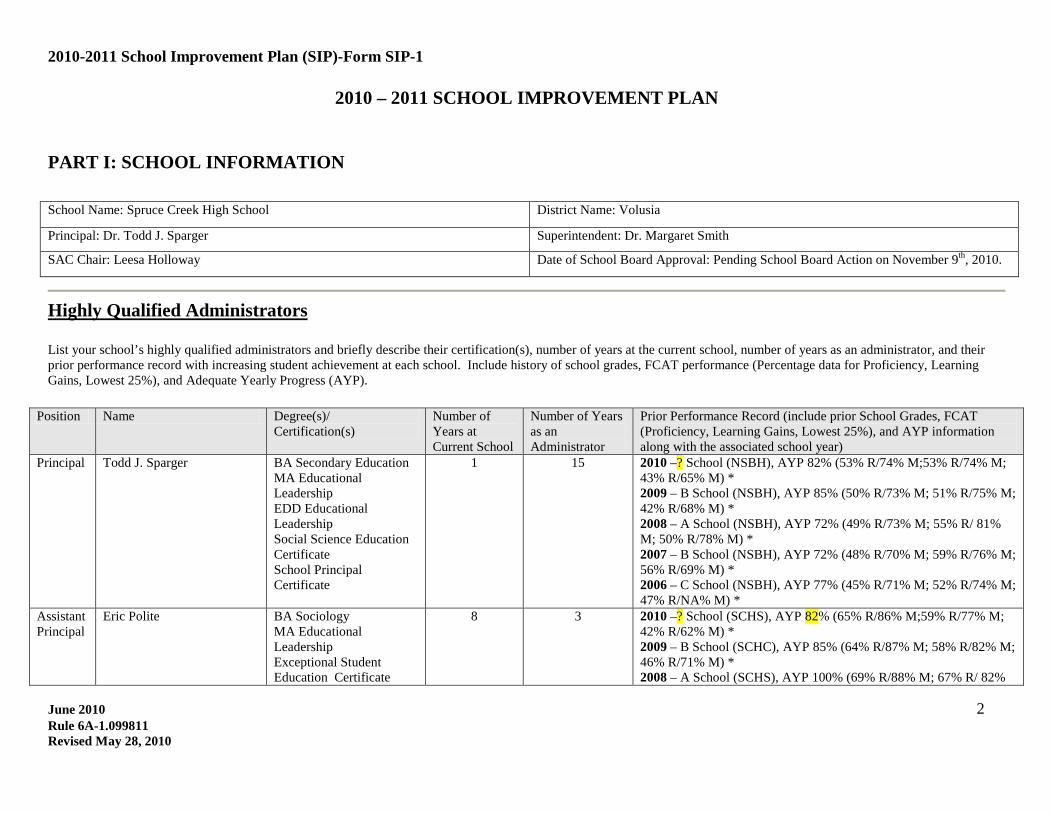
Highly Qualified Administrators
List your school’s highly qualified administrators and briefly describe their certification(s), number of years at the current school, number of years as an administrator, and their prior performance record with increasing student achievement at each school. Include history of school grades, FCAT performance (Percentage data for Proficiency, Learning Gains, Lowest 25%), and Adequate Yearly Progress (AYP).
Position Name Degree(s)/ Certification(s)
Number of Years at Current School
Number of Years as an Administrator
Prior Performance Record (include prior School Grades, FCAT (Proficiency, Learning Gains, Lowest 25%), and AYP information along with the associated school year)
Principal
Todd J. Sparger BA Secondary Education MA Educational Leadership EDD Educational Leadership Social Science Education Certificate School Principal Certificate
1 15 2010 –? School (NSBH), AYP 82% (53% R/74% M;53% R/74% M; 43% R/65% M) * 2009 – B School (NSBH), AYP 85% (50% R/73% M; 51% R/75% M; 42% R/68% M) * 2008 – A School (NSBH), AYP 72% (49% R/73% M; 55% R/ 81% M; 50% R/78% M) * 2007 – B School (NSBH), AYP 72% (48% R/70% M; 59% R/76% M; 56% R/69% M) * 2006 – C School (NSBH), AYP 77% (45% R/71% M; 52% R/74% M; 47% R/NA% M) *
Assistant Principal
Eric Polite BA Sociology MA Educational Leadership Exceptional Student Education Certificate
8 3 2010 –? School (SCHS), AYP 82% (65% R/86% M;59% R/77% M; 42% R/62% M) * 2009 – B School (SCHC), AYP 85% (64% R/87% M; 58% R/82% M; 46% R/71% M) * 2008 – A School (SCHS), AYP 100% (69% R/88% M; 67% R/ 82%
2010-2011 School Improvement Plan (SIP)-Form SIP-1
June 2010 3 Rule 6A-1.099811 Revised May 28, 2010
Educational Leadership Certificate
M; 48% R/69% M) * 2007 – B School (SCHS), AYP 74% (61% R/85% M; 58% R/76% M; 42% R/59% M) * 2006 – B School (SCHS), AYP 82% (61% R/86% M; 57% R/79% M; 45% R/NA% M) *
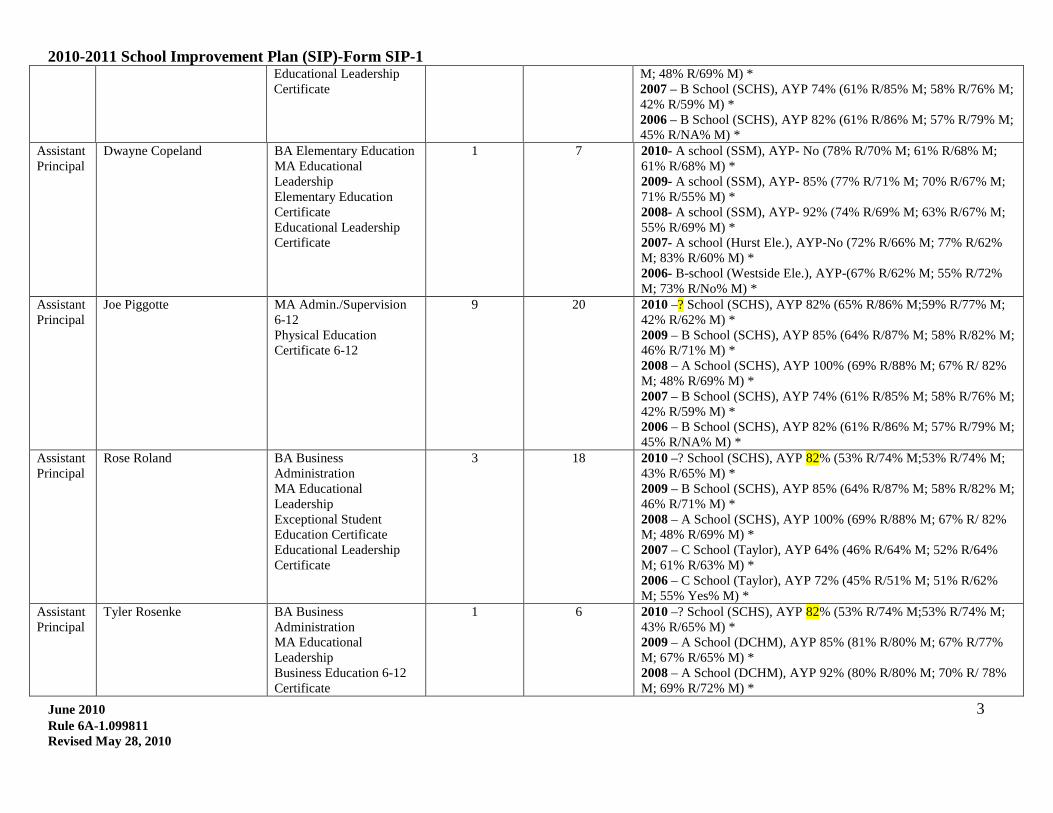
Assistant Principal
Dwayne Copeland BA Elementary Education MA Educational Leadership Elementary Education Certificate Educational Leadership Certificate
1 7 2010- A school (SSM), AYP- No (78% R/70% M; 61% R/68% M; 61% R/68% M) * 2009- A school (SSM), AYP- 85% (77% R/71% M; 70% R/67% M; 71% R/55% M) * 2008- A school (SSM), AYP- 92% (74% R/69% M; 63% R/67% M; 55% R/69% M) * 2007- A school (Hurst Ele.), AYP-No (72% R/66% M; 77% R/62% M; 83% R/60% M) * 2006- B-school (Westside Ele.), AYP-(67% R/62% M; 55% R/72% M; 73% R/No% M) *
Assistant Principal
Joe Piggotte MA Admin./Supervision 6-12 Physical Education Certificate 6-12
9 20 2010 –? School (SCHS), AYP 82% (65% R/86% M;59% R/77% M; 42% R/62% M) * 2009 – B School (SCHS), AYP 85% (64% R/87% M; 58% R/82% M; 46% R/71% M) * 2008 – A School (SCHS), AYP 100% (69% R/88% M; 67% R/ 82% M; 48% R/69% M) * 2007 – B School (SCHS), AYP 74% (61% R/85% M; 58% R/76% M; 42% R/59% M) * 2006 – B School (SCHS), AYP 82% (61% R/86% M; 57% R/79% M; 45% R/NA% M) *
Assistant Principal
Rose Roland BA Business Administration MA Educational Leadership Exceptional Student Education Certificate Educational Leadership Certificate
3 18 2010 –? School (SCHS), AYP 82% (53% R/74% M;53% R/74% M; 43% R/65% M) * 2009 – B School (SCHS), AYP 85% (64% R/87% M; 58% R/82% M; 46% R/71% M) * 2008 – A School (SCHS), AYP 100% (69% R/88% M; 67% R/ 82% M; 48% R/69% M) * 2007 – C School (Taylor), AYP 64% (46% R/64% M; 52% R/64% M; 61% R/63% M) * 2006 – C School (Taylor), AYP 72% (45% R/51% M; 51% R/62% M; 55% Yes% M) *
Assistant Principal
Tyler Rosenke BA Business Administration MA Educational Leadership Business Education 6-12 Certificate
1 6 2010 –? School (SCHS), AYP 82% (53% R/74% M;53% R/74% M; 43% R/65% M) * 2009 – A School (DCHM), AYP 85% (81% R/80% M; 67% R/77% M; 67% R/65% M) * 2008 – A School (DCHM), AYP 92% (80% R/80% M; 70% R/ 78% M; 69% R/72% M) *
2010-2011 School Improvement Plan (SIP)-Form SIP-1
June 2010 4 Rule 6A-1.099811 Revised May 28, 2010
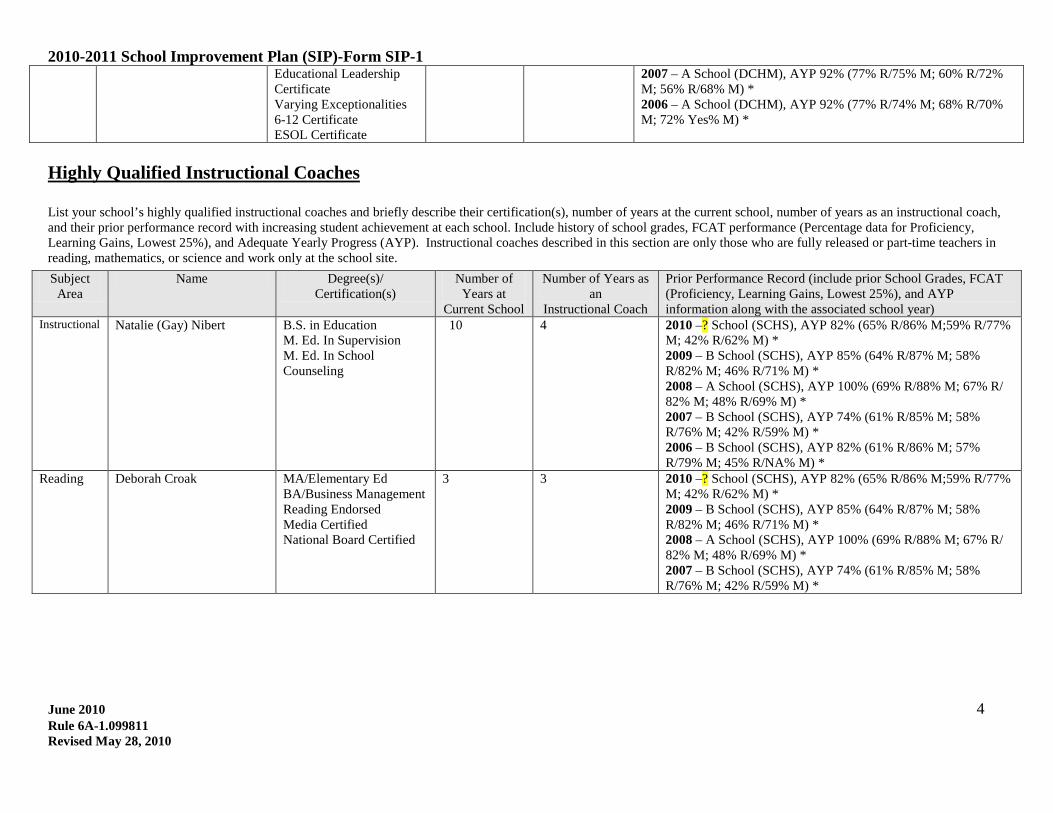
Educational Leadership Certificate Varying Exceptionalities 6-12 Certificate ESOL Certificate
2007 – A School (DCHM), AYP 92% (77% R/75% M; 60% R/72% M; 56% R/68% M) * 2006 – A School (DCHM), AYP 92% (77% R/74% M; 68% R/70% M; 72% Yes% M) *
Highly Qualified Instructional Coaches
List your school’s highly qualified instructional coaches and briefly describe their certification(s), number of years at the current school, number of years as an instructional coach, and their prior performance record with increasing student achievement at each school. Include history of school grades, FCAT performance (Percentage data for Proficiency, Learning Gains, Lowest 25%), and Adequate Yearly Progress (AYP). Instructional coaches described in this section are only those who are fully released or part-time teachers in reading, mathematics, or science and work only at the school site.
Subject Area
Name Degree(s)/ Certification(s)
Number of Years at
Current School
Number of Years as an
Instructional Coach
Prior Performance Record (include prior School Grades, FCAT (Proficiency, Learning Gains, Lowest 25%), and AYP information along with the associated school year)
Instructional Natalie (Gay) Nibert B.S. in Education M. Ed. In Supervision M. Ed. In School Counseling
10 4 2010 –? School (SCHS), AYP 82% (65% R/86% M;59% R/77% M; 42% R/62% M) * 2009 – B School (SCHS), AYP 85% (64% R/87% M; 58% R/82% M; 46% R/71% M) * 2008 – A School (SCHS), AYP 100% (69% R/88% M; 67% R/ 82% M; 48% R/69% M) * 2007 – B School (SCHS), AYP 74% (61% R/85% M; 58% R/76% M; 42% R/59% M) * 2006 – B School (SCHS), AYP 82% (61% R/86% M; 57% R/79% M; 45% R/NA% M) *
Reading Deborah Croak MA/Elementary Ed BA/Business Management Reading Endorsed Media Certified National Board Certified
3 3 2010 –? School (SCHS), AYP 82% (65% R/86% M;59% R/77% M; 42% R/62% M) * 2009 – B School (SCHS), AYP 85% (64% R/87% M; 58% R/82% M; 46% R/71% M) * 2008 – A School (SCHS), AYP 100% (69% R/88% M; 67% R/ 82% M; 48% R/69% M) * 2007 – B School (SCHS), AYP 74% (61% R/85% M; 58% R/76% M; 42% R/59% M) *
2010-2011 School Improvement Plan (SIP)-Form SIP-1
June 2010 5 Rule 6A-1.099811 Revised May 28, 2010
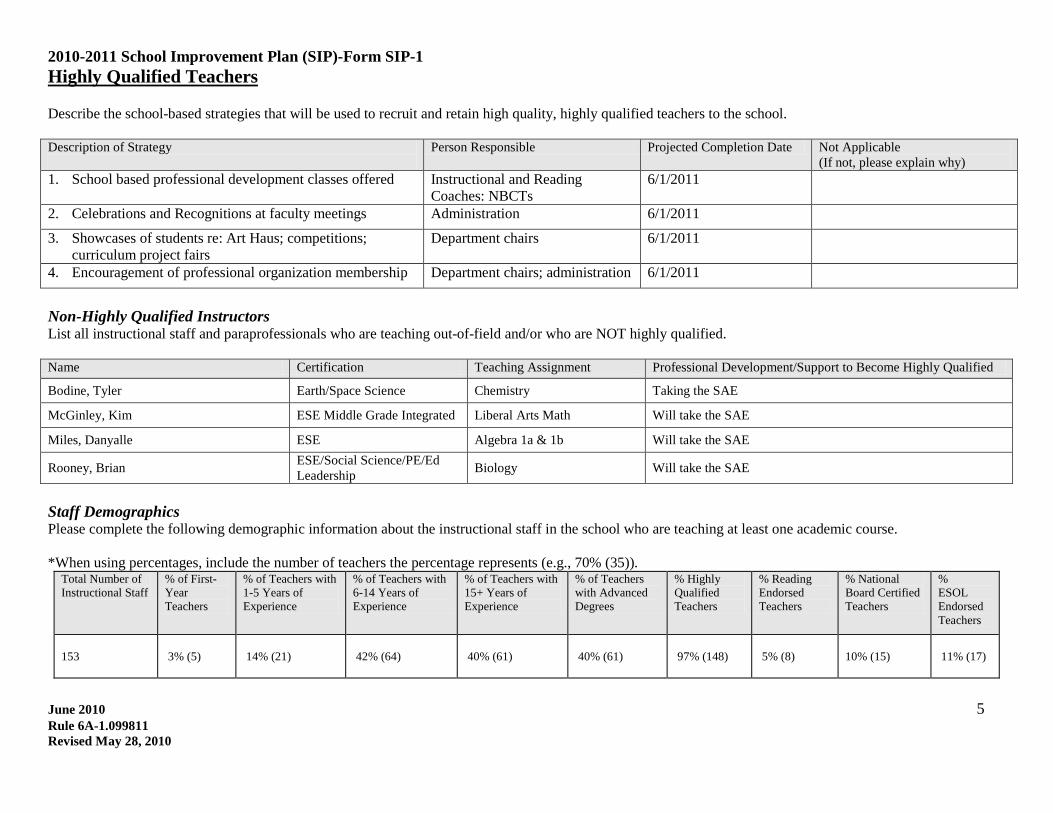
Highly Qualified Teachers
Describe the school-based strategies that will be used to recruit and retain high quality, highly qualified teachers to the school. Description of Strategy
Person Responsible Projected Completion Date Not Applicable (If not, please explain why)
1. School based professional development classes offered Instructional and Reading Coaches: NBCTs
6/1/2011
2. Celebrations and Recognitions at faculty meetings Administration 6/1/2011
3. Showcases of students re: Art Haus; competitions; curriculum project fairs
Department chairs 6/1/2011
4. Encouragement of professional organization membership Department chairs; administration 6/1/2011
Non-Highly Qualified Instructors List all instructional staff and paraprofessionals who are teaching out-of-field and/or who are NOT highly qualified. Name Certification Teaching Assignment Professional Development/Support to Become Highly Qualified
Bodine, Tyler Earth/Space Science Chemistry Taking the SAE
McGinley, Kim ESE Middle Grade Integrated Liberal Arts Math Will take the SAE
Miles, Danyalle ESE Algebra 1a & 1b Will take the SAE
Rooney, Brian ESE/Social Science/PE/Ed Leadership Biology Will take the SAE
Staff Demographics Please complete the following demographic information about the instructional staff in the school who are teaching at least one academic course. *When using percentages, include the number of teachers the percentage represents (e.g., 70% (35)).
Total Number of Instructional Staff
% of First-Year Teachers
% of Teachers with 1-5 Years of Experience
% of Teachers with 6-14 Years of Experience
% of Teachers with 15+ Years of Experience
% of Teachers with Advanced Degrees
% Highly Qualified Teachers
% Reading Endorsed Teachers
% National Board Certified Teachers
% ESOL Endorsed Teachers
153 3% (5) 14% (21) 42% (64) 40% (61) 40% (61) 97% (148) 5% (8) 10% (15) 11% (17)
2010-2011 School Improvement Plan (SIP)-Form SIP-1
June 2010 6 Rule 6A-1.099811 Revised May 28, 2010
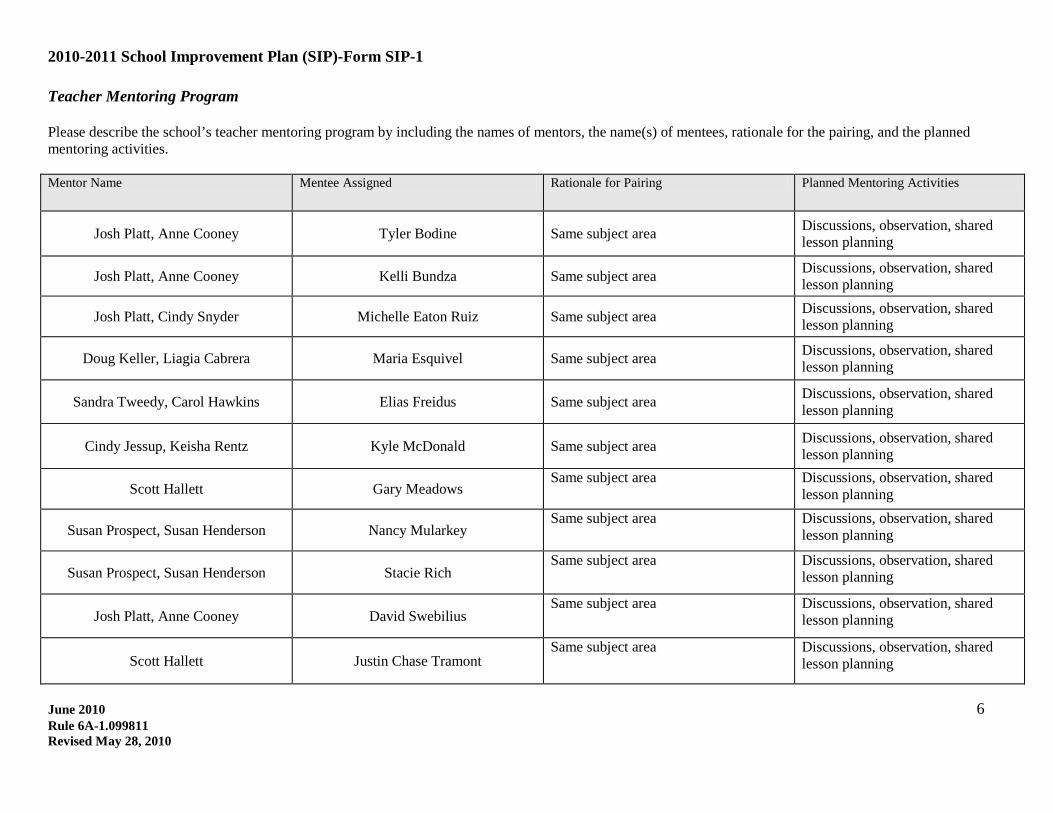
Teacher Mentoring Program Please describe the school’s teacher mentoring program by including the names of mentors, the name(s) of mentees, rationale for the pairing, and the planned mentoring activities. Mentor Name Mentee Assigned Rationale for Pairing Planned Mentoring Activities
Josh Platt, Anne Cooney Tyler Bodine Same subject area Discussions, observation, shared lesson planning
Josh Platt, Anne Cooney Kelli Bundza Same subject area Discussions, observation, shared lesson planning
Josh Platt, Cindy Snyder Michelle Eaton Ruiz Same subject area Discussions, observation, shared lesson planning
Doug Keller, Liagia Cabrera Maria Esquivel Same subject area Discussions, observation, shared lesson planning
Sandra Tweedy, Carol Hawkins Elias Freidus Same subject area Discussions, observation, shared lesson planning
Cindy Jessup, Keisha Rentz Kyle McDonald Same subject area Discussions, observation, shared lesson planning
Scott Hallett Gary Meadows Same subject area Discussions, observation, shared
lesson planning
Susan Prospect, Susan Henderson Nancy Mularkey Same subject area Discussions, observation, shared
lesson planning
Susan Prospect, Susan Henderson Stacie Rich Same subject area Discussions, observation, shared
lesson planning
Josh Platt, Anne Cooney David Swebilius Same subject area Discussions, observation, shared
lesson planning
Scott Hallett Justin Chase Tramont Same subject area Discussions, observation, shared
lesson planning
2010-2011 School Improvement Plan (SIP)-Form SIP-1
June 2010 7 Rule 6A-1.099811 Revised May 28, 2010
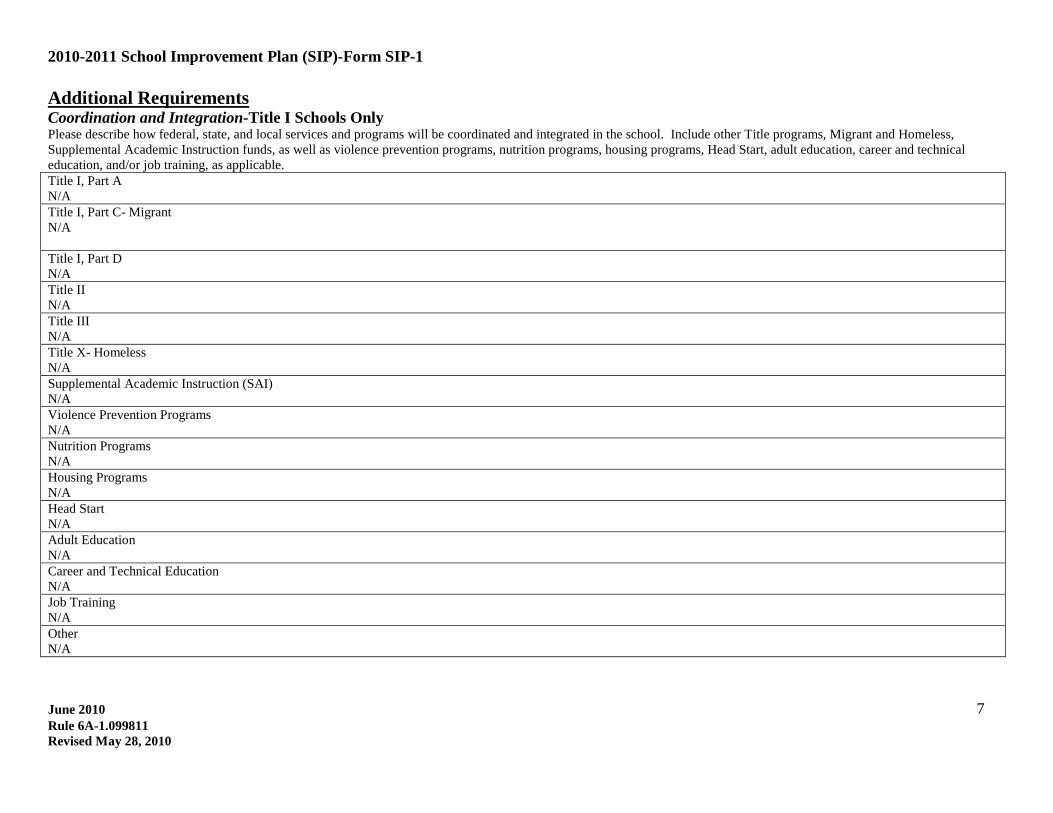
Coordination and Integration-Title I Schools Only Additional Requirements
Please describe how federal, state, and local services and programs will be coordinated and integrated in the school. Include other Title programs, Migrant and Homeless, Supplemental Academic Instruction funds, as well as violence prevention programs, nutrition programs, housing programs, Head Start, adult education, career and technical education, and/or job training, as applicable. Title I, Part A N/A Title I, Part C- Migrant N/A Title I, Part D N/A Title II N/A Title III N/A Title X- Homeless N/A Supplemental Academic Instruction (SAI) N/A Violence Prevention Programs N/A Nutrition Programs N/A Housing Programs N/A Head Start N/A Adult Education N/A Career and Technical Education N/A Job Training N/A Other N/A
2010-2011 School Improvement Plan (SIP)-Form SIP-1
June 2010 8 Rule 6A-1.099811 Revised May 28, 2010
Response to Instruction/Intervention (RtI)
School-Based RtI Team
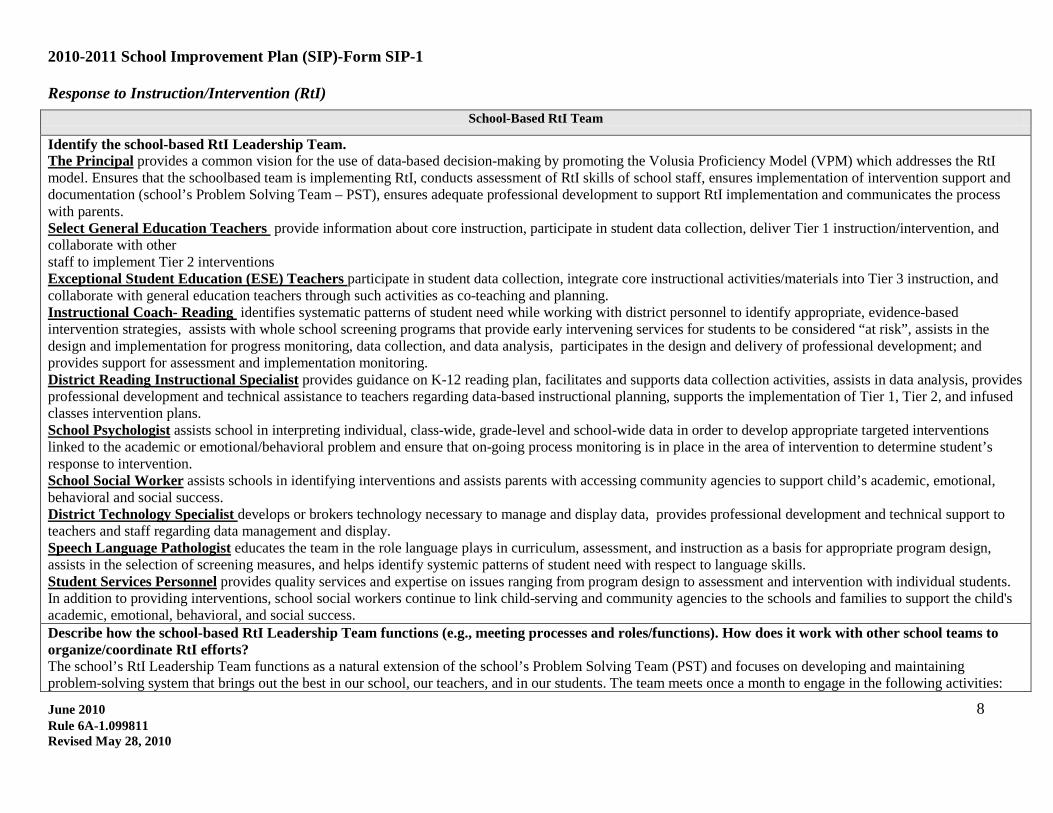
Identify the school-based RtI Leadership Team. The Principal provides a common vision for the use of data-based decision-making by promoting the Volusia Proficiency Model (VPM) which addresses the RtI model. Ensures that the schoolbased team is implementing RtI, conducts assessment of RtI skills of school staff, ensures implementation of intervention support and documentation (school’s Problem Solving Team – PST), ensures adequate professional development to support RtI implementation and communicates the process with parents. Select General Education Teachers
staff to implement Tier 2 interventions
provide information about core instruction, participate in student data collection, deliver Tier 1 instruction/intervention, and collaborate with other
Exceptional Student Education (ESE) Teachers participate in student data collection, integrate core instructional activities/materials into Tier 3 instruction, and collaborate with general education teachers through such activities as co-teaching and planning. Instructional Coach- Reading identifies systematic patterns of student need while working with district personnel to identify appropriate, evidence-based intervention strategies, assists with whole school screening programs that provide early intervening services for students to be considered “at risk”, assists in the design and implementation for progress monitoring, data collection, and data analysis, participates in the design and delivery of professional development; and provides support for assessment and implementation monitoring. District Reading Instructional Specialist provides guidance on K-12 reading plan, facilitates and supports data collection activities, assists in data analysis, provides professional development and technical assistance to teachers regarding data-based instructional planning, supports the implementation of Tier 1, Tier 2, and infused classes intervention plans. School Psychologist assists school in interpreting individual, class-wide, grade-level and school-wide data in order to develop appropriate targeted interventions linked to the academic or emotional/behavioral problem and ensure that on-going process monitoring is in place in the area of intervention to determine student’s response to intervention. School Social Worker assists schools in identifying interventions and assists parents with accessing community agencies to support child’s academic, emotional, behavioral and social success. District Technology Specialist develops or brokers technology necessary to manage and display data, provides professional development and technical support to teachers and staff regarding data management and display. Speech Language Pathologist educates the team in the role language plays in curriculum, assessment, and instruction as a basis for appropriate program design, assists in the selection of screening measures, and helps identify systemic patterns of student need with respect to language skills. Student Services Personnel provides quality services and expertise on issues ranging from program design to assessment and intervention with individual students. In addition to providing interventions, school social workers continue to link child-serving and community agencies to the schools and families to support the child's academic, emotional, behavioral, and social success. Describe how the school-based RtI Leadership Team functions (e.g., meeting processes and roles/functions). How does it work with other school teams to organize/coordinate RtI efforts? The school’s RtI Leadership Team functions as a natural extension of the school’s Problem Solving Team (PST) and focuses on developing and maintaining problem-solving system that brings out the best in our school, our teachers, and in our students. The team meets once a month to engage in the following activities:
2010-2011 School Improvement Plan (SIP)-Form SIP-1
June 2010 9 Rule 6A-1.099811 Revised May 28, 2010
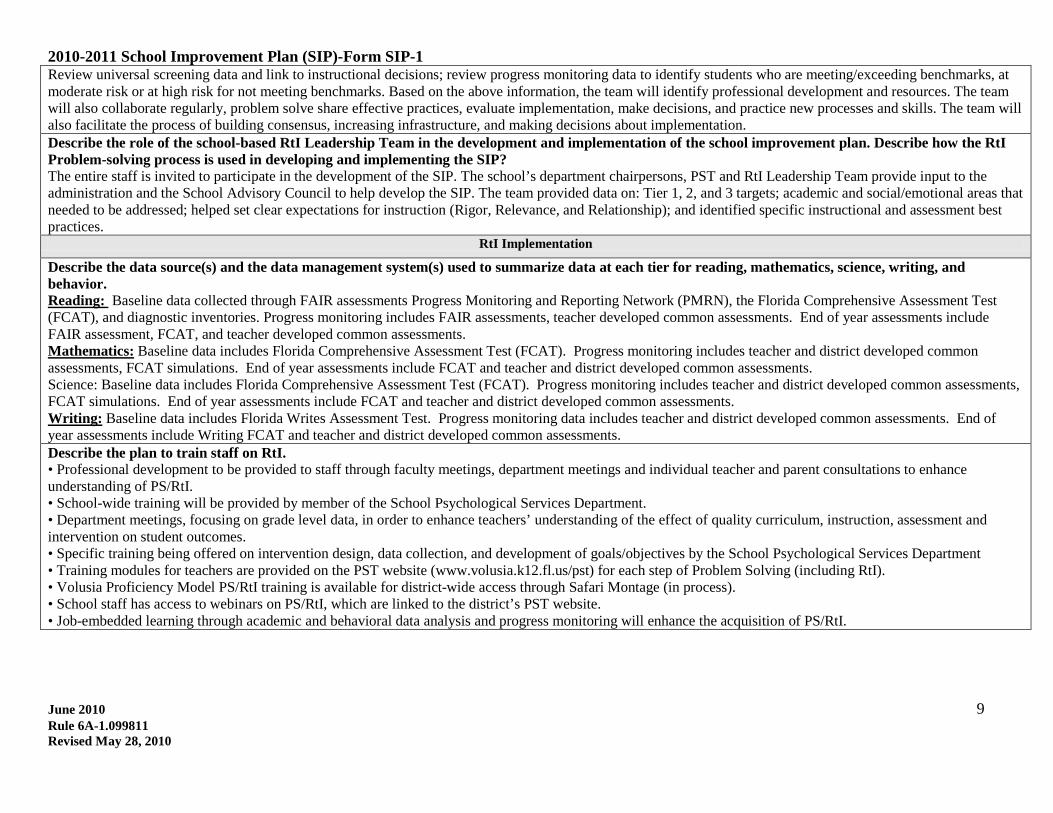
Review universal screening data and link to instructional decisions; review progress monitoring data to identify students who are meeting/exceeding benchmarks, at moderate risk or at high risk for not meeting benchmarks. Based on the above information, the team will identify professional development and resources. The team will also collaborate regularly, problem solve share effective practices, evaluate implementation, make decisions, and practice new processes and skills. The team will also facilitate the process of building consensus, increasing infrastructure, and making decisions about implementation. Describe the role of the school-based RtI Leadership Team in the development and implementation of the school improvement plan. Describe how the RtI Problem-solving process is used in developing and implementing the SIP? The entire staff is invited to participate in the development of the SIP. The school’s department chairpersons, PST and RtI Leadership Team provide input to the administration and the School Advisory Council to help develop the SIP. The team provided data on: Tier 1, 2, and 3 targets; academic and social/emotional areas that needed to be addressed; helped set clear expectations for instruction (Rigor, Relevance, and Relationship); and identified specific instructional and assessment best practices.
RtI Implementation
Describe the data source(s) and the data management system(s) used to summarize data at each tier for reading, mathematics, science, writing, and behavior. Reading: Baseline data collected through FAIR assessments Progress Monitoring and Reporting Network (PMRN), the Florida Comprehensive Assessment Test (FCAT), and diagnostic inventories. Progress monitoring includes FAIR assessments, teacher developed common assessments. End of year assessments include FAIR assessment, FCAT, and teacher developed common assessments. Mathematics:
Science: Baseline data includes Florida Comprehensive Assessment Test (FCAT). Progress monitoring includes teacher and district developed common assessments, FCAT simulations. End of year assessments include FCAT and teacher and district developed common assessments.
Baseline data includes Florida Comprehensive Assessment Test (FCAT). Progress monitoring includes teacher and district developed common assessments, FCAT simulations. End of year assessments include FCAT and teacher and district developed common assessments.
Writing: Baseline data includes Florida Writes Assessment Test. Progress monitoring data includes teacher and district developed common assessments. End of year assessments include Writing FCAT and teacher and district developed common assessments. Describe the plan to train staff on RtI. • Professional development to be provided to staff through faculty meetings, department meetings and individual teacher and parent consultations to enhance understanding of PS/RtI. • School-wide training will be provided by member of the School Psychological Services Department. • Department meetings, focusing on grade level data, in order to enhance teachers’ understanding of the effect of quality curriculum, instruction, assessment and intervention on student outcomes. • Specific training being offered on intervention design, data collection, and development of goals/objectives by the School Psychological Services Department • Training modules for teachers are provided on the PST website (www.volusia.k12.fl.us/pst) for each step of Problem Solving (including RtI). • Volusia Proficiency Model PS/RtI training is available for district-wide access through Safari Montage (in process). • School staff has access to webinars on PS/RtI, which are linked to the district’s PST website. • Job-embedded learning through academic and behavioral data analysis and progress monitoring will enhance the acquisition of PS/RtI.
2010-2011 School Improvement Plan (SIP)-Form SIP-1
June 2010 10 Rule 6A-1.099811 Revised May 28, 2010
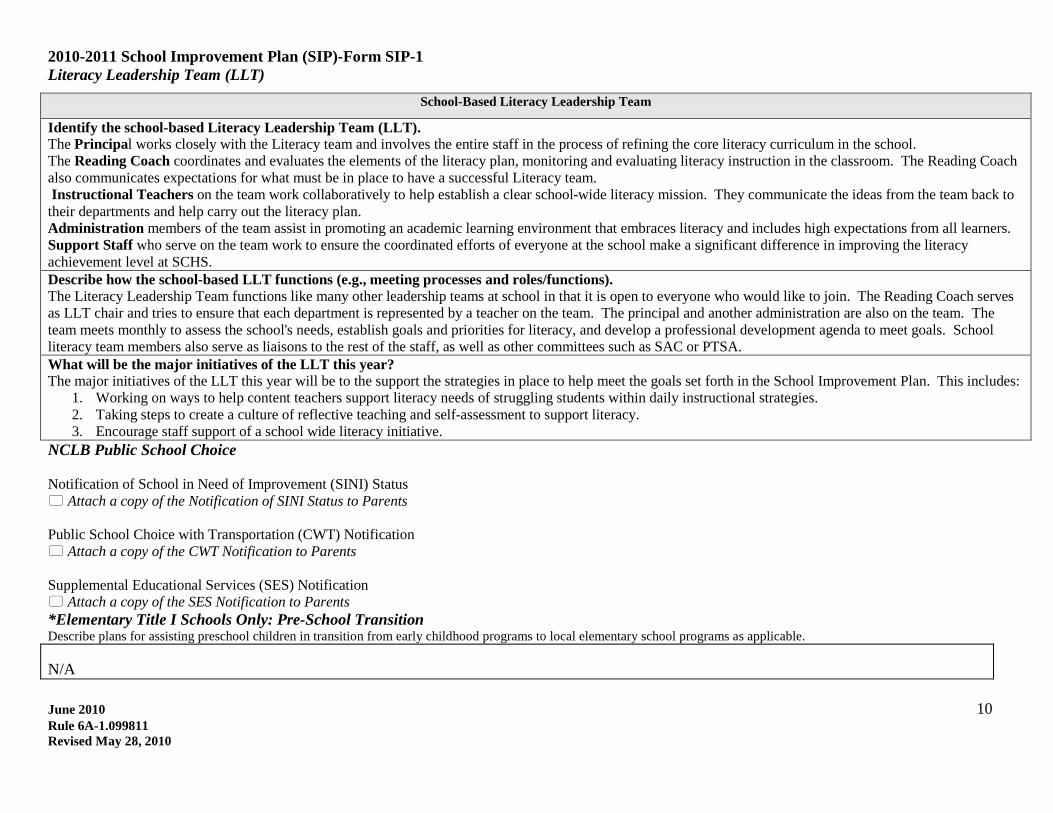
Literacy Leadership Team (LLT)
School-Based Literacy Leadership Team
Identify the school-based Literacy Leadership Team (LLT). The Principal works closely with the Literacy team and involves the entire staff in the process of refining the core literacy curriculum in the school. The Reading Coach coordinates and evaluates the elements of the literacy plan, monitoring and evaluating literacy instruction in the classroom. The Reading Coach also communicates expectations for what must be in place to have a successful Literacy team. Instructional Teachers on the team work collaboratively to help establish a clear school-wide literacy mission. They communicate the ideas from the team back to their departments and help carry out the literacy plan. Administration members of the team assist in promoting an academic learning environment that embraces literacy and includes high expectations from all learners. Support Staff who serve on the team work to ensure the coordinated efforts of everyone at the school make a significant difference in improving the literacy achievement level at SCHS. Describe how the school-based LLT functions (e.g., meeting processes and roles/functions). The Literacy Leadership Team functions like many other leadership teams at school in that it is open to everyone who would like to join. The Reading Coach serves as LLT chair and tries to ensure that each department is represented by a teacher on the team. The principal and another administration are also on the team. The team meets monthly to assess the school's needs, establish goals and priorities for literacy, and develop a professional development agenda to meet goals. School literacy team members also serve as liaisons to the rest of the staff, as well as other committees such as SAC or PTSA. What will be the major initiatives of the LLT this year? The major initiatives of the LLT this year will be to the support the strategies in place to help meet the goals set forth in the School Improvement Plan. This includes:
1. Working on ways to help content teachers support literacy needs of struggling students within daily instructional strategies. 2. Taking steps to create a culture of reflective teaching and self-assessment to support literacy. 3. Encourage staff support of a school wide literacy initiative.
NCLB Public School Choice Notification of School in Need of Improvement (SINI) Status Attach a copy of the Notification of SINI Status to Parents Public School Choice with Transportation (CWT) Notification Attach a copy of the CWT Notification to Parents Supplemental Educational Services (SES) Notification Attach a copy of the SES Notification to Parents *Elementary Title I Schools Only: Pre-School Transition Describe plans for assisting preschool children in transition from early childhood programs to local elementary school programs as applicable. N/A
2010-2011 School Improvement Plan (SIP)-Form SIP-1
June 2010 11 Rule 6A-1.099811 Revised May 28, 2010
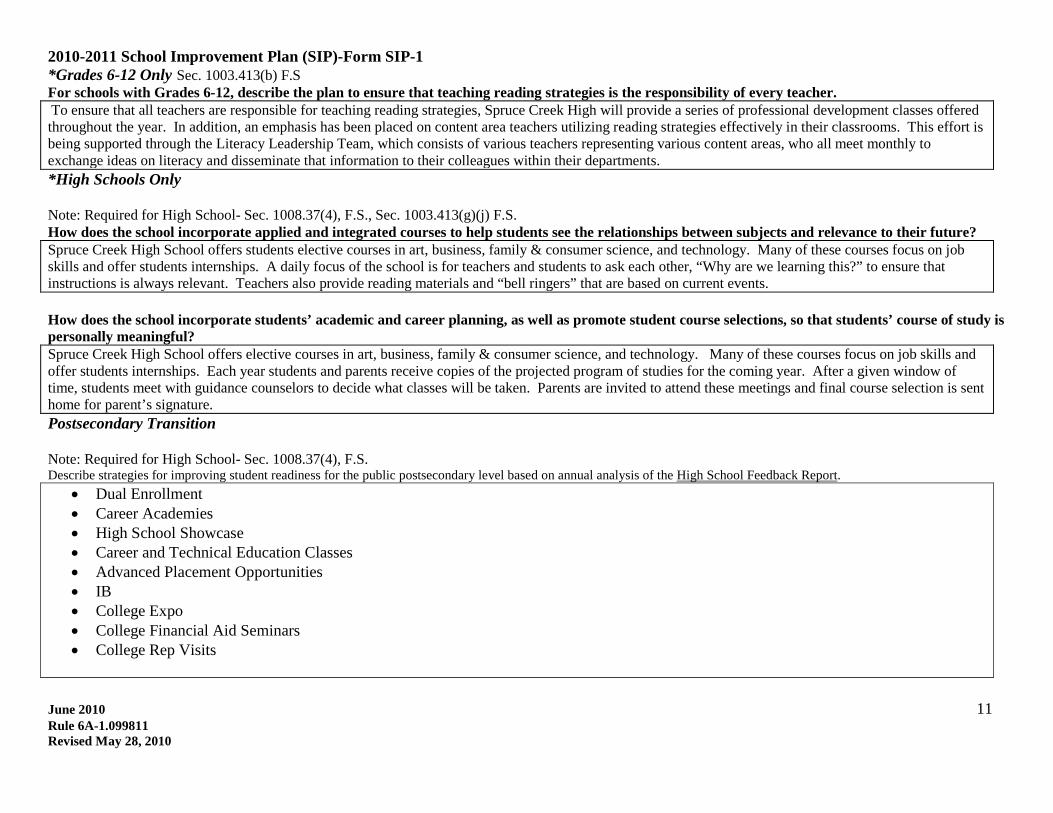
*Grades 6-12 Only Sec. 1003.413(b) F.S For schools with Grades 6-12, describe the plan to ensure that teaching reading strategies is the responsibility of every teacher. To ensure that all teachers are responsible for teaching reading strategies, Spruce Creek High will provide a series of professional development classes offered throughout the year. In addition, an emphasis has been placed on content area teachers utilizing reading strategies effectively in their classrooms. This effort is being supported through the Literacy Leadership Team, which consists of various teachers representing various content areas, who all meet monthly to exchange ideas on literacy and disseminate that information to their colleagues within their departments. *High Schools Only Note: Required for High School- Sec. 1008.37(4), F.S., Sec. 1003.413(g)(j) F.S. How does the school incorporate applied and integrated courses to help students see the relationships between subjects and relevance to their future? Spruce Creek High School offers students elective courses in art, business, family & consumer science, and technology. Many of these courses focus on job skills and offer students internships. A daily focus of the school is for teachers and students to ask each other, “Why are we learning this?” to ensure that instructions is always relevant. Teachers also provide reading materials and “bell ringers” that are based on current events. How does the school incorporate students’ academic and career planning, as well as promote student course selections, so that students’ course of study is personally meaningful? Spruce Creek High School offers elective courses in art, business, family & consumer science, and technology. Many of these courses focus on job skills and offer students internships. Each year students and parents receive copies of the projected program of studies for the coming year. After a given window of time, students meet with guidance counselors to decide what classes will be taken. Parents are invited to attend these meetings and final course selection is sent home for parent’s signature. Postsecondary Transition Note: Required for High School- Sec. 1008.37(4), F.S. Describe strategies for improving student readiness for the public postsecondary level based on annual analysis of the High School Feedback Report.
• Dual Enrollment • Career Academies • High School Showcase • Career and Technical Education Classes • Advanced Placement Opportunities • IB • College Expo • College Financial Aid Seminars • College Rep Visits
2010-2011 School Improvement Plan (SIP)-Form SIP-1
June 2010 12 Rule 6A-1.099811 Revised May 28, 2010
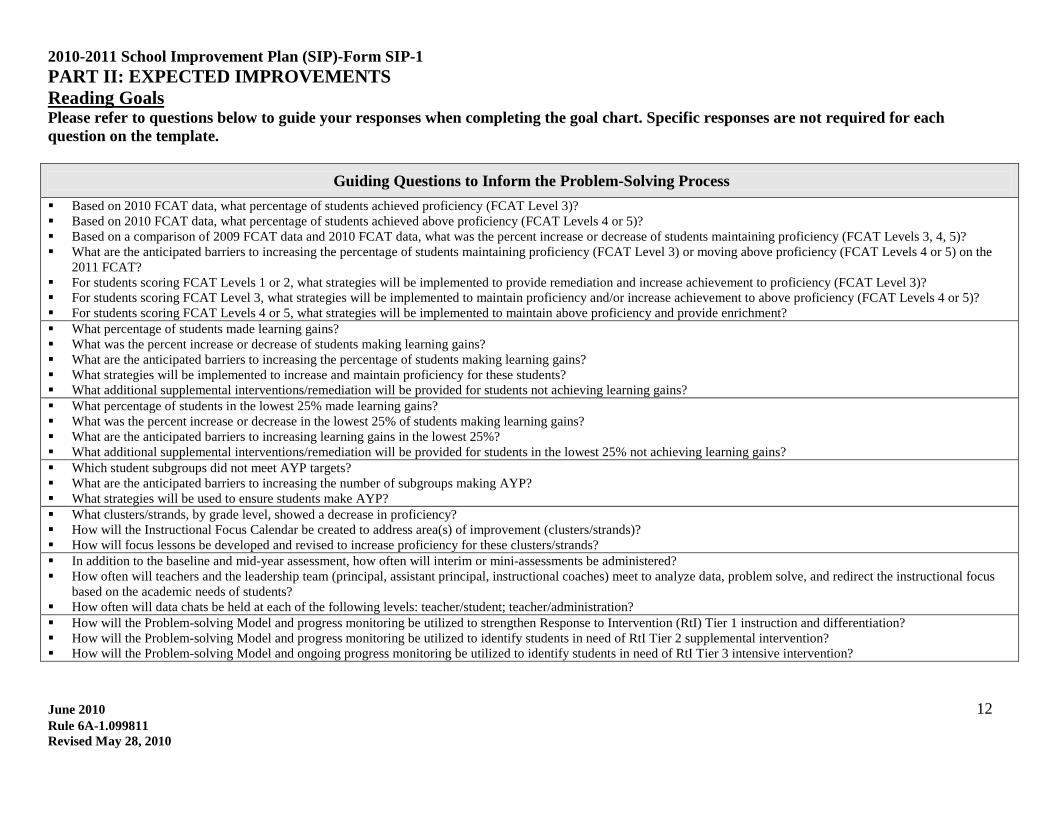
PART II: EXPECTED IMPROVEMENTS
Please refer to questions below to guide your responses when completing the goal chart. Specific responses are not required for each question on the template.
Reading Goals
Guiding Questions to Inform the Problem-Solving Process
Based on 2010 FCAT data, what percentage of students achieved proficiency (FCAT Level 3)? Based on 2010 FCAT data, what percentage of students achieved above proficiency (FCAT Levels 4 or 5)? Based on a comparison of 2009 FCAT data and 2010 FCAT data, what was the percent increase or decrease of students maintaining proficiency (FCAT Levels 3, 4, 5)? What are the anticipated barriers to increasing the percentage of students maintaining proficiency (FCAT Level 3) or moving above proficiency (FCAT Levels 4 or 5) on the
2011 FCAT? For students scoring FCAT Levels 1 or 2, what strategies will be implemented to provide remediation and increase achievement to proficiency (FCAT Level 3)? For students scoring FCAT Level 3, what strategies will be implemented to maintain proficiency and/or increase achievement to above proficiency (FCAT Levels 4 or 5)? For students scoring FCAT Levels 4 or 5, what strategies will be implemented to maintain above proficiency and provide enrichment? What percentage of students made learning gains? What was the percent increase or decrease of students making learning gains? What are the anticipated barriers to increasing the percentage of students making learning gains? What strategies will be implemented to increase and maintain proficiency for these students? What additional supplemental interventions/remediation will be provided for students not achieving learning gains? What percentage of students in the lowest 25% made learning gains? What was the percent increase or decrease in the lowest 25% of students making learning gains? What are the anticipated barriers to increasing learning gains in the lowest 25%? What additional supplemental interventions/remediation will be provided for students in the lowest 25% not achieving learning gains? Which student subgroups did not meet AYP targets? What are the anticipated barriers to increasing the number of subgroups making AYP? What strategies will be used to ensure students make AYP? What clusters/strands, by grade level, showed a decrease in proficiency? How will the Instructional Focus Calendar be created to address area(s) of improvement (clusters/strands)? How will focus lessons be developed and revised to increase proficiency for these clusters/strands? In addition to the baseline and mid-year assessment, how often will interim or mini-assessments be administered? How often will teachers and the leadership team (principal, assistant principal, instructional coaches) meet to analyze data, problem solve, and redirect the instructional focus
based on the academic needs of students? How often will data chats be held at each of the following levels: teacher/student; teacher/administration? How will the Problem-solving Model and progress monitoring be utilized to strengthen Response to Intervention (RtI) Tier 1 instruction and differentiation? How will the Problem-solving Model and progress monitoring be utilized to identify students in need of RtI Tier 2 supplemental intervention? How will the Problem-solving Model and ongoing progress monitoring be utilized to identify students in need of RtI Tier 3 intensive intervention?
2010-2011 School Improvement Plan (SIP)-Form SIP-1
June 2010 13 Rule 6A-1.099811 Revised May 28, 2010
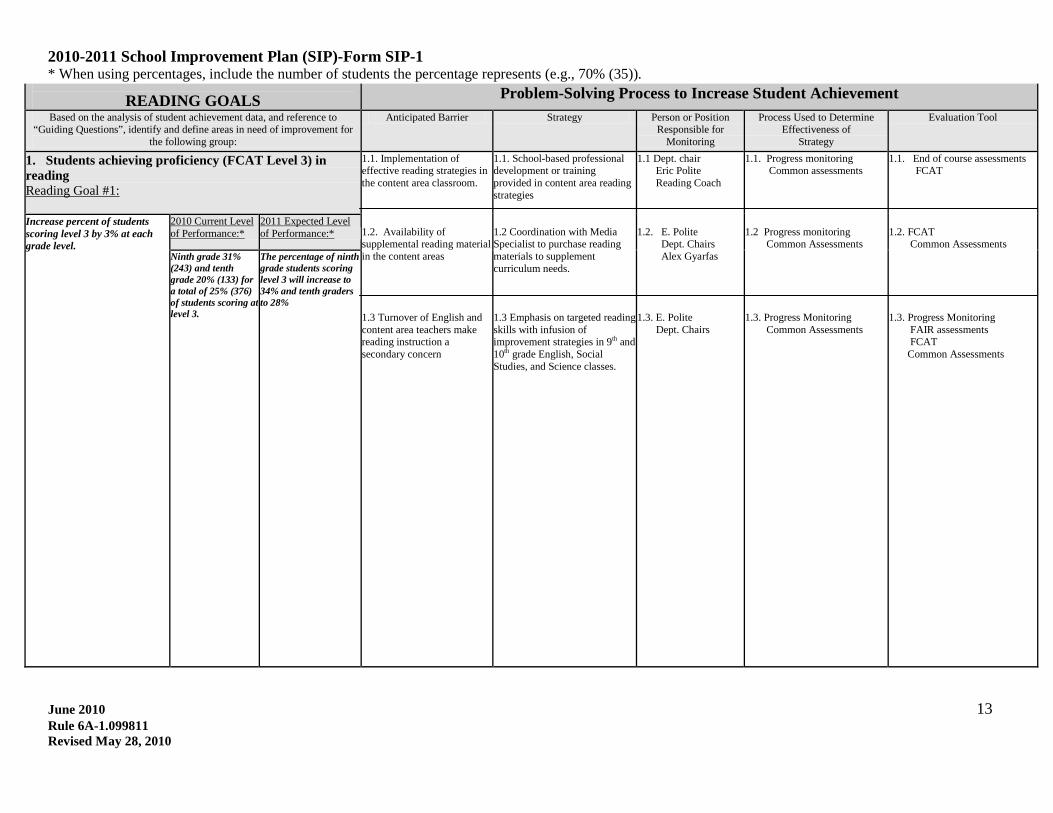
* When using percentages, include the number of students the percentage represents (e.g., 70% (35)).
READING GOALS Problem-Solving Process to Increase Student Achievement
Based on the analysis of student achievement data, and reference to “Guiding Questions”, identify and define areas in need of improvement for
the following group:
Anticipated Barrier Strategy Person or Position Responsible for
Monitoring
Process Used to Determine Effectiveness of
Strategy
Evaluation Tool
1. Students achieving proficiency (FCAT Level 3) in reading
1.1. Implementation of effective reading strategies in the content area classroom. Reading Goal #1: 1.2. Availability of supplemental reading material in the content areas 1.3 Turnover of English and content area teachers make reading instruction a secondary concern
1.1. School-based professional development or training provided in content area reading strategies 1.2 Coordination with Media Specialist to purchase reading materials to supplement curriculum needs. 1.3 Emphasis on targeted reading skills with infusion of improvement strategies in 9th and 10th grade English, Social Studies, and Science classes.
1.1 Dept. chair Eric Polite Reading Coach 1.2. E. Polite Dept. Chairs Alex Gyarfas 1.3. E. Polite Dept. Chairs
1.1. Progress monitoring Common assessments 1.2 Progress monitoring Common Assessments 1.3. Progress Monitoring Common Assessments
1.1. End of course assessments FCAT 1.2. FCAT Common Assessments 1.3. Progress Monitoring FAIR assessments FCAT Common Assessments
Increase percent of students scoring level 3 by 3% at each grade level.
2010 Current Level of Performance:*
2011 Expected Level of Performance:*
Ninth grade 31% (243) and tenth grade 20% (133) for a total of 25% (376) of students scoring at level 3.
The percentage of ninth grade students scoring level 3 will increase to 34% and tenth graders to 28%
2010-2011 School Improvement Plan (SIP)-Form SIP-1
June 2010 14 Rule 6A-1.099811 Revised May 28, 2010
Based on the analysis of student achievement data, and reference to “Guiding Questions”, identify and define areas in need of improvement for
the following group:
Anticipated Barrier Strategy Person or Position Responsible for
Monitoring
Process Used to Determine Effectiveness of
Strategy
Evaluation Tool
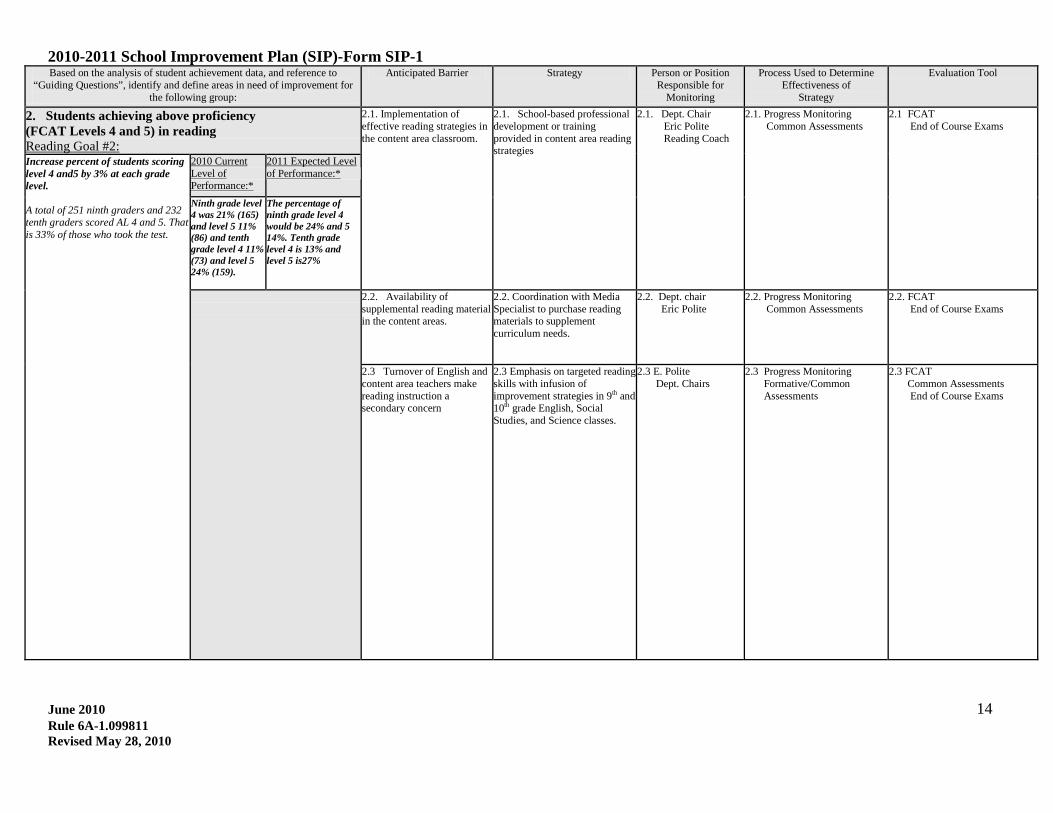
2. Students achieving above proficiency (FCAT Levels 4 and 5) in reading
2.1. Implementation of effective reading strategies in the content area classroom. Reading Goal #2:
2.1. School-based professional development or training provided in content area reading strategies
2.1. Dept. Chair Eric Polite Reading Coach
2.1. Progress Monitoring Common Assessments
2.1 FCAT End of Course Exams
Increase percent of students scoring level 4 and5 by 3% at each grade level. A total of 251 ninth graders and 232 tenth graders scored AL 4 and 5. That is 33% of those who took the test.
2010 Current Level of Performance:*
2011 Expected Level of Performance:*
Ninth grade level 4 was 21% (165) and level 5 11% (86) and tenth grade level 4 11% (73) and level 5 24% (159).
The percentage of ninth grade level 4 would be 24% and 5 14%. Tenth grade level 4 is 13% and level 5 is27%
2.2. Availability of supplemental reading material in the content areas.
2.2. Coordination with Media Specialist to purchase reading materials to supplement curriculum needs.
2.2. Dept. chair Eric Polite
2.2. Progress Monitoring Common Assessments
2.2. FCAT End of Course Exams
2.3 Turnover of English and content area teachers make reading instruction a secondary concern
2.3 Emphasis on targeted reading skills with infusion of improvement strategies in 9th and 10th grade English, Social Studies, and Science classes.
2.3 E. Polite Dept. Chairs
2.3 Progress Monitoring Formative/Common Assessments
2.3 FCAT Common Assessments End of Course Exams
2010-2011 School Improvement Plan (SIP)-Form SIP-1
June 2010 15 Rule 6A-1.099811 Revised May 28, 2010
Based on the analysis of student achievement data, and reference to “Guiding Questions”, identify and define areas in need of improvement for
the following group:
Anticipated Barrier Strategy Person or Position Responsible for
Monitoring
Process Used to Determine Effectiveness of
Strategy
Evaluation Tool
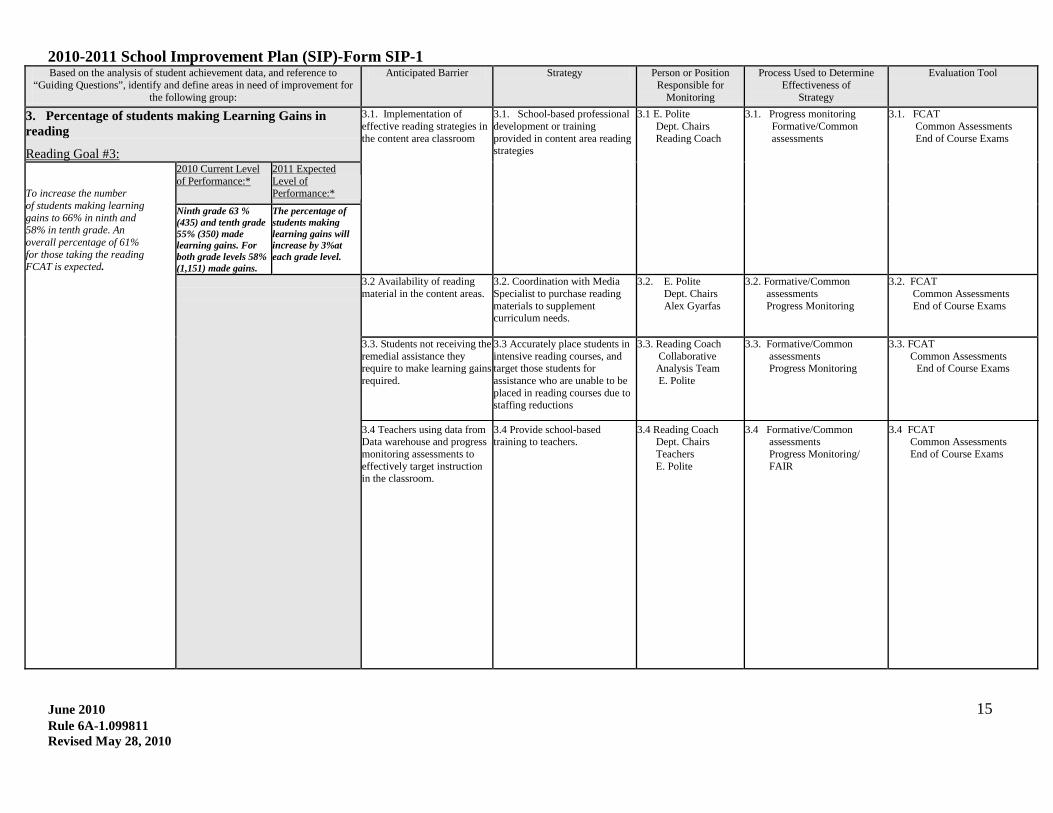
3. Percentage of students making Learning Gains in reading
3.1. Implementation of effective reading strategies in the content area classroom
Reading Goal #3:
3.1. School-based professional development or training provided in content area reading strategies
3.1 E. Polite Dept. Chairs Reading Coach
3.1. Progress monitoring Formative/Common assessments
3.1. FCAT Common Assessments End of Course Exams
To increase the number of students making learning gains to 66% in ninth and 58% in tenth grade. An overall percentage of 61% for those taking the reading FCAT is expected.
2010 Current Level of Performance:*
2011 Expected Level of Performance:*
Ninth grade 63 % (435) and tenth grade 55% (350) made learning gains. For both grade levels 58% (1,151) made gains.
The percentage of students making learning gains will increase by 3%at each grade level.
3.2 Availability of reading material in the content areas.
3.2. Coordination with Media Specialist to purchase reading materials to supplement curriculum needs.
3.2. E. Polite Dept. Chairs Alex Gyarfas
3.2. Formative/Common assessments Progress Monitoring
3.2. FCAT Common Assessments End of Course Exams
3.3. Students not receiving the remedial assistance they require to make learning gains required. 3.4 Teachers using data from Data warehouse and progress monitoring assessments to effectively target instruction in the classroom.
3.3 Accurately place students in intensive reading courses, and target those students for assistance who are unable to be placed in reading courses due to staffing reductions 3.4 Provide school-based training to teachers.
3.3. Reading Coach Collaborative Analysis Team E. Polite 3.4 Reading Coach Dept. Chairs Teachers E. Polite
3.3. Formative/Common assessments Progress Monitoring 3.4 Formative/Common assessments Progress Monitoring/ FAIR
3.3. FCAT Common Assessments
End of Course Exams
3.4 FCAT Common Assessments End of Course Exams
2010-2011 School Improvement Plan (SIP)-Form SIP-1
June 2010 16 Rule 6A-1.099811 Revised May 28, 2010
Based on the analysis of student achievement data, and reference to “Guiding Questions”, identify and define areas in need of improvement for
the following group:
Anticipated Barrier Strategy Person or Position Responsible for
Monitoring
Process Used to Determine Effectiveness of
Strategy
Evaluation Tool
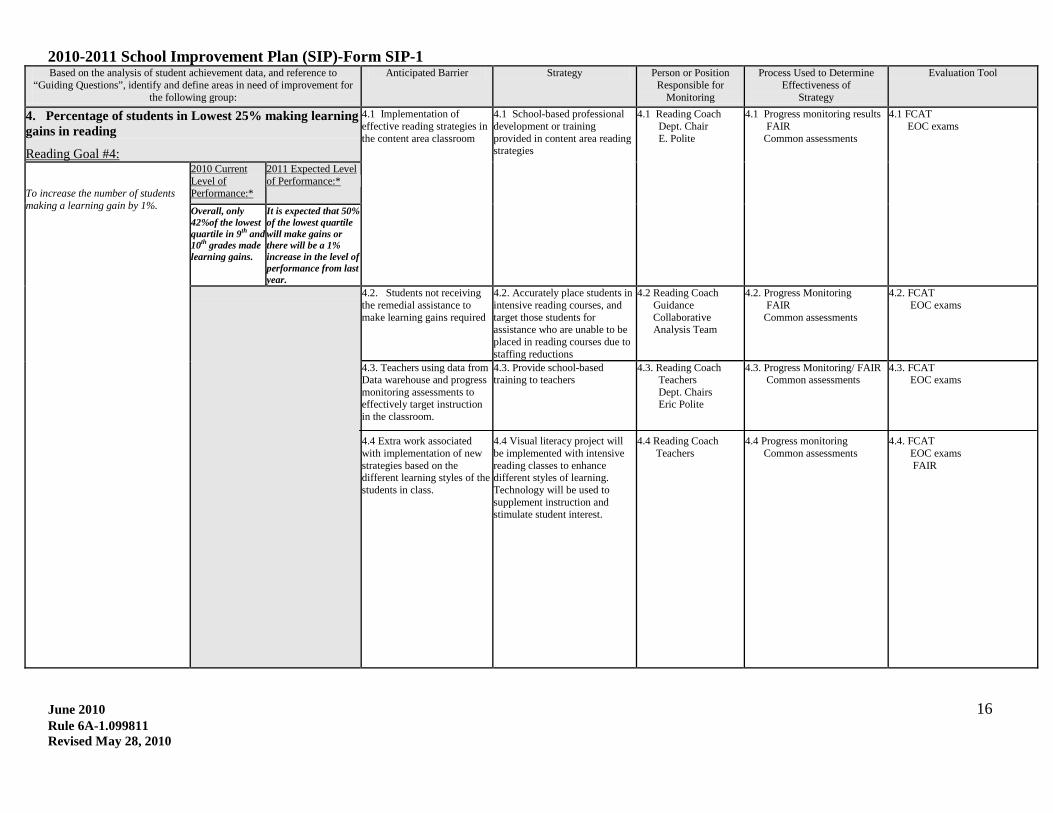
4. Percentage of students in Lowest 25% making learning gains in reading
4.1 Implementation of effective reading strategies in the content area classroom
Reading Goal #4:
4.1 School-based professional development or training provided in content area reading strategies
4.1 Reading Coach Dept. Chair E. Polite
4.1 Progress monitoring results FAIR Common assessments
4.1 FCAT EOC exams
To increase the number of students making a learning gain by 1%.
2010 Current Level of Performance:*
2011 Expected Level of Performance:*
Overall, only 42%of the lowest quartile in 9th and 10th grades made learning gains.
It is expected that 50% of the lowest quartile will make gains or there will be a 1% increase in the level of performance from last year.
4.2. Students not receiving the remedial assistance to make learning gains required
4.2. Accurately place students in intensive reading courses, and target those students for assistance who are unable to be placed in reading courses due to staffing reductions
4.2 Reading Coach Guidance Collaborative Analysis Team
4.2. Progress Monitoring FAIR Common assessments
4.2. FCAT EOC exams
4.3. Teachers using data from Data warehouse and progress monitoring assessments to effectively target instruction in the classroom. 4.4 Extra work associated with implementation of new strategies based on the different learning styles of the students in class.
4.3. Provide school-based training to teachers 4.4 Visual literacy project will be implemented with intensive reading classes to enhance different styles of learning. Technology will be used to supplement instruction and stimulate student interest.
4.3. Reading Coach Teachers Dept. Chairs Eric Polite 4.4 Reading Coach Teachers
4.3. Progress Monitoring/ FAIR Common assessments 4.4 Progress monitoring Common assessments
4.3. FCAT EOC exams 4.4. FCAT EOC exams FAIR
2010-2011 School Improvement Plan (SIP)-Form SIP-1
June 2010 17 Rule 6A-1.099811 Revised May 28, 2010
Based on the analysis of student achievement data, and reference to
“Guiding Questions”, identify and define areas in need of improvement for the applicable subgroup(s):
Anticipated Barrier Strategy Person or Position Responsible for
Monitoring
Process Used to Determine Effectiveness of
Strategy
Evaluation Tool
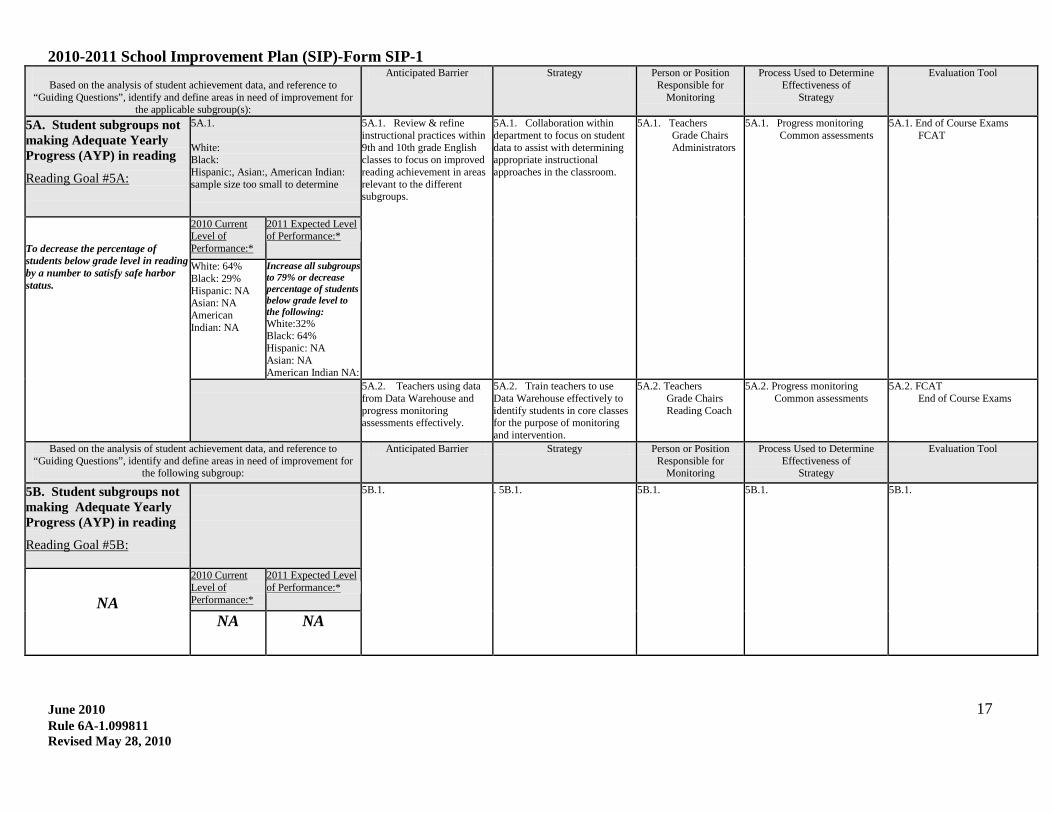
5A. Student subgroups not making Adequate Yearly Progress (AYP) in reading
Reading Goal #5A:
5A.1. White: Black: Hispanic:, Asian:, American Indian: sample size too small to determine
5A.1. Review & refine instructional practices within 9th and 10th grade English classes to focus on improved reading achievement in areas relevant to the different subgroups.
5A.1. Collaboration within department to focus on student data to assist with determining appropriate instructional approaches in the classroom.
5A.1. Teachers Grade Chairs Administrators
5A.1. Progress monitoring Common assessments
5A.1. End of Course Exams FCAT
To decrease the percentage of students below grade level in reading by a number to satisfy safe harbor status.
2010 Current Level of Performance:*
2011 Expected Level of Performance:*
White: 64% Black: 29% Hispanic: NA Asian: NA American Indian: NA
Increase all subgroups to 79% or decrease percentage of students below grade level to the following: White:32% Black: 64% Hispanic: NA Asian: NA American Indian NA:
5A.2. Teachers using data from Data Warehouse and progress monitoring assessments effectively.
5A.2. Train teachers to use Data Warehouse effectively to identify students in core classes for the purpose of monitoring and intervention.
5A.2. Teachers Grade Chairs Reading Coach
5A.2. Progress monitoring Common assessments
5A.2. FCAT End of Course Exams
Based on the analysis of student achievement data, and reference to “Guiding Questions”, identify and define areas in need of improvement for
the following subgroup:
Anticipated Barrier Strategy Person or Position Responsible for
Monitoring
Process Used to Determine Effectiveness of
Strategy
Evaluation Tool
5B. Student subgroups not making Adequate Yearly Progress (AYP) in reading
Reading Goal #5B:
5B.1.
. 5B.1.
5B.1.
5B.1.
5B.1.
NA
2010 Current Level of Performance:*
2011 Expected Level of Performance:*
NA NA
2010-2011 School Improvement Plan (SIP)-Form SIP-1
June 2010 18 Rule 6A-1.099811 Revised May 28, 2010
Based on the analysis of student achievement data, and reference to “Guiding Questions”, identify and define areas in need of improvement for
the following subgroup:
Anticipated Barrier
Strategy Person or Position Responsible for
Monitoring
Process Used to Determine Effectiveness of
Strategy
Evaluation Tool
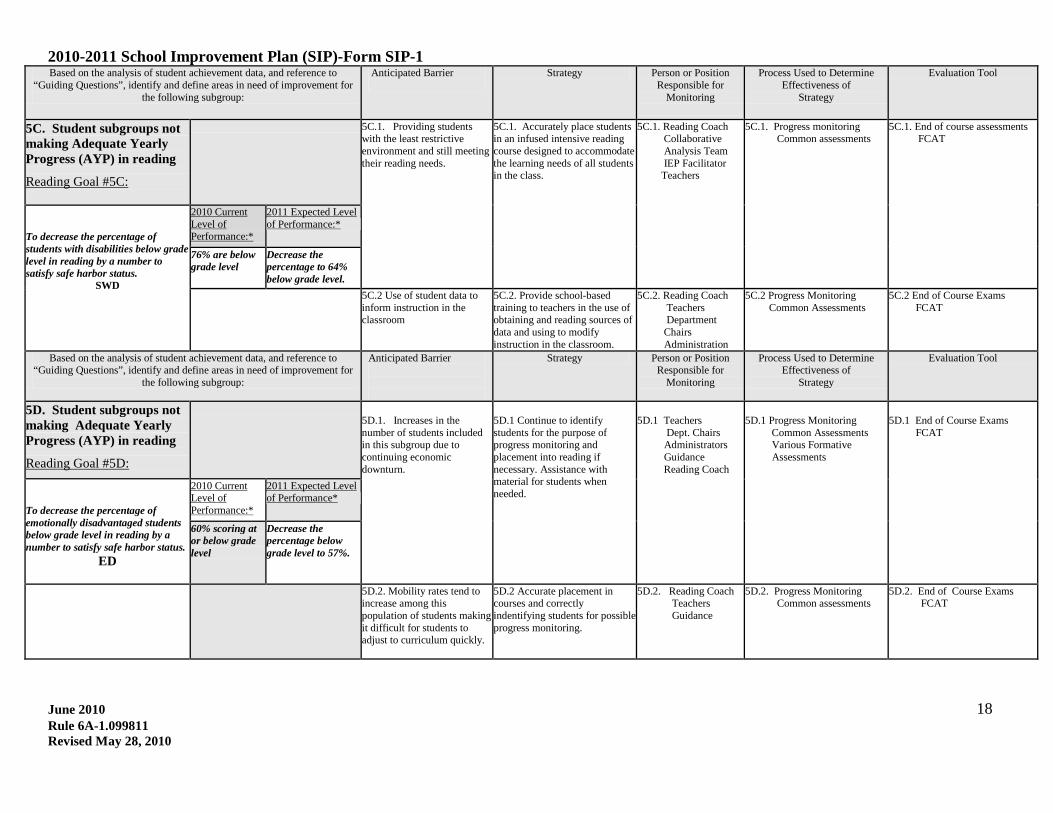
5C. Student subgroups not making Adequate Yearly Progress (AYP) in reading
Reading Goal #5C:
5C.1. Providing students with the least restrictive environment and still meeting their reading needs.
5C.1. Accurately place students in an infused intensive reading course designed to accommodate the learning needs of all students in the class.
5C.1. Reading Coach Collaborative Analysis Team IEP Facilitator Teachers
5C.1. Progress monitoring Common assessments
5C.1. End of course assessments FCAT
To decrease the percentage of students with disabilities below grade level in reading by a number to satisfy safe harbor status.
SWD
2010 Current Level of Performance:*
2011 Expected Level of Performance:*
76% are below grade level
Decrease the percentage to 64% below grade level.
5C.2 Use of student data to inform instruction in the classroom
5C.2. Provide school-based training to teachers in the use of obtaining and reading sources of data and using to modify instruction in the classroom.
5C.2. Reading Coach Teachers Department Chairs Administration
5C.2 Progress Monitoring Common Assessments
5C.2 End of Course Exams FCAT
Based on the analysis of student achievement data, and reference to “Guiding Questions”, identify and define areas in need of improvement for
the following subgroup:
Anticipated Barrier
Strategy Person or Position Responsible for
Monitoring
Process Used to Determine Effectiveness of
Strategy
Evaluation Tool
5D. Student subgroups not making Adequate Yearly Progress (AYP) in reading
Reading Goal #5D:
5D.1. Increases in the number of students included in this subgroup due to continuing economic downturn.
5D.1 Continue to identify students for the purpose of progress monitoring and placement into reading if necessary. Assistance with material for students when needed.
5D.1 Teachers Dept. Chairs Administrators Guidance Reading Coach
5D.1 Progress Monitoring Common Assessments Various Formative Assessments
5D.1 End of Course Exams FCAT
To decrease the percentage of emotionally disadvantaged students below grade level in reading by a number to satisfy safe harbor status.
ED
2010 Current Level of Performance:*
2011 Expected Level of Performance*
60% scoring at or below grade level
Decrease the percentage below grade level to 57%.
5D.2. Mobility rates tend to increase among this population of students making it difficult for students to adjust to curriculum quickly.
5D.2 Accurate placement in courses and correctly indentifying students for possible progress monitoring.
5D.2. Reading Coach Teachers Guidance
5D.2. Progress Monitoring Common assessments
5D.2. End of Course Exams FCAT
2010-2011 School Improvement Plan (SIP)-Form SIP-1
June 2010 19 Rule 6A-1.099811 Revised May 28, 2010
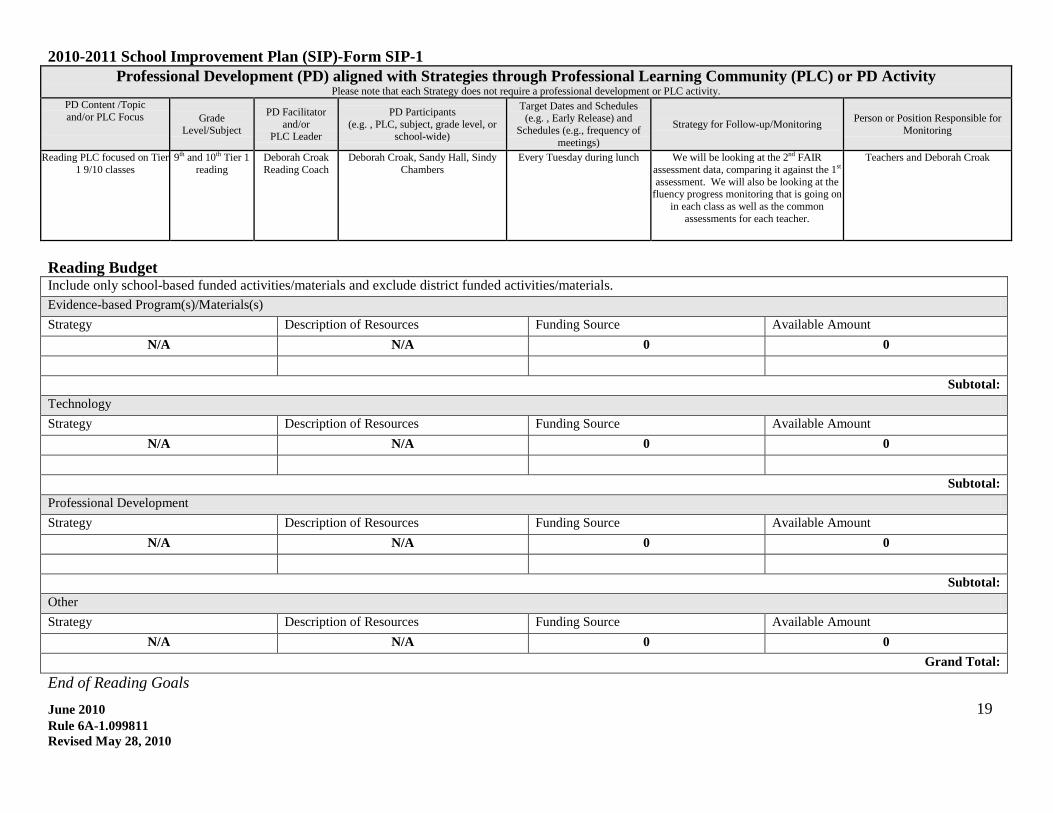
Professional Development (PD) aligned with Strategies through Professional Learning Community (PLC) or PD Activity Please note that each Strategy does not require a professional development or PLC activity.
PD Content /Topic and/or PLC Focus
Grade
Level/Subject
PD Facilitator and/or
PLC Leader
PD Participants (e.g. , PLC, subject, grade level, or
school-wide)
Target Dates and Schedules (e.g. , Early Release) and
Schedules (e.g., frequency of meetings)
Strategy for Follow-up/Monitoring Person or Position Responsible for Monitoring
Reading PLC focused on Tier 1 9/10 classes
9th and 10th Tier 1 reading
Deborah Croak Reading Coach
Deborah Croak, Sandy Hall, Sindy Chambers
Every Tuesday during lunch
We will be looking at the 2nd FAIR assessment data, comparing it against the 1st assessment. We will also be looking at the
fluency progress monitoring that is going on in each class as well as the common
assessments for each teacher.
Teachers and Deborah Croak
Reading Budget Include only school-based funded activities/materials and exclude district funded activities/materials. Evidence-based Program(s)/Materials(s) Strategy Description of Resources Funding Source Available Amount
N/A N/A 0 0
Subtotal: Technology Strategy Description of Resources Funding Source Available Amount
N/A N/A 0 0
Subtotal: Professional Development Strategy Description of Resources Funding Source Available Amount
N/A N/A 0 0
Subtotal: Other Strategy Description of Resources Funding Source Available Amount
N/A N/A 0 0 Grand Total:
End of Reading Goals
2010-2011 School Improvement Plan (SIP)-Form SIP-1
June 2010 20 Rule 6A-1.099811 Revised May 28, 2010
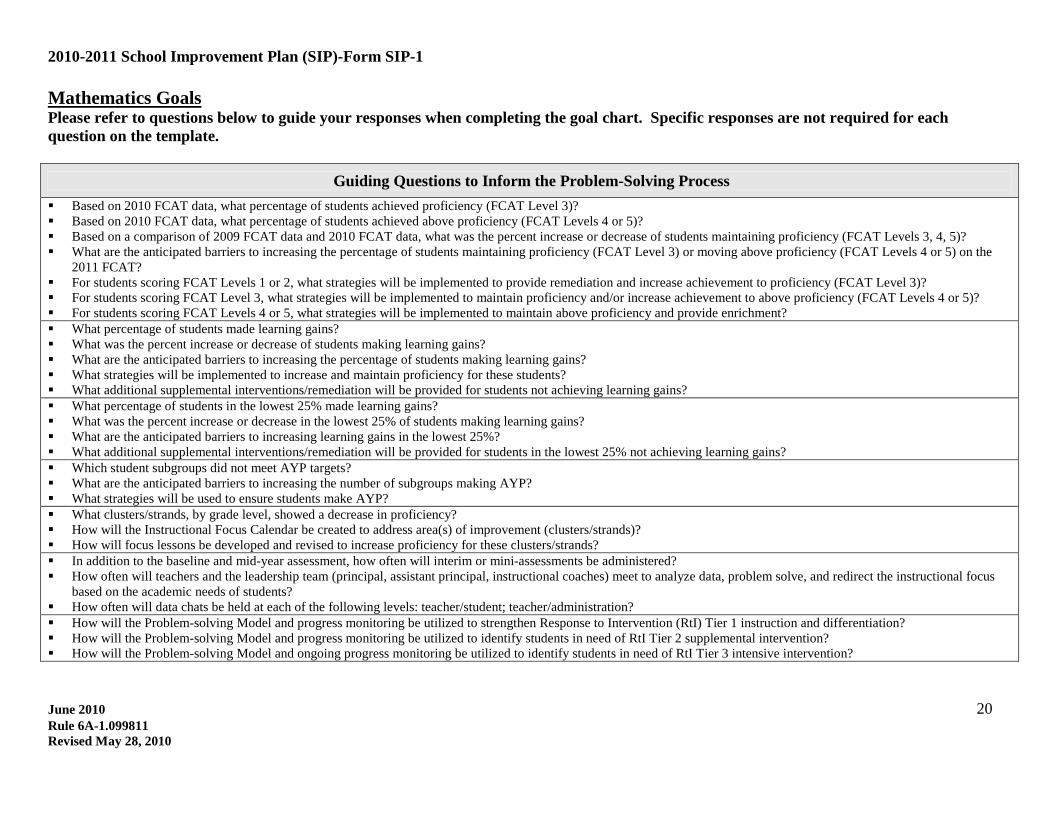
Please refer to questions below to guide your responses when completing the goal chart. Specific responses are not required for each question on the template.
Mathematics Goals
Guiding Questions to Inform the Problem-Solving Process
Based on 2010 FCAT data, what percentage of students achieved proficiency (FCAT Level 3)? Based on 2010 FCAT data, what percentage of students achieved above proficiency (FCAT Levels 4 or 5)? Based on a comparison of 2009 FCAT data and 2010 FCAT data, what was the percent increase or decrease of students maintaining proficiency (FCAT Levels 3, 4, 5)? What are the anticipated barriers to increasing the percentage of students maintaining proficiency (FCAT Level 3) or moving above proficiency (FCAT Levels 4 or 5) on the
2011 FCAT? For students scoring FCAT Levels 1 or 2, what strategies will be implemented to provide remediation and increase achievement to proficiency (FCAT Level 3)? For students scoring FCAT Level 3, what strategies will be implemented to maintain proficiency and/or increase achievement to above proficiency (FCAT Levels 4 or 5)? For students scoring FCAT Levels 4 or 5, what strategies will be implemented to maintain above proficiency and provide enrichment? What percentage of students made learning gains? What was the percent increase or decrease of students making learning gains? What are the anticipated barriers to increasing the percentage of students making learning gains? What strategies will be implemented to increase and maintain proficiency for these students? What additional supplemental interventions/remediation will be provided for students not achieving learning gains? What percentage of students in the lowest 25% made learning gains? What was the percent increase or decrease in the lowest 25% of students making learning gains? What are the anticipated barriers to increasing learning gains in the lowest 25%? What additional supplemental interventions/remediation will be provided for students in the lowest 25% not achieving learning gains? Which student subgroups did not meet AYP targets? What are the anticipated barriers to increasing the number of subgroups making AYP? What strategies will be used to ensure students make AYP? What clusters/strands, by grade level, showed a decrease in proficiency? How will the Instructional Focus Calendar be created to address area(s) of improvement (clusters/strands)? How will focus lessons be developed and revised to increase proficiency for these clusters/strands? In addition to the baseline and mid-year assessment, how often will interim or mini-assessments be administered? How often will teachers and the leadership team (principal, assistant principal, instructional coaches) meet to analyze data, problem solve, and redirect the instructional focus
based on the academic needs of students? How often will data chats be held at each of the following levels: teacher/student; teacher/administration? How will the Problem-solving Model and progress monitoring be utilized to strengthen Response to Intervention (RtI) Tier 1 instruction and differentiation? How will the Problem-solving Model and progress monitoring be utilized to identify students in need of RtI Tier 2 supplemental intervention? How will the Problem-solving Model and ongoing progress monitoring be utilized to identify students in need of RtI Tier 3 intensive intervention?
2010-2011 School Improvement Plan (SIP)-Form SIP-1
June 2010 21 Rule 6A-1.099811 Revised May 28, 2010
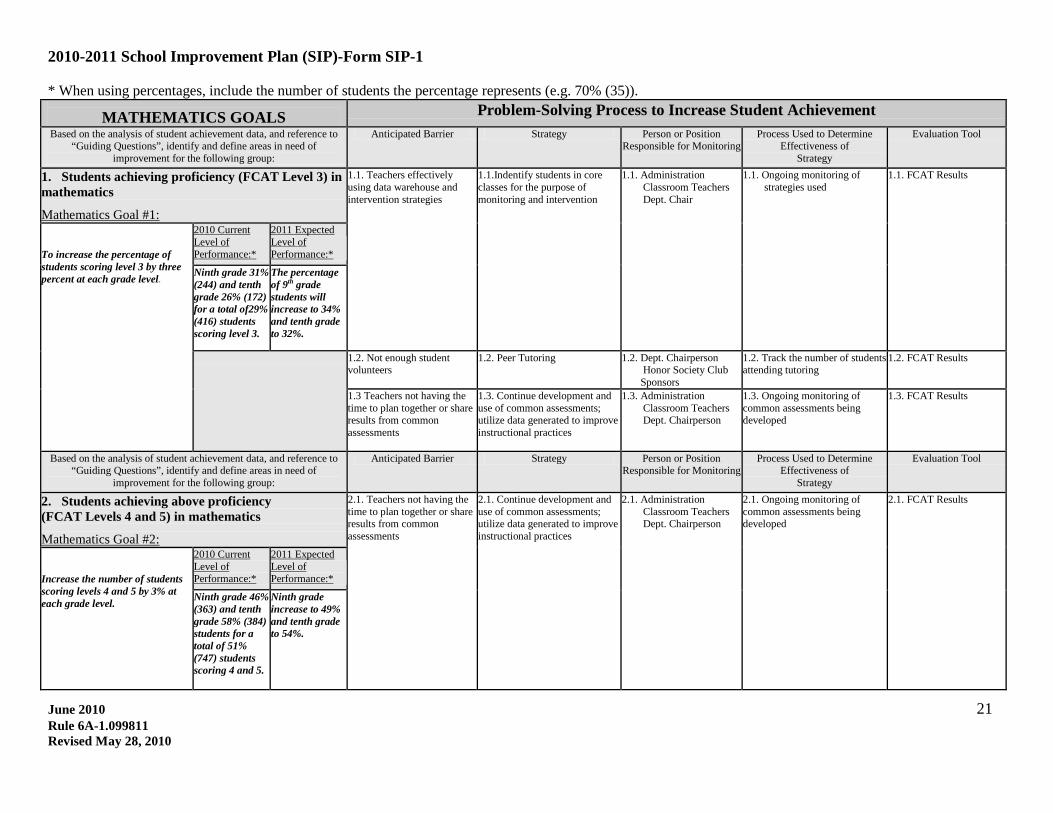
* When using percentages, include the number of students the percentage represents (e.g. 70% (35)).
MATHEMATICS GOALS Problem-Solving Process to Increase Student Achievement
Based on the analysis of student achievement data, and reference to “Guiding Questions”, identify and define areas in need of
improvement for the following group:
Anticipated Barrier Strategy Person or Position Responsible for Monitoring
Process Used to Determine Effectiveness of
Strategy
Evaluation Tool
1. Students achieving proficiency (FCAT Level 3) in mathematics
1.1. Teachers effectively using data warehouse and intervention strategies
Mathematics Goal #1:
1.1.Indentify students in core classes for the purpose of monitoring and intervention
1.1. Administration Classroom Teachers Dept. Chair
1.1. Ongoing monitoring of strategies used
1.1. FCAT Results
To increase the percentage of students scoring level 3 by three percent at each grade level.
2010 Current Level of Performance:*
2011 Expected Level of Performance:*
Ninth grade 31% (244) and tenth grade 26% (172) for a total of29% (416) students scoring level 3.
The percentage of 9th grade students will increase to 34% and tenth grade to 32%.
1.2. Not enough student volunteers
1.2. Peer Tutoring
1.2. Dept. Chairperson Honor Society Club Sponsors
1.2. Track the number of students attending tutoring
1.2. FCAT Results
1.3 Teachers not having the time to plan together or share results from common assessments
1.3. Continue development and use of common assessments; utilize data generated to improve instructional practices
1.3. Administration Classroom Teachers Dept. Chairperson
1.3. Ongoing monitoring of common assessments being developed
1.3. FCAT Results
Based on the analysis of student achievement data, and reference to “Guiding Questions”, identify and define areas in need of
improvement for the following group:
Anticipated Barrier Strategy Person or Position Responsible for Monitoring
Process Used to Determine Effectiveness of
Strategy
Evaluation Tool
2. Students achieving above proficiency (FCAT Levels 4 and 5) in mathematics
2.1. Teachers not having the time to plan together or share results from common assessments Mathematics Goal #2:
2.1. Continue development and use of common assessments; utilize data generated to improve instructional practices
2.1. Administration Classroom Teachers Dept. Chairperson
2.1. Ongoing monitoring of common assessments being developed
2.1. FCAT Results
Increase the number of students scoring levels 4 and 5 by 3% at each grade level.
2010 Current Level of Performance:*
2011 Expected Level of Performance:*
Ninth grade 46% (363) and tenth grade 58% (384) students for a total of 51% (747) students scoring 4 and 5.
Ninth grade increase to 49% and tenth grade to 54%.
2010-2011 School Improvement Plan (SIP)-Form SIP-1
June 2010 22 Rule 6A-1.099811 Revised May 28, 2010
Based on the analysis of student achievement data, and reference to “Guiding Questions”, identify and define areas in need of
improvement for the following group:
Anticipated Barrier Strategy Person or Position Responsible for Monitoring
Process Used to Determine Effectiveness of
Strategy
Evaluation Tool
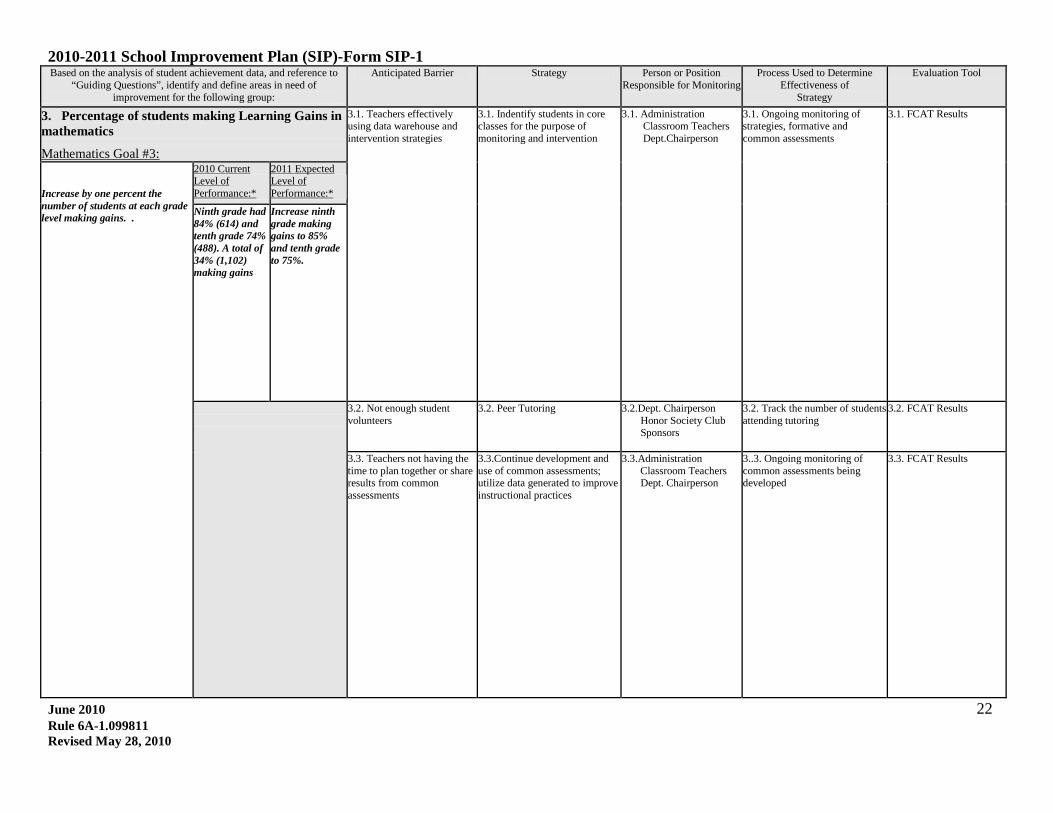
3. Percentage of students making Learning Gains in mathematics
3.1. Teachers effectively using data warehouse and intervention strategies
Mathematics Goal #3:
3.1. Indentify students in core classes for the purpose of monitoring and intervention
3.1. Administration Classroom Teachers Dept.Chairperson
3.1. Ongoing monitoring of strategies, formative and common assessments
3.1. FCAT Results
Increase by one percent the number of students at each grade level making gains. .
2010 Current Level of Performance:*
2011 Expected Level of Performance:*
Ninth grade had 84% (614) and tenth grade 74% (488). A total of 34% (1,102) making gains
Increase ninth grade making gains to 85% and tenth grade to 75%.
3.2. Not enough student volunteers
3.2. Peer Tutoring
3.2.Dept. Chairperson Honor Society Club Sponsors
3.2. Track the number of students attending tutoring
3.2. FCAT Results
3.3. Teachers not having the time to plan together or share results from common assessments
3.3.Continue development and use of common assessments; utilize data generated to improve instructional practices
3.3.Administration Classroom Teachers Dept. Chairperson
3..3. Ongoing monitoring of common assessments being developed
3.3. FCAT Results
2010-2011 School Improvement Plan (SIP)-Form SIP-1
June 2010 23 Rule 6A-1.099811 Revised May 28, 2010
Based on the analysis of student achievement data, and reference to
“Guiding Questions”, identify and define areas in need of improvement for the following group:
Anticipated Barrier Strategy Person or Position Responsible for Monitoring
Process Used to Determine Effectiveness of
Strategy
Evaluation Tool
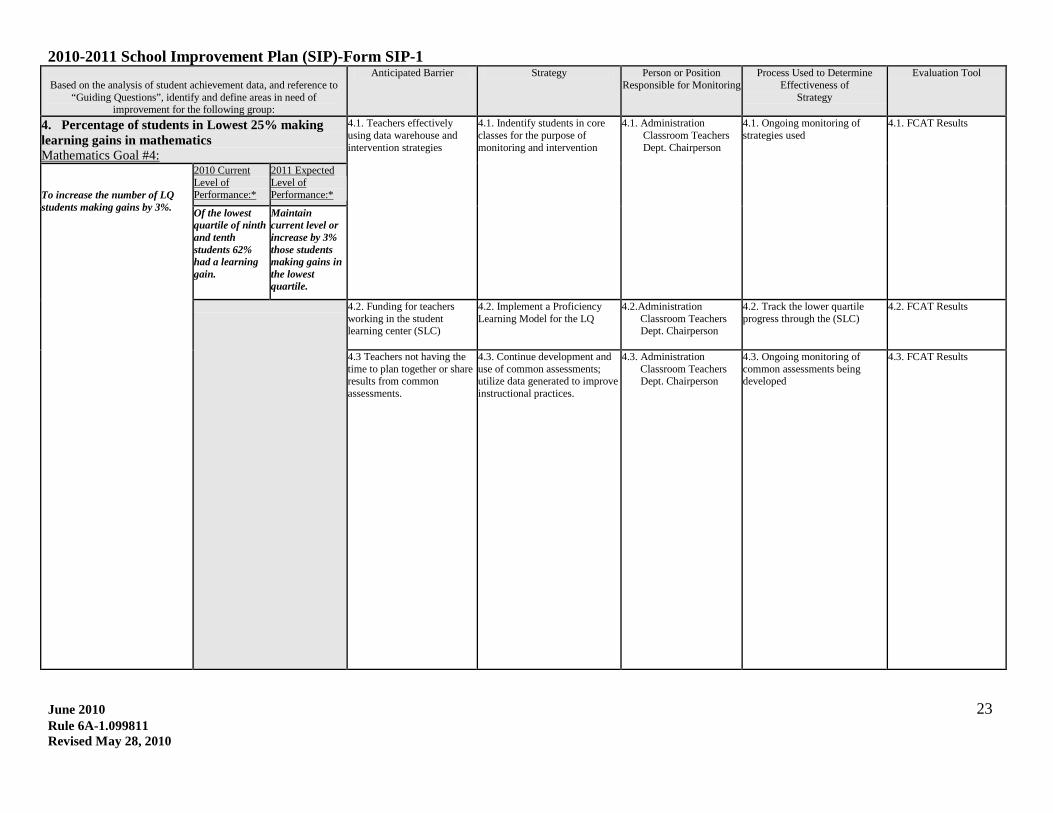
4. Percentage of students in Lowest 25% making learning gains in mathematics
4.1. Teachers effectively using data warehouse and intervention strategies Mathematics Goal #4:
4.1. Indentify students in core classes for the purpose of monitoring and intervention
4.1. Administration Classroom Teachers Dept. Chairperson
4.1. Ongoing monitoring of strategies used
4.1. FCAT Results
To increase the number of LQ students making gains by 3%.
2010 Current Level of Performance:*
2011 Expected Level of Performance:*
Of the lowest quartile of ninth and tenth students 62% had a learning gain.
Maintain current level or increase by 3% those students making gains in the lowest quartile.
4.2. Funding for teachers working in the student learning center (SLC)
4.2. Implement a Proficiency Learning Model for the LQ
4.2.Administration Classroom Teachers Dept. Chairperson
4.2. Track the lower quartile progress through the (SLC)
4.2. FCAT Results
4.3 Teachers not having the time to plan together or share results from common assessments.
4.3. Continue development and use of common assessments; utilize data generated to improve instructional practices.
4.3. Administration Classroom Teachers Dept. Chairperson
4.3. Ongoing monitoring of common assessments being developed
4.3. FCAT Results
2010-2011 School Improvement Plan (SIP)-Form SIP-1
June 2010 24 Rule 6A-1.099811 Revised May 28, 2010
Based on the analysis of student achievement data, and reference to “Guiding Questions”, identify and define areas in need of
improvement for the applicable subgroup(s):
Anticipated Barrier Strategy Person or Position Responsible for Monitoring
Process Used to Determine Effectiveness of
Strategy
Evaluation Tool
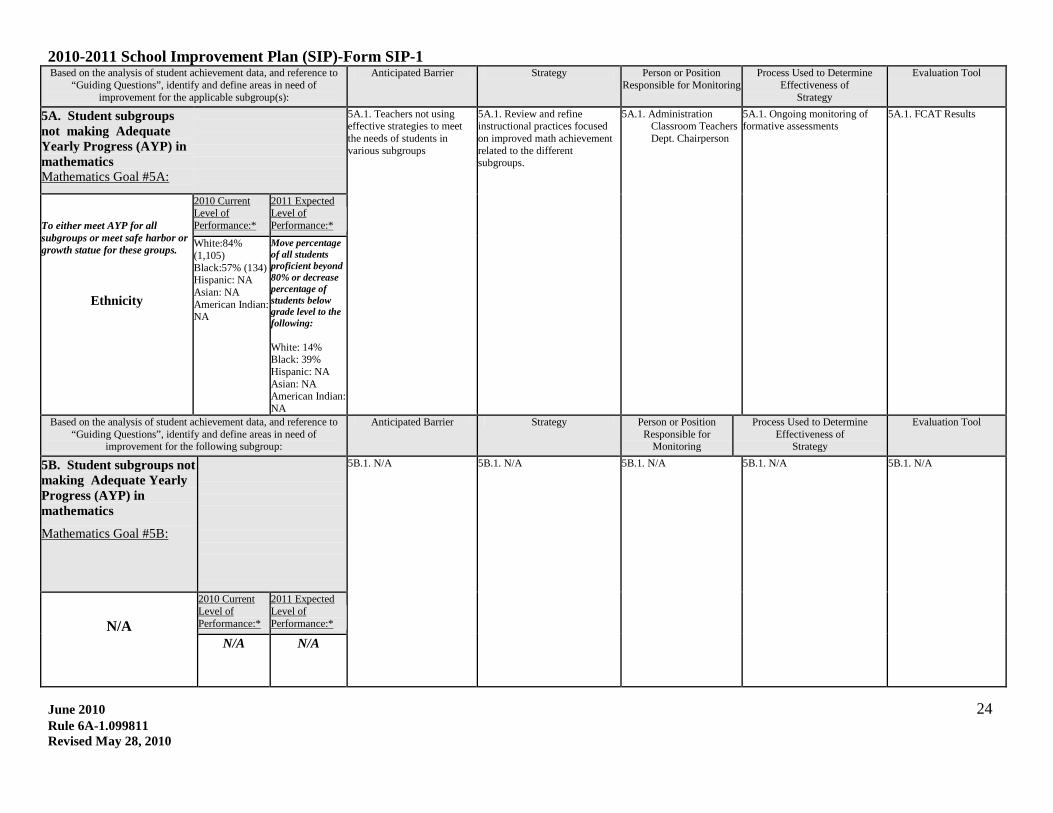
5A. Student subgroups not making Adequate Yearly Progress (AYP) in mathematics
Mathematics Goal #5A:
5A.1. Teachers not using effective strategies to meet the needs of students in various subgroups
5A.1. Review and refine instructional practices focused on improved math achievement related to the different subgroups.
5A.1. Administration Classroom Teachers Dept. Chairperson
5A.1. Ongoing monitoring of formative assessments
5A.1. FCAT Results
To either meet AYP for all subgroups or meet safe harbor or growth statue for these groups.
Ethnicity
2010 Current Level of Performance:*
2011 Expected Level of Performance:*
White:84% (1,105) Black:57% (134) Hispanic: NA Asian: NA American Indian: NA
Move percentage of all students proficient beyond 80% or decrease percentage of students below grade level to the following: White: 14% Black: 39% Hispanic: NA Asian: NA American Indian: NA
Based on the analysis of student achievement data, and reference to “Guiding Questions”, identify and define areas in need of
improvement for the following subgroup:
Anticipated Barrier Strategy Person or Position Responsible for
Monitoring
Process Used to Determine Effectiveness of
Strategy
Evaluation Tool
5B. Student subgroups not making Adequate Yearly Progress (AYP) in mathematics
Mathematics Goal #5B:
5B.1. N/A 5B.1. N/A 5B.1. N/A 5B.1. N/A 5B.1. N/A
N/A
2010 Current Level of Performance:*
2011 Expected Level of Performance:*
N/A N/A
2010-2011 School Improvement Plan (SIP)-Form SIP-1
June 2010 25 Rule 6A-1.099811 Revised May 28, 2010
Based on the analysis of student achievement data, and reference to “Guiding Questions”, identify and define areas in need of
improvement for the following subgroup:
Anticipated Barrier Strategy Person or Position Responsible for Monitoring
Process Used to Determine Effectiveness of
Strategy
Evaluation Tool
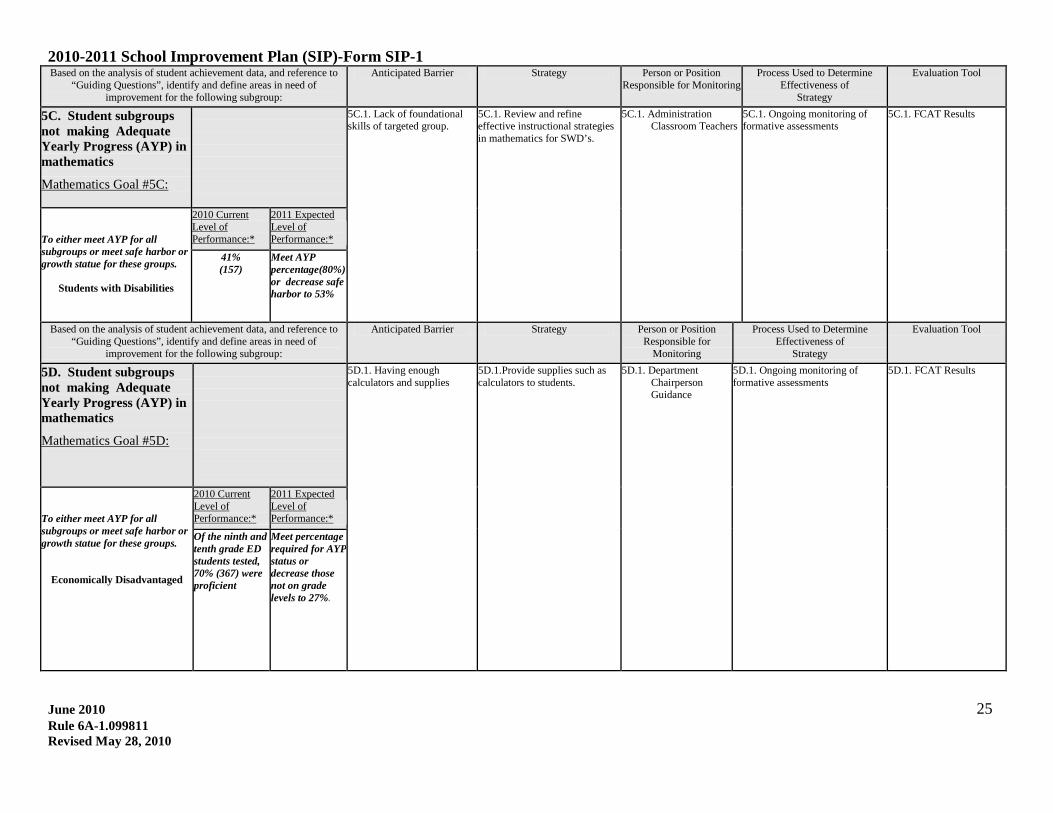
5C. Student subgroups not making Adequate Yearly Progress (AYP) in mathematics
Mathematics Goal #5C:
5C.1. Lack of foundational skills of targeted group.
5C.1. Review and refine effective instructional strategies in mathematics for SWD’s.
5C.1. Administration Classroom Teachers
5C.1. Ongoing monitoring of formative assessments
5C.1. FCAT Results
To either meet AYP for all subgroups or meet safe harbor or growth statue for these groups.
Students with Disabilities
2010 Current Level of Performance:*
2011 Expected Level of Performance:*
41% (157)
Meet AYP percentage(80%) or decrease safe harbor to 53%
Based on the analysis of student achievement data, and reference to “Guiding Questions”, identify and define areas in need of
improvement for the following subgroup:
Anticipated Barrier Strategy Person or Position Responsible for
Monitoring
Process Used to Determine Effectiveness of
Strategy
Evaluation Tool
5D. Student subgroups not making Adequate Yearly Progress (AYP) in mathematics
Mathematics Goal #5D:
5D.1. Having enough calculators and supplies
5D.1.Provide supplies such as calculators to students.
5D.1. Department Chairperson Guidance
5D.1. Ongoing monitoring of formative assessments
5D.1. FCAT Results
To either meet AYP for all subgroups or meet safe harbor or growth statue for these groups.
Economically Disadvantaged
2010 Current Level of Performance:*
2011 Expected Level of Performance:*
Of the ninth and tenth grade ED students tested, 70% (367) were proficient
Meet percentage required for AYP status or decrease those not on grade levels to 27%.
2010-2011 School Improvement Plan (SIP)-Form SIP-1
June 2010 26 Rule 6A-1.099811 Revised May 28, 2010
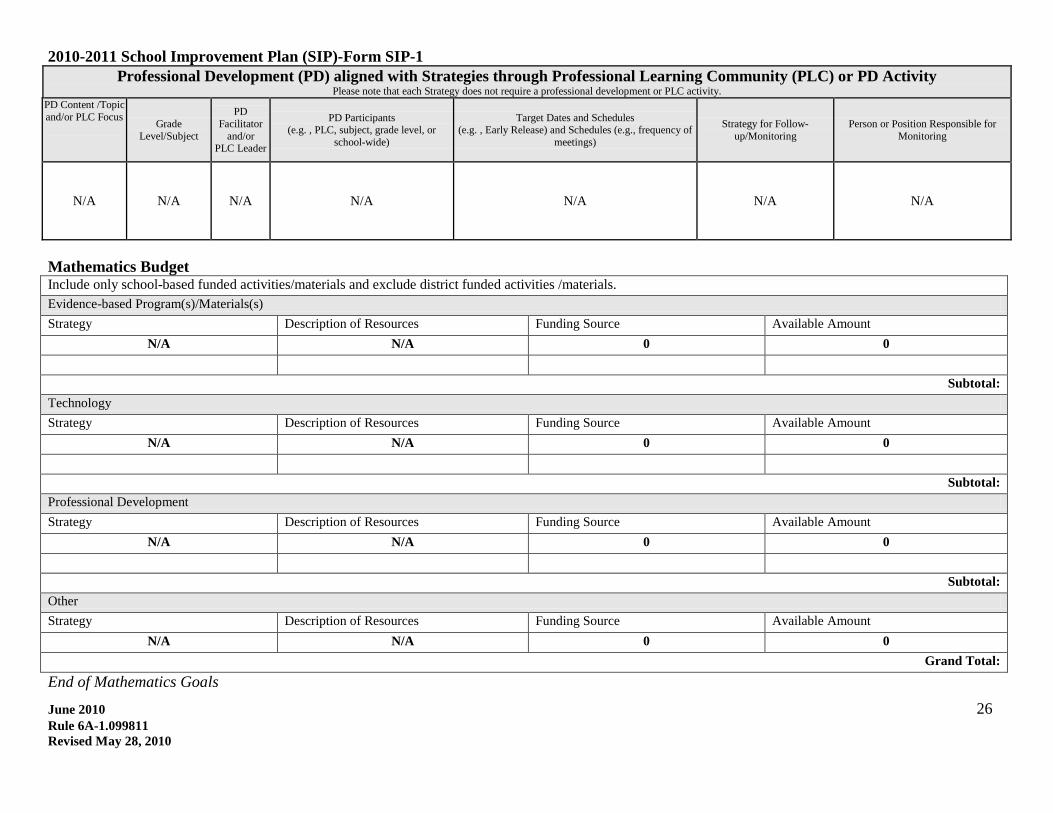
Professional Development (PD) aligned with Strategies through Professional Learning Community (PLC) or PD Activity Please note that each Strategy does not require a professional development or PLC activity.
PD Content /Topic and/or PLC Focus
Grade Level/Subject
PD Facilitator
and/or PLC Leader
PD Participants (e.g. , PLC, subject, grade level, or
school-wide)
Target Dates and Schedules (e.g. , Early Release) and Schedules (e.g., frequency of
meetings)
Strategy for Follow-up/Monitoring
Person or Position Responsible for Monitoring
N/A
N/A
N/A N/A N/A N/A N/A
Mathematics Budget Include only school-based funded activities/materials and exclude district funded activities /materials. Evidence-based Program(s)/Materials(s) Strategy Description of Resources Funding Source Available Amount
N/A N/A 0 0
Subtotal: Technology Strategy Description of Resources Funding Source Available Amount
N/A N/A 0 0
Subtotal: Professional Development Strategy Description of Resources Funding Source Available Amount
N/A N/A 0 0
Subtotal: Other Strategy Description of Resources Funding Source Available Amount
N/A N/A 0 0 Grand Total:
End of Mathematics Goals
2010-2011 School Improvement Plan (SIP)-Form SIP-1
June 2010 27 Rule 6A-1.099811 Revised May 28, 2010
Please refer to questions below to guide your responses when completing the goal chart. Specific responses are not required for each question on the template.
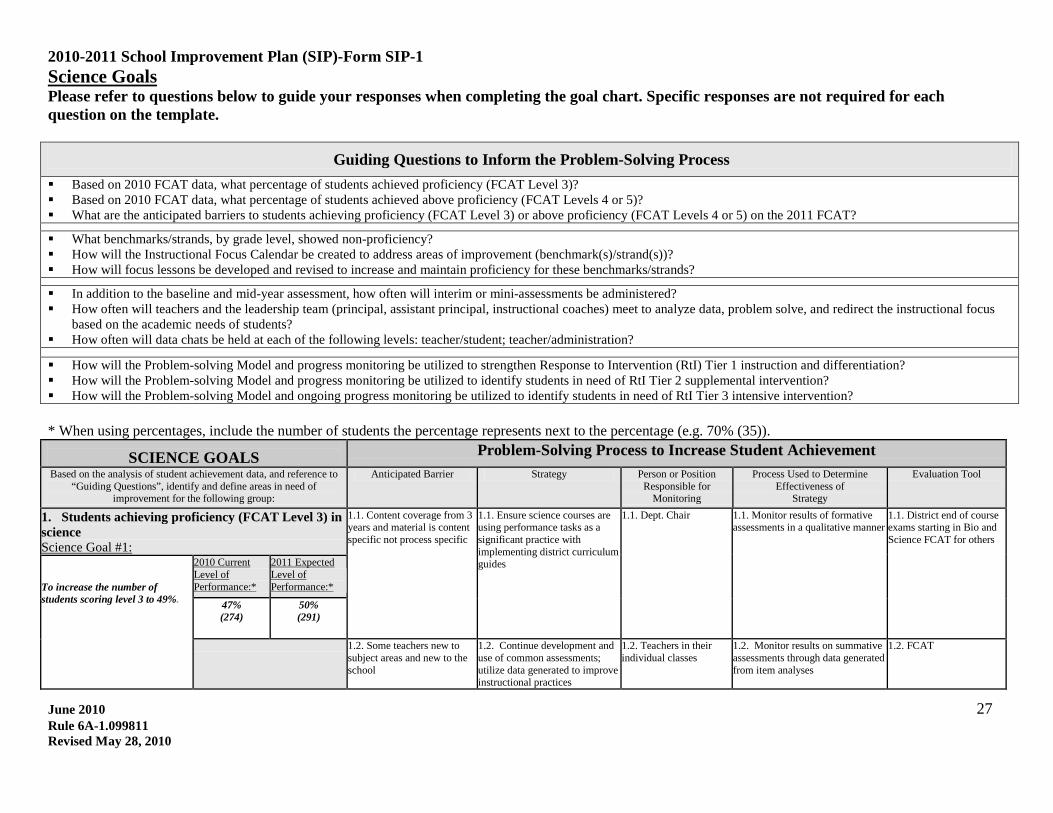
Science Goals
Guiding Questions to Inform the Problem-Solving Process
Based on 2010 FCAT data, what percentage of students achieved proficiency (FCAT Level 3)? Based on 2010 FCAT data, what percentage of students achieved above proficiency (FCAT Levels 4 or 5)? What are the anticipated barriers to students achieving proficiency (FCAT Level 3) or above proficiency (FCAT Levels 4 or 5) on the 2011 FCAT?
What benchmarks/strands, by grade level, showed non-proficiency? How will the Instructional Focus Calendar be created to address areas of improvement (benchmark(s)/strand(s))? How will focus lessons be developed and revised to increase and maintain proficiency for these benchmarks/strands?
In addition to the baseline and mid-year assessment, how often will interim or mini-assessments be administered? How often will teachers and the leadership team (principal, assistant principal, instructional coaches) meet to analyze data, problem solve, and redirect the instructional focus
based on the academic needs of students? How often will data chats be held at each of the following levels: teacher/student; teacher/administration?
How will the Problem-solving Model and progress monitoring be utilized to strengthen Response to Intervention (RtI) Tier 1 instruction and differentiation? How will the Problem-solving Model and progress monitoring be utilized to identify students in need of RtI Tier 2 supplemental intervention? How will the Problem-solving Model and ongoing progress monitoring be utilized to identify students in need of RtI Tier 3 intensive intervention? * When using percentages, include the number of students the percentage represents next to the percentage (e.g. 70% (35)).
SCIENCE GOALS Problem-Solving Process to Increase Student Achievement
Based on the analysis of student achievement data, and reference to “Guiding Questions”, identify and define areas in need of
improvement for the following group:
Anticipated Barrier Strategy Person or Position Responsible for
Monitoring
Process Used to Determine Effectiveness of
Strategy
Evaluation Tool
1. Students achieving proficiency (FCAT Level 3) in science
1.1. Content coverage from 3 years and material is content specific not process specific Science Goal #1:
1.1. Ensure science courses are using performance tasks as a significant practice with implementing district curriculum guides
1.1. Dept. Chair 1.1. Monitor results of formative assessments in a qualitative manner
1.1. District end of course exams starting in Bio and Science FCAT for others
To increase the number of students scoring level 3 to 49%.
2010 Current Level of Performance:*
2011 Expected Level of Performance:*
47% (274)
50% (291)
1.2. Some teachers new to subject areas and new to the school
1.2. Continue development and use of common assessments; utilize data generated to improve instructional practices
1.2. Teachers in their individual classes
1.2. Monitor results on summative assessments through data generated from item analyses
1.2. FCAT
2010-2011 School Improvement Plan (SIP)-Form SIP-1
June 2010 28 Rule 6A-1.099811 Revised May 28, 2010
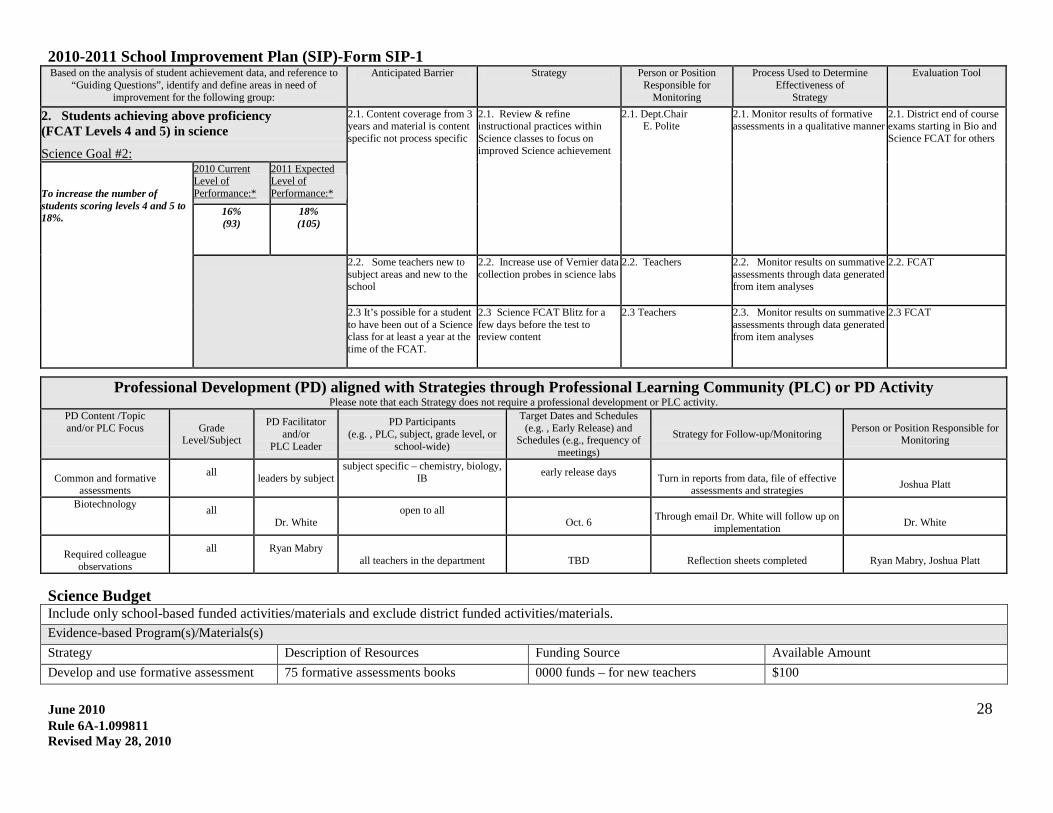
Professional Development (PD) aligned with Strategies through Professional Learning Community (PLC) or PD Activity Please note that each Strategy does not require a professional development or PLC activity.
PD Content /Topic and/or PLC Focus
Grade
Level/Subject
PD Facilitator and/or
PLC Leader
PD Participants (e.g. , PLC, subject, grade level, or
school-wide)
Target Dates and Schedules (e.g. , Early Release) and
Schedules (e.g., frequency of meetings)
Strategy for Follow-up/Monitoring Person or Position Responsible for Monitoring
Common and formative
assessments
all leaders by subject
subject specific – chemistry, biology, IB
early release days
Turn in reports from data, file of effective
assessments and strategies
Joshua Platt
Biotechnology all
Dr. White open to all
Oct. 6
Through email Dr. White will follow up on
implementation
Dr. White
Required colleague
observations
all
Ryan Mabry
all teachers in the department
TBD
Reflection sheets completed
Ryan Mabry, Joshua Platt
Science Budget Include only school-based funded activities/materials and exclude district funded activities/materials. Evidence-based Program(s)/Materials(s) Strategy Description of Resources Funding Source Available Amount Develop and use formative assessment 75 formative assessments books 0000 funds – for new teachers $100
Based on the analysis of student achievement data, and reference to “Guiding Questions”, identify and define areas in need of
improvement for the following group:
Anticipated Barrier Strategy Person or Position Responsible for
Monitoring
Process Used to Determine Effectiveness of
Strategy
Evaluation Tool
2. Students achieving above proficiency (FCAT Levels 4 and 5) in science
2.1. Content coverage from 3 years and material is content specific not process specific
Science Goal #2:
2.1. Review & refine instructional practices within Science classes to focus on improved Science achievement
2.1. Dept.Chair E. Polite
2.1. Monitor results of formative assessments in a qualitative manner
2.1. District end of course exams starting in Bio and Science FCAT for others
To increase the number of students scoring levels 4 and 5 to 18%.
2010 Current Level of Performance:*
2011 Expected Level of Performance:*
16% (93)
18% (105)
2.2. Some teachers new to subject areas and new to the school
2.2. Increase use of Vernier data collection probes in science labs
2.2. Teachers 2.2. Monitor results on summative assessments through data generated from item analyses
2.2. FCAT
2.3 It’s possible for a student to have been out of a Science class for at least a year at the time of the FCAT.
2.3 Science FCAT Blitz for a few days before the test to review content
2.3 Teachers 2.3. Monitor results on summative assessments through data generated from item analyses
2.3 FCAT
2010-2011 School Improvement Plan (SIP)-Form SIP-1
June 2010 29 Rule 6A-1.099811 Revised May 28, 2010
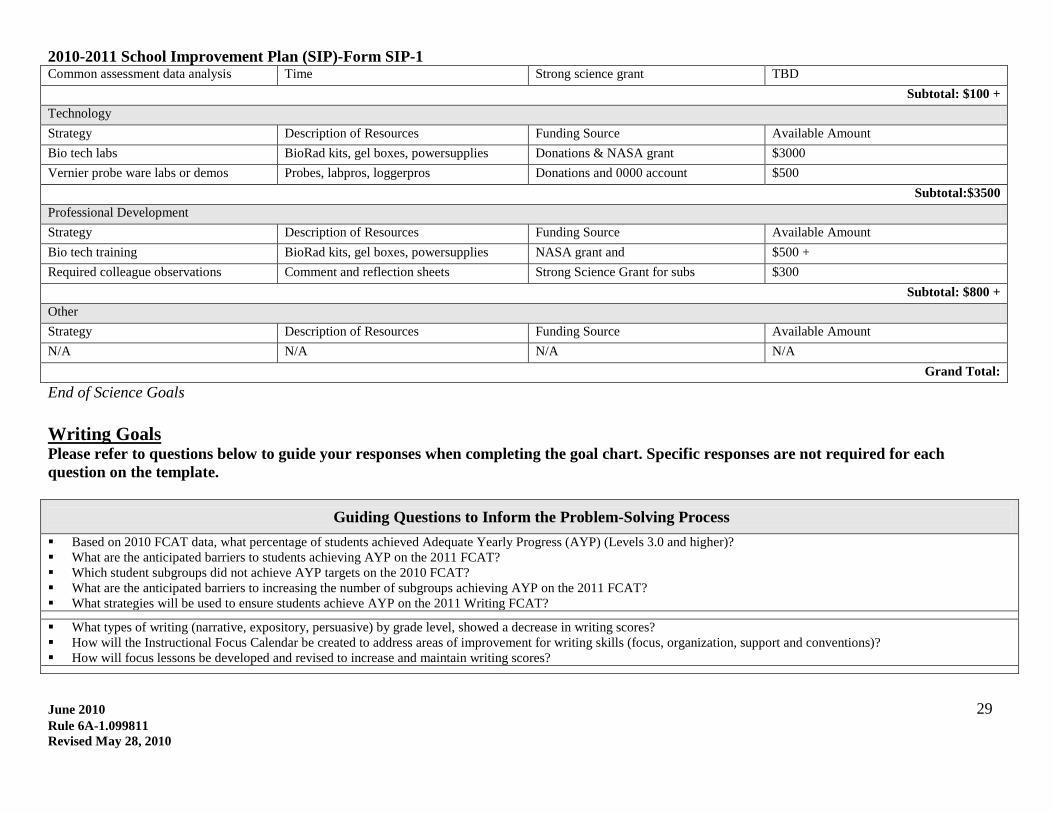
Common assessment data analysis Time Strong science grant TBD Subtotal: $100 +
Technology Strategy Description of Resources Funding Source Available Amount Bio tech labs BioRad kits, gel boxes, powersupplies Donations & NASA grant $3000 Vernier probe ware labs or demos Probes, labpros, loggerpros Donations and 0000 account $500
Subtotal:$3500 Professional Development Strategy Description of Resources Funding Source Available Amount Bio tech training BioRad kits, gel boxes, powersupplies NASA grant and $500 + Required colleague observations Comment and reflection sheets Strong Science Grant for subs $300
Subtotal: $800 + Other Strategy Description of Resources Funding Source Available Amount N/A N/A N/A N/A
Grand Total: End of Science Goals
Please refer to questions below to guide your responses when completing the goal chart. Specific responses are not required for each question on the template.
Writing Goals
Guiding Questions to Inform the Problem-Solving Process
Based on 2010 FCAT data, what percentage of students achieved Adequate Yearly Progress (AYP) (Levels 3.0 and higher)? What are the anticipated barriers to students achieving AYP on the 2011 FCAT? Which student subgroups did not achieve AYP targets on the 2010 FCAT? What are the anticipated barriers to increasing the number of subgroups achieving AYP on the 2011 FCAT? What strategies will be used to ensure students achieve AYP on the 2011 Writing FCAT?
What types of writing (narrative, expository, persuasive) by grade level, showed a decrease in writing scores? How will the Instructional Focus Calendar be created to address areas of improvement for writing skills (focus, organization, support and conventions)? How will focus lessons be developed and revised to increase and maintain writing scores?
2010-2011 School Improvement Plan (SIP)-Form SIP-1
June 2010 30 Rule 6A-1.099811 Revised May 28, 2010
In addition to the baseline and mid-year assessment, how often will interim or mini-assessments be administered? How often will teachers and the leadership team (principal, assistant principal, instructional coaches) meet to analyze data, problem solve, and redirect the instructional focus
based on the academic needs of students? How often will data chats be held at each of the following levels: teacher/student; teacher/administration?
How will the Problem-solving Model and progress monitoring be utilized to strengthen Response to Intervention (RtI) Tier 1 instruction and differentiation? How will the Problem-solving Model and progress monitoring be utilized to identify students in need of RtI Tier 2 supplemental intervention? How will the Problem-solving Model and ongoing progress monitoring be utilized to identify students in need of RtI Tier 3 intensive intervention? * When using percentages, include the number of students the percentage represents next to the percentage (e.g. 70% (35)).
WRITING GOALS Problem-Solving Process to Increase Student Achievement
Based on the analysis of student achievement data, and reference to “Guiding Questions”, identify and define areas in need of improvement for the following group:
Anticipated Barrier Strategy Person or Position Responsible for
Monitoring
Process Used to Determine Effectiveness of
Strategy
Evaluation Tool
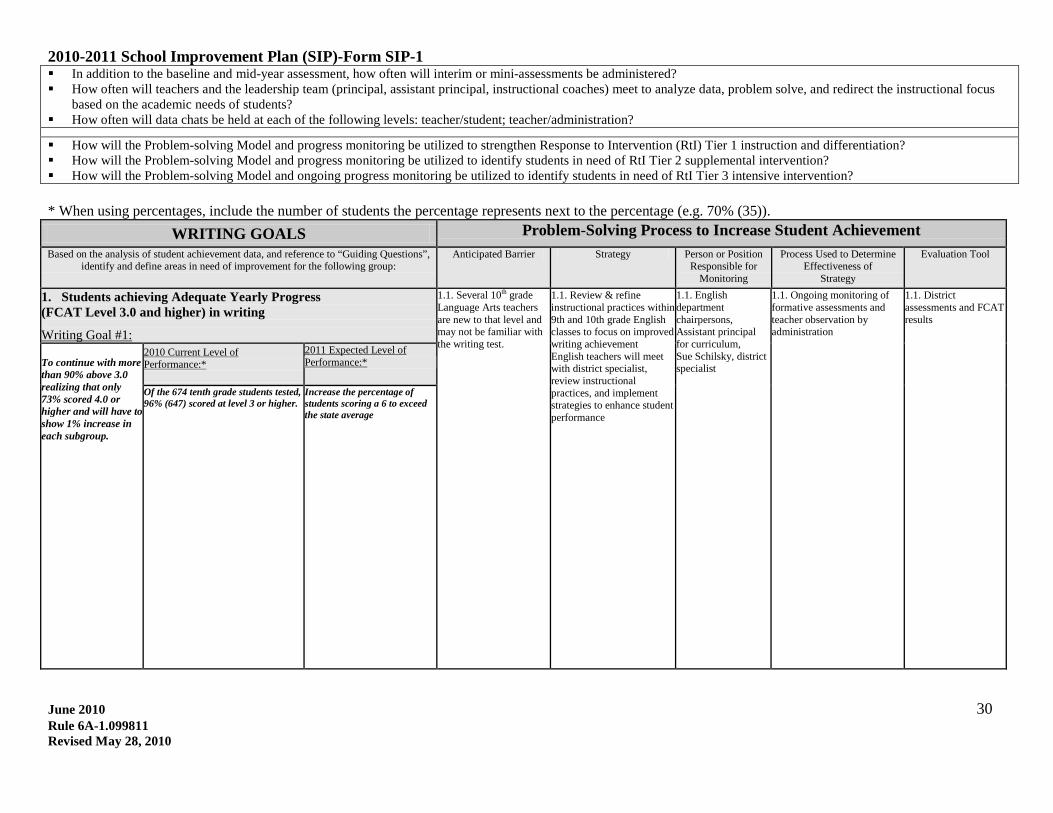
1. Students achieving Adequate Yearly Progress (FCAT Level 3.0 and higher) in writing
1.1. Several 10th grade Language Arts teachers are new to that level and may not be familiar with the writing test.
Writing Goal #1:
1.1. Review & refine instructional practices within 9th and 10th grade English classes to focus on improved writing achievement English teachers will meet with district specialist, review instructional practices, and implement strategies to enhance student performance
1.1. English department chairpersons, Assistant principal for curriculum, Sue Schilsky, district specialist
1.1. Ongoing monitoring of formative assessments and teacher observation by administration
1.1. District assessments and FCAT results
To continue with more than 90% above 3.0 realizing that only 73% scored 4.0 or higher and will have to show 1% increase in each subgroup.
2010 Current Level of Performance:*
2011 Expected Level of Performance:*
Of the 674 tenth grade students tested, 96% (647) scored at level 3 or higher.
Increase the percentage of students scoring a 6 to exceed the state average
2010-2011 School Improvement Plan (SIP)-Form SIP-1
June 2010 31 Rule 6A-1.099811 Revised May 28, 2010
Based on the analysis of student achievement data, and reference to “Guiding Questions”, identify and define areas in need of improvement for the following group:
Anticipated Barrier Strategy Person or Position Responsible for
Monitoring
Process Used to Determine Effectiveness of
Strategy
Evaluation Tool
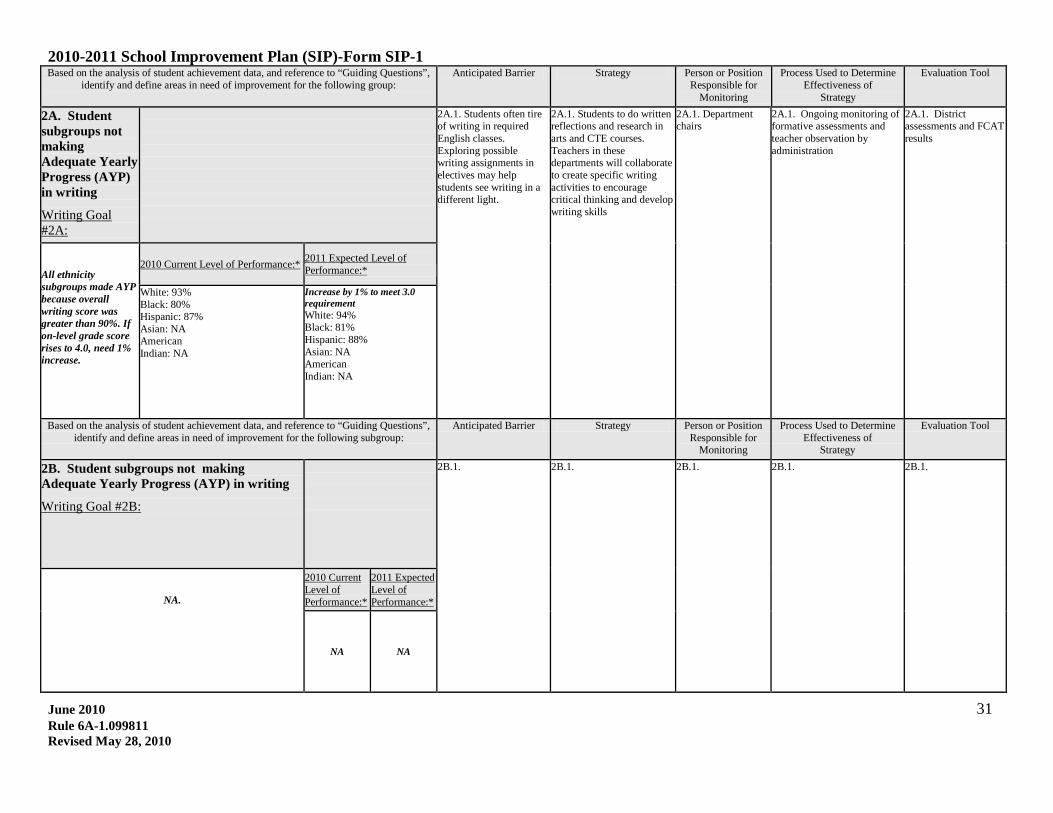
2A. Student subgroups not making Adequate Yearly Progress (AYP) in writing
Writing Goal #2A:
2A.1. Students often tire of writing in required English classes. Exploring possible writing assignments in electives may help students see writing in a different light.
2A.1. Students to do written reflections and research in arts and CTE courses. Teachers in these departments will collaborate to create specific writing activities to encourage critical thinking and develop writing skills
2A.1. Department chairs
2A.1. Ongoing monitoring of formative assessments and teacher observation by administration
2A.1. District assessments and FCAT results
All ethnicity subgroups made AYP because overall writing score was greater than 90%. If on-level grade score rises to 4.0, need 1% increase.
2010 Current Level of Performance:* 2011 Expected Level of Performance:*
White: 93% Black: 80% Hispanic: 87% Asian: NA American Indian: NA
Increase by 1% to meet 3.0 requirement White: 94% Black: 81% Hispanic: 88% Asian: NA American Indian: NA
Based on the analysis of student achievement data, and reference to “Guiding Questions”, identify and define areas in need of improvement for the following subgroup:
Anticipated Barrier Strategy Person or Position Responsible for
Monitoring
Process Used to Determine Effectiveness of
Strategy
Evaluation Tool
2B. Student subgroups not making Adequate Yearly Progress (AYP) in writing
Writing Goal #2B:
2B.1. 2B.1. 2B.1. 2B.1. 2B.1.
NA.
2010 Current Level of Performance:*
2011 Expected Level of Performance:*
NA NA
2010-2011 School Improvement Plan (SIP)-Form SIP-1
June 2010 32 Rule 6A-1.099811 Revised May 28, 2010
Professional Development (PD) aligned with Strategies through Professional Learning Community (PLC) or PD Activity
Please note that each Strategy does not require a professional development or PLC activity. PD Content /Topic and/or PLC Focus
Grade
Level/Subject
PD Facilitator and/or
PLC Leader
PD Participants (e.g. , PLC, subject, grade level, or
school-wide)
Target Dates and Schedules (e.g. , Early Release) and
Schedules (e.g., frequency of meetings)
Strategy for Follow-up/Monitoring Person or Position Responsible for Monitoring
N/A
N/A
N/A
N/A
N/A
N/A
N/A
Based on the analysis of student achievement data, and reference to “Guiding Questions”, identify and define areas in need of improvement for the following subgroup:
Anticipated Barrier Strategy Person or Position Responsible for
Monitoring
Process Used to Determine Effectiveness of
Strategy
Evaluation Tool
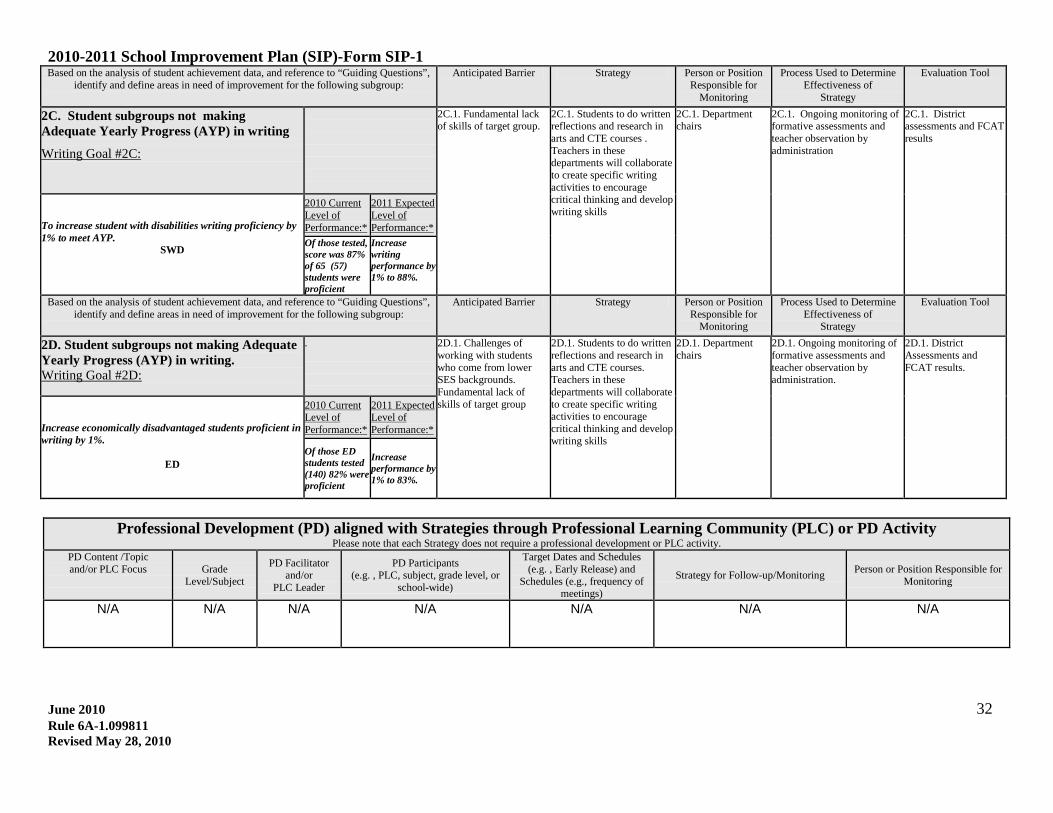
2C. Student subgroups not making Adequate Yearly Progress (AYP) in writing
Writing Goal #2C:
2C.1. Fundamental lack of skills of target group.
2C.1. Students to do written reflections and research in arts and CTE courses . Teachers in these departments will collaborate to create specific writing activities to encourage critical thinking and develop writing skills
2C.1. Department chairs
2C.1. Ongoing monitoring of formative assessments and teacher observation by administration
2C.1. District assessments and FCAT results
To increase student with disabilities writing proficiency by 1% to meet AYP.
SWD
2010 Current Level of Performance:*
2011 Expected Level of Performance:*
Of those tested, score was 87% of 65 (57) students were proficient
Increase writing performance by 1% to 88%.
Based on the analysis of student achievement data, and reference to “Guiding Questions”, identify and define areas in need of improvement for the following subgroup:
Anticipated Barrier Strategy Person or Position Responsible for
Monitoring
Process Used to Determine Effectiveness of
Strategy
Evaluation Tool
2D. Student subgroups not making Adequate Yearly Progress (AYP) in writing.
.
Writing Goal #2D:
2D.1. Challenges of working with students who come from lower SES backgrounds. Fundamental lack of skills of target group
2D.1. Students to do written reflections and research in arts and CTE courses. Teachers in these departments will collaborate to create specific writing activities to encourage critical thinking and develop writing skills
2D.1. Department chairs
2D.1. Ongoing monitoring of formative assessments and teacher observation by administration.
2D.1. District Assessments and FCAT results.
Increase economically disadvantaged students proficient in writing by 1%.
ED
2010 Current Level of Performance:*
2011 Expected Level of Performance:*
Of those ED students tested (140) 82% were proficient
Increase performance by 1% to 83%.
2010-2011 School Improvement Plan (SIP)-Form SIP-1
June 2010 33 Rule 6A-1.099811 Revised May 28, 2010
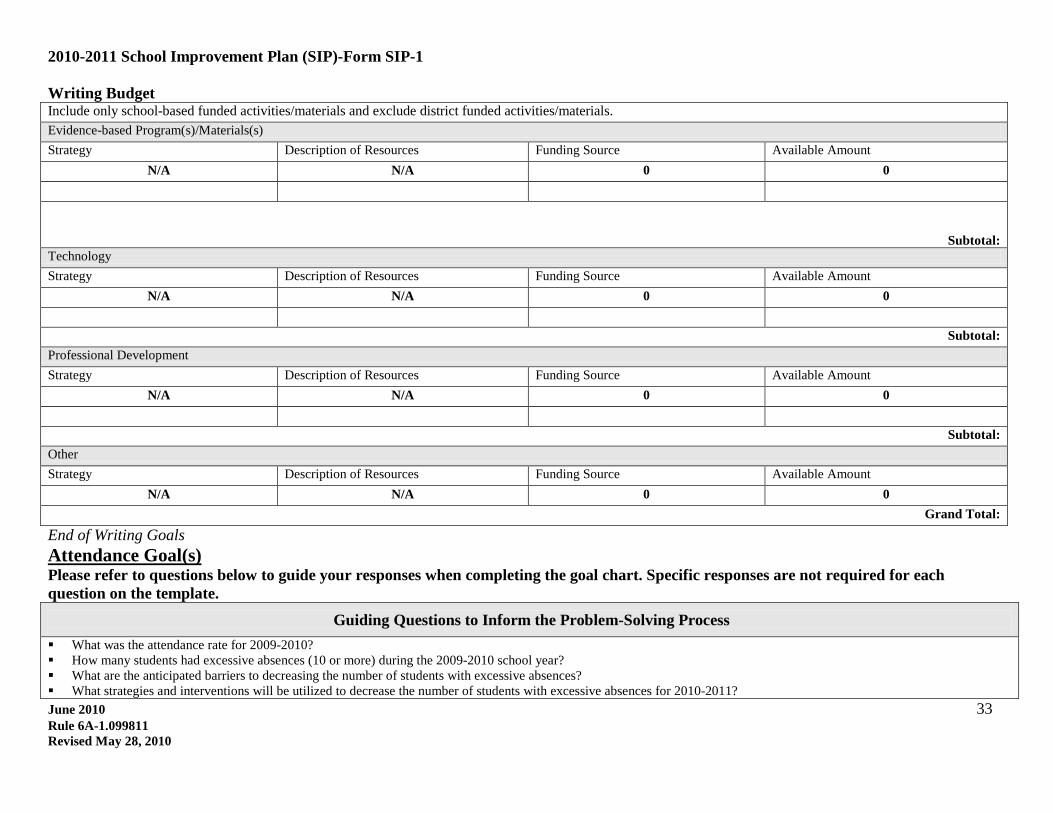
Writing Budget Include only school-based funded activities/materials and exclude district funded activities/materials. Evidence-based Program(s)/Materials(s) Strategy Description of Resources Funding Source Available Amount
N/A N/A 0 0
Subtotal: Technology Strategy Description of Resources Funding Source Available Amount
N/A N/A 0 0
Subtotal: Professional Development Strategy Description of Resources Funding Source Available Amount
N/A N/A 0 0
Subtotal: Other Strategy Description of Resources Funding Source Available Amount
N/A N/A 0 0 Grand Total:
End of Writing Goals
Please refer to questions below to guide your responses when completing the goal chart. Specific responses are not required for each question on the template.
Attendance Goal(s)
Guiding Questions to Inform the Problem-Solving Process
What was the attendance rate for 2009-2010? How many students had excessive absences (10 or more) during the 2009-2010 school year? What are the anticipated barriers to decreasing the number of students with excessive absences? What strategies and interventions will be utilized to decrease the number of students with excessive absences for 2010-2011?
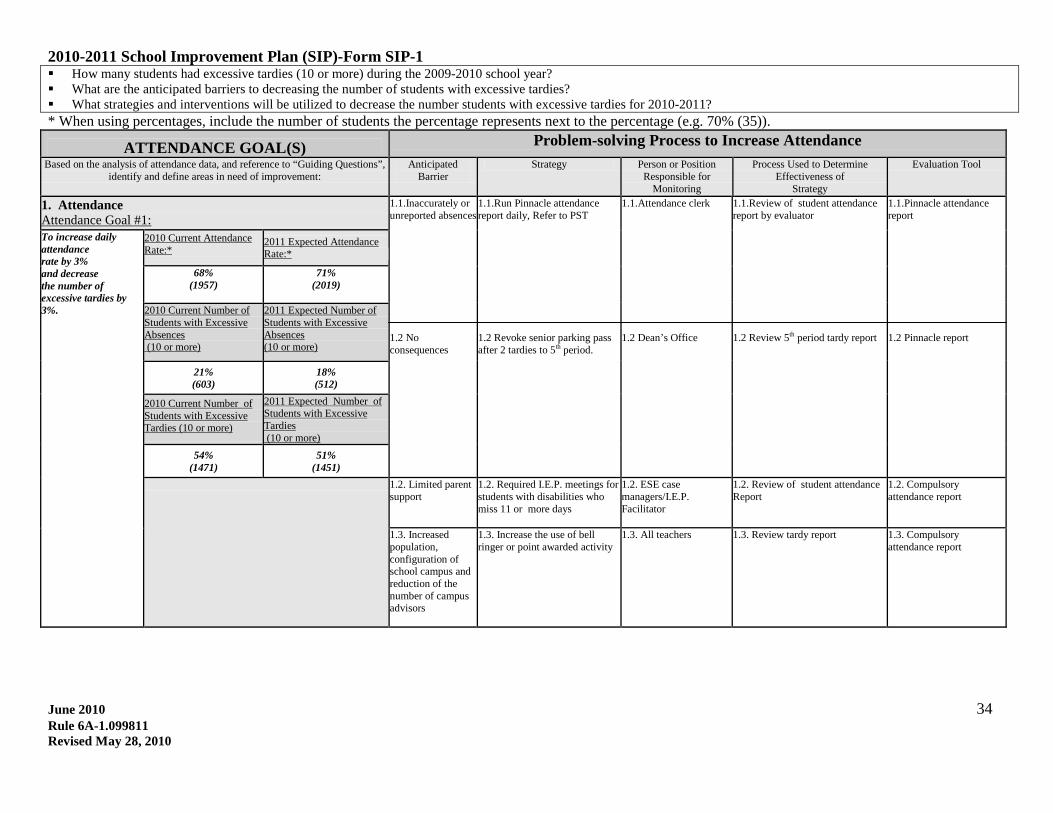
2010-2011 School Improvement Plan (SIP)-Form SIP-1
June 2010 34 Rule 6A-1.099811 Revised May 28, 2010
How many students had excessive tardies (10 or more) during the 2009-2010 school year? What are the anticipated barriers to decreasing the number of students with excessive tardies? What strategies and interventions will be utilized to decrease the number students with excessive tardies for 2010-2011? * When using percentages, include the number of students the percentage represents next to the percentage (e.g. 70% (35)).
ATTENDANCE GOAL(S) Problem-solving Process to Increase Attendance
Based on the analysis of attendance data, and reference to “Guiding Questions”, identify and define areas in need of improvement:
Anticipated Barrier
Strategy Person or Position Responsible for
Monitoring
Process Used to Determine Effectiveness of
Strategy
Evaluation Tool
1. Attendance 1.1.Inaccurately or unreported absences Attendance Goal #1: 1.2 No consequences
1.1.Run Pinnacle attendance report daily, Refer to PST 1.2 Revoke senior parking pass after 2 tardies to 5th period.
1.1.Attendance clerk 1.2 Dean’s Office
1.1.Review of student attendance report by evaluator 1.2 Review 5th period tardy report
1.1.Pinnacle attendance report 1.2 Pinnacle report
To increase daily attendance rate by 3% and decrease the number of excessive tardies by 3%.
2010 Current Attendance Rate:*
2011 Expected Attendance Rate:*
68% (1957)
71% (2019)
2010 Current Number of Students with Excessive Absences
(10 or more)
2011 Expected Number of Students with Excessive Absences (10 or more)
21% (603)
18% (512)
2010 Current Number of Students with Excessive Tardies (10 or more)
2011 Expected Number of Students with Excessive Tardies (10 or more)
54% (1471)
51% (1451)
1.2. Limited parent support
1.2. Required I.E.P. meetings for students with disabilities who miss 11 or more days
1.2. ESE case managers/I.E.P. Facilitator
1.2. Review of student attendance Report
1.2. Compulsory attendance report
1.3. Increased population, configuration of school campus and reduction of the number of campus advisors
1.3. Increase the use of bell ringer or point awarded activity
1.3. All teachers
1.3. Review tardy report
1.3. Compulsory attendance report
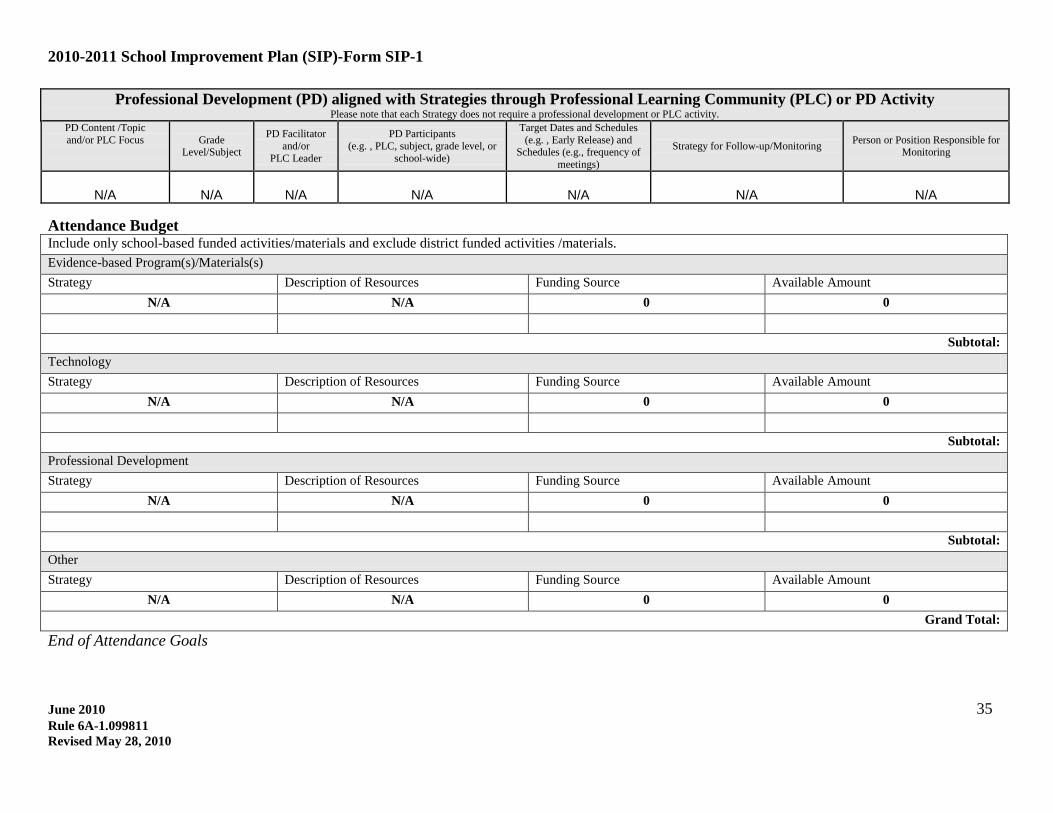
2010-2011 School Improvement Plan (SIP)-Form SIP-1
June 2010 35 Rule 6A-1.099811 Revised May 28, 2010
Professional Development (PD) aligned with Strategies through Professional Learning Community (PLC) or PD Activity Please note that each Strategy does not require a professional development or PLC activity.
PD Content /Topic and/or PLC Focus
Grade
Level/Subject
PD Facilitator and/or
PLC Leader
PD Participants (e.g. , PLC, subject, grade level, or
school-wide)
Target Dates and Schedules (e.g. , Early Release) and
Schedules (e.g., frequency of meetings)
Strategy for Follow-up/Monitoring Person or Position Responsible for Monitoring
N/A
N/A
N/A
N/A
N/A
N/A
N/A
Attendance Budget Include only school-based funded activities/materials and exclude district funded activities /materials. Evidence-based Program(s)/Materials(s) Strategy Description of Resources Funding Source Available Amount
N/A N/A 0 0
Subtotal: Technology Strategy Description of Resources Funding Source Available Amount
N/A N/A 0 0
Subtotal: Professional Development Strategy Description of Resources Funding Source Available Amount
N/A N/A 0 0
Subtotal: Other Strategy Description of Resources Funding Source Available Amount
N/A N/A 0 0 Grand Total:
End of Attendance Goals
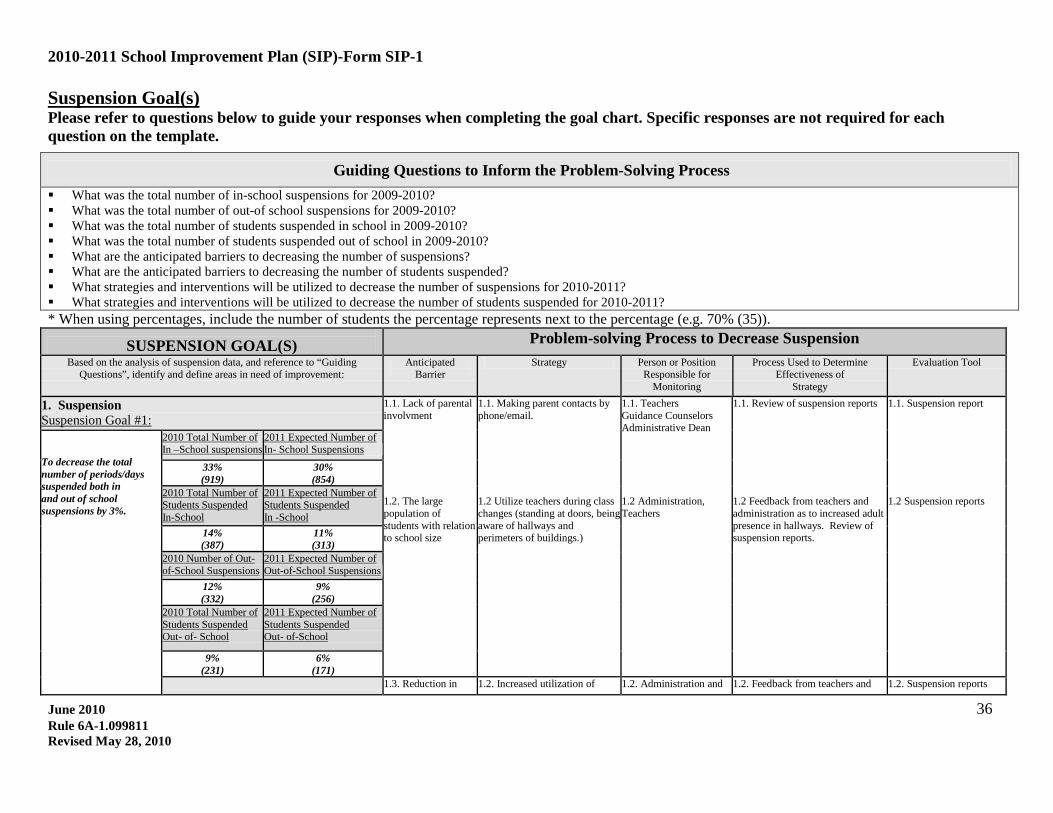
2010-2011 School Improvement Plan (SIP)-Form SIP-1
June 2010 36 Rule 6A-1.099811 Revised May 28, 2010
Please refer to questions below to guide your responses when completing the goal chart. Specific responses are not required for each question on the template.
Suspension Goal(s)
Guiding Questions to Inform the Problem-Solving Process
What was the total number of in-school suspensions for 2009-2010? What was the total number of out-of school suspensions for 2009-2010? What was the total number of students suspended in school in 2009-2010? What was the total number of students suspended out of school in 2009-2010? What are the anticipated barriers to decreasing the number of suspensions? What are the anticipated barriers to decreasing the number of students suspended? What strategies and interventions will be utilized to decrease the number of suspensions for 2010-2011? What strategies and interventions will be utilized to decrease the number of students suspended for 2010-2011? * When using percentages, include the number of students the percentage represents next to the percentage (e.g. 70% (35)).
SUSPENSION GOAL(S) Problem-solving Process to Decrease Suspension
Based on the analysis of suspension data, and reference to “Guiding Questions”, identify and define areas in need of improvement:
Anticipated Barrier
Strategy Person or Position Responsible for
Monitoring
Process Used to Determine Effectiveness of
Strategy
Evaluation Tool
1. Suspension 1.1. Lack of parental involvment Suspension Goal #1: 1.2. The large population of students with relation to school size
1.1. Making parent contacts by phone/email. 1.2 Utilize teachers during class changes (standing at doors, being aware of hallways and perimeters of buildings.)
1.1. Teachers Guidance Counselors Administrative Dean 1.2 Administration, Teachers
1.1. Review of suspension reports 1.2 Feedback from teachers and administration as to increased adult presence in hallways. Review of suspension reports.
1.1. Suspension report 1.2 Suspension reports
To decrease the total number of periods/days suspended both in and out of school suspensions by 3%.
2010 Total Number of In –School suspensions
2011 Expected Number of In- School Suspensions
33% (919)
30% (854)
2010 Total Number of Students Suspended In-School
2011 Expected Number of Students Suspended In -School
14% (387)
11% (313)
2010 Number of Out-of-School Suspensions
2011 Expected Number of Out-of-School Suspensions
12% (332)
9% (256)
2010 Total Number of Students Suspended Out- of- School
2011 Expected Number of Students Suspended
Out- of-School
9% (231)
6% (171)
1.3. Reduction in 1.2. Increased utilization of 1.2. Administration and 1.2. Feedback from teachers and 1.2. Suspension reports
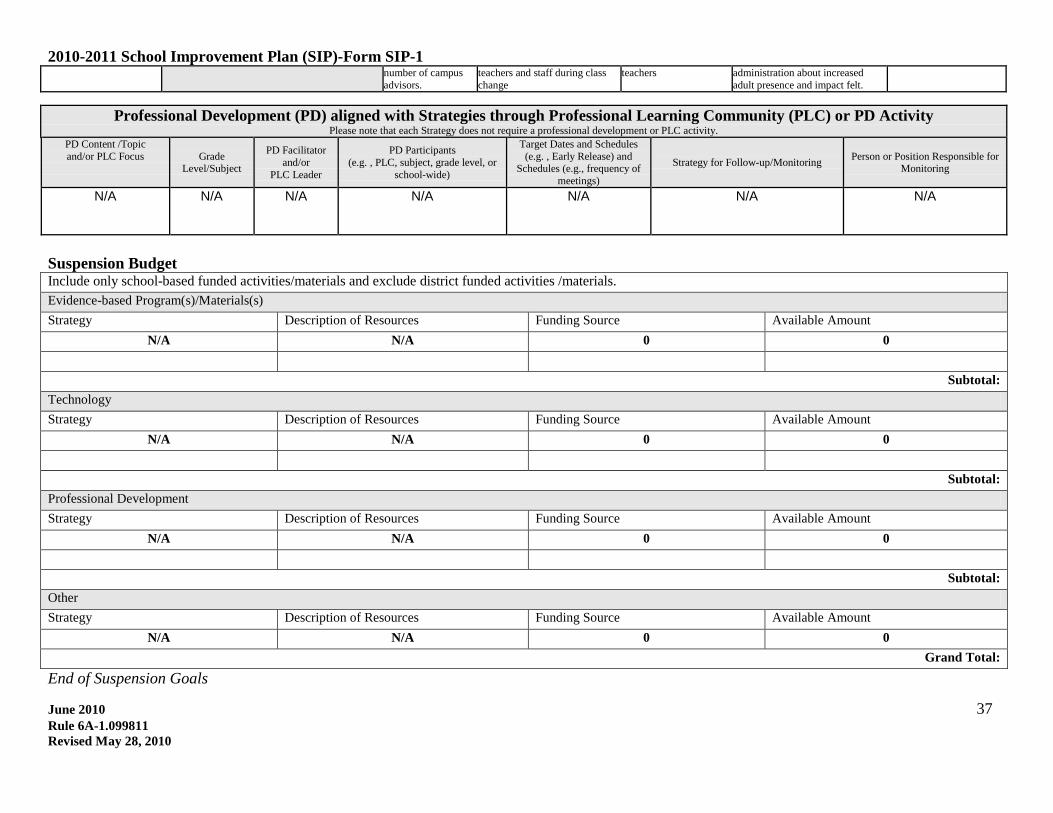
2010-2011 School Improvement Plan (SIP)-Form SIP-1
June 2010 37 Rule 6A-1.099811 Revised May 28, 2010
Professional Development (PD) aligned with Strategies through Professional Learning Community (PLC) or PD Activity Please note that each Strategy does not require a professional development or PLC activity.
PD Content /Topic and/or PLC Focus
Grade
Level/Subject
PD Facilitator and/or
PLC Leader
PD Participants (e.g. , PLC, subject, grade level, or
school-wide)
Target Dates and Schedules (e.g. , Early Release) and
Schedules (e.g., frequency of meetings)
Strategy for Follow-up/Monitoring Person or Position Responsible for Monitoring
N/A
N/A
N/A
N/A
N/A
N/A
N/A
Suspension Budget Include only school-based funded activities/materials and exclude district funded activities /materials. Evidence-based Program(s)/Materials(s) Strategy Description of Resources Funding Source Available Amount
N/A N/A 0 0
Subtotal: Technology Strategy Description of Resources Funding Source Available Amount
N/A N/A 0 0
Subtotal: Professional Development Strategy Description of Resources Funding Source Available Amount
N/A N/A 0 0
Subtotal: Other Strategy Description of Resources Funding Source Available Amount
N/A N/A 0 0 Grand Total:
End of Suspension Goals
number of campus advisors.
teachers and staff during class change
teachers administration about increased adult presence and impact felt.
2010-2011 School Improvement Plan (SIP)-Form SIP-1
June 2010 38 Rule 6A-1.099811 Revised May 28, 2010
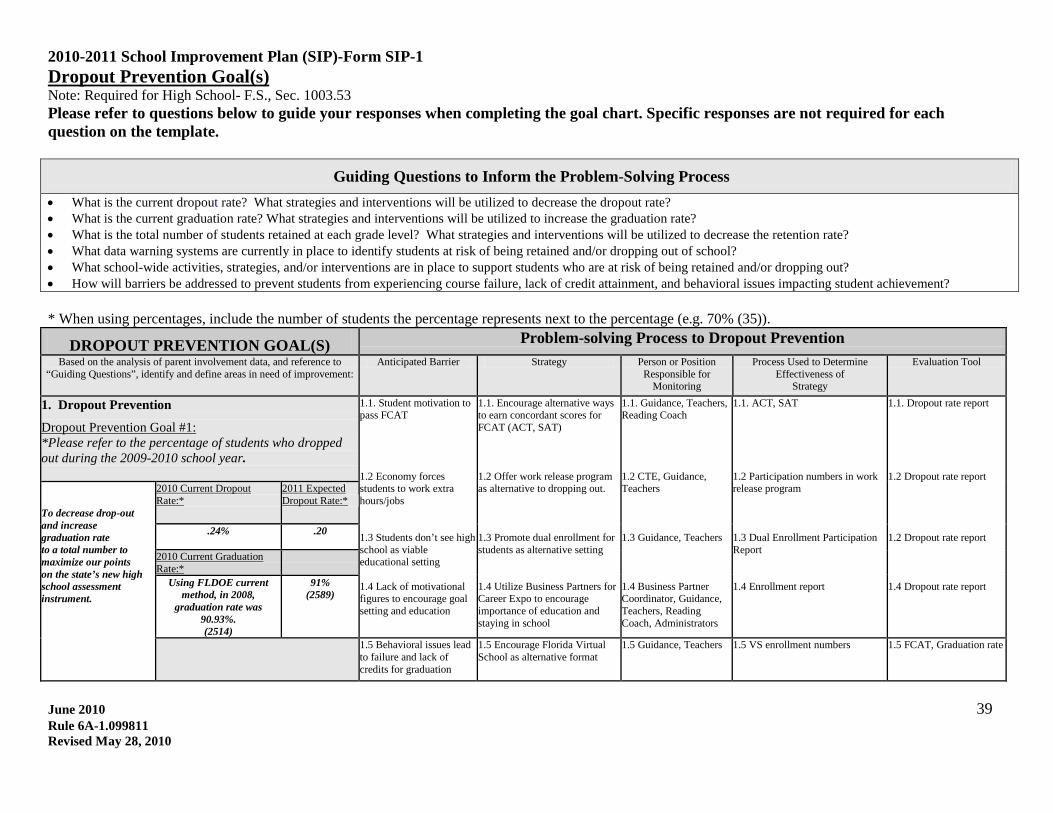
2010-2011 School Improvement Plan (SIP)-Form SIP-1
June 2010 39 Rule 6A-1.099811 Revised May 28, 2010
Dropout Prevention Goal(s)Note: Required for High School- F.S., Sec. 1003.53
Please refer to questions below to guide your responses when completing the goal chart. Specific responses are not required for each question on the template.
Guiding Questions to Inform the Problem-Solving Process
• What is the current dropout rate? What strategies and interventions will be utilized to decrease the dropout rate? • What is the current graduation rate? What strategies and interventions will be utilized to increase the graduation rate? • What is the total number of students retained at each grade level? What strategies and interventions will be utilized to decrease the retention rate? • What data warning systems are currently in place to identify students at risk of being retained and/or dropping out of school? • What school-wide activities, strategies, and/or interventions are in place to support students who are at risk of being retained and/or dropping out? • How will barriers be addressed to prevent students from experiencing course failure, lack of credit attainment, and behavioral issues impacting student achievement? * When using percentages, include the number of students the percentage represents next to the percentage (e.g. 70% (35)).
DROPOUT PREVENTION GOAL(S) Problem-solving Process to Dropout Prevention
Based on the analysis of parent involvement data, and reference to “Guiding Questions”, identify and define areas in need of improvement:
Anticipated Barrier Strategy Person or Position Responsible for
Monitoring
Process Used to Determine Effectiveness of
Strategy
Evaluation Tool
1. Dropout Prevention
*Please refer to the percentage of students who dropped out during the 2009-2010 school year.
Dropout Prevention Goal #1:
1.1. Student motivation to pass FCAT 1.2 Economy forces students to work extra hours/jobs 1.3 Students don’t see high school as viable educational setting 1.4 Lack of motivational figures to encourage goal setting and education
1.1. Encourage alternative ways to earn concordant scores for FCAT (ACT, SAT) 1.2 Offer work release program as alternative to dropping out. 1.3 Promote dual enrollment for students as alternative setting 1.4 Utilize Business Partners for Career Expo to encourage importance of education and staying in school
1.1. Guidance, Teachers, Reading Coach 1.2 CTE, Guidance, Teachers 1.3 Guidance, Teachers 1.4 Business Partner Coordinator, Guidance, Teachers, Reading Coach, Administrators
1.1. ACT, SAT 1.2 Participation numbers in work release program 1.3 Dual Enrollment Participation Report 1.4 Enrollment report
1.1. Dropout rate report 1.2 Dropout rate report 1.2 Dropout rate report 1.4 Dropout rate report
To decrease drop-out and increase graduation rate to a total number to maximize our points on the state’s new high school assessment instrument.
2010 Current Dropout Rate:*
2011 Expected Dropout Rate:*
.24%
.20
2010 Current Graduation Rate:*
Using FLDOE current method, in 2008,
graduation rate was 90.93%. (2514)
91% (2589)
1.5 Behavioral issues lead to failure and lack of credits for graduation
1.5 Encourage Florida Virtual School as alternative format
1.5 Guidance, Teachers 1.5 VS enrollment numbers 1.5 FCAT, Graduation rate
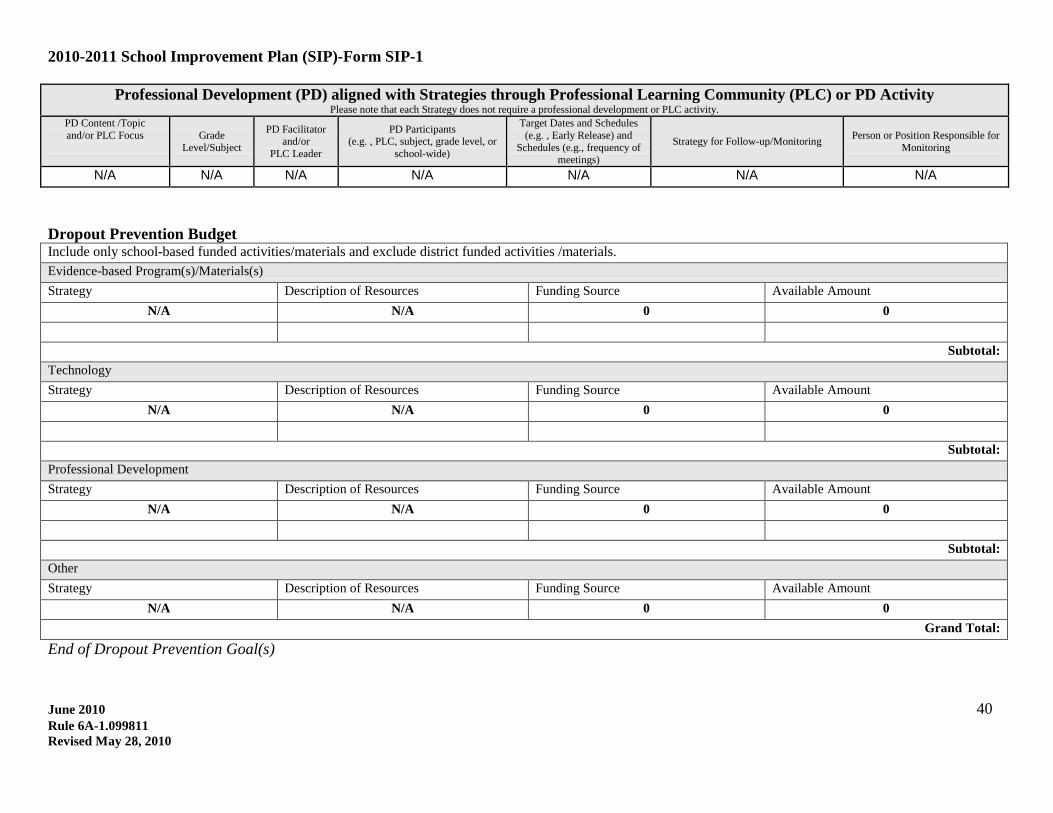
2010-2011 School Improvement Plan (SIP)-Form SIP-1
June 2010 40 Rule 6A-1.099811 Revised May 28, 2010
Professional Development (PD) aligned with Strategies through Professional Learning Community (PLC) or PD Activity
Please note that each Strategy does not require a professional development or PLC activity. PD Content /Topic and/or PLC Focus
Grade
Level/Subject
PD Facilitator and/or
PLC Leader
PD Participants (e.g. , PLC, subject, grade level, or
school-wide)
Target Dates and Schedules (e.g. , Early Release) and
Schedules (e.g., frequency of meetings)
Strategy for Follow-up/Monitoring Person or Position Responsible for Monitoring
N/A N/A N/A N/A N/A N/A N/A
Dropout Prevention Budget Include only school-based funded activities/materials and exclude district funded activities /materials. Evidence-based Program(s)/Materials(s) Strategy Description of Resources Funding Source Available Amount
N/A N/A 0 0
Subtotal: Technology Strategy Description of Resources Funding Source Available Amount
N/A N/A 0 0
Subtotal: Professional Development Strategy Description of Resources Funding Source Available Amount
N/A N/A 0 0
Subtotal: Other Strategy Description of Resources Funding Source Available Amount
N/A N/A 0 0 Grand Total:
End of Dropout Prevention Goal(s)
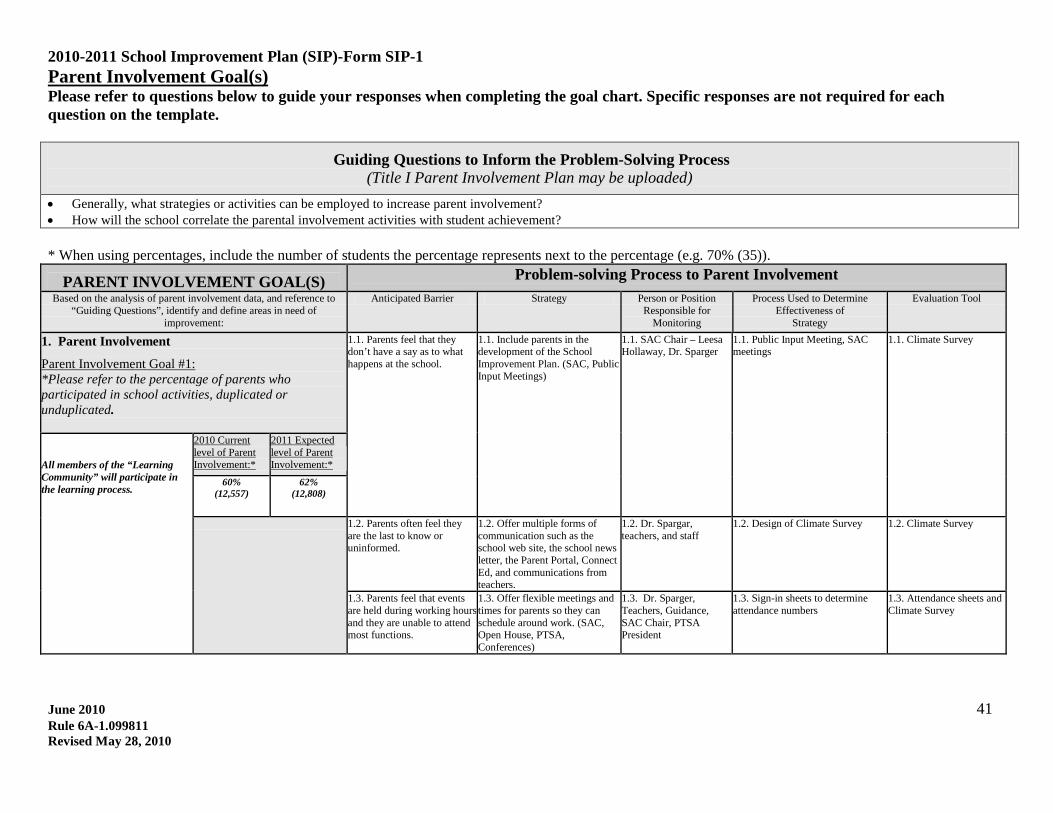
2010-2011 School Improvement Plan (SIP)-Form SIP-1
June 2010 41 Rule 6A-1.099811 Revised May 28, 2010
Please refer to questions below to guide your responses when completing the goal chart. Specific responses are not required for each question on the template.
Parent Involvement Goal(s)
Guiding Questions to Inform the Problem-Solving Process (Title I Parent Involvement Plan may be uploaded)
• Generally, what strategies or activities can be employed to increase parent involvement? • How will the school correlate the parental involvement activities with student achievement? * When using percentages, include the number of students the percentage represents next to the percentage (e.g. 70% (35)).
PARENT INVOLVEMENT GOAL(S) Problem-solving Process to Parent Involvement
Based on the analysis of parent involvement data, and reference to “Guiding Questions”, identify and define areas in need of
improvement:
Anticipated Barrier Strategy Person or Position Responsible for
Monitoring
Process Used to Determine Effectiveness of
Strategy
Evaluation Tool
1. Parent Involvement
*Please refer to the percentage of parents who participated in school activities, duplicated or unduplicated.
Parent Involvement Goal #1:
1.1. Parents feel that they don’t have a say as to what happens at the school.
1.1. Include parents in the development of the School Improvement Plan. (SAC, Public Input Meetings)
1.1. SAC Chair – Leesa Hollaway, Dr. Sparger
1.1. Public Input Meeting, SAC meetings
1.1. Climate Survey
All members of the “Learning Community” will participate in the learning process.
2010 Current level of Parent Involvement:*
2011 Expected level of Parent Involvement:*
60% (12,557)
62% (12,808)
1.2. Parents often feel they are the last to know or uninformed.
1.2. Offer multiple forms of communication such as the school web site, the school news letter, the Parent Portal, Connect Ed, and communications from teachers.
1.2. Dr. Spargar, teachers, and staff
1.2. Design of Climate Survey 1.2. Climate Survey
1.3. Parents feel that events are held during working hours and they are unable to attend most functions.
1.3. Offer flexible meetings and times for parents so they can schedule around work. (SAC, Open House, PTSA, Conferences)
1.3. Dr. Sparger, Teachers, Guidance, SAC Chair, PTSA President
1.3. Sign-in sheets to determine attendance numbers
1.3. Attendance sheets and Climate Survey
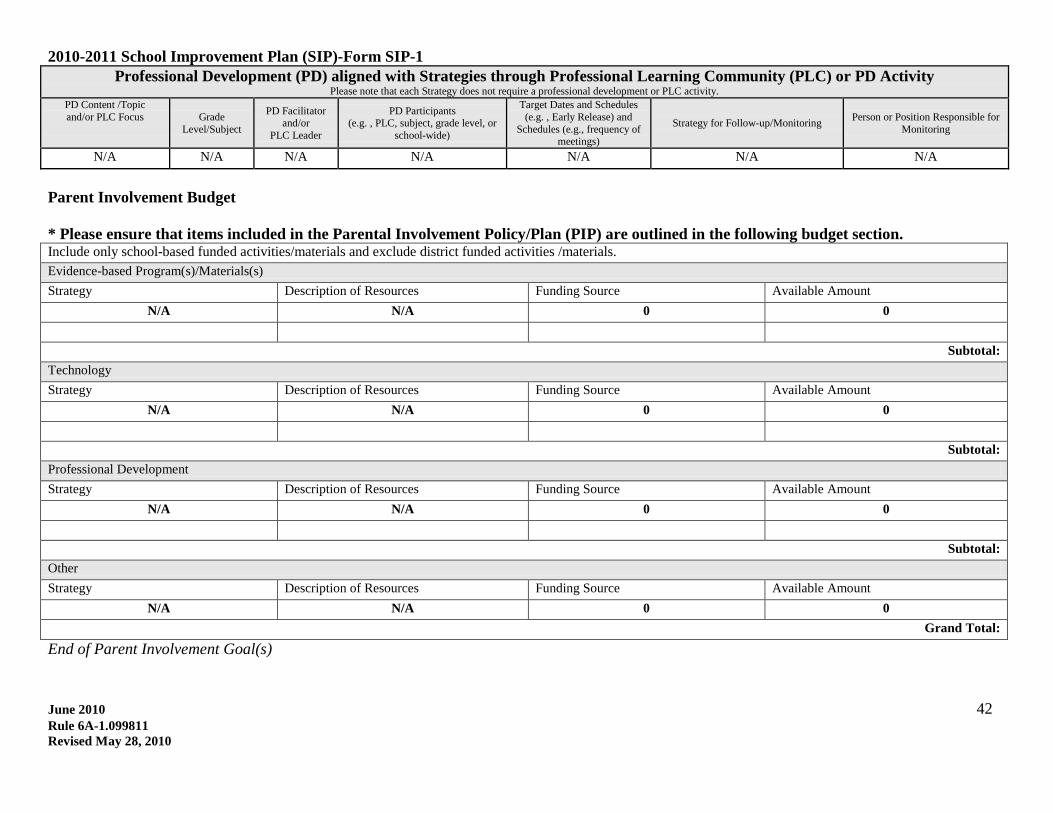
2010-2011 School Improvement Plan (SIP)-Form SIP-1
June 2010 42 Rule 6A-1.099811 Revised May 28, 2010
Professional Development (PD) aligned with Strategies through Professional Learning Community (PLC) or PD Activity Please note that each Strategy does not require a professional development or PLC activity.
PD Content /Topic and/or PLC Focus
Grade
Level/Subject
PD Facilitator and/or
PLC Leader
PD Participants (e.g. , PLC, subject, grade level, or
school-wide)
Target Dates and Schedules (e.g. , Early Release) and
Schedules (e.g., frequency of meetings)
Strategy for Follow-up/Monitoring Person or Position Responsible for Monitoring
N/A N/A N/A N/A N/A N/A N/A
Parent Involvement Budget * Please ensure that items included in the Parental Involvement Policy/Plan (PIP) are outlined in the following budget section. Include only school-based funded activities/materials and exclude district funded activities /materials. Evidence-based Program(s)/Materials(s) Strategy Description of Resources Funding Source Available Amount
N/A N/A 0 0
Subtotal: Technology Strategy Description of Resources Funding Source Available Amount
N/A N/A 0 0
Subtotal: Professional Development Strategy Description of Resources Funding Source Available Amount
N/A N/A 0 0
Subtotal: Other Strategy Description of Resources Funding Source Available Amount
N/A N/A 0 0 Grand Total:
End of Parent Involvement Goal(s)
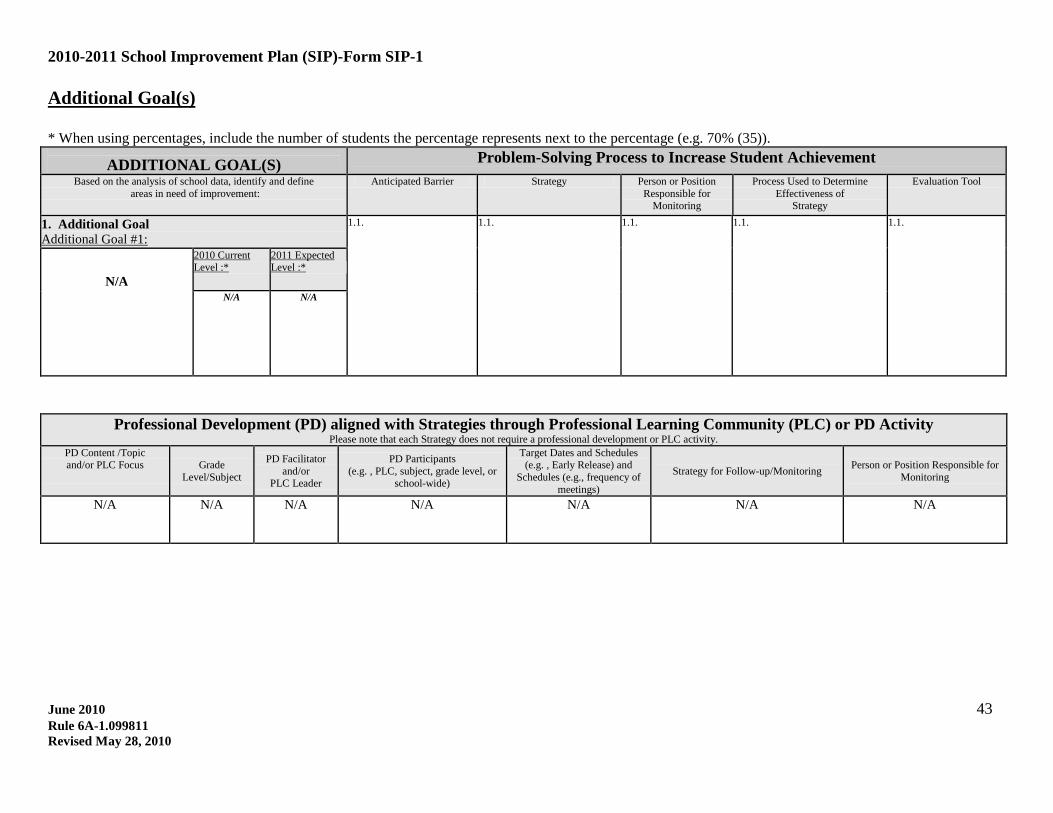
2010-2011 School Improvement Plan (SIP)-Form SIP-1
June 2010 43 Rule 6A-1.099811 Revised May 28, 2010
Additional Goal(s)
* When using percentages, include the number of students the percentage represents next to the percentage (e.g. 70% (35)).
Professional Development (PD) aligned with Strategies through Professional Learning Community (PLC) or PD Activity Please note that each Strategy does not require a professional development or PLC activity.
PD Content /Topic and/or PLC Focus
Grade
Level/Subject
PD Facilitator and/or
PLC Leader
PD Participants (e.g. , PLC, subject, grade level, or
school-wide)
Target Dates and Schedules (e.g. , Early Release) and
Schedules (e.g., frequency of meetings)
Strategy for Follow-up/Monitoring Person or Position Responsible for Monitoring
N/A
N/A
N/A
N/A
N/A
N/A
N/A
ADDITIONAL GOAL(S) Problem-Solving Process to Increase Student Achievement
Based on the analysis of school data, identify and define areas in need of improvement:
Anticipated Barrier Strategy Person or Position Responsible for
Monitoring
Process Used to Determine Effectiveness of
Strategy
Evaluation Tool
1. Additional Goal 1.1.
Additional Goal #1:
1.1. 1.1. 1.1. 1.1.
N/A
2010 Current Level :*
2011 Expected Level :*
N/A N/A
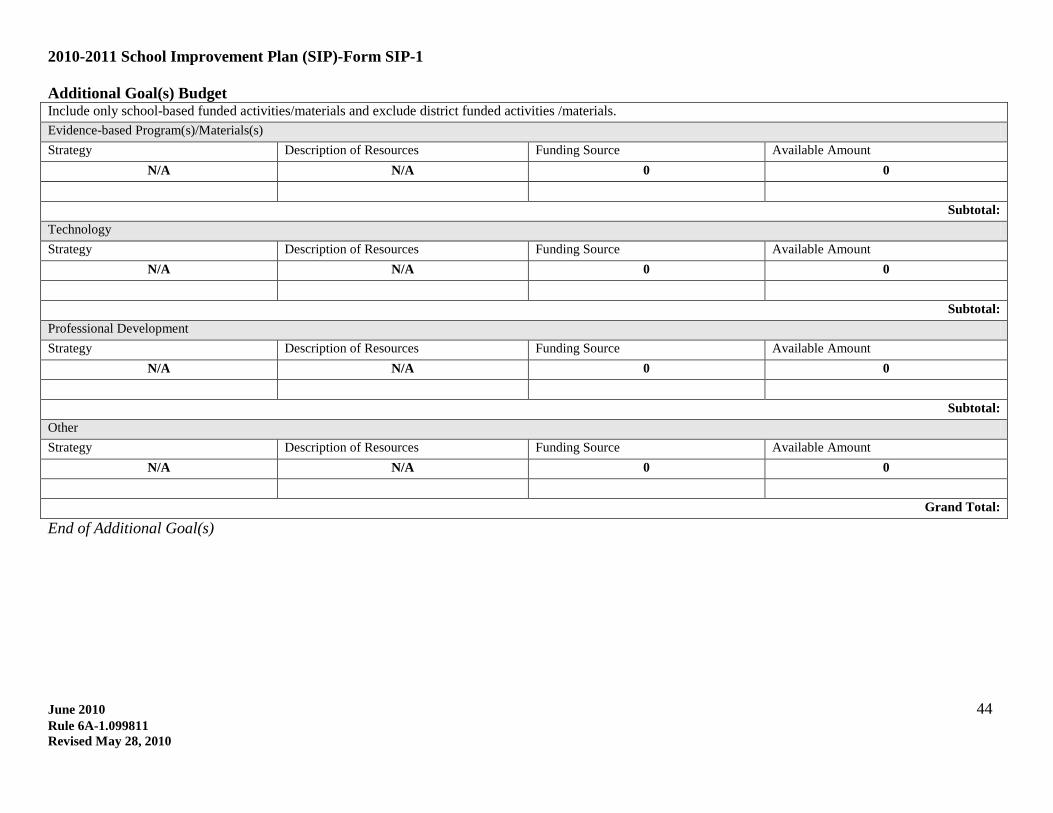
2010-2011 School Improvement Plan (SIP)-Form SIP-1
June 2010 44 Rule 6A-1.099811 Revised May 28, 2010
Additional Goal(s) Budget Include only school-based funded activities/materials and exclude district funded activities /materials. Evidence-based Program(s)/Materials(s) Strategy Description of Resources Funding Source Available Amount
N/A N/A 0 0
Subtotal: Technology Strategy Description of Resources Funding Source Available Amount
N/A N/A 0 0
Subtotal: Professional Development Strategy Description of Resources Funding Source Available Amount
N/A N/A 0 0
Subtotal: Other Strategy Description of Resources Funding Source Available Amount
N/A N/A 0 0
Grand Total:
End of Additional Goal(s)
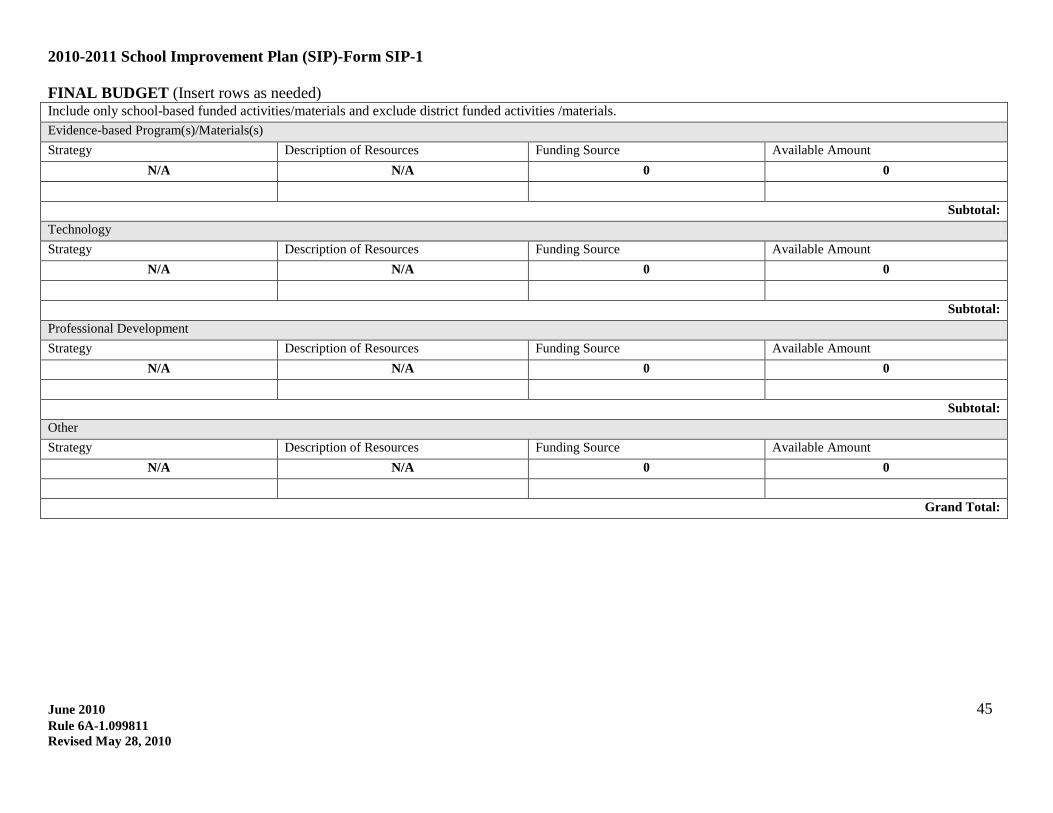
2010-2011 School Improvement Plan (SIP)-Form SIP-1
June 2010 45 Rule 6A-1.099811 Revised May 28, 2010
FINAL BUDGET (Insert rows as needed) Include only school-based funded activities/materials and exclude district funded activities /materials. Evidence-based Program(s)/Materials(s) Strategy Description of Resources Funding Source Available Amount
N/A N/A 0 0
Subtotal: Technology Strategy Description of Resources Funding Source Available Amount
N/A N/A 0 0
Subtotal: Professional Development Strategy Description of Resources Funding Source Available Amount
N/A N/A 0 0
Subtotal: Other Strategy Description of Resources Funding Source Available Amount
N/A N/A 0 0
Grand Total:
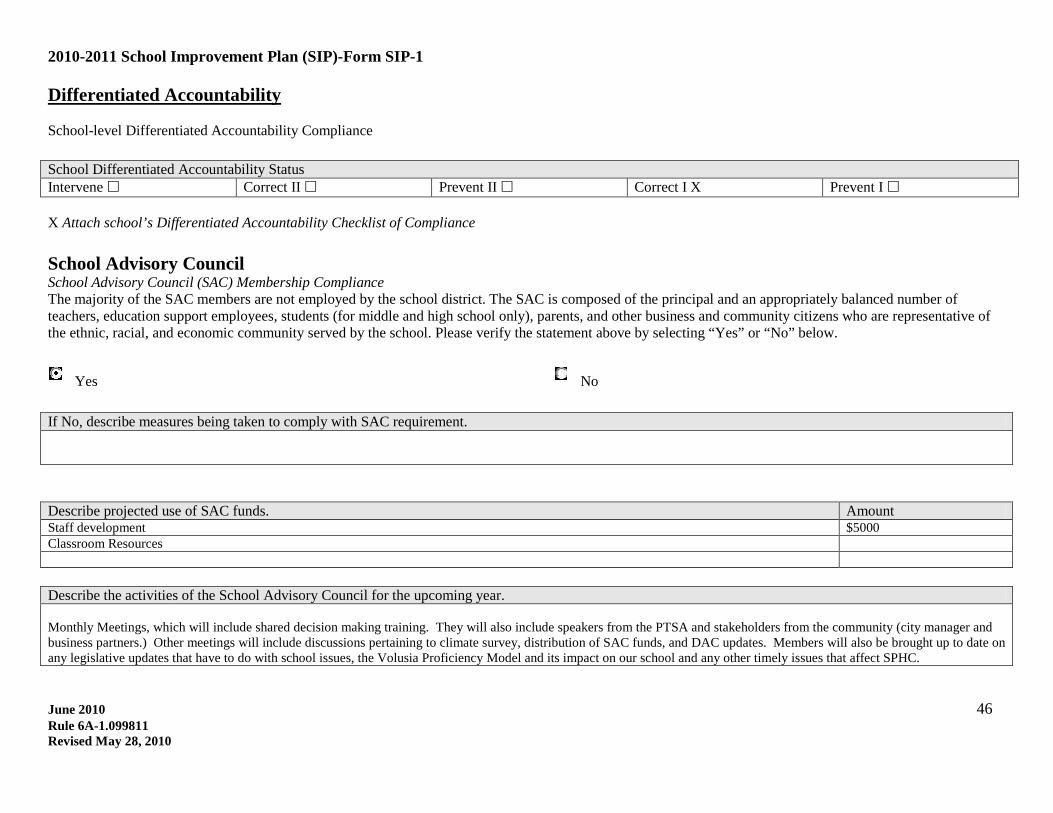
2010-2011 School Improvement Plan (SIP)-Form SIP-1
June 2010 46 Rule 6A-1.099811 Revised May 28, 2010
Differentiated Accountability
School-level Differentiated Accountability Compliance School Differentiated Accountability Status Intervene Correct II Prevent II Correct I X Prevent I X Attach school’s Differentiated Accountability Checklist of Compliance School Advisory Council School Advisory Council (SAC) Membership Compliance The majority of the SAC members are not employed by the school district. The SAC is composed of the principal and an appropriately balanced number of teachers, education support employees, students (for middle and high school only), parents, and other business and community citizens who are representative of the ethnic, racial, and economic community served by the school. Please verify the statement above by selecting “Yes” or “No” below.
Yes No If No, describe measures being taken to comply with SAC requirement. Describe projected use of SAC funds. Amount Staff development $5000 Classroom Resources Describe the activities of the School Advisory Council for the upcoming year. Monthly Meetings, which will include shared decision making training. They will also include speakers from the PTSA and stakeholders from the community (city manager and business partners.) Other meetings will include discussions pertaining to climate survey, distribution of SAC funds, and DAC updates. Members will also be brought up to date on any legislative updates that have to do with school issues, the Volusia Proficiency Model and its impact on our school and any other timely issues that affect SPHC.
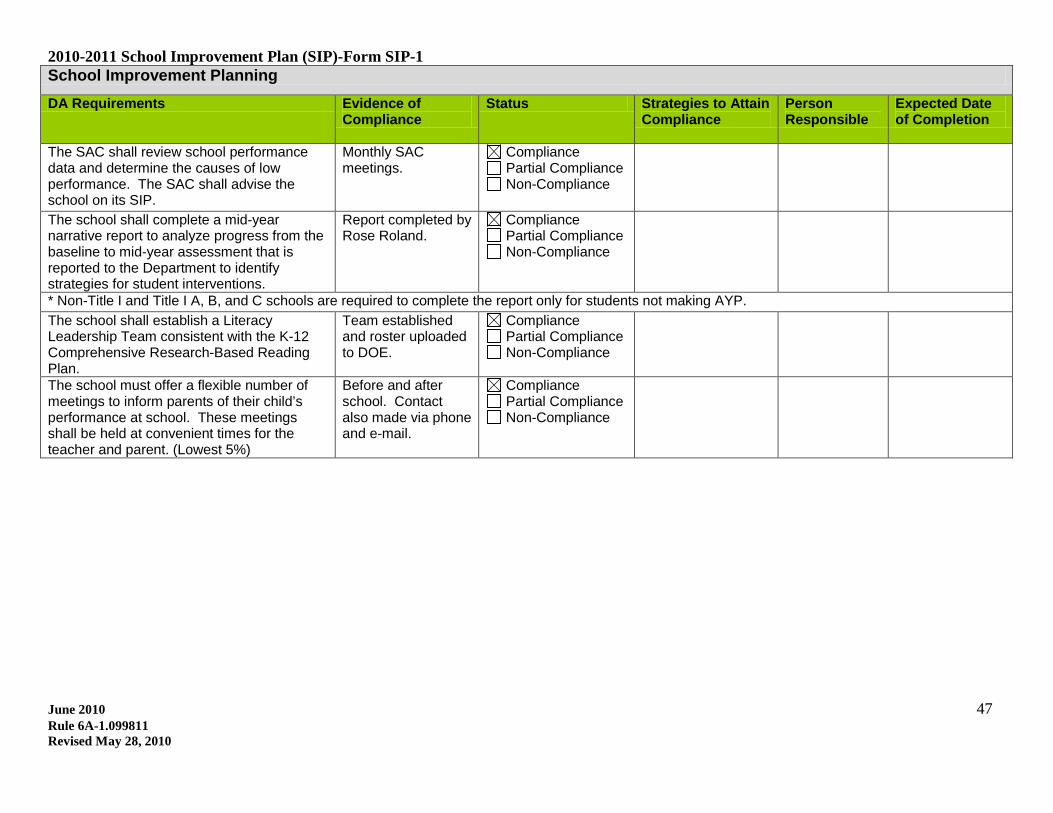
2010-2011 School Improvement Plan (SIP)-Form SIP-1
June 2010 47 Rule 6A-1.099811 Revised May 28, 2010
School Improvement Planning DA Requirements Evidence of
Compliance Status Strategies to Attain
Compliance Person Responsible
Expected Date of Completion
The SAC shall review school performance data and determine the causes of low performance. The SAC shall advise the school on its SIP.
Monthly SAC meetings.
Compliance Partial Compliance Non-Compliance
The school shall complete a mid-year narrative report to analyze progress from the baseline to mid-year assessment that is reported to the Department to identify strategies for student interventions.
Report completed by Rose Roland.
Compliance Partial Compliance Non-Compliance
* Non-Title I and Title I A, B, and C schools are required to complete the report only for students not making AYP. The school shall establish a Literacy Leadership Team consistent with the K-12 Comprehensive Research-Based Reading Plan.
Team established and roster uploaded to DOE.
Compliance Partial Compliance Non-Compliance
The school must offer a flexible number of meetings to inform parents of their child’s performance at school. These meetings shall be held at convenient times for the teacher and parent. (Lowest 5%)
Before and after school. Contact also made via phone and e-mail.
Compliance Partial Compliance Non-Compliance
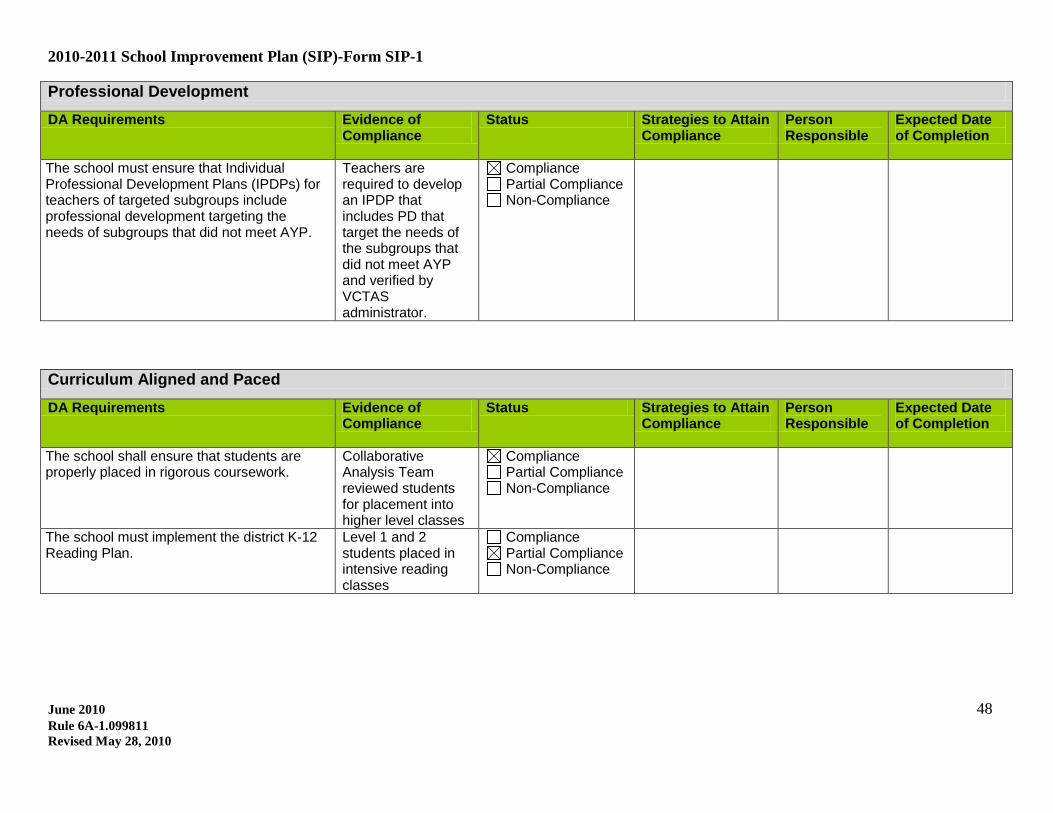
2010-2011 School Improvement Plan (SIP)-Form SIP-1
June 2010 48 Rule 6A-1.099811 Revised May 28, 2010
Professional Development DA Requirements Evidence of
Compliance Status Strategies to Attain
Compliance Person Responsible
Expected Date of Completion
The school must ensure that Individual Professional Development Plans (IPDPs) for teachers of targeted subgroups include professional development targeting the needs of subgroups that did not meet AYP.
Teachers are required to develop an IPDP that includes PD that target the needs of the subgroups that did not meet AYP and verified by VCTAS administrator.
Compliance Partial Compliance Non-Compliance
Curriculum Aligned and Paced DA Requirements Evidence of
Compliance Status Strategies to Attain
Compliance Person Responsible
Expected Date of Completion
The school shall ensure that students are properly placed in rigorous coursework.
Collaborative Analysis Team reviewed students for placement into higher level classes
Compliance Partial Compliance Non-Compliance
The school must implement the district K-12 Reading Plan.
Level 1 and 2 students placed in intensive reading classes
Compliance Partial Compliance Non-Compliance
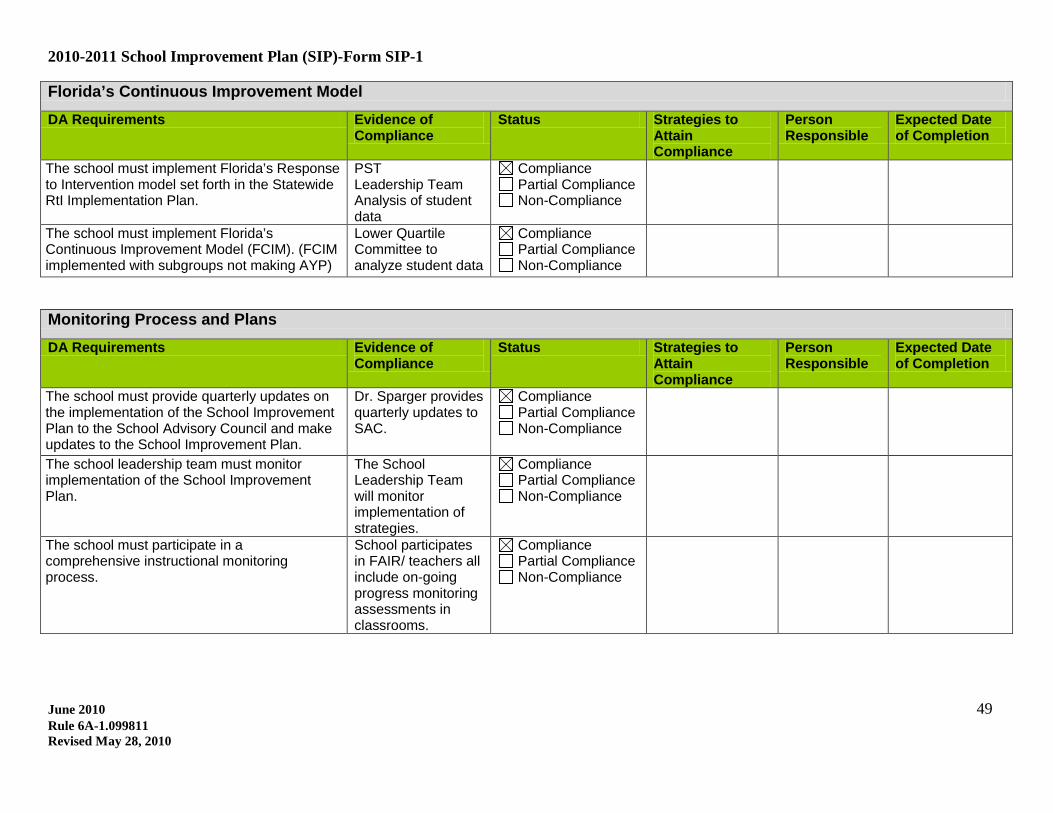
2010-2011 School Improvement Plan (SIP)-Form SIP-1
June 2010 49 Rule 6A-1.099811 Revised May 28, 2010
Florida’s Continuous Improvement Model DA Requirements Evidence of
Compliance Status Strategies to
Attain Compliance
Person Responsible
Expected Date of Completion
The school must implement Florida’s Response to Intervention model set forth in the Statewide RtI Implementation Plan.
PST Leadership Team Analysis of student data
Compliance Partial Compliance Non-Compliance
The school must implement Florida’s Continuous Improvement Model (FCIM). (FCIM implemented with subgroups not making AYP)
Lower Quartile Committee to analyze student data
Compliance Partial Compliance Non-Compliance
Monitoring Process and Plans DA Requirements Evidence of
Compliance Status Strategies to
Attain Compliance
Person Responsible
Expected Date of Completion
The school must provide quarterly updates on the implementation of the School Improvement Plan to the School Advisory Council and make updates to the School Improvement Plan.
Dr. Sparger provides quarterly updates to SAC.
Compliance Partial Compliance Non-Compliance
The school leadership team must monitor implementation of the School Improvement Plan.
The School Leadership Team will monitor implementation of strategies.
Compliance Partial Compliance Non-Compliance
The school must participate in a comprehensive instructional monitoring process.
School participates in FAIR/ teachers all include on-going progress monitoring assessments in classrooms.
Compliance Partial Compliance Non-Compliance
Recommended