RVSM Heightens Need for Precision in Altitude Measurement
Flight SafetyD I G E S T
NOVEMBER 2004
RVSM Heightens Need for Precision in Altitude Measurement
Technological advances have honed the accuracy of aircraft altimeters, but false indications still can occur at any altitude or fl ight level. Some involve limitations of the altimeters themselves, but most are associated with the ‘weak link’ in altimetry — the human.
U.S. Hazardous-materials Incidents In Aviation Were Rarely Fatal
From 1994 through 2003, only the 1996 ValuJet accident resulted in fatalities during the transportation of hazardous materials by aircraft. Injuries in this incident category averaged about 20 per year.
Entropy Model of Accident Causation Proposed
Looking at organizational accident-risk factors in terms of the degradation of system factors is more effective than the human-error model, says an environmental health specialist.
Turbine Disk Fails During Departure
The accident report said that the uncontained engine failure resulted from fatigue cracks in an area damaged by shot-peening that had been performed either during the manufacture of the engine or during repairs.
Flight Safety FoundationFor Everyone Concerned With the Safety of Flight
www.fl ightsafety.org
OFFICERS AND STAFF
Chairman, Board of Governors Hon. Carl W. Vogt
President and CEO Stuart Matthews
Executive Vice President Robert H. Vandel
Treasurer James S. Waugh Jr.
ADMINISTRATIVE
Manager, Support Services Linda Crowley Horger
FINANCIAL
Director of Finance and Administration Crystal N. Phillips
Accountant Millicent Wheeler
MEMBERSHIP
Director, Membership and Development Ann Hill
Membership Services Coordinator Ahlam Wahdan
PUBLICATIONS
Director of Publications Roger Rozelle
Senior Editor Mark Lacagnina
Senior Editor Wayne Rosenkrans
Senior Editor Linda Werfelman
Associate Editor Rick Darby
Web and Print Production Coordinator Karen K. Ehrlich
Production Designer Ann L. Mullikin
Production Specialist Susan D. Reed
Librarian, Jerry Lederer Aviation Safety Library Patricia Setze
TECHNICAL
Director of Technical Programs James M. Burin
Technical Programs Specialist Joanne Anderson
Managing Director of Internal Evaluation Programs Louis A. Sorrentino III
Q-Star Program Administrator Robert Feeler
Manager, Data Systems and Analysis Robert Dodd, Ph.D.
Manager of Aviation Safety Audits Darol V. Holsman
Founder Jerome Lederer 1902–2004
Flight Safety DigestVol. 23 No. 11 November 2004
In This Issue
Flight Safety Foundation is an international membership organization dedicated to the continuous improvement of aviation safety. Nonprofi t and independent, the Foundation was launched offi cially in 1947 in response to the aviation industry’s need for a neutral clearinghouse to disseminate objective safety information, and for a credible and knowl-edgeable body that would identify threats to safety, analyze the problems and recommend practical solutions to them. Since its beginning, the Foundation has acted in the public interest to produce positive infl uence on aviation safety. Today, the Foundation provides leadership to more than 900 member organizations in more than 150 countries.
Cover photo: © Copyright 2004 Getty images Inc.
26LI
BRARY
STATS
23
BR
IEFS
31
1
1FLIGHT SAFETY FOUNDATION • FLIGHT SAFETY DIGEST • NOVEMBER 2004
RVSM Heightens Need for Precision in Altitude MeasurementTechnological advances have honed the accuracy of aircraft altimeters, but false indications
still can occur at any altitude or flight level. Some involve limitations of the altimeters
themselves, but most are associated with the ‘weak link’ in altimetry — the human.
— FSF EDITORIAL STAFF
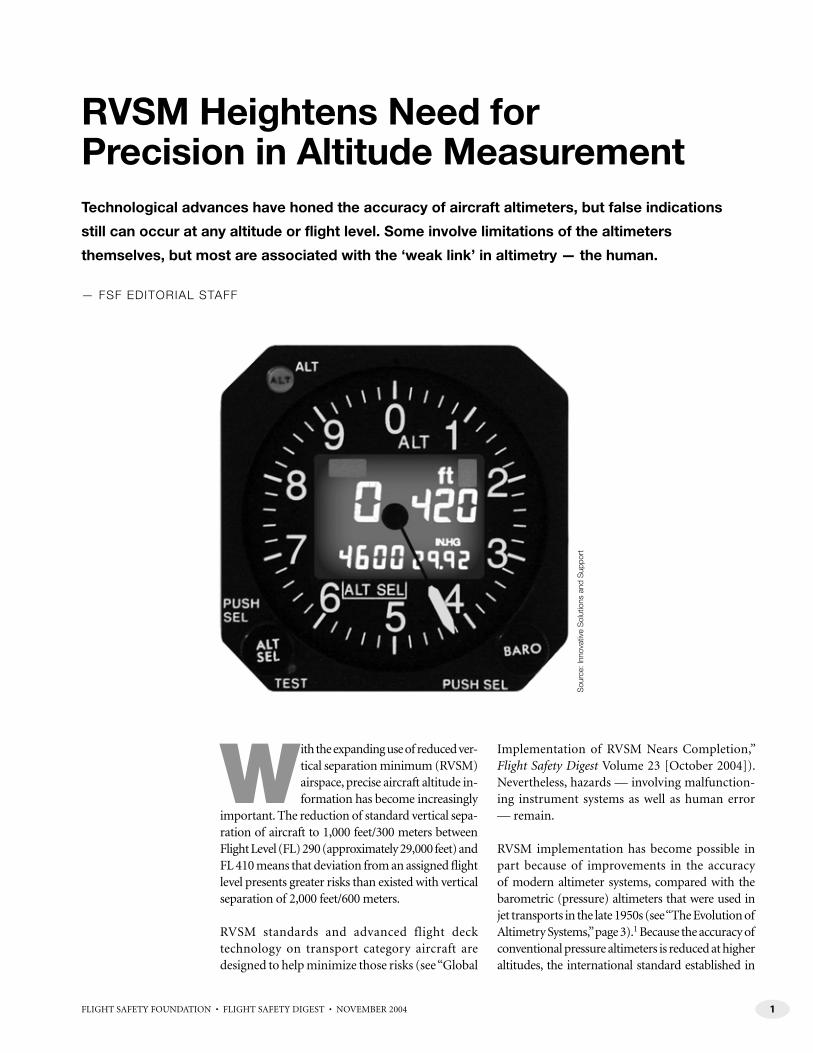
With the expanding use of reduced ver-tical separation minimum (RVSM) airspace, precise aircraft altitude in-formation has become increasingly
important. The reduction of standard vertical sepa-ration of aircraft to 1,000 feet/300 meters between Flight Level (FL) 290 (approximately 29,000 feet) and FL 410 means that deviation from an assigned fl ight level presents greater risks than existed with vertical separation of 2,000 feet/600 meters.
RVSM standards and advanced flight deck technology on transport category aircraft are designed to help minimize those risks (see “Global
Implementation of RVSM Nears Completion,” Flight Safety Digest Volume 23 [October 2004]). Nevertheless, hazards — involving malfunction-ing instrument systems as well as human error — remain.
RVSM implementation has become possible in part because of improvements in the accuracy of modern altimeter systems, compared with the barometric (pressure) altimeters that were used in jet transports in the late 1950s (see “The Evolution of Altimetry Systems,” page 3).1 Because the accuracy of conventional pressure altimeters is reduced at higher altitudes, the international standard established in
Sou
rce:
Inno
vativ
e S
olut
ions
and
Sup
port
2 FLIGHT SAFETY FOUNDATION • FLIGHT SAFETY DIGEST • NOVEMBER 2004
P R E C I S I O N I N A L T I T U D E M E A S U R E M E N T
1960 was for vertical separation of 2,000 feet between aircraft operated above FL 290.
As technological advances in al-timeters, autopilots and altitude-alerting systems led to more precision in measuring and maintaining alti-tude, the International Civil Aviation Organization (ICAO) determined, after a series of studies in the 1980s, that RVSM was technically feasible and developed a manual for RVSM implementation.2 Further guidance for aircraft operators is contained in two ICAO-approved documents: European Joint Aviation Authorities Leaflet No. 63 and U.S. Federal
Aviation Administration Document 91-RVSM.4
Included in these documents are minimum equip-ment requirements for RVSM operations:
• Two independent altitude-measurement systems;
• One secondary surveillance radar transpon-der with an altitude-reporting system that can be connected to the altitude-measurement system in use for altitude-keeping;
• An altitude-alerting system; and,
• An automatic altitude-control system.
In addition, an ICAO minimum aircraft system performance specification (MASPS) requires that the altimetry systems in RVSM-approved aircraft have a maximum altimeter system er-ror (ASE) of 80 feet/25 meters and that the automatic altitude-control systems must be able to hold altitude within 65 feet/20 meters. (ICAO defi nes ASE as “the difference between the altitude indicated by the altimeter display, assuming a correct altimeter barometric setting, and the pressure altitude corresponding to the undisturbed ambient pressure.”)
The ICAO manual for RVSM implementation says that before fl ight in RVSM airspace, a fl ight crew should conduct a ground check to ensure that the required two main altimeter systems are within the prescribed tolerances.
During fl ight, “generally fl ight crew operating proce-dures in RVSM airspace are no different than those in any other airspace,” the ICAO manual says.
Nevertheless, the manual says, “It is essential that the aircraft be fl own at the cleared fl ight level (CFL). This requires that particular care be taken to ensure that air traffi c control (ATC) clearances are fully understood and complied with. … During cleared transition between [fl ight] levels, the aircraft should not be allowed to overshoot or undershoot the new fl ight level by more than [150 feet/45 meters].”
In addition, fl ight crews should conduct regular hourly cross-checks between the altimeters, and “a minimum of two RVSM MASPS-compliant systems must agree within 60 meters (200 feet). Failure to meet this condition will require that the system be reported as defective and notifi ed to ATC,” the ICAO manual says.
Height-monitoring is another RVSM requirement, and the U.K. Civil Aviation Authority (CAA) said in mid-2004 that height-monitoring had revealed the problem of “ASE drift,” a phenomenon in which, over time, most aircraft begin to fl y lower than their displayed altitude.”5
U.K. CAA’s continuing investigation6 of ASE drift has found that likely causes include changes over time in the performance of air-data computers and erosion of pitot-static probes.
The investigation also has found that ASE can be exacerbated by inadequate operational practices by fl ight crews, especially noncompliance with aircraft operating restrictions contained in the RVSM airworthiness approval.
“In particular, if the approval was based on ad-herence to speed limits, the fl ight crew must be aware of those limits and ensure that the aircraft is operated within the cleared speed envelope,” U.K. CAA said.
In addition, during RVSM operations, both the active autopilot and the operating transponder should be selected to the same altimetry system, “unless there is a systems limitation or functional-ity which makes the requirement unnecessary and is detailed in the AFM [aircraft fl ight manual].”
Continued on page 5
3FLIGHT SAFETY FOUNDATION • FLIGHT SAFETY DIGEST • NOVEMBER 2004
P R E C I S I O N I N A L T I T U D E M E A S U R E M E N T
Altimeters have provided pilots with essential flight information since the development in 1928 of an accurate
barometric (pressure) altimeter.
Altimeters indirectly measure the height of an aircraft above mean sea level or above a ground reference datum by sensing the changes in ambient air pressure that accompany changes in altitude and provide a corresponding altitude reading in feet or meters.
Static air pressure typically is derived from static sources mounted on the sides of the fuselage.
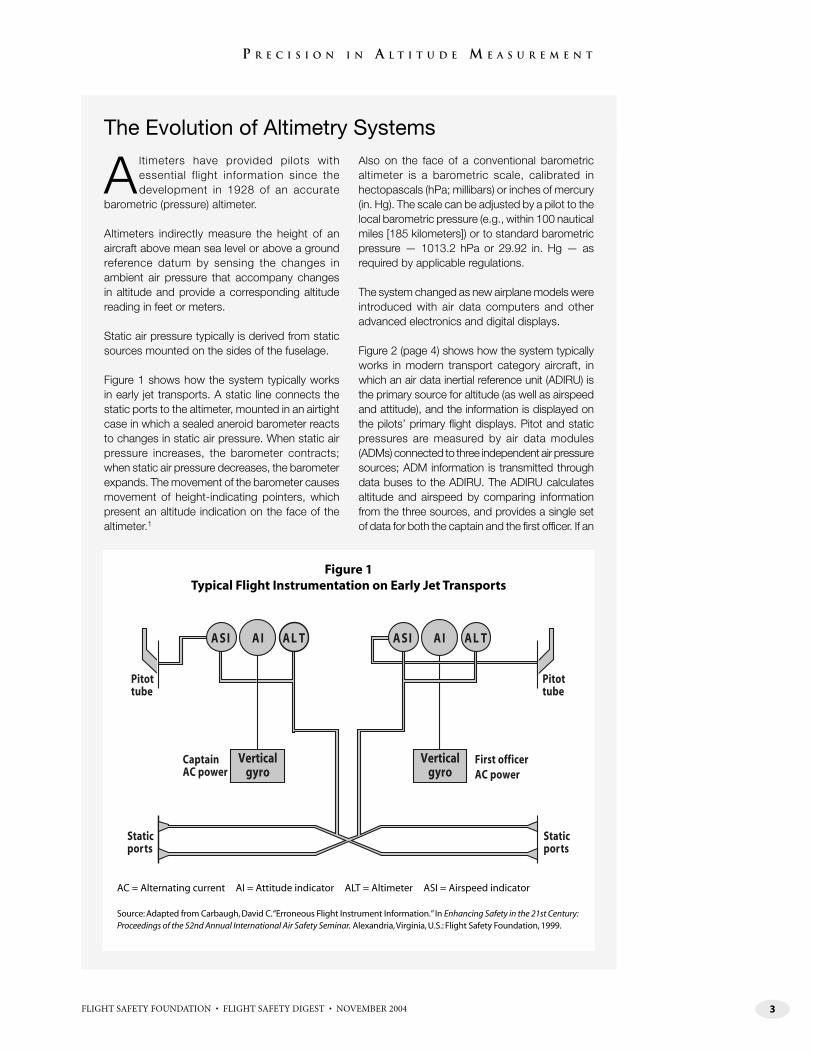
Figure 1 shows how the system typically works in early jet transports. A static line connects the static ports to the altimeter, mounted in an airtight case in which a sealed aneroid barometer reacts to changes in static air pressure. When static air pressure increases, the barometer contracts; when static air pressure decreases, the barometer expands. The movement of the barometer causes movement of height-indicating pointers, which present an altitude indication on the face of the altimeter.1
Also on the face of a conventional barometric altimeter is a barometric scale, calibrated in hectopascals (hPa; millibars) or inches of mercury (in. Hg). The scale can be adjusted by a pilot to the local barometric pressure (e.g., within 100 nautical miles [185 kilometers]) or to standard barometric pressure — 1013.2 hPa or 29.92 in. Hg — as required by applicable regulations.
The system changed as new airplane models were introduced with air data computers and other advanced electronics and digital displays.
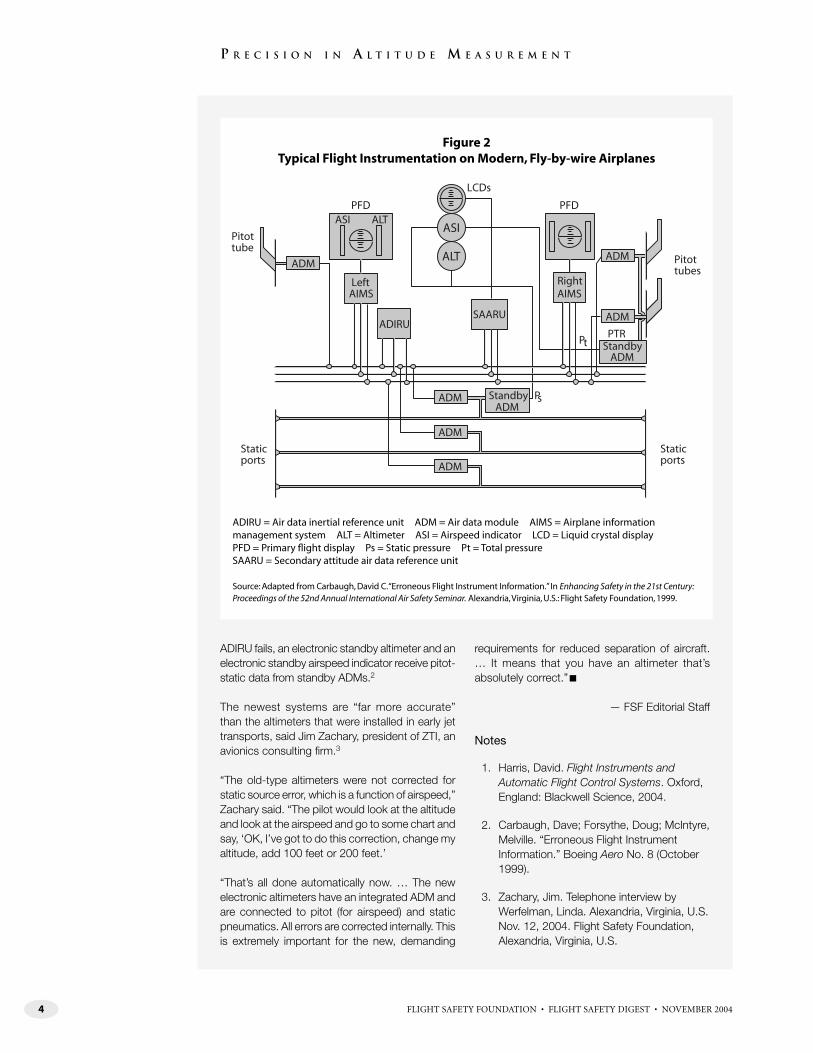
Figure 2 (page 4) shows how the system typically works in modern transport category aircraft, in which an air data inertial reference unit (ADIRU) is the primary source for altitude (as well as airspeed and attitude), and the information is displayed on the pilots’ primary flight displays. Pitot and static pressures are measured by air data modules (ADMs) connected to three independent air pressure sources; ADM information is transmitted through data buses to the ADIRU. The ADIRU calculates altitude and airspeed by comparing information from the three sources, and provides a single set of data for both the captain and the first officer. If an
ASI AL T
Verticalgyro
Verticalgyro
CaptainAC power
Staticports
Pitottube
Staticports
Pitottube
First officerAC power
ASI AI AIAL T
Figure 1Typical Flight Instrumentation on Early Jet Transports
AC = Alternating current AI = Attitude indicator ALT = Altimeter ASI = Airspeed indicator
Source: Adapted from Carbaugh, David C. “Erroneous Flight Instrument Information.” In Enhancing Safety in the 21st Century: Proceedings of the 52nd Annual International Air Safety Seminar. Alexandria, Virginia, U.S.: Flight Safety Foundation, 1999.
The Evolution of Altimetry Systems
4 FLIGHT SAFETY FOUNDATION • FLIGHT SAFETY DIGEST • NOVEMBER 2004
P R E C I S I O N I N A L T I T U D E M E A S U R E M E N T
ADIRU fails, an electronic standby altimeter and an electronic standby airspeed indicator receive pitot-static data from standby ADMs.2
The newest systems are “far more accurate” than the altimeters that were installed in early jet transports, said Jim Zachary, president of ZTI, an avionics consulting firm.3
“The old-type altimeters were not corrected for static source error, which is a function of airspeed,” Zachary said. “The pilot would look at the altitude and look at the airspeed and go to some chart and say, ‘OK, I’ve got to do this correction, change my altitude, add 100 feet or 200 feet.’
“That’s all done automatically now. … The new electronic altimeters have an integrated ADM and are connected to pitot (for airspeed) and static pneumatics. All errors are corrected internally. This is extremely important for the new, demanding
requirements for reduced separation of aircraft. … It means that you have an altimeter that’s absolutely correct.” ■
— FSF Editorial Staff
Notes
1. Harris, David. Flight Instruments and Automatic Flight Control Systems. Oxford, England: Blackwell Science, 2004.
2. Carbaugh, Dave; Forsythe, Doug; McIntyre, Melville. “Erroneous Flight Instrument Information.” Boeing Aero No. 8 (October 1999).
3. Zachary, Jim. Telephone interview by Werfelman, Linda. Alexandria, Virginia, U.S. Nov. 12, 2004. Flight Safety Foundation, Alexandria, Virginia, U.S.
Pt
ASIASI
ADIRU
ALT
ALT
RightAIMS
LeftAIMS
PFDPFD
ADM
PTR
ADM
ADM
ADM
Ps
ADM
ADM
StandbyADM
LCDs
SAARU
ADM
Standby
Staticports
Staticports
Pitottube
Pitottubes
Figure 2Typical Flight Instrumentation on Modern, Fly-by-wire Airplanes
ADIRU = Air data inertial reference unit ADM = Air data module AIMS = Airplane information management system ALT = Altimeter ASI = Airspeed indicator LCD = Liquid crystal displayPFD = Primary fl ight display Ps = Static pressure Pt = Total pressure SAARU = Secondary attitude air data reference unit
Source: Adapted from Carbaugh, David C. “Erroneous Flight Instrument Information.” In Enhancing Safety in the 21st Century: Proceedings of the 52nd Annual International Air Safety Seminar. Alexandria, Virginia, U.S.: Flight Safety Foundation, 1999.
5FLIGHT SAFETY FOUNDATION • FLIGHT SAFETY DIGEST • NOVEMBER 2004
P R E C I S I O N I N A L T I T U D E M E A S U R E M E N T
Air Data Computers, Glass-cockpit Displays Improve Accuracy
Despite the findings about ASE drift, the precision of altitude information avail-
able on the fl ight deck has increased in recent years because of the development of the air data computer (ADC), air data inertial reference unit (ADIRU) and digital displays. Modern systems may include an ADIRU that receives informa-tion from air data modules (ADMs) connected to the airplane’s pitot probes and static pressure sources; the unit incorporates the best of that information (rejecting data that are incompat-ible with data produced by the other sources) to provide a single set of data to both pilots. Other standby ADMs provide information for standby fl ight instruments.7,8
Improvements in the accuracy of modern altim-eter systems, however, have not eliminated the possibility of critical altimeter-setting problems, which often result from human error.
Several factors related to barometric altimeters often have been associated with a fl ight crew’s loss of vertical situational awareness, which in turn has been associated with many controlled-fl ight-into-terrain (CFIT) accidents.9,10 These factors include confusion resulting from the use of different altitude and height reference systems and different altimeter-setting units of measurement.
In 1994, the Flight Safety Foundation (FSF) CFIT Task Force said, “Flight crew training is now used as a means of solving this problem, but consid-eration should be given to discontinuing the use of some altimeter designs and standardizing the use of altitude and height reference systems and altimeter-setting units of measurement.” Many of the Foundation’s recommendations have since been endorsed by ICAO, civil aviation authorities and aircraft operators in many countries.
ICAO has recommended procedures for provid-ing adequate vertical separation between aircraft and adequate terrain clearance, including what units should be used to measure air pressure, what settings should be used to display the measure-ment and when during a flight the settings
should be changed; nevertheless, many varia-tions are used by civil aviation authorities in different countries (see “ICAO Prescribes Basic Principles for Vertical Separation, Terrain Clearance,” page 6).11
Capt. David C. Carbaugh, chief pilot, fl ight opera-tions safety, Boeing Commercial Airplanes, said that, despite technological advances, “a human still has to set the altimeter, and it’ll display what it’s asked to display; if you ask it to display the wrong thing, that’s what it will display. It’s well-documented that the human is the weak link in altimetry.”12
Altimeter mis-setting has been identified as one of the top six causal factors associated with level busts,13 which are defi ned by the European Organisation for Safety of Air Navigation (Eurocontrol) as unauthorized vertical devia-tions from an ATC fl ight clearance of more than 300 feet outside RVSM airspace and more than 200 feet within RVSM airspace.14
“Level busts, or altitude deviations, are a poten-tially serious aviation hazard and occur when an aircraft fails to fl y at the level required for safe separation,” Eurocontrol said in the “Level Bust Briefi ng Notes,” a set of discussion papers included in the European Air Traffi c Management Level Bust Toolkit. (The tool kit is designed to raise awareness of the level bust issue among aircraft operators and air navigation service providers and to help them develop strategies to reduce level busts. Fourteen briefi ng notes are a fundamental part of the tool kit.)
“When … RVSM applies, the po-tential for a dangerous situation to arise is increased. This operational hazard may result in serious harm, either from a midair collision or from collision with the ground (CFIT),” the briefi ng notes said.
Studies have shown that an average of one level bust per commercial aircraft occurs each year, that one European country reports more than 500 level busts a year and that one major European airline reported 498 level busts from July 2000 to June 2002.15
6 FLIGHT SAFETY FOUNDATION • FLIGHT SAFETY DIGEST • NOVEMBER 2004
P R E C I S I O N I N A L T I T U D E M E A S U R E M E N T
ICAO Prescribes Basic Principles for Vertical Separation, Terrain Clearance
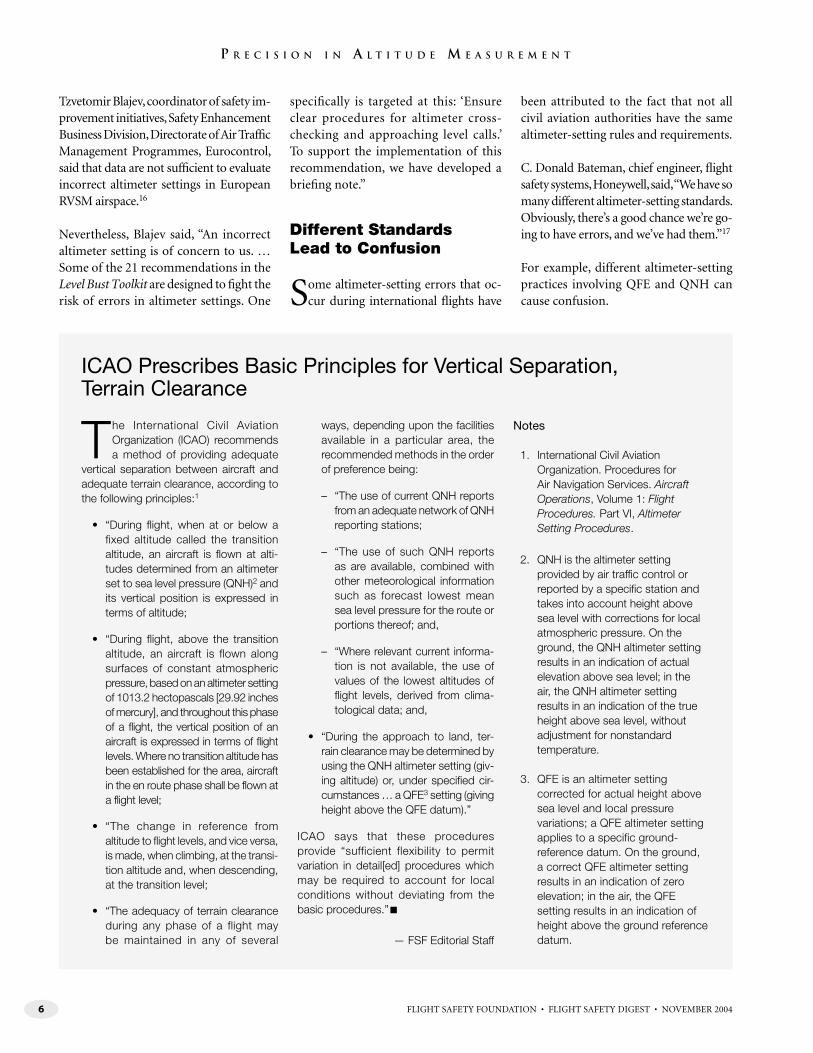
The International Civil Aviation Organization (ICAO) recommends a method of providing adequate
vertical separation between aircraft and adequate terrain clearance, according to the following principles:1
• “During flight, when at or below a fixed altitude called the transition altitude, an aircraft is flown at alti-tudes determined from an altimeter set to sea level pressure (QNH)2 and its vertical position is expressed in terms of altitude;
• “During flight, above the transition altitude, an aircraft is flown along surfaces of constant atmospheric pressure, based on an altimeter setting of 1013.2 hectopascals [29.92 inches of mercury], and throughout this phase of a flight, the vertical position of an aircraft is expressed in terms of flight levels. Where no transition altitude has been established for the area, aircraft in the en route phase shall be flown at a flight level;
• “The change in reference from altitude to flight levels, and vice versa, is made, when climbing, at the transi-tion altitude and, when descending, at the transition level;
• “The adequacy of terrain clearance during any phase of a flight may be maintained in any of several
ways, depending upon the facilities available in a particular area, the recommended methods in the order of preference being:
– “The use of current QNH reports from an adequate network of QNH reporting stations;
– “The use of such QNH reports as are available, combined with other meteorological information such as forecast lowest mean sea level pressure for the route or portions thereof; and,
– “Where relevant current informa-tion is not available, the use of values of the lowest altitudes of flight levels, derived from clima-tological data; and,
• “During the approach to land, ter-rain clearance may be determined by using the QNH altimeter setting (giv-ing altitude) or, under specified cir-cumstances … a QFE3 setting (giving height above the QFE datum).”
ICAO says that these procedures provide “sufficient flexibility to permit variation in detail[ed] procedures which may be required to account for local conditions without deviating from the basic procedures.” ■
— FSF Editorial Staff
Notes
1. International Civil Aviation Organization. Procedures for Air Navigation Services. Aircraft Operations, Volume 1: Flight Procedures. Part VI, Altimeter Setting Procedures.
2. QNH is the altimeter setting provided by air traffic control or reported by a specific station and takes into account height above sea level with corrections for local atmospheric pressure. On the ground, the QNH altimeter setting results in an indication of actual elevation above sea level; in the air, the QNH altimeter setting results in an indication of the true height above sea level, without adjustment for nonstandard temperature.
3. QFE is an altimeter setting corrected for actual height above sea level and local pressure variations; a QFE altimeter setting applies to a specific ground-reference datum. On the ground, a correct QFE altimeter setting results in an indication of zero elevation; in the air, the QFE setting results in an indication of height above the ground reference datum.
Tzvetomir Blajev, coordinator of safety im-provement initiatives, Safety Enhancement Business Division, Directorate of Air Traffi c Management Programmes, Eurocontrol, said that data are not suffi cient to evaluate incorrect altimeter settings in European RVSM airspace.16
Nevertheless, Blajev said, “An incorrect altimeter setting is of concern to us. … Some of the 21 recommendations in the Level Bust Toolkit are designed to fi ght the risk of errors in altimeter settings. One
specifi cally is targeted at this: ‘Ensure clear procedures for altimeter cross-checking and approaching level calls.’ To support the implementation of this recommendation, we have developed a briefi ng note.”
Different Standards Lead to Confusion
Some altimeter-setting errors that oc-cur during international fl ights have
been attributed to the fact that not all civil aviation authorities have the same altimeter-setting rules and requirements.
C. Donald Bateman, chief engineer, fl ight safety systems, Honeywell, said, “We have so many different altimeter-setting standards. Obviously, there’s a good chance we’re go-ing to have errors, and we’ve had them.”17
For example, different altimeter-setting practices involving QFE and QNH can cause confusion.
7FLIGHT SAFETY FOUNDATION • FLIGHT SAFETY DIGEST • NOVEMBER 2004
P R E C I S I O N I N A L T I T U D E M E A S U R E M E N T
QFE is an altimeter setting corrected for actual height above sea level and local pressure variations; a QFE altim-eter setting applies to a specifi c ground-reference datum. On the ground, a cor-rect QFE setting results in an indication of zero elevation; in the air, the QFE setting results in an indication of height above the ground-reference datum.
QNH is the altimeter setting provided by ATC or reported by a specifi c station and takes into account height above sea level with corrections for local atmospheric pressure. On the ground, the QNH al-timeter setting results in an indication of actual elevation above sea level; in the air, the QNH altimeter setting results in an indication of the true height above sea level, without adjustment for nonstan-dard temperature.
(Another “Q code” is QNE, which refers to the standard pressure altimeter setting of 1013.2 hectopascals [hPa], or 29.92 inches of mercury [in. Hg].)
Some operators require fl ight crews to set the altimeter to QFE in areas where QNH is used by ATC and by most other operators.
The FSF Approach-and-landing Accident Reduction (ALAR) Task Force said that us-ing QNH has two advantages: “eliminating the need to change the altimeter setting during operations below the transition altitude/fl ight level” and eliminating “the need to change the altimeter setting during a missed approach.” (Such a change usu-ally is required when QFE is used.)18
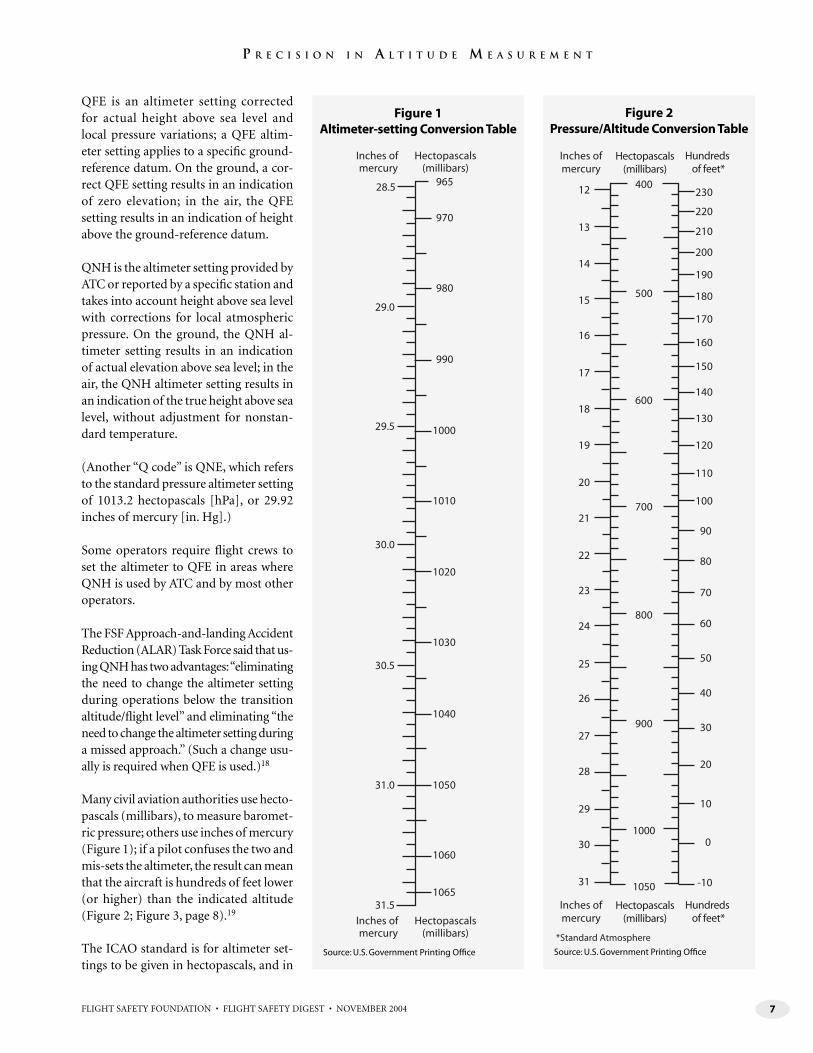
Many civil aviation authorities use hecto-pascals (millibars), to measure baromet-ric pressure; others use inches of mercury (Figure 1); if a pilot confuses the two and mis-sets the altimeter, the result can mean that the aircraft is hundreds of feet lower (or higher) than the indicated altitude (Figure 2; Figure 3, page 8).19
The ICAO standard is for altimeter set-tings to be given in hectopascals, and in
31.5
31.0
30.5
30.0
29.5
29.0
28.5
Inches ofmercury
Hectopascals(millibars)
Inches ofmercury
Hectopascals(millibars)
965
970
980
990
1000
1010
1020
1030
1040
1050
1060
1065
Figure 1Altimeter-setting Conversion Table
Source: U.S. Government Printing Offi ce
Figure 2Pressure/Altitude Conversion Table
Source: U.S. Government Printing Offi ce
31
30
29
28
27
26
25
24
23
22
21
20
19
18
17
16
15
14
13
12 400
500
600
700
800
900
1000
1050
Inches ofmercury
Hectopascals(millibars)
Hundredsof feet*
Inches ofmercury
Hectopascals(millibars)
Hundredsof feet*
0
10
20
30
40
50
60
70
80
90
100
110
120
130
140
150
160
170
180
190
200
210
220
230
-10
*Standard Atmosphere
8 FLIGHT SAFETY FOUNDATION • FLIGHT SAFETY DIGEST • NOVEMBER 2004
P R E C I S I O N I N A L T I T U D E M E A S U R E M E N T
1994, the Foundation recommended that all civil aviation authorities adopt hecto-pascals for altimeter settings to eliminate the “avoidable hazard of mis-setting the altimeter.”20
In 2000, the Foundation repeated the recommendation in its “ALAR Briefi ng Notes”:
When in. Hg is used for the altimeter setting, unusual barometric pressures, such as a 28.XX in. Hg (low pressure) or a 30.XX in. Hg (high pressure), may go undetected when listening to the … ATIS [automatic terminal information service] or ATC, result-ing in a more usual 29.XX altimeter setting being set.
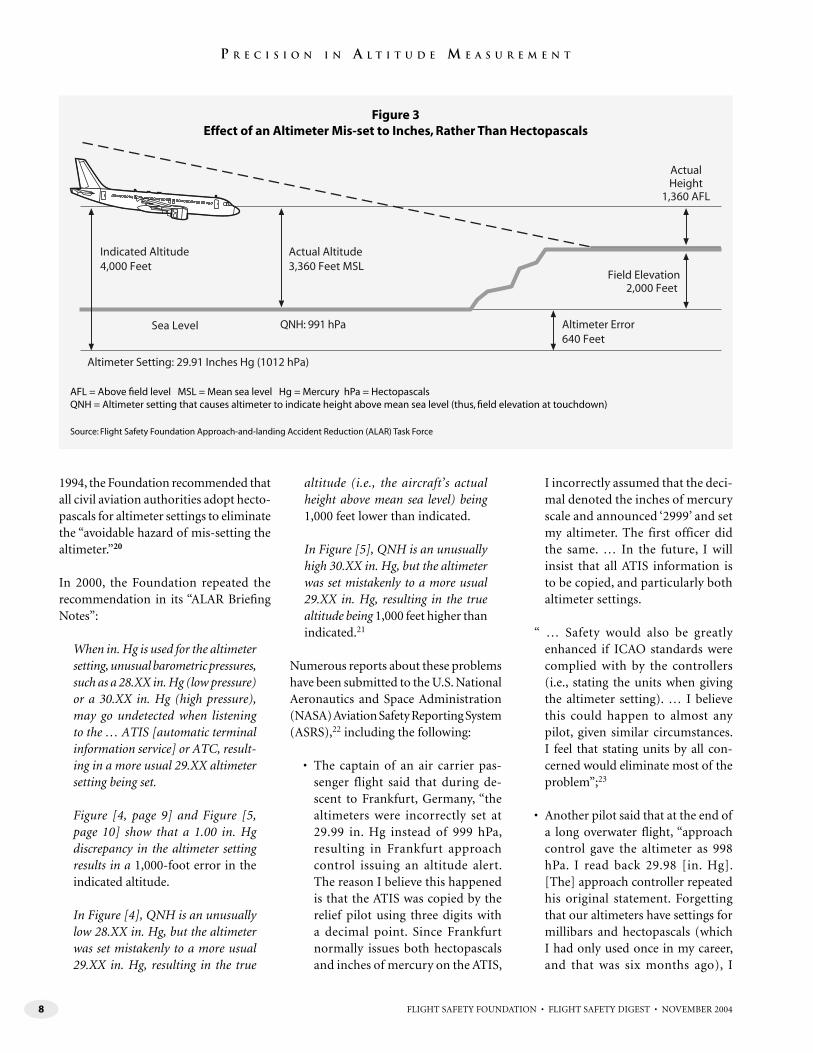
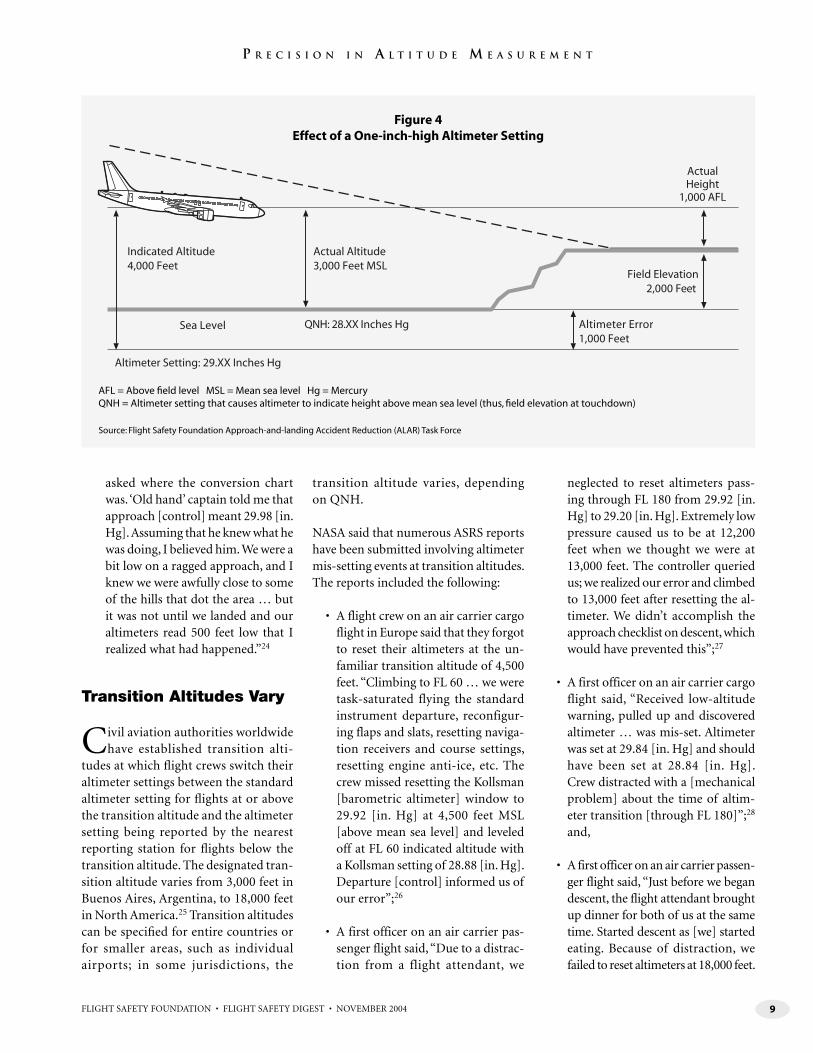
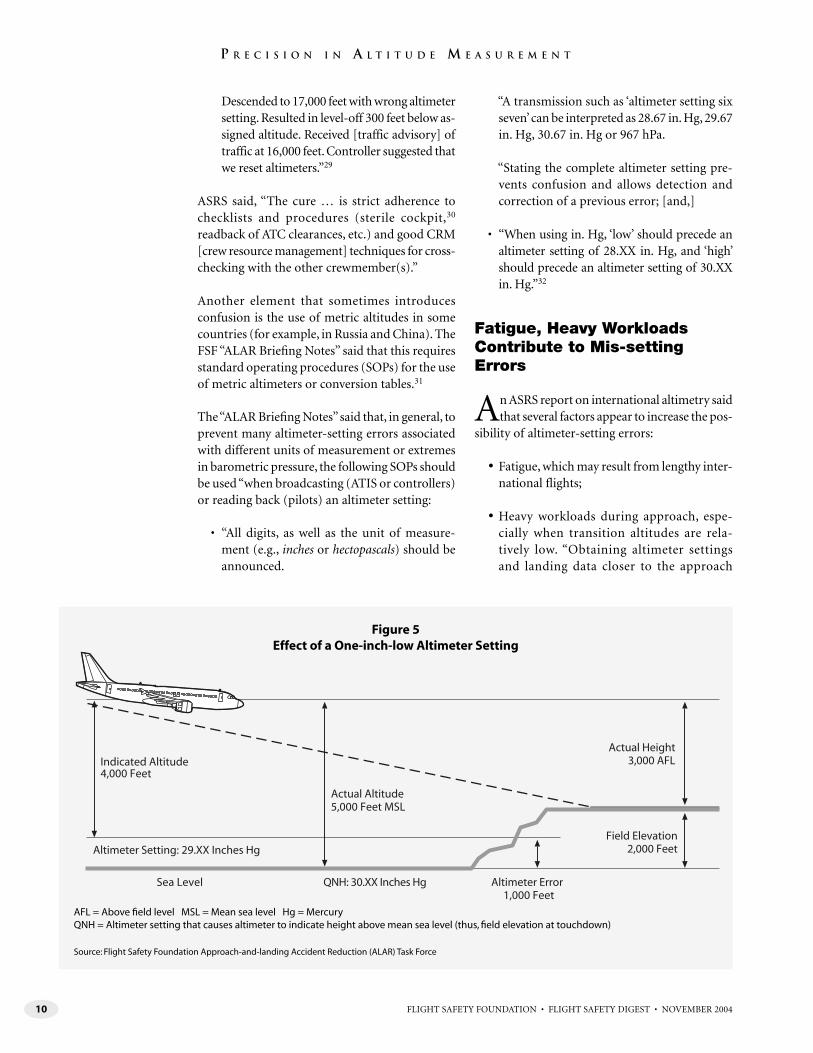
Figure [4, page 9] and Figure [5, page 10] show that a 1.00 in. Hg discrepancy in the altimeter setting results in a 1,000-foot error in the indicated altitude.
In Figure [4], QNH is an unusually low 28.XX in. Hg, but the altimeter was set mistakenly to a more usual 29.XX in. Hg, resulting in the true
altitude (i.e., the aircraft’s actual height above mean sea level) being 1,000 feet lower than indicated.
In Figure [5], QNH is an unusually high 30.XX in. Hg, but the altimeter was set mistakenly to a more usual 29.XX in. Hg, resulting in the true altitude being 1,000 feet higher than indicated.21
Numerous reports about these problems have been submitted to the U.S. National Aeronautics and Space Administration (NASA) Aviation Safety Reporting System (ASRS),22 including the following:
• The captain of an air carrier pas-senger flight said that during de-scent to Frankfurt, Germany, “the altimeters were incorrectly set at 29.99 in. Hg instead of 999 hPa, resulting in Frankfurt approach control issuing an altitude alert. The reason I believe this happened is that the ATIS was copied by the relief pilot using three digits with a decimal point. Since Frankfurt normally issues both hectopascals and inches of mercury on the ATIS,
I incorrectly assumed that the deci-mal denoted the inches of mercury scale and announced ‘2999’ and set my altimeter. The first officer did the same. … In the future, I will insist that all ATIS information is to be copied, and particularly both altimeter settings.
“ … Safety would also be greatly enhanced if ICAO standards were complied with by the controllers (i.e., stating the units when giving the altimeter setting). … I believe this could happen to almost any pilot, given similar circumstances. I feel that stating units by all con-cerned would eliminate most of the problem”;23
• Another pilot said that at the end of a long overwater flight, “approach control gave the altimeter as 998 hPa. I read back 29.98 [in. Hg]. [The] approach controller repeated his original statement. Forgetting that our altimeters have settings for millibars and hectopascals (which I had only used once in my career, and that was six months ago), I
Sea Level
Indicated Altitude4,000 Feet
Field Elevation2,000 Feet
ActualHeight
1,360 AFL
Altimeter Setting: 29.91 Inches Hg (1012 hPa)
QNH: 991 hPa
Actual Altitude3,360 Feet MSL
Altimeter Error640 Feet
Figure 3Effect of an Altimeter Mis-set to Inches, Rather Than Hectopascals
AFL = Above fi eld level MSL = Mean sea level Hg = Mercury hPa = HectopascalsQNH = Altimeter setting that causes altimeter to indicate height above mean sea level (thus, fi eld elevation at touchdown)
Source: Flight Safety Foundation Approach-and-landing Accident Reduction (ALAR) Task Force
9FLIGHT SAFETY FOUNDATION • FLIGHT SAFETY DIGEST • NOVEMBER 2004
P R E C I S I O N I N A L T I T U D E M E A S U R E M E N T
asked where the conversion chart was. ‘Old hand’ captain told me that approach [control] meant 29.98 [in. Hg]. Assuming that he knew what he was doing, I believed him. We were a bit low on a ragged approach, and I knew we were awfully close to some of the hills that dot the area … but it was not until we landed and our altimeters read 500 feet low that I realized what had happened.”24
Transition Altitudes Vary
Civil aviation authorities worldwide have established transition alti-
tudes at which fl ight crews switch their altimeter settings between the standard altimeter setting for fl ights at or above the transition altitude and the altimeter setting being reported by the nearest reporting station for fl ights below the transition altitude. The designated tran-sition altitude varies from 3,000 feet in Buenos Aires, Argentina, to 18,000 feet in North America.25 Transition altitudes can be specifi ed for entire countries or for smaller areas, such as individual airports; in some jurisdictions, the
transition altitude varies, depending on QNH.
NASA said that numerous ASRS reports have been submitted involving altimeter mis-setting events at transition altitudes. The reports included the following:
• A flight crew on an air carrier cargo flight in Europe said that they forgot to reset their altimeters at the un-familiar transition altitude of 4,500 feet. “Climbing to FL 60 … we were task-saturated flying the standard instrument departure, reconfigur-ing flaps and slats, resetting naviga-tion receivers and course settings, resetting engine anti-ice, etc. The crew missed resetting the Kollsman [barometric altimeter] window to 29.92 [in. Hg] at 4,500 feet MSL [above mean sea level] and leveled off at FL 60 indicated altitude with a Kollsman setting of 28.88 [in. Hg]. Departure [control] informed us of our error”;26
• A first officer on an air carrier pas-senger flight said, “Due to a distrac-tion from a flight attendant, we
neglected to reset altimeters pass-ing through FL 180 from 29.92 [in. Hg] to 29.20 [in. Hg]. Extremely low pressure caused us to be at 12,200 feet when we thought we were at 13,000 feet. The controller queried us; we realized our error and climbed to 13,000 feet after resetting the al-timeter. We didn’t accomplish the approach checklist on descent, which would have prevented this”;27
• A first officer on an air carrier cargo flight said, “Received low-altitude warning, pulled up and discovered altimeter … was mis-set. Altimeter was set at 29.84 [in. Hg] and should have been set at 28.84 [in. Hg]. Crew distracted with a [mechanical problem] about the time of altim-eter transition [through FL 180]”;28 and,
• A first officer on an air carrier passen-ger flight said, “Just before we began descent, the flight attendant brought up dinner for both of us at the same time. Started descent as [we] started eating. Because of distraction, we failed to reset altimeters at 18,000 feet.
Sea Level
Indicated Altitude4,000 Feet
Field Elevation2,000 Feet
ActualHeight
1,000 AFL
Altimeter Setting: 29.XX Inches Hg
QNH: 28.XX Inches Hg
Actual Altitude3,000 Feet MSL
Altimeter Error1,000 Feet
Figure 4Effect of a One-inch-high Altimeter Setting
AFL = Above fi eld level MSL = Mean sea level Hg = Mercury QNH = Altimeter setting that causes altimeter to indicate height above mean sea level (thus, fi eld elevation at touchdown)
Source: Flight Safety Foundation Approach-and-landing Accident Reduction (ALAR) Task Force
10 FLIGHT SAFETY FOUNDATION • FLIGHT SAFETY DIGEST • NOVEMBER 2004
P R E C I S I O N I N A L T I T U D E M E A S U R E M E N T
Descended to 17,000 feet with wrong altimeter setting. Resulted in level-off 300 feet below as-signed altitude. Received [traffic advisory] of traffic at 16,000 feet. Controller suggested that we reset altimeters.”29
ASRS said, “The cure … is strict adherence to checklists and procedures (sterile cockpit,30 readback of ATC clearances, etc.) and good CRM [crew resource management] techniques for cross-checking with the other crewmember(s).”
Another element that sometimes introduces confusion is the use of metric altitudes in some countries (for example, in Russia and China). The FSF “ALAR Briefi ng Notes” said that this requires standard operating procedures (SOPs) for the use of metric altimeters or conversion tables.31
The “ALAR Briefi ng Notes” said that, in general, to prevent many altimeter-setting errors associated with different units of measurement or extremes in barometric pressure, the following SOPs should be used “when broadcasting (ATIS or controllers) or reading back (pilots) an altimeter setting:
• “All digits, as well as the unit of measure-ment (e.g., inches or hectopascals) should be announced.
“A transmission such as ‘altimeter setting six seven’ can be interpreted as 28.67 in. Hg, 29.67 in. Hg, 30.67 in. Hg or 967 hPa.
“Stating the complete altimeter setting pre-vents confusion and allows detection and correction of a previous error; [and,]
• “When using in. Hg, ‘low’ should precede an altimeter setting of 28.XX in. Hg, and ‘high’ should precede an altimeter setting of 30.XX in. Hg.”32
Fatigue, Heavy Workloads Contribute to Mis-setting Errors
An ASRS report on international altimetry said that several factors appear to increase the pos-
sibility of altimeter-setting errors:
• Fatigue, which may result from lengthy inter-national flights;
• Heavy workloads during approach, espe-cially when transition altitudes are rela-tively low. “Obtaining altimeter settings and landing data closer to the approach
Sea Level
Indicated Altitude4,000 Feet
Field Elevation2,000 Feet
Actual Height3,000 AFL
Altimeter Setting: 29.XX Inches Hg
QNH: 30.XX Inches Hg
Actual Altitude5,000 Feet MSL
Altimeter Error1,000 Feet
Figure 5Effect of a One-inch-low Altimeter Setting
AFL = Above fi eld level MSL = Mean sea level Hg = Mercury QNH = Altimeter setting that causes altimeter to indicate height above mean sea level (thus, fi eld elevation at touchdown)
Source: Flight Safety Foundation Approach-and-landing Accident Reduction (ALAR) Task Force
11FLIGHT SAFETY FOUNDATION • FLIGHT SAFETY DIGEST • NOVEMBER 2004
P R E C I S I O N I N A L T I T U D E M E A S U R E M E N T
segment complicates the task of preparing data for landing at the very time the flight crew may be most fatigued”;
• Language difficulties, including “rapid deliv-ery of clearances … , unfamiliar accents and contraction of hPa (hectopascals) or mb (mil-libars). … Other flight crews communicating in their native [languages] contribute to a lack of awareness of what other traffic is doing”;
• Communication procedures in which one person receives approach and landing infor-mation and conveys the information to the rest of the flight crew. This procedure “means that a misconception or misunderstanding is less likely to be detected until too late”; and,
• Cockpit management, which “often [pro-vides] inadequate crew briefing for ap-proach and landing, with no mention of how the altimeter setting will be expressed — that is, [inches of mercury], [millibars] or [hectopascals]. Flight crews also may not ad-equately review approach charts for informa-tion. Some airlines do not provide the second officer with approach [charts]; unless he or she makes an extra effort to look at one of the pilot’s charts, the altimeter-setting standard may be unknown.” (In addition, some airlines provide only one set of approach charts for the captain and first officer to share.)33
The ASRS report contained several recommenda-tions, including having each fl ight crewmember “pay particular attention” during the review of approach charts before the descent to whether altimeter settings will be given in inches, milli-bars or hectopascals; ensuring that the approach briefi ng includes mention of how the altimeter setting will be expressed; enabling more than one fl ight crewmember to hear ATC clearances and ATIS messages; and complying with proper crew coordination standards by cross-checking other crewmembers for accurate communication and procedures.
‘Odd’ Altimeter Settings Should Prompt Questions
Some of the most frequent errors involving incorrect altimeter settings occur because
the barometric pressure is unusu-ally high or unusually low — and because when pilots hear the un-expected altimeter settings, they inadvertently select the more familiar altimeter settings that they had expected. The result can be that an aircraft is hundreds of feet lower (or higher) than the indicated altitude.
For example, in a report submitted to ASRS, the fi rst offi cer of an air carrier cargo fl ight described the following event, which occurred in December 1994, during approach to Anchorage, Alaska, U.S., after a fl ight from Hong Kong:
Destination weather [included an altimeter setting of] 28.83 [in. Hg]. Prior to initial descent, the second offi cer received and put the ATIS in-formation on the landing bug card, except that the altimeter was written as 29.83 [in. Hg]. We were initially cleared to 13,000 feet. I repeated the descent clearance and gave the altimeter as 29.83 [in. Hg]. Center did not catch this in my readback. [On fi nal approach], the second offi cer noticed the radio altimeter at 800 feet and the barometric altimeter at approximately 1,800 feet. … The captain started a go-around at the same time the tower reported they had a low-altitude alert warning from us. ... As we taxied, we heard the tower tell another aircraft they had a low-altitude alert. … Was this [due] to an improper altimeter setting, too?34
ASRS said that reports involving unexpected al-timeter settings are fi led “in bunches, as numerous fl ight crews experience the same problem on the same day in a particular area that is encountering unusual barometric pressures.”35
Other errors occur when pilots misunderstand altimeter settings they receive from ATC or in-correctly copy an altimeter setting. The following ASRS reports are examples:
• “The 30.06 [in. Hg] altimeter setting we used was actually the wind speed and direction and was written [as] 3006,” a Boeing 767 first of-ficer said. “In my mind, this was a reasonable
12 FLIGHT SAFETY FOUNDATION • FLIGHT SAFETY DIGEST • NOVEMBER 2004
P R E C I S I O N I N A L T I T U D E M E A S U R E M E N T
altimeter setting. The ATIS setting was actu-ally 29.54 [in. Hg]”;36
• “The altimeter [setting] was 28.84 [in. Hg],” the second officer on a cargo flight said. “I remember enlarging the 8s with two circles on top of each other, thinking this would be sufficient in drawing attention to the low al-timeter setting. The next crew after our flight found the altimeter to be set at 29.84 [in. Hg] instead of the actual 28.84 [in. Hg] setting”;37 and,
• “The pilot not flying understood [the] ATIS recording to state altimeter setting to be 29.99 [in. Hg] when actually the setting was 29.29 [in. Hg],” the captain of an MD-83 passenger flight said. He suggested that “slower, more pronounced ATIS recordings” might help avoid similar problems.38
Some controllers emphasize the altimeter setting when the barometric pressure is unusually low, but typically this is not a requirement.
Altimeter Design Can Cause Mis-reading of Indicator
Sometimes, even though the altimeter setting has been selected correctly, errors occur in
reading an altimeter. In 1994, the Foundation in-cluded among its recommendations to reduce the worldwide CFIT accident rate a request that ICAO issue a warning against the use of three-pointer altimeters and drum-pointer altimeters.
“The misreading of these types of altimeters is well documented,” the Foundation said.39
In 1998, ICAO adopted amendments to its standards and recommended practices to prohibit the use of these altimeters in commercial aircraft operated under instrument flight rules (IFR), citing a “long history of misreadings.”40
Before the adoption of those amendments, a Nov. 14, 1990, ac-cident occurred in which an Alitalia McDonnell Douglas DC-9-32 struck
a mountain during a night instrument landing system (ILS) approach to Kloten Airport in Zurich, Switzerland. The accident report said that, among other problems, the fl ight crew “probably misread the [drum-pointer] altimeter during the approach and hence did not realize that the aircraft was considerably below the glide path.” The airplane was destroyed, and all 46 people in the airplane were killed.41
The report said that drum-pointer altimeters are “less easy to read correctly, especially during periods of high workload” than other altimeters. “A quick look after being distracted can usually induce a reading 1,000 feet off, if the barrel drum is halfway between thousands,” the report said.
In a report submitted to ASRS, the single pilot of a small corporate airplane described a similar altimeter-reading problem:
I was assigned 5,000 feet [by ATC]. I thought I was getting ready to level off at 5,000 feet, and departure [control] asked what altitude I was climbing to. I realized I was at 5,700 feet instead of 4,700 feet. This altimeter [makes it] diffi cult to tell sometimes what the altitude is because the 1,000-foot indicators are in a window to the left. No excuse. I simply looked at it wrong. I know it is diffi cult to read, so I should have been more alert.42
In some incidents, especially when barometric pressure is fl uctuating, fl ight crews operate with-out the most current altimeter settings.
For example, the crew of an American Airlines McDonnell Douglas MD-83 was conducting a very-high-frequency omnidirectional radio (VOR) approach to Bradley International Airport in Windsor Locks, Connecticut, U.S., in night in-strument meteorological conditions (IMC) on Nov. 12, 1995, when the fi rst offi cer glanced at the altimeter and observed that the airplane was below the minimum descent altitude. He told the captain, who was the pilot fl ying. Moments later, the airplane struck trees on a ridge about 2.5 nautical miles (4.6 kilometers) northwest of the approach end of the runway. The captain began a go-around, applying all available power; the airplane struck the localizer antenna array at the end of a safety overrun area, landed on a stopway and rolled down the runway.43
13FLIGHT SAFETY FOUNDATION • FLIGHT SAFETY DIGEST • NOVEMBER 2004
P R E C I S I O N I N A L T I T U D E M E A S U R E M E N T
The airplane received minor damage. One pas-senger received minor injuries; the 77 other people in the airplane were not injured.
When the accident occurred, the indicated alti-tude on the altimeter, using the QFE method, was “about 76 feet too high … resulting in the airplane being 76 feet lower than indicated on the primary altimeters,” the U.S. National Transportation Safety Board said in the fi nal report on the ac-cident. The report said that the probable cause of the accident was “the fl ight crew’s failure to maintain the required minimum descent altitude until the required visual references identifi able with the runway were in sight.” Contributing fac-tors were “the failure of the … approach controller to furnish the fl ight crew with a current altimeter setting, and the fl ight crew’s failure to ask for a more current setting.”
Occasionally, in remote areas, fl ights are con-ducted far from weather-reporting stations. Rarely, the altimeter setting provided by ATC is inaccurate.
The pilot of a small business airplane said that, as he was flying his airplane near Lake Michigan, U.S., at an indicated altitude of 17,000 feet, ATC “reported my altitude encoder indicated 16,000 feet on the readout. I had departed [un-der visual flight rules] and picked up my IFR clearance at about 4,000 feet. … I had set the [altimeter setting] as provided by [ATC] when clearance was provided. I was approaching a cold front, which was lying north to south over Lake Michigan. I asked for an altimeter setting. The setting provided was one inch lower than the previously provided setting (about 100 nautical miles [185 kilometers] earlier). I reset my altimeter. … After the reset, my altimeter now indicated 16,000 feet … The problem was evidently a very steep pressure gradient behind the cold front.”44
In 1997, ASRS reviewed its database, as well as accident reports and incident reports of the Canadian Aviation Safety Board (predecessor of the Transportation Safety Board of Canada), and found that most altimeter mis-setting incidents that occurred during periods of extremely low barometric pressure occurred in very cold loca-tions or in areas known for severe weather and unusual frontal systems. A number of reports were
fi led from northern Europe, includ-ing Brussels, Belgium; Copenhagen, Denmark; Frankfurt, Germany; Keflavik, Iceland; and Moscow, Russia.45
Temperature Errors Sometimes Are Overlooked
Just as pilots adjust the altimeter settings for nonstandard air pres-
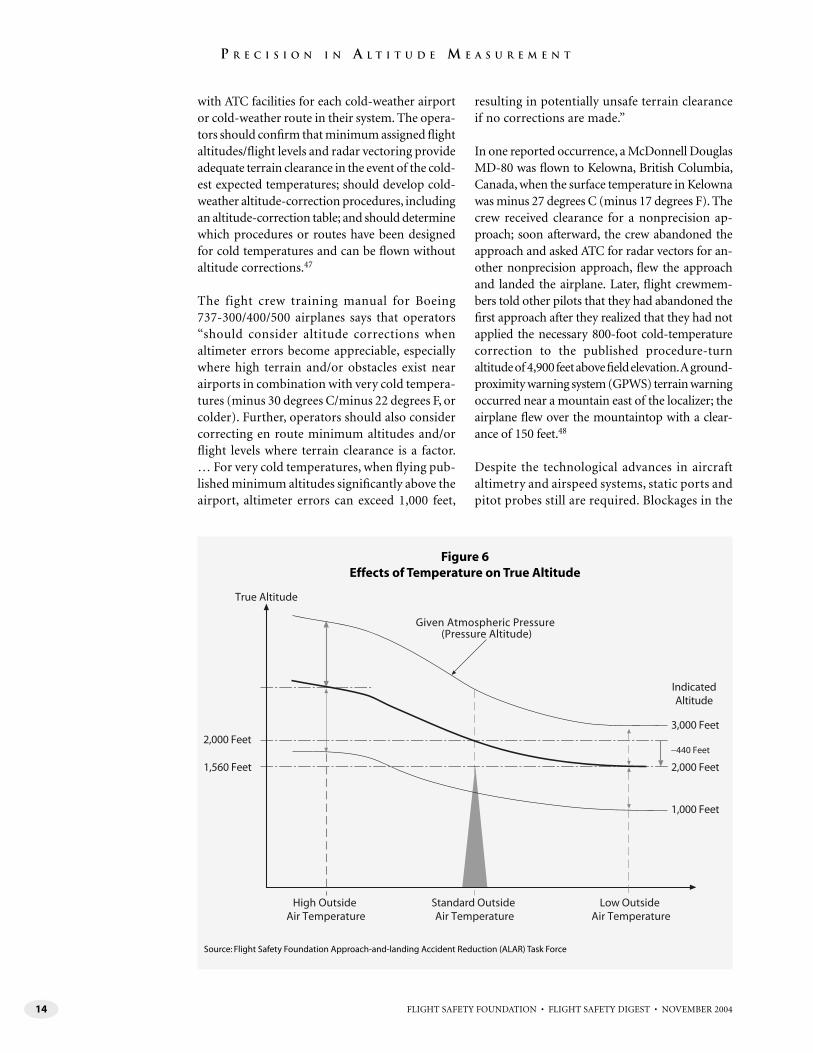
sure, a correction also is required — in some situations — for non-standard air temperature. When the air temperature is warmer than the standard tem-perature for a specifi c height in the atmosphere, the true altitude is higher than the altitude indi-cated on the altimeter. When the air temperature is colder than the standard temperature, the true altitude is lower than the indicated altitude. Moreover, in extremely cold temperatures, the true altitude may be several hundred feet lower (Figure 6, page 14).
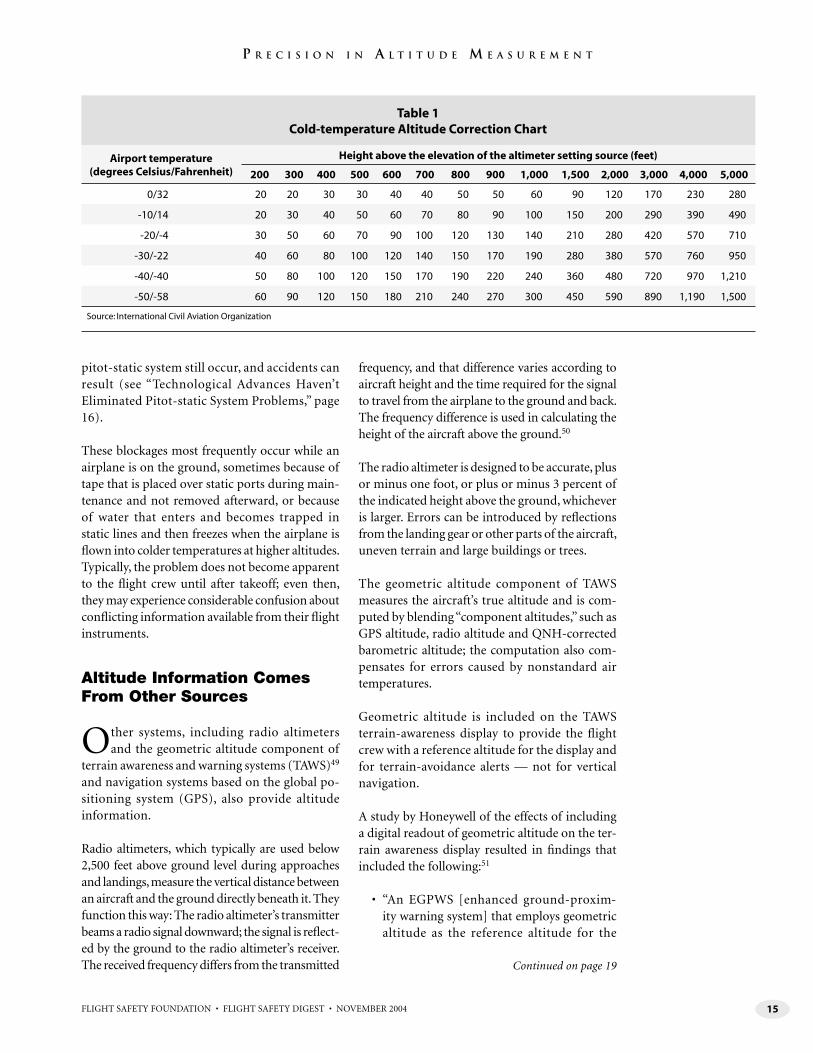
ICAO says that when the ambient temperature on the surface is “much lower than that predicted by the standard atmosphere,” a correction must be made, and the calculated minimum safe altitudes must be increased accordingly.
“In such conditions, an approximate correction is 4 percent height increase for every 10 degrees Celsius (C) below the standard temperature, as measured at the altimeter-setting source,” ICAO says. “This is safe for all altimeter-setting source altitudes for temperatures above minus 15 degrees C [fi ve degrees Fahrenheit (F)].”46
ICAO says that for colder temperatures, temperature-correction tables should be used.
ICAO’s temperature-correction table shows, for example, that if the ambient temperature on the surface is minus 20 degrees C (minus 4 degrees F), and the airplane is being fl own 1,000 feet above the altimeter-setting source, the pilot should add 140 feet to published procedure altitudes; at 5,000 feet, the pilot should add 710 feet (Table 1, page 15).
Typically, operators should coordinate the han-dling of cold-temperature altitude corrections
14 FLIGHT SAFETY FOUNDATION • FLIGHT SAFETY DIGEST • NOVEMBER 2004
P R E C I S I O N I N A L T I T U D E M E A S U R E M E N T
with ATC facilities for each cold-weather airport or cold-weather route in their system. The opera-tors should confi rm that minimum assigned fl ight altitudes/fl ight levels and radar vectoring provide adequate terrain clearance in the event of the cold-est expected temperatures; should develop cold-weather altitude-correction procedures, including an altitude-correction table; and should determine which procedures or routes have been designed for cold temperatures and can be fl own without altitude corrections.47
The fight crew training manual for Boeing 737-300/400/500 airplanes says that operators “should consider altitude corrections when altimeter errors become appreciable, especially where high terrain and/or obstacles exist near airports in combination with very cold tempera-tures (minus 30 degrees C/minus 22 degrees F, or colder). Further, operators should also consider correcting en route minimum altitudes and/or fl ight levels where terrain clearance is a factor. … For very cold temperatures, when fl ying pub-lished minimum altitudes signifi cantly above the airport, altimeter errors can exceed 1,000 feet,
resulting in potentially unsafe terrain clearance if no corrections are made.”
In one reported occurrence, a McDonnell Douglas MD-80 was fl own to Kelowna, British Columbia, Canada, when the surface temperature in Kelowna was minus 27 degrees C (minus 17 degrees F). The crew received clearance for a nonprecision ap-proach; soon afterward, the crew abandoned the approach and asked ATC for radar vectors for an-other nonprecision approach, fl ew the approach and landed the airplane. Later, fl ight crewmem-bers told other pilots that they had abandoned the fi rst approach after they realized that they had not applied the necessary 800-foot cold-temperature correction to the published procedure-turn altitude of 4,900 feet above fi eld elevation. A ground-proximity warning system (GPWS) terrain warning occurred near a mountain east of the localizer; the airplane fl ew over the mountaintop with a clear-ance of 150 feet.48
Despite the technological advances in aircraft altimetry and airspeed systems, static ports and pitot probes still are required. Blockages in the
Given Atmospheric Pressure(Pressure Altitude)
True Altitude
Low OutsideAir Temperature
High OutsideAir Temperature
IndicatedAltitude
2,000 Feet3,000 Feet
2,000 Feet
1,000 Feet
Standard OutsideAir Temperature
1,560 Feet
−440 Feet
Figure 6Effects of Temperature on True Altitude
Source: Flight Safety Foundation Approach-and-landing Accident Reduction (ALAR) Task Force
15FLIGHT SAFETY FOUNDATION • FLIGHT SAFETY DIGEST • NOVEMBER 2004
P R E C I S I O N I N A L T I T U D E M E A S U R E M E N T
pitot-static system still occur, and accidents can result (see “Technological Advances Haven’t Eliminated Pitot-static System Problems,” page 16).
These blockages most frequently occur while an airplane is on the ground, sometimes because of tape that is placed over static ports during main-tenance and not removed afterward, or because of water that enters and becomes trapped in static lines and then freezes when the airplane is fl own into colder temperatures at higher altitudes. Typically, the problem does not become apparent to the fl ight crew until after takeoff; even then, they may experience considerable confusion about confl icting information available from their fl ight instruments.
Altitude Information Comes From Other Sources
Other systems, including radio altimeters and the geometric altitude component of
terrain awareness and warning systems (TAWS)49 and navigation systems based on the global po-sitioning system (GPS), also provide altitude information.
Radio altimeters, which typically are used below 2,500 feet above ground level during approaches and landings, measure the vertical distance between an aircraft and the ground directly beneath it. They function this way: The radio altimeter’s transmitter beams a radio signal downward; the signal is refl ect-ed by the ground to the radio altimeter’s receiver. The received frequency differs from the transmitted
frequency, and that difference varies according to aircraft height and the time required for the signal to travel from the airplane to the ground and back. The frequency difference is used in calculating the height of the aircraft above the ground.50
The radio altimeter is designed to be accurate, plus or minus one foot, or plus or minus 3 percent of the indicated height above the ground, whichever is larger. Errors can be introduced by refl ections from the landing gear or other parts of the aircraft, uneven terrain and large buildings or trees.
The geometric altitude component of TAWS measures the aircraft’s true altitude and is com-puted by blending “component altitudes,” such as GPS altitude, radio altitude and QNH-corrected barometric altitude; the computation also com-pensates for errors caused by nonstandard air temperatures.
Geometric altitude is included on the TAWS terrain-awareness display to provide the fl ight crew with a reference altitude for the display and for terrain-avoidance alerts — not for vertical navigation.
A study by Honeywell of the effects of including a digital readout of geometric altitude on the ter-rain awareness display resulted in fi ndings that included the following:51
• “An EGPWS [enhanced ground-proxim-ity warning system] that employs geometric altitude as the reference altitude for the
Table 1Cold-temperature Altitude Correction Chart
Airport temperature (degrees Celsius/Fahrenheit)
Height above the elevation of the altimeter setting source (feet)
200 300 400 500 600 700 800 900 1,000 1,500 2,000 3,000 4,000 5,000
0/32 20 20 30 30 40 40 50 50 60 90 120 170 230 280
-10/14 20 30 40 50 60 70 80 90 100 150 200 290 390 490
-20/-4 30 50 60 70 90 100 120 130 140 210 280 420 570 710
-30/-22 40 60 80 100 120 140 150 170 190 280 380 570 760 950
-40/-40 50 80 100 120 150 170 190 220 240 360 480 720 970 1,210
-50/-58 60 90 120 150 180 210 240 270 300 450 590 890 1,190 1,500
Source: International Civil Aviation Organization
Continued on page 19
16 FLIGHT SAFETY FOUNDATION • FLIGHT SAFETY DIGEST • NOVEMBER 2004
P R E C I S I O N I N A L T I T U D E M E A S U R E M E N T
Technological Advances Haven’t Eliminated Pitot-static System Problems
Despite many technological advances that have led to the development of aircraft systems capable of precise
altitude and airspeed measurements, conventional pressure altimeters and airspeed indicators depend on simple static ports and pitot probes to function correctly. Pitot-static system problems continue to occur and — rarely — become factors in accidents.
“The fact that these accidents occur infrequently can contribute to the ‘startle’ factor [that] flight crews experience, leaving them uncertain about how to respond to the anomaly,” said Capt. David C. Carbaugh, chief pilot, flight operations safety, Boeing Commercial Airplanes.1
One such accident involved an Aeroperu Boeing 757-200 that struck the Pacific Ocean off the coast of Lima, Peru, on Oct. 2, 1996, about 30 minutes after takeoff from Jorge Chavez International Airport in Lima on a night flight to Santiago, Chile. The airplane was destroyed, and all 70 people in the airplane were killed.2 The flight crew had realized immediately after liftoff that their altimeters and airspeed indicators were not providing correct information and had declared an emergency, but they were unable to diagnose the problem and to safely land the airplane.
The final report by the Peruvian General Director of Air Transport Commission of Accident Investigations said that the probable cause of the accident was adhesive tape that was not removed from the static ports after maintenance; the captain did not observe the tape during his walk-around preflight inspection.
The report said that during the takeoff roll, airspeed indications and altitude indications were normal; afterward, however, altimeter indications increased too slowly, and the indicated airspeed (IAS) was too slow. A wind shear warning was activated three times, although wind was relatively calm and there was no
significant weather. The ground-proximity warning system repeatedly sounded warnings of “TOO LOW TERRAIN” and “SINK RATE.”
About one minute before the airplane struck the water, as the “TOO LOW TERRAIN” warning sounded, there was no reaction from the crew, who believed an altimeter indication that the airplane was at 9,700 feet.
The report said that the cockpit voice recorder showed that the captain was “confused in his reactions … and [hesitant] with his commands,” while the first officer displayed “equivalent confusion.” Neither pilot identified the cause of the problem.
Erroneous airspeed indications have been cited in several accidents, including a Feb. 6, 1996, accident in which a B-757-200 struck the Caribbean Sea off the northern coast of the Dominican Republic about five minutes after takeoff from Gregorio Luperon International Airport in Puerto Plata for a flight to Frankfurt, Germany. The airplane — which was operated by Birgenair, a charter company in Istanbul, Turkey, for Alas Nacionales, a Dominican airline — was destroyed, and all 189 occupants were killed.3
In the final report, the Dominican Junta Investigadora de Accidentes Aéreos said that the probable cause of the accident was “the failure on the part of the flight crew to recognize the activation of the stick shaker as an imminent warning of [an] aerodynamic stall and their failure to execute proper procedures for recovery [from] the control loss.”
The report said, “Before activation of the stick shaker, confusion of the flight crew occurred due to the erroneous indication of an increase in airspeed [on the captain’s airspeed indicator] and a subsequent overspeed warning.”
The erroneous airspeed indication and the erroneous overspeed warning resulted
from an obstruction of the airplane’s upper-left pitot tube.
The report said that the airplane had not been flown for 20 days before the accident and that, during that time, routine maintenance had been performed, including an inspection and ground test of the engines. Investigators believed that engine covers and pitot covers were not installed before or after the ground test.
During the takeoff roll, the captain determined that his airspeed indicator was not working; four other sources of airspeed information were available, and he continued the takeoff “contrary to the established procedures,” the report said.
During climbout, the crew decided that the captain’s airspeed indicator and the first officer’s airspeed indicator were providing incorrect indications and that the alternate airspeed indicator was providing correct information. Nevertheless, none of the three flight crewmembers (the captain, the first officer and a relief captain) suggested “the appropriate course of action to compare the indications or to switch the instrument selector [to the alternate source] to derive airspeed information from the [first officer’s air data computer] and its pitot system,” the report said.
The wreckage of the airplane was not recovered, and the cause of the pitot-system obstruction was not determined, but the report said that the obstruction likely resulted from “mud and/or debris from a small insect that was introduced in the pitot tube during the time the aircraft was on the ground in Puerto Plata.”
Pitot-static System Problems Have Many Causes
Other aircraft accident reports and incident reports have identified numerous causes of malfunctions in static ports and pitot probes, including
17FLIGHT SAFETY FOUNDATION • FLIGHT SAFETY DIGEST • NOVEMBER 2004
P R E C I S I O N I N A L T I T U D E M E A S U R E M E N T
disconnected or leaking static lines or pitot lines, trapped water in static lines or pitot lines, icing of static ports or pitot probes, blockage of static ports or pitot probes by insects, static-port covers or pitot-probe covers that were not removed before flight, and static-port drain caps that were not replaced following maintenance.4,5
“Even the fancy new pitot-static systems still have a probe that sticks out into the airflow, and they still require information from the probe,” Carbaugh said.
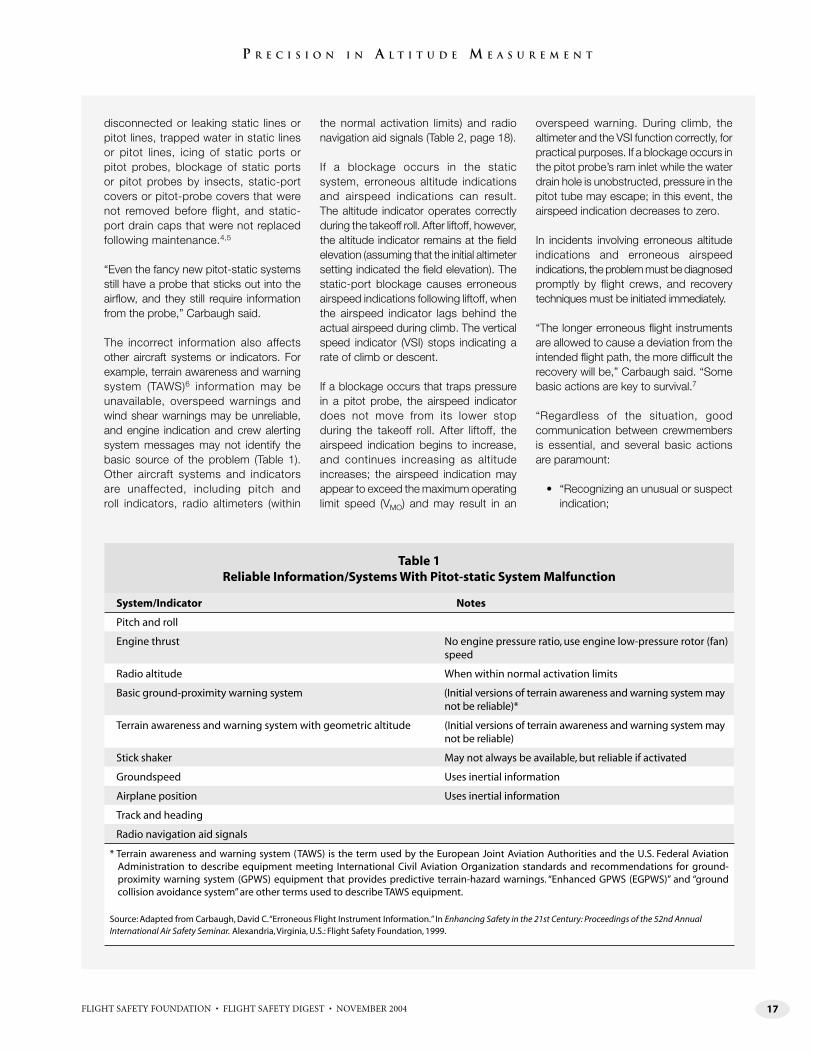
The incorrect information also affects other aircraft systems or indicators. For example, terrain awareness and warning system (TAWS)6 information may be unavailable, overspeed warnings and wind shear warnings may be unreliable, and engine indication and crew alerting system messages may not identify the basic source of the problem (Table 1). Other aircraft systems and indicators are unaffected, including pitch and roll indicators, radio altimeters (within
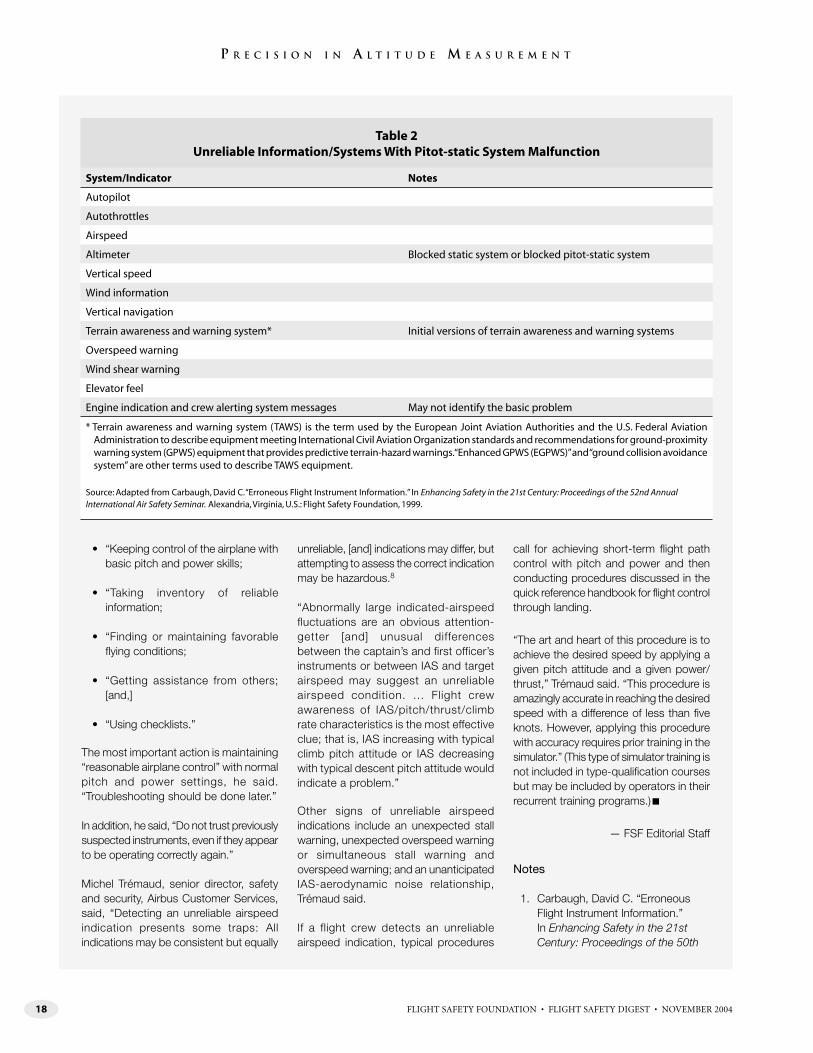
the normal activation limits) and radio navigation aid signals (Table 2, page 18).
If a blockage occurs in the static system, erroneous altitude indications and airspeed indications can result. The altitude indicator operates correctly during the takeoff roll. After liftoff, however, the altitude indicator remains at the field elevation (assuming that the initial altimeter setting indicated the field elevation). The static-port blockage causes erroneous airspeed indications following liftoff, when the airspeed indicator lags behind the actual airspeed during climb. The vertical speed indicator (VSI) stops indicating a rate of climb or descent.
If a blockage occurs that traps pressure in a pitot probe, the airspeed indicator does not move from its lower stop during the takeoff roll. After liftoff, the airspeed indication begins to increase, and continues increasing as altitude increases; the airspeed indication may appear to exceed the maximum operating limit speed (VMO) and may result in an
overspeed warning. During climb, the altimeter and the VSI function correctly, for practical purposes. If a blockage occurs in the pitot probe’s ram inlet while the water drain hole is unobstructed, pressure in the pitot tube may escape; in this event, the airspeed indication decreases to zero.
In incidents involving erroneous altitude indications and erroneous airspeed indications, the problem must be diagnosed promptly by flight crews, and recovery techniques must be initiated immediately.
“The longer erroneous flight instruments are allowed to cause a deviation from the intended flight path, the more difficult the recovery will be,” Carbaugh said. “Some basic actions are key to survival.7
“Regardless of the situation, good communication between crewmembers is essential, and several basic actions are paramount:
• “Recognizing an unusual or suspect indication;
Table 1 Reliable Information/Systems With Pitot-static System Malfunction
System/Indicator Notes
Pitch and roll
Engine thrust No engine pressure ratio, use engine low-pressure rotor (fan) speed
Radio altitude When within normal activation limits
Basic ground-proximity warning system (Initial versions of terrain awareness and warning system may not be reliable)*
Terrain awareness and warning system with geometric altitude (Initial versions of terrain awareness and warning system may not be reliable)
Stick shaker May not always be available, but reliable if activated
Groundspeed Uses inertial information
Airplane position Uses inertial information
Track and heading
Radio navigation aid signals
* Terrain awareness and warning system (TAWS) is the term used by the European Joint Aviation Authorities and the U.S. Federal Aviation Administration to describe equipment meeting International Civil Aviation Organization standards and recommendations for ground-proximity warning system (GPWS) equipment that provides predictive terrain-hazard warnings. “Enhanced GPWS (EGPWS)” and “ground collision avoidance system” are other terms used to describe TAWS equipment.
Source: Adapted from Carbaugh, David C. “Erroneous Flight Instrument Information.” In Enhancing Safety in the 21st Century: Proceedings of the 52nd Annual International Air Safety Seminar. Alexandria, Virginia, U.S.: Flight Safety Foundation, 1999.
18 FLIGHT SAFETY FOUNDATION • FLIGHT SAFETY DIGEST • NOVEMBER 2004
P R E C I S I O N I N A L T I T U D E M E A S U R E M E N T
• “Keeping control of the airplane with basic pitch and power skills;
• “Taking inventory of reliable information;
• “Finding or maintaining favorable flying conditions;
• “Getting assistance from others; [and,]
• “Using checklists.”
The most important action is maintaining “reasonable airplane control” with normal pitch and power settings, he said. “Troubleshooting should be done later.”
In addition, he said, “Do not trust previously suspected instruments, even if they appear to be operating correctly again.”
Michel Trémaud, senior director, safety and security, Airbus Customer Services, said, “Detecting an unreliable airspeed indication presents some traps: All indications may be consistent but equally
unreliable, [and] indications may differ, but attempting to assess the correct indication may be hazardous.8
“Abnormally large indicated-airspeed fluctuations are an obvious attention-getter [and] unusual differences between the captain’s and first officer’s instruments or between IAS and target airspeed may suggest an unreliable airspeed condition. … Flight crew awareness of IAS/pitch/thrust/climb rate characteristics is the most effective clue; that is, IAS increasing with typical climb pitch attitude or IAS decreasing with typical descent pitch attitude would indicate a problem.”
Other signs of unreliable airspeed indications include an unexpected stall warning, unexpected overspeed warning or simultaneous stall warning and overspeed warning; and an unanticipated IAS-aerodynamic noise relationship, Trémaud said.
If a flight crew detects an unreliable airspeed indication, typical procedures
call for achieving short-term flight path control with pitch and power and then conducting procedures discussed in the quick reference handbook for flight control through landing.
“The art and heart of this procedure is to achieve the desired speed by applying a given pitch attitude and a given power/thrust,” Trémaud said. “This procedure is amazingly accurate in reaching the desired speed with a difference of less than five knots. However, applying this procedure with accuracy requires prior training in the simulator.” (This type of simulator training is not included in type-qualification courses but may be included by operators in their recurrent training programs.) ■
— FSF Editorial Staff
Notes
1. Carbaugh, David C. “Erroneous Flight Instrument Information.” In Enhancing Safety in the 21st Century: Proceedings of the 50th
Table 2Unreliable Information/Systems With Pitot-static System Malfunction
System/Indicator Notes
Autopilot
Autothrottles
Airspeed
Altimeter Blocked static system or blocked pitot-static system
Vertical speed
Wind information
Vertical navigation
Terrain awareness and warning system* Initial versions of terrain awareness and warning systems
Overspeed warning
Wind shear warning
Elevator feel
Engine indication and crew alerting system messages May not identify the basic problem
* Terrain awareness and warning system (TAWS) is the term used by the European Joint Aviation Authorities and the U.S. Federal Aviation Administration to describe equipment meeting International Civil Aviation Organization standards and recommendations for ground-proximity warning system (GPWS) equipment that provides predictive terrain-hazard warnings. “Enhanced GPWS (EGPWS)” and “ground collision avoidance system” are other terms used to describe TAWS equipment.
Source: Adapted from Carbaugh, David C. “Erroneous Flight Instrument Information.” In Enhancing Safety in the 21st Century: Proceedings of the 52nd Annual International Air Safety Seminar. Alexandria, Virginia, U.S.: Flight Safety Foundation, 1999.
19FLIGHT SAFETY FOUNDATION • FLIGHT SAFETY DIGEST • NOVEMBER 2004
P R E C I S I O N I N A L T I T U D E M E A S U R E M E N T
Annual International Air Safety Seminar. Alexandria, Virginia, U.S.: Flight Safety Foundation, 1999.
2. Commission of Accident Investigations, General Director of Air Transport, Peru. Final Report: Accident of Boeing 757-200, Operated by an Airliner of Transport of Peru, South America, Aeroperu, Occurred on the Day of October 12, 1996, [actual date was Oct. 2, 1996] Location: Lima, Peru. The original report was written in Spanish; an English translation was distributed by the Air Line Pilots Association, International.
3. FSF Editorial Staff. “Erroneous Airspeed Indications Cited in
Boeing 757 Control Loss.” Accident Prevention Volume 56 (October 1999).
4. Carbaugh, David C. Interviews by Lacagnina, Mark, and Werfelman, Linda. Alexandria, Virginia, U.S., Oct. 24, 2004; Oct. 28, 2004. Flight Safety Foundation, Alexandria, Virginia, U.S. Additional information from Carbaugh, “Erroneous Flight Instrument Information.”
5. Trémaud, Michel. E-mail communication with Werfelman, Linda. Alexandria, Virginia, U.S., Oct. 22–28, 2004. Flight Safety Foundation, Alexandria, Virginia, U.S.
6. Terrain-awareness and warning system (TAWS) is the term used by the European Joint Aviation Authorities and the U.S. Federal Aviation Administration to describe equipment meeting International Civil Aviation Organization standards and recommendations for ground-proximity warning system (GPWS) equipment that provides predictive terrain-hazard warnings; enhanced GPWS and ground collision avoidance system are other terms used to describe TAWS equipment.
7. Carbaugh. “Erroneous Flight Instrument Information.”
8. Trémaud.
terrain display and predictive alerting func-tions leads to an earlier and improved detec-tion rate of an altitude deviation resulting from altimetry-related anomalies;
• “The addition of a digital readout of geomet-ric altitude on the terrain display leads to an earlier and improved detection rate of an altitude deviation resulting from altimetry-related anomalies; [and,]
• “Geometric altitude resulted in better and more consistent pilot decision making fol-lowing the detection of an altitude anomaly — the display of geometric altitude does not negatively impact pilot decision making.”
Ratan Khatwa, Ph.D., manager, flight safety human factors, Honeywell, said that minor differences are to be expected between the geometric-altitude display and the barometric altimeter indication. A significant difference during flight below transition altitude, how-ever, could signal a problem. For example, the flight crew might have inadvertently mis-set the barometric altimeter; the QNH altimeter set-ting might be incorrect or the aircraft might be operating in an area of large differences from standard temperature or standard air pressure; or either the barometric altimeter or the static system might have failed.
Khatwa said that if a signifi cant difference in the displays of geometric altitude and barometric alti-tude occurs in fl ight before the transition altitude, the fl ight crew should comply with the following procedures:
• “Check and confirm all altimeter settings;
• “Cross-check that any other barometric al-timeters in the flight deck are in agreement;
• “Check that all altimeter settings are current and referenced to the landing airport;
• “Request assistance from ATC as necessary;
• “Monitor for significant temperature differ-ences, especially in cold air. Updated weather information should be requested if in doubt; [and,]
• “Ensure that static ports are not iced over or are not partially blocked, and [that] heaters are switched on when below freezing.”
The Honeywell study assigned the 30 participating pilots — all with about 8,000 fl ight hours to 9,000 fl ight hours and experience in using EGPWS — to one of three groups and presented them with sev-eral fl ight scenarios during a simulator session that was designed to evaluate their responses. Of the
20 FLIGHT SAFETY FOUNDATION • FLIGHT SAFETY DIGEST • NOVEMBER 2004
P R E C I S I O N I N A L T I T U D E M E A S U R E M E N T
group of pilots who used a geometric-altitude display and a digital readout of geometric altitude, 97 percent posi-tively detected altitude deviations. Of the group that used a display based on geometric altitude without a geometric-altitude readout, 78 per-cent detected altitude deviations. Of the group that used a display refer-enced only to barometric altitude, 49 percent detected the anomalies.
Evaluations of the pilots’ responses to the fl ight scenarios found that 98
percent of those who used the geometric-altitude display and readout and 96 percent of those who used the geometric-altitude display responded correctly, compared with 78 percent of those who used only barometric altitude.
Pilots from all groups described their confi dence level as “high, with respect to their ability to detect any altitude anomalies and their subsequent de-cision making,” Khatwa said. Nevertheless, pilots using barometric altitude “often failed to detect altitude anomalies, and therefore, in those cases, [their] perceived terrain awareness did not match actual terrain awareness,” he said.
Increased use of geometric altitude is likely, al-though geometric altitude is unlikely to replace barometric altitude in the near future.
“Use of EGPWS geometric altitude would elimi-nate the consequences of an incorrect altimeter setting or the consequences of not correcting the indicated altitude for extreme low outside air temperatures,” said Michel Trémaud, senior di-rector of safety and security for Airbus Customer Services.52
Carbaugh said that increased reliance on geomet-ric altitude computed from satellite data might be a distant goal.
“Pitot tubes and static ports are pretty old tech-nology, prone to insect nests and other things that can mess them up,” he said. “But satellite-based data, geometric altitude, would be a whole dif-ferent world.”
Bateman said that increased use of geometric altitude technology could eliminate many of the
problems connected with pressure altimeters. Nevertheless, he said, “I don’t know how we could get by without pressure altimeters, as that is how the world of aviation fl ies today, with its QNE/QFE/QNH altimeter-setting references, ATC procedures and practices.
“If we could get rid of pressure altimetry and rely on [GPS-based geometric altitude], we could get rid of the possibility of false altimeter readings and common mode errors where the pressure altim-eter can hurt the integrity of the fl ight. However, I believe we cannot guarantee the integrity of GPS everywhere in the world when we have inadvertent interference, or deliberate interference, nor could the United States probably ever get the rest of the world to switch over [to full reliance on GPS-based geometric altitude].”
In recent years, aircraft altimeters and other altitude-measuring devices have become very precise. Nevertheless, false indications still oc-cur. Continuing research into new methods of altitude-measurement and new uses of existing technologies — such as radio altimeters and GPS-based geometric altitude — may lead to con-tinued improvements in the accuracy of altitude-measuring systems. ■
Notes
1. International Civil Aviation Organization (ICAO). Manual on Implementation of a 300 m (1,000 ft) Vertical Separation Minimum Between FL290 and FL410 Inclusive. Document 9574. Second edition — 2002.
2. Ibid.
3. Joint Aviation Authorities (JAA). Guidance Material on the Approval of Aircraft and Operators for Flight in Airspace Above Flight Level 290 Where a 300-meter (1,000-foot) Vertical Separation Minimum Is Applied. Leafl et no. 6, Revision 1. Jan. 10, 1999.
4. U.S. Federal Aviation Administration (FAA). Guidance Material on the Approval of Operations/Aircraft for RVSM Operations. Document No. 91-RVSM. Feb. 20, 2004.
5. U.K. Civil Aviation Authority (CAA) Safety Regulation Group. Flight Operations Department Communication 7/2004. April 28, 2004.
6. Sanders, David. E-mail communication with Werfelman, Linda. Alexandria, Virginia, U.S., Nov. 1, 2004; Nov. 5, 2004. Flight Safety Foundation,
21FLIGHT SAFETY FOUNDATION • FLIGHT SAFETY DIGEST • NOVEMBER 2004
P R E C I S I O N I N A L T I T U D E M E A S U R E M E N T
Alexandria, Virginia, U.S. Sanders, a U.K. CAA press offi cer, said that the investiga-tion is likely to continue for an “extended period.”
7. Honeywell. Air Transport Avionics. <www.cas.Honeywell.com/ats/products/nav.cfm>. Nov. 5, 2004.
8. Carbaugh, David C. “Erroneous Flight Instrument Information.” Boeing Aero No. 23 (July 2003).
9. Flight Safety Foundation (FSF) Controlled-fl ight-into-terrain (CFIT) Task Force. CFIT Education and Training Aid. 1996.
10. CFIT, as defi ned by the FSF CFIT Task Force, occurs when an airworthy aircraft under the control of the fl ight crew is fl own unintentionally into terrain, obstacles or water, usually with no prior awareness by the crew. This type of ac-cident can occur during most phases of fl ight, but CFIT is more common during the approach-and-landing phase, which begins when an airworthy aircraft under the control of the fl ight crew descends below 5,000 feet above ground level (AGL) with the intention to conduct an approach and ends when the landing is complete or the fl ight crew fl ies the aircraft above 5,000 feet AGL en route to another airport.
11. ICAO. Procedures for Air Navigation Services (PANS). Aircraft Operations, Volume 1: Flight Procedures. Part VI, Altimeter Setting Procedures.
12. Carbaugh, David C. Interview with Lacagnina, Mark, and Werfelman, Linda. Alexandria, Virginia, U.S., Oct. 28, 2004. Flight Safety Foundation, Alexandria, Virginia, U.S.
13. U.K. CAA Level Bust Working Group. On the Level Project Final Report, Civil Aviation Publication 710. London, England. December 2000.
14. European Organisation for Safety of Air Navigation (Eurocontrol). “Level Bust Briefi ng Notes: General.” June 2004. This is one of 14 briefi ng notes — related papers about level-bust issues — that are part of the European Air Traffi c Management Level Bust Toolkit, a package of informa-tional materials produced by Eurocontrol and designed to raise awareness of the level bust issue among aircraft operators
and air navigation service providers and to help them develop strategies to reduce level busts.
15. Law, John. “ACAS Provides an Effective Safety Net When Procedures Are Followed.” Flight Safety Digest Volume 23 (March 2004).
16. Blajev, Tzvetomir. E-mail communica-tion with Werfelman, Linda. Alexandria, Virginia, U.S., Nov. 5, 2004. Flight Safety Foundation, Alexandria, Virginia, U.S.
17. Bateman, C. Donald. Telephone inter-view and e-mail communication with Werfelman, Linda. Alexandria, Virginia, U.S., Oct. 26, 2004; Oct. 29, 2004. Flight Safety Foundation, Alexandria, Virginia, U.S.
18. FSF. “ALAR (Approach-and-landing Accident Reduction) Briefi ng Notes.” (“ALAR Briefi ng Note 3.1 — Barometric Altimeter and Radio Altimeter.”) Flight Safety Digest Volume 19 (August–November 2000).
The “ALAR Briefi ng Notes” are part of the ALAR Tool Kit, which provides on compact disc (CD) a unique set of pilot briefi ng notes, videos, presentations, risk-awareness checklists and other tools designed to help prevent approach-and-landing accidents (ALAs) and CFIT. The tool kit is the culmination of the Foundation-led efforts of more than 300 safety specialists worldwide to identify the causes of ALAs and CFIT, and to develop practical recommendations for preven-tion of these accidents. The tool kit is a compilation of work that was begun in 1996 by an international group of aviation industry volunteers who comprised the FSF ALAR Task Force, which launched the second phase of work begun in 1992 by the FSF CFIT Task Force.
19. Hectopascal is the air-pressure measurement recommended by ICAO. The term is derived from the name of 17th-century French mathematician Blaise Pascal, who developed a method of measuring barometric pressure, and the Greek word for 100. One hectopascal is the equivalent of 100 pascals, or one millibar. One inch of mercury is equiva-lent to 33.86 hectopascals.
20. FSF. News Release: “Flight Safety Foundation Campaign to Reduce Controlled-fl ight-into-terrain Accidents Produces Safety Checklist,
Specifi c Prevention Recommendations.” Nov. 2, 1994.
21. FSF. “ALAR Briefi ng Notes.”
22. The U.S. National Aeronautics and Space Administration (NASA) Aviation Safety Reporting System (ASRS) is a confi den-tial incident-reporting system. The ASRS Program Overview said, “Pilots, air traffi c controllers, fl ight attendants, mechanics, ground personnel and others involved in aviation operations submit reports to the ASRS when they are involved in, or observe, an incident or situation in which aviation safety was compromised.” ASRS acknowledges that its data have certain limitations. ASRS Directline (December 1998) said, “Reporters to ASRS may introduce biases that result from a greater tendency to report serious events than minor ones; from organizational and geographic infl uences; and from many other factors. All of these potential infl u-ences reduce the confi dence that can be attached to statistical fi ndings based on ASRS data. However, the proportions of consistently reported incidents to ASRS, such as altitude deviations, have been remarkably stable over many years. Therefore, users of ASRS may presume that incident reports drawn from a time interval of several or more years will re-fl ect patterns that are broadly representa-tive of the total universe of aviation safety incidents of that type.”
23. NASA ASRS. Report no. 295007. January 1995.
24. Thomas, Perry. “International Altimetry.” ASRS Directline No. 2 (October 1991).
25. Patten, Marcia; Arri, Ed. “The Low-Down on Altimeter Settings.” ASRS Directline No. 9 (March 1997).
26. NASA ASRS. Report no. 206218. March 1992.
27. NASA ASRS. Report no. 289818. November 1994.
28. NASA ASRS. Report no. 290122. December 1994.
29. NASA ASRS. Report no. 295619. February 1995.
30. The “sterile cockpit rule” refers to U.S. Federal Aviation Regulations Part 121.542, which states, “No fl ight crew-member may engage in, nor may any

22 FLIGHT SAFETY FOUNDATION • FLIGHT SAFETY DIGEST • NOVEMBER 2004
P R E C I S I O N I N A L T I T U D E M E A S U R E M E N T
pilot-in-command permit, any activity during a critical phase of fl ight which could distract any fl ight crewmember from the performance of his or her duties or which could interfere with the proper conduct of those duties. Activities such as eating meals, engaging in nonessential conversations within the cockpit and nonessential communications between the cabin and cockpit crews, and reading publications not related to the proper conduct of the fl ight are not required for the safe operation of the aircraft. For the purposes of this section, critical phases of fl ight include all ground operations in-volving taxi, takeoff and landing, and all other fl ight operations below 10,000 feet, except cruise fl ight.” [The FSF ALAR Task Force says that “10,000 feet” should be height above ground level during fl ight operations over high terrain.]
31. FSF. “ALAR Briefi ng Notes.”
32. Ibid.
33. Thomas.
34. NASA ASRS. Report no. 290848. December 1994.
35. Patten, Arri.
36. NASA ASRS. Report no. 292949. January 1995.
37. NASA ASRS. Report no. 195014. November 1991
38. NASA ASRS. Report no. 293372. January 1995.
39. FSF. News Release: “Flight Safety Foundation Campaign to Reduce Controlled-fl ight-into-terrain Accidents Produces Safety Checklist, Specifi c Prevention Recommendations.” Nov. 2, 1994.
40. FSF. News Release: “Recommendations Bring Safety Improvements.” Oct. 28, 2004.
41. Airclaims. Major Loss Record. Volume 2 (Issue 139): ANZ:34.
42. NASA ASRS. Report no. 566552. November 2002.
43. U.S. National Transportation Safety Board. Collision With Trees on Final
Approach, American Airlines Flight 1572, McDonnell Douglas MD-83, N566AA, East Granby, Connecticut, November 12, 1995. NTSB/AAR-96/05. November 1996.
44. NASA ASRS. Report no. 190851. October 1991.
45. Patten, Arri.
46. ICAO. PANS. Aircraft Operations, Volume I: Flight Procedures. Part VI, Altimeter Setting Procedures.
47. The Boeing Co. Flight Crew Training Manual: 737-300/400/500. 1999.
48. Wilkes, Jack. “Cold and Low, Look Out Below.” Air Line Pilot Volume 68 (January 1999).
49. Terrain awareness and warning system (TAWS) is the term used by JAA and FAA to describe equipment meeting the ICAO standards and recommendations for ground-proximity warning system (GPWS) equipment that provides predic-tive terrain-hazard warnings. “Enhanced GPWS (EGPWS)” and “ground collision avoidance system” are other terms used to describe TAWS equipment.
50. Harris, David. Ground Studies for Pilots: Flight Instruments and Automatic Flight Control Systems. Oxford, England: Blackwell Science, 2004.
51. Khatwa, Ratan. “Human Factors Evaluation of Vertical Situational Awareness: Altimetry Errors.” In Safety Without Borders, Proceedings of the 16th Annual European Aviation Safety Seminar. Alexandria, Virginia, U.S.: Flight Safety Foundation, 2004.
52. Trémaud, Michel. E-mail communication with Werfelman, Linda. Alexandria, Virginia, U.S., Oct. 24–Oct 28, 2004. Flight Safety Foundation, Alexandria, Virginia, U.S.
Further Reading From FSF Publications
FSF Editorial Staff. “System Flags Altimeter-setting Errors in Weather Observations.” Airport Operations Volume 30 (September–October 2004).
FSF Editorial Staff. “Faulty Shift Handoff Cited in Failure to Close B-747 Static Lines.” Aviation Mechanics Bulletin Volume 52 (January–February 2004).
FSF Editorial Staff. “ALAR (Approach-and-landing Accident Reduction) Briefi ng Notes.” Flight Safety Digest Volume 19 (August–November 2000).
FSF Editorial Staff. “Erroneous Airspeed Indications Cited in Boeing 757 Control Loss. Accident Prevention Volume 56 (October 1999).
U.S. National Transportation Safety Board. “Controlled Flight Into Terrain: Korean Air Flight 801, Boeing 747-300, HL7468, Nimitz Hill, Guam, August 6, 1997.” Flight Safety Digest Volume 19 (May–July 2000).
Flight Safety Foundation Approach-and-landing Accident Reduction Task Force. “Killers in Aviation: FSF Task Force Presents Facts About Approach-and-landing and Controlled-fl ight-into-terrain Accidents.” Flight Safety Digest Volumes 17–18 (November 1998–February 1999).
FSF Editorial Staff. “During Nonprecision Approach at Night, MD-83 Descends Below Minimum Descent Altitude and Contacts Trees, Resulting in Engine Flame-out and Touchdown Short of Runway.” Accident Prevention Volume 54 (April 1997).
FSF Editorial Staff. “Learjet MEDEVAC Flight Ends in Controlled-fl ight-into-terrain (CFIT) Accident.” Accident Prevention Volume 54 (January 1997).
Khatwa, R.; Roelen, A.L.C. “An Analysis of Controlled-fl ight-into-terrain (CFIT) Accidents of Commercial Operators, 1988 Through 1994.” Flight Safety Digest Volume 15 (April–May 1996).
Sumwalt, Robert L. III. “Altitude Awareness Programs Can Reduce Altitude Deviations.” Flight Safety Digest Volume 14 (December 1995).
FSF Editorial Staff. “Rejected Takeoff in Icy Conditions Results in Runway Overrun.” Accident Prevention Volume 52 (May 1995).
Pope, John A. “Research Identifi es Common Errors Behind Altitude Deviations.” Flight Safety Digest Volume 12 (June 1993).
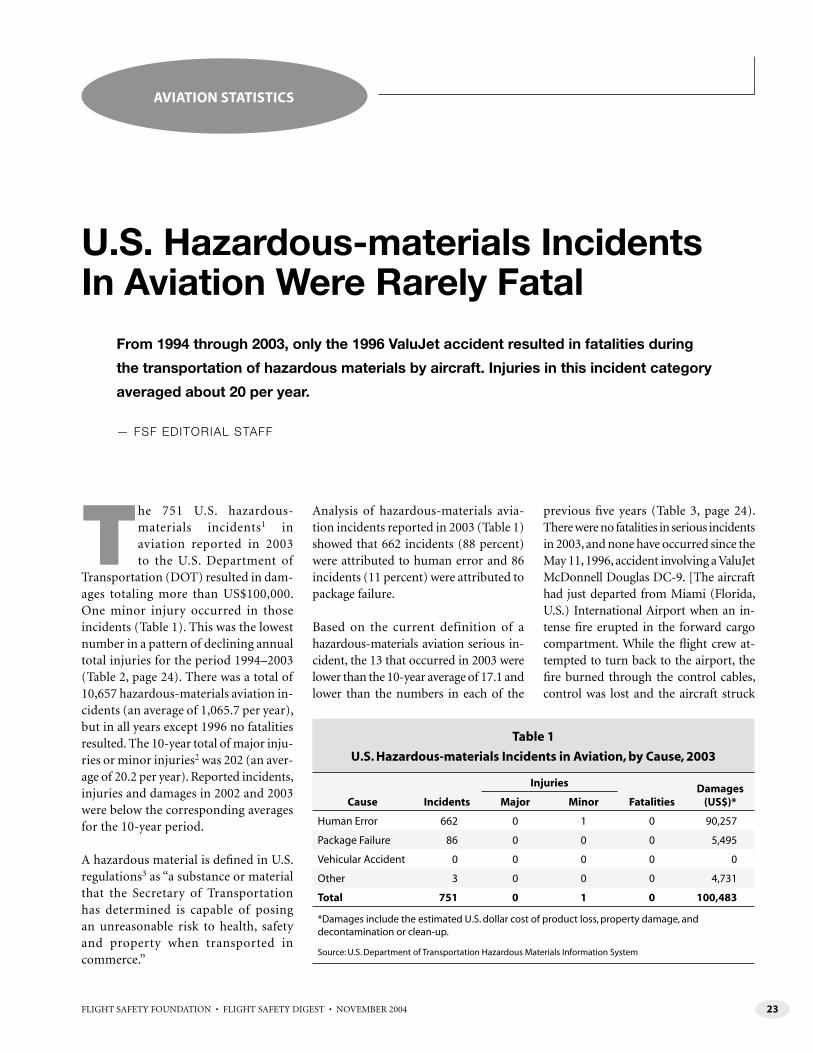
23FLIGHT SAFETY FOUNDATION • FLIGHT SAFETY DIGEST • NOVEMBER 2004
The 751 U.S. hazardous-materials incidents1 in aviation reported in 2003 to the U.S. Department of
Transportation (DOT) resulted in dam-ages totaling more than US$100,000. One minor injury occurred in those incidents (Table 1). This was the lowest number in a pattern of declining annual total injuries for the period 1994–2003 (Table 2, page 24). There was a total of 10,657 hazardous-materials aviation in-cidents (an average of 1,065.7 per year), but in all years except 1996 no fatalities resulted. The 10-year total of major inju-ries or minor injuries2 was 202 (an aver-age of 20.2 per year). Reported incidents, injuries and damages in 2002 and 2003 were below the corresponding averages for the 10-year period.
A hazardous material is defi ned in U.S. regulations3 as “a substance or material that the Secretary of Transportation has determined is capable of posing an unreasonable risk to health, safety and property when transported in commerce.”
Analysis of hazardous-materials avia-tion incidents reported in 2003 (Table 1) showed that 662 incidents (88 percent) were attributed to human error and 86 incidents (11 percent) were attributed to package failure.
Based on the current definition of a hazardous-materials aviation serious in-cident, the 13 that occurred in 2003 were lower than the 10-year average of 17.1 and lower than the numbers in each of the
previous fi ve years (Table 3, page 24). There were no fatalities in serious incidents in 2003, and none have occurred since the May 11, 1996, accident involving a ValuJet McDonnell Douglas DC-9. [The aircraft had just departed from Miami (Florida, U.S.) International Airport when an in-tense fi re erupted in the forward cargo compartment. While the fl ight crew at-tempted to turn back to the airport, the fi re burned through the control cables, control was lost and the aircraft struck
AVIATION STATISTICS
U.S. Hazardous-materials Incidents In Aviation Were Rarely Fatal
From 1994 through 2003, only the 1996 ValuJet accident resulted in fatalities during
the transportation of hazardous materials by aircraft. Injuries in this incident category
averaged about 20 per year.
— FSF EDITORIAL STAFF
Table 1
U.S. Hazardous-materials Incidents in Aviation, by Cause, 2003
Cause Incidents
Injuries
FatalitiesDamages
(US$)*Major Minor
Human Error 662 0 1 0 90,257
Package Failure 86 0 0 0 5,495
Vehicular Accident 0 0 0 0 0
Other 3 0 0 0 4,731
Total 751 0 1 0 100,483
*Damages include the estimated U.S. dollar cost of product loss, property damage, and decontamination or clean-up.
Source: U.S. Department of Transportation Hazardous Materials Information System
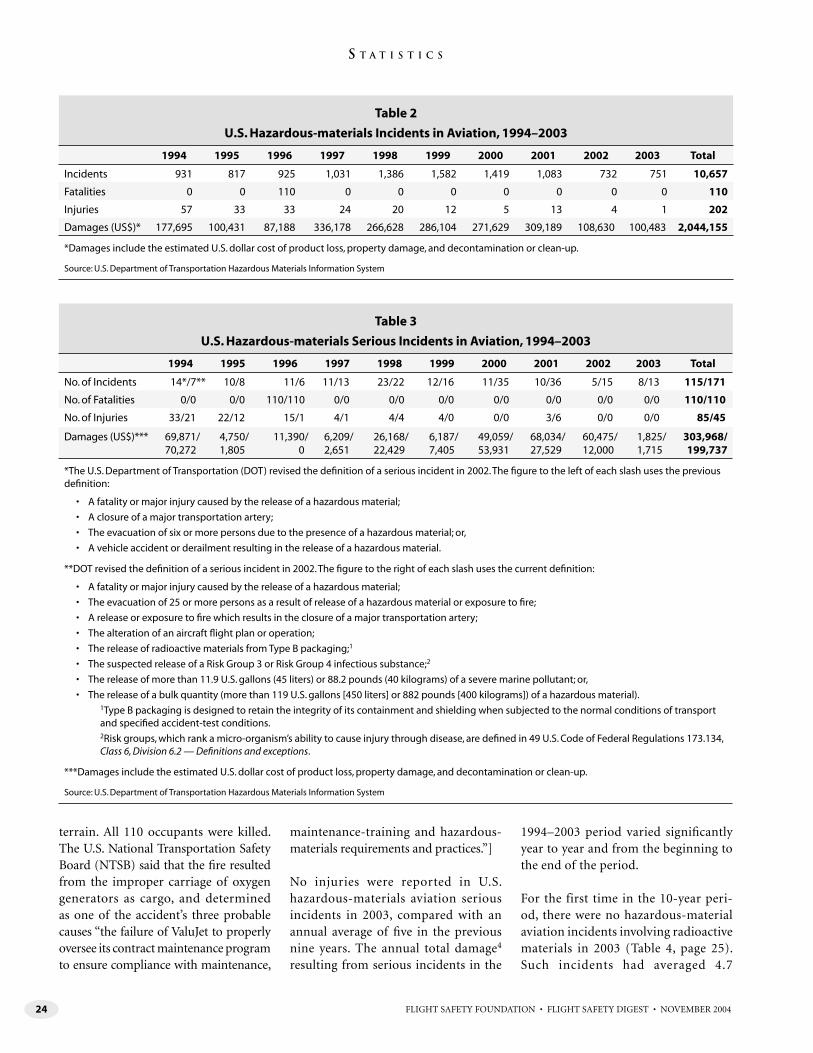
FLIGHT SAFETY FOUNDATION • FLIGHT SAFETY DIGEST • NOVEMBER 200424
S T A T I S T I C S
terrain. All 110 occupants were killed. The U.S. National Transportation Safety Board (NTSB) said that the fi re resulted from the improper carriage of oxygen generators as cargo, and determined as one of the accident’s three probable causes “the failure of ValuJet to properly oversee its contract maintenance program to ensure compliance with maintenance,
maintenance-training and hazardous-materials requirements and practices.”]
No injuries were reported in U.S. hazardous-materials aviation serious incidents in 2003, compared with an annual average of fi ve in the previous nine years. The annual total damage4 resulting from serious incidents in the
1994–2003 period varied signifi cantly year to year and from the beginning to the end of the period.
For the first time in the 10-year peri-od, there were no hazardous-material aviation incidents involving radioactive materials in 2003 (Table 4, page 25). Such incidents had averaged 4.7
Table 2
U.S. Hazardous-materials Incidents in Aviation, 1994–2003
1994 1995 1996 1997 1998 1999 2000 2001 2002 2003 Total
Incidents 931 817 925 1,031 1,386 1,582 1,419 1,083 732 751 10,657
Fatalities 0 0 110 0 0 0 0 0 0 0 110
Injuries 57 33 33 24 20 12 5 13 4 1 202
Damages (US$)* 177,695 100,431 87,188 336,178 266,628 286,104 271,629 309,189 108,630 100,483 2,044,155
*Damages include the estimated U.S. dollar cost of product loss, property damage, and decontamination or clean-up.
Source: U.S. Department of Transportation Hazardous Materials Information System
Table 3
U.S. Hazardous-materials Serious Incidents in Aviation, 1994–2003
1994 1995 1996 1997 1998 1999 2000 2001 2002 2003 Total
No. of Incidents 14*/7** 10/8 11/6 11/13 23/22 12/16 11/35 10/36 5/15 8/13 115/171
No. of Fatalities 0/0 0/0 110/110 0/0 0/0 0/0 0/0 0/0 0/0 0/0 110/110
No. of Injuries 33/21 22/12 15/1 4/1 4/4 4/0 0/0 3/6 0/0 0/0 85/45
Damages (US$)*** 69,871/70,272
4,750/1,805
11,390/ 0
6,209/2,651
26,168/22,429
6,187/7,405
49,059/53,931
68,034/27,529
60,475/12,000
1,825/1,715
303,968/199,737
*The U.S. Department of Transportation (DOT) revised the defi nition of a serious incident in 2002. The fi gure to the left of each slash uses the previous defi nition:
• A fatality or major injury caused by the release of a hazardous material;
• A closure of a major transportation artery;
• The evacuation of six or more persons due to the presence of a hazardous material; or,
• A vehicle accident or derailment resulting in the release of a hazardous material.
**DOT revised the defi nition of a serious incident in 2002. The fi gure to the right of each slash uses the current defi nition:
• A fatality or major injury caused by the release of a hazardous material;
• The evacuation of 25 or more persons as a result of release of a hazardous material or exposure to fi re;
• A release or exposure to fi re which results in the closure of a major transportation artery;
• The alteration of an aircraft fl ight plan or operation;
• The release of radioactive materials from Type B packaging;1
• The suspected release of a Risk Group 3 or Risk Group 4 infectious substance;2
• The release of more than 11.9 U.S. gallons (45 liters) or 88.2 pounds (40 kilograms) of a severe marine pollutant; or,
• The release of a bulk quantity (more than 119 U.S. gallons [450 liters] or 882 pounds [400 kilograms]) of a hazardous material).1Type B packaging is designed to retain the integrity of its containment and shielding when subjected to the normal conditions of transport and specifi ed accident-test conditions.2Risk groups, which rank a micro-organism’s ability to cause injury through disease, are defi ned in 49 U.S. Code of Federal Regulations 173.134, Class 6, Division 6.2 — Defi nitions and exceptions.
***Damages include the estimated U.S. dollar cost of product loss, property damage, and decontamination or clean-up.
Source: U.S. Department of Transportation Hazardous Materials Information System
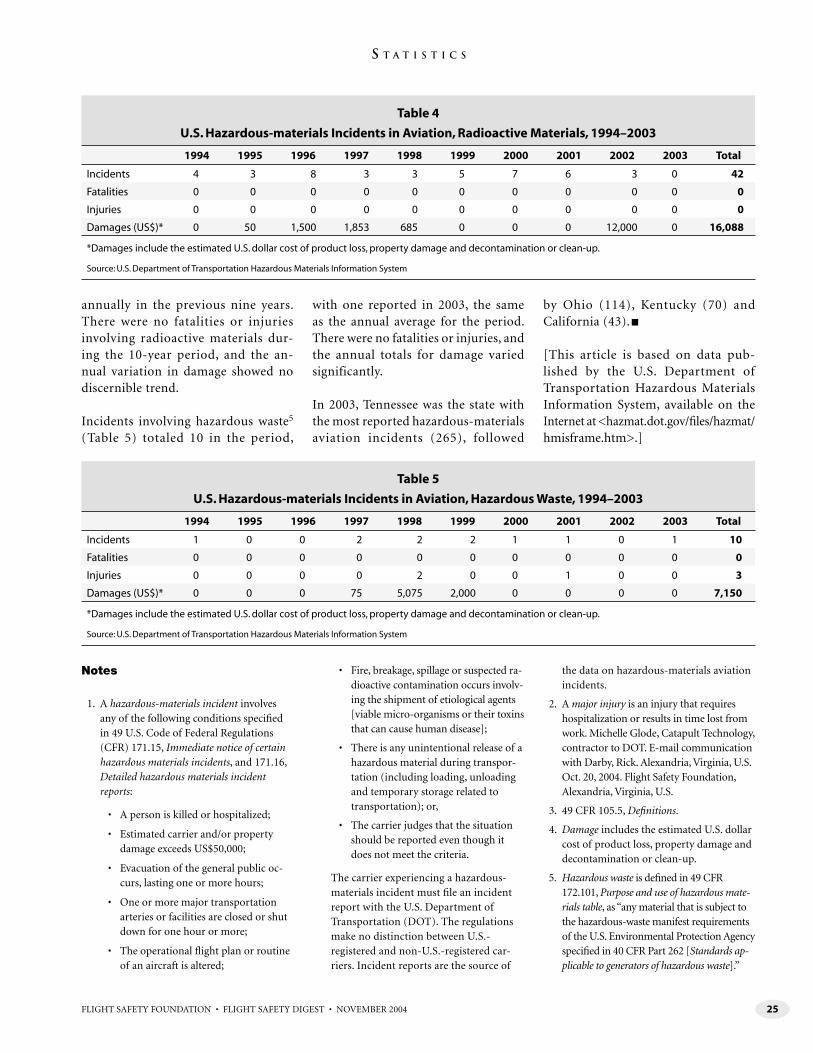
FLIGHT SAFETY FOUNDATION • FLIGHT SAFETY DIGEST • NOVEMBER 2004 25
S T A T I S T I C S
annually in the previous nine years. There were no fatalities or injuries involving radioactive materials dur-ing the 10-year period, and the an-nual variation in damage showed no discernible trend.
Incidents involving hazardous waste5 (Table 5) totaled 10 in the period,
with one reported in 2003, the same as the annual average for the period. There were no fatalities or injuries, and the annual totals for damage varied significantly.
In 2003, Tennessee was the state with the most reported hazardous- materials aviation incidents (265), followed
by Ohio (114), Kentucky (70) and California (43). ■
[This article is based on data pub-lished by the U.S. Department of Transportation Hazardous Materials Information System, available on the Internet at <hazmat.dot.gov/fi les/hazmat/hmisframe.htm>.]
Table 4
U.S. Hazardous-materials Incidents in Aviation, Radioactive Materials, 1994–2003
1994 1995 1996 1997 1998 1999 2000 2001 2002 2003 Total
Incidents 4 3 8 3 3 5 7 6 3 0 42
Fatalities 0 0 0 0 0 0 0 0 0 0 0
Injuries 0 0 0 0 0 0 0 0 0 0 0
Damages (US$)* 0 50 1,500 1,853 685 0 0 0 12,000 0 16,088
*Damages include the estimated U.S. dollar cost of product loss, property damage and decontamination or clean-up.
Source: U.S. Department of Transportation Hazardous Materials Information System
Table 5
U.S. Hazardous-materials Incidents in Aviation, Hazardous Waste, 1994–2003
1994 1995 1996 1997 1998 1999 2000 2001 2002 2003 Total
Incidents 1 0 0 2 2 2 1 1 0 1 10
Fatalities 0 0 0 0 0 0 0 0 0 0 0
Injuries 0 0 0 0 2 0 0 1 0 0 3
Damages (US$)* 0 0 0 75 5,075 2,000 0 0 0 0 7,150
*Damages include the estimated U.S. dollar cost of product loss, property damage and decontamination or clean-up.
Source: U.S. Department of Transportation Hazardous Materials Information System
Notes
1. A hazardous-materials incident involves any of the following conditions specifi ed in 49 U.S. Code of Federal Regulations (CFR) 171.15, Immediate notice of certain hazardous materials incidents, and 171.16, Detailed hazardous materials incident reports:
• A person is killed or hospitalized;
• Estimated carrier and/or property damage exceeds US$50,000;
• Evacuation of the general public oc-curs, lasting one or more hours;
• One or more major transportation arteries or facilities are closed or shut down for one hour or more;
• The operational fl ight plan or routine of an aircraft is altered;
• Fire, breakage, spillage or suspected ra-dioactive contamination occurs involv-ing the shipment of etiological agents [viable micro-organisms or their toxins that can cause human disease];
• There is any unintentional release of a hazardous material during transpor-tation (including loading, unloading and temporary storage related to transportation); or,
• The carrier judges that the situation should be reported even though it does not meet the criteria.
The carrier experiencing a hazardous-materials incident must fi le an incident report with the U.S. Department of Transportation (DOT). The regulations make no distinction between U.S.- registered and non-U.S.-registered car-riers. Incident reports are the source of
the data on hazardous-materials aviation incidents.
2. A major injury is an injury that requires hospitalization or results in time lost from work. Michelle Glode, Catapult Technology, contractor to DOT. E-mail communication with Darby, Rick. Alexandria, Virginia, U.S. Oct. 20, 2004. Flight Safety Foundation, Alexandria, Virginia, U.S.
3. 49 CFR 105.5, Defi nitions.
4. Damage includes the estimated U.S. dollar cost of product loss, property damage and decontamination or clean-up.
5. Hazardous waste is defi ned in 49 CFR 172.101, Purpose and use of hazardous mate-rials table, as “any material that is subject to the hazardous-waste manifest requirements of the U.S. Environmental Protection Agency specifi ed in 40 CFR Part 262 [Standards ap-plicable to generators of hazardous waste].”
26 FLIGHT SAFETY FOUNDATION • FLIGHT SAFETY DIGEST • NOVEMBER 2004
PUBLICATIONS RECEIVED AT FSF JERRY LEDERER
AVIATION SAFETY LIBRARY
Entropy Model of Accident Causation ProposedLooking at organizational accident-risk factors in terms of the degradation
of system factors is more effective than the human-error model, says an
environmental health specialist.
— FSF LIBRARY STAFF
Books
Productive Safety Management: A Strategic, Multi-disciplinary Management System for Hazardous Industries That Ties Safety and Production Together. Mol, Tania. Oxford, England: Butterworth-Heinemann, 2003. 435 pp. Figures, tables, references, glossary, index.
“The theoretical models that explain how accidents happen have been used to
underpin current OHS [occupational health and safety] management systems,” says the author. “These models have strongly emphasized the role of human error as a major contributing fac-tor in safety deviations. They contain references to ‘unsafe acts,’ ‘mental condition of [the] worker,’ ‘physical condition of [the] worker,’ ‘perceptual skills’ and other individual-centered terms. As a result, it has become easy to blame the worker when something goes wrong.”
But this approach to accident reduction, says the author — a human resource manager and environmental health offi cer in Australia — is of limited effectiveness. Workers do not need to be convinced that they are better off not being injured
at work. Few workers knowingly act recklessly. Instead, she says, “they tend to behave according to the demands of the organizational system and its culture.” In other words, workers take risks not out of ignorance or indifference, but from a desire to fi t in with a company’s accepted norms and to meet its expectations.
To replace the human-error model of accident causation, the author proposes the entropy model. Entropy, in this context, means the degradation of an organization’s system factors — processes, technology, the physical environment and hu-man resources. “Systemic weaknesses such as inadequate training, production pressures, exces-sively demanding tasks, high-risk environments, faulty equipment and long work hours contribute to accidents,” says the author. “These are, in large measure, not matters directly controlled by the worker. The entropy model provides a balanced perspective of these contributing variables and explains how risks associated with system factors can be managed effectively.”
A second tool for safety management is included in what the author calls the “strategic alignment channel,” which challenges the concept of
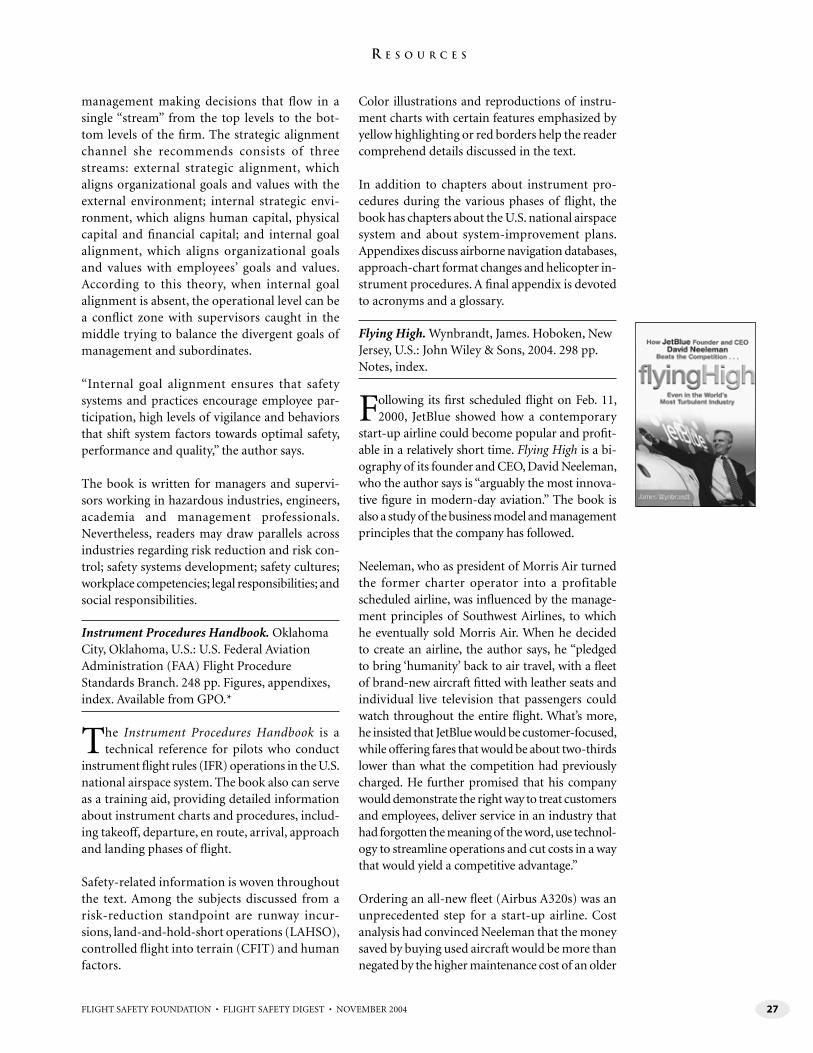
FLIGHT SAFETY FOUNDATION • FLIGHT SAFETY DIGEST • NOVEMBER 2004 27
R E S O U R C E S
management making decisions that fl ow in a single “stream” from the top levels to the bot-tom levels of the fi rm. The strategic alignment channel she recommends consists of three streams: external strategic alignment, which aligns organizational goals and values with the external environment; internal strategic envi-ronment, which aligns human capital, physical capital and fi nancial capital; and internal goal alignment, which aligns organizational goals and values with employees’ goals and values. According to this theory, when internal goal alignment is absent, the operational level can be a confl ict zone with supervisors caught in the middle trying to balance the divergent goals of management and subordinates.
“Internal goal alignment ensures that safety systems and practices encourage employee par-ticipation, high levels of vigilance and behaviors that shift system factors towards optimal safety, performance and quality,” the author says.
The book is written for managers and supervi-sors working in hazardous industries, engineers, academia and management professionals. Nevertheless, readers may draw parallels across industries regarding risk reduction and risk con-trol; safety systems development; safety cultures; workplace competencies; legal responsibilities; and social responsibilities.
Instrument Procedures Handbook. Oklahoma City, Oklahoma, U.S.: U.S. Federal Aviation Administration (FAA) Flight Procedure Standards Branch. 248 pp. Figures, appendixes, index. Available from GPO.*
The Instrument Procedures Handbook is a technical reference for pilots who conduct
instrument fl ight rules (IFR) operations in the U.S. national airspace system. The book also can serve as a training aid, providing detailed information about instrument charts and procedures, includ-ing takeoff, departure, en route, arrival, approach and landing phases of fl ight.
Safety-related information is woven throughout the text. Among the subjects discussed from a risk-reduction standpoint are runway incur-sions, land-and-hold-short operations (LAHSO), controlled fl ight into terrain (CFIT) and human factors.
Color illustrations and reproductions of instru-ment charts with certain features emphasized by yellow highlighting or red borders help the reader comprehend details discussed in the text.
In addition to chapters about instrument pro-cedures during the various phases of fl ight, the book has chapters about the U.S. national airspace system and about system-improvement plans. Appendixes discuss airborne navigation databases, approach-chart format changes and helicopter in-strument procedures. A fi nal appendix is devoted to acronyms and a glossary.
Flying High. Wynbrandt, James. Hoboken, New Jersey, U.S.: John Wiley & Sons, 2004. 298 pp. Notes, index.
Following its fi rst scheduled fl ight on Feb. 11, 2000, JetBlue showed how a contemporary
start-up airline could become popular and profi t-able in a relatively short time. Flying High is a bi-ography of its founder and CEO, David Neeleman, who the author says is “arguably the most innova-tive fi gure in modern-day aviation.” The book is also a study of the business model and management principles that the company has followed.
Neeleman, who as president of Morris Air turned the former charter operator into a profitable scheduled airline, was infl uenced by the manage-ment principles of Southwest Airlines, to which he eventually sold Morris Air. When he decided to create an airline, the author says, he “pledged to bring ‘humanity’ back to air travel, with a fl eet of brand-new aircraft fi tted with leather seats and individual live television that passengers could watch throughout the entire fl ight. What’s more, he insisted that JetBlue would be customer-focused, while offering fares that would be about two-thirds lower than what the competition had previously charged. He further promised that his company would demonstrate the right way to treat customers and employees, deliver service in an industry that had forgotten the meaning of the word, use technol-ogy to streamline operations and cut costs in a way that would yield a competitive advantage.”
Ordering an all-new fl eet (Airbus A320s) was an unprecedented step for a start-up airline. Cost analysis had convinced Neeleman that the money saved by buying used aircraft would be more than negated by the higher maintenance cost of an older
FLIGHT SAFETY FOUNDATION • FLIGHT SAFETY DIGEST • NOVEMBER 200428
R E S O U R C E S
fl eet. He also believed that passengers prefer new aircraft.
Other JetBlue innovations included being the fi rst airline to use electronic ticketing, or “e-ticketing,” exclusively and having reservation agents work from their homes, thus eliminating the cost of maintaining a call center. The airline worked with the U.S. Federal Aviation Administration (FAA) to complete the certifi cation process that made possible a “paperless cockpit,” in which the aircraft fl ight manual is electronic, accessed by the pilots’ laptop computers. The computers also enable the pilots to perform weight-and-balance calculations, fuel calculations and other fl ight-planning tasks that are conventionally handled by dispatchers, saving time and avoiding the cost of having a large fl ight-dispatch department.
Choosing to base the airline at John F. Kennedy International Airport (JFK), New York, N.Y., U.S., went against the conventional wisdom that JFK was disliked by travelers because it was perceived as overcrowded and too distant from Manhattan, New York’s business and cultural center. But Neeleman found that there were fi ve million people living closer to JFK than to New York’s other two major airports. “As for airport congestion, an examination of operations re-vealed that JFK was only busy in the evening when transatlantic fl ights stacked up to depart for overnight fl ights to Europe,” the author says. “For most of the day, the airport was actually underutilized.”
JetBlue’s employment practices are also unusual, designed to create and maintain an esprit de corps that leads to high-quality customer relations. In its own terminology, the airline has no employees — they are all “crewmembers.” The primary job qualifi cation to work for JetBlue, says the author, “is that prospective crewmembers must like peo-ple. … Company recruiters look for signs of the fun-loving, team-oriented spirit its crewmembers are known for, as well as behaviors that mirror the values JetBlue is built on.” Pilot applicants who pass the initial screening often meet with senior company executives, including Neeleman. JetBlue also pays its trainees (fl ight attendants as well as pilots) during initial training.
The book concludes with Neeleman’s “rules for succeeding in any business.”
Reports
Simulated Evacuations Into Water. McLean, G.A.; Palmerton, D.A.; Corbett, C.L.; Larcher, K.G.; McDown, J.R. U.S. Federal Aviation Administration (FAA) Offi ce of Aerospace Medicine (OAM). DOT/FAA/AM-04/12. August 2004. 8 pp. Table, fi gures, references. Available on the Internet at <www.cami.jcccbi.gov> or through NTIS.**
Under U.S. Federal Aviation Regulations (FARs) Part 25.801, Ditching, “it must be
shown that, under reasonably probable water conditions, the fl otation time and trim of the [transport category] airplane will allow the oc-cupants to leave the airplane and enter the life rafts required by [FARs Part] 25.1415 (1).” The planned designs of very large transport airplanes with two passenger decks have called into question the assumptions made in previous tests of pas-senger egress into water, because lower-deck exit sills in these new types could require passengers to jump from heights as much as six feet [two me-ters] above the water. “This may create signifi cant deviations from the passenger-fl ow rates into the water [that were] assumed historically for trans-port airplanes, especially those caused in part by the speed with which passengers can vacate the area immediately adjacent to the aircraft exit once they have entered the water,” says the report.
To provide data relative to such certifi cation ques-tions, the FAA Civil Aerospace Medical Institute (CAMI) conducted a study using its water-survival research tank to evaluate simulated evacuation un-der varied conditions. Participants jumped from a platform into water at heights ranging from 0.75 foot (0.23 meter) to six feet. They were instructed that they must not jump on top of any of their fellow participants already in the water.
The effects of three different fl otation-device con-ditions also were investigated. Participants jumped into the water (1) while holding typical transport category airplane flotation seat cushions; (2) while wearing a technical standard order (TSO)-approved inflatable life vest that was already infl ated; and (3) while wearing a TSO-approved life vest that was uninfl ated, with the participant infl ating it after entering the water.
The effects of platform height were statistically sig-nifi cant, with egress times increasing by an average
FLIGHT SAFETY FOUNDATION • FLIGHT SAFETY DIGEST • NOVEMBER 2004 29
R E S O U R C E S
0.7 second per person as the height of the platform was increased from 0.75 foot to six feet. “Such effects can be related to the fear generally associated with jumping from high places, although the instruction that participants were given about being sure not to jump onto another person already in the water also appeared to play a part,” says the report.
The experimenters also found that the fl otation-device type affected individual egress time. “Flotation seat cushions [produced] the lowest fl ow rates, followed next by life vests that were un-infl ated until entry into the water and then life vests that had been infl ated before leaving the platform,” says the report.
The differences in egress time associated with various fl otation-device types appeared to re-fl ect both the diffi culty some participants had in moving away from the tank’s landing area and the time they spent under water after jumping, the report says.
“The lack of infl ation upon entering the water with the uninfl ated life vest allowed participants to plunge much further into the water, increasing their underwater time in the landing area and … resulted in added delays to participants on the platform who had to make sure the water was clear before jumping,” says the report.
The fl otation seat cushion provided immediate fl otation upon entering the water, but was found to make moving through the water diffi cult. “This occurred because the cushion formed somewhat of a barrier that had to be pushed through the water to move away from the landing area, and the participant’s arms had to be locked around the cushion, eliminating any ability to use them for swimming,” says the report.
The pre-infl ated life vests offered the benefi ts of immediate fl otation and of allowing participants full use of their arms to swim easily and move away from the landing area more quickly, the report says.
“The results presented here suggest that, in terms of escape and moving away from a ditched airplane, pre-infl ation is a good idea,” says the report. “In mitigation of these fi ndings are accident reports and personal accounts of crash survivors, which indicate that passengers have been [trapped] and
may become trapped inside the airplane should they infl ate their [life] vests and the exits then sink below waterline. Given both arguments, it would ap-pear that a well-chosen course of action would be to maintain the [life] vests in an uninfl ated condition until the passenger begins to jump from the airplane exit, pulling the infl ation handles in midair to create life vest buoyancy before hitting the water.”
[For a detailed discussion of life vest use in water-contact accidents, see “Your Life Vest Can Save Your Life … If It Doesn’t Kill You First,” in Waterproof Flight Operations, a special issue of Flight Safety Digest, September 2003–February 2004, available on compact disc from Flight Safety Foundation.]
Regulatory Materials
Hazardous Wildlife Attractants on or Near Airports. U.S. Federal Aviation Administration (FAA) Advisory Circular (AC) 150/5200-33A. July 27, 2004. Figures, tables, appendix, references. 18 pp. Available from FAA via the Internet at <http://www.airweb.faa.gov/Regulatory_and_Guidance_Library> or from GPO.*
The availability of information about risks posed to aircraft by certain wildlife species has
increased signifi cantly in recent years. Reporting and documentation of incidents have improved, as have formal studies and data collection. FAA says that these studies and data show that aircraft collisions with birds and other wildlife create seri-ous economic problems and serious public safety problems. This AC says, “During the past century, wildlife-aircraft strikes have resulted in the loss of hundreds of lives worldwide, as well as billions of dollars in aircraft damage.”
Many species of wildlife can threaten aircraft safety. They are not equally hazardous, however. Table 1 in this AC ranks 25 species groups commonly in-volved in damaging strikes in the U.S. according to three criteria: aircraft damage, major aircraft damage and effect on fl ight. Listed in descending order according to a composite score based on all three criteria, with a maximum score of 100, the top 10 are deer (score: 100), vultures (64), geese (55), cormorants and pelicans (54), cranes (47), eagles (41), ducks (39), osprey (39), turkeys and pheasants
FLIGHT SAFETY FOUNDATION • FLIGHT SAFETY DIGEST • NOVEMBER 200430
R E S O U R C E S
(33), and herons (27). Hazard rankings are based on 47,212 records in the FAA National Wildlife Strike Database for the years 1990 to 2003.
The AC contains numerous references to sources of additional information. The following documents are available in paper format or on the Internet:
• Special Report for the FAA, Ranking the Hazard Level of Wildlife Species to Civil Aviation in the USA: Update 1, July 2, 2003 <http://www.faa.gov>;
• Wildlife Hazard Management at Airports: A Manual for Airport Personnel, prepared by FAA staff and the staff of the U.S. Department of Agriculture <http://wildlife-mitigation.tc.faa.gov>;
• Prevention and Control of Wildlife Damage, compiled by the University of Nebraska [U.S.] Cooperative Extension Division <http://ianrwww.unl.edu/wildlife/solutions/handbook>;
• Construction or Establishment of Landfills Near Public Airports, FAA AC 150/5200-34 <http://www.faa.gov>;
• Airport Design, FAA AC 150/5300-13 <http://www.faa.gov>; and,
• Wildlife Control Procedures Manual, Technical Publication 11500E, 1994, Transport Canada, Airports Group <http://www.tc.gc.ca/CivilAviation/Aerodrome/WildlifeControl/tp11500/Introduction.htm>.
AC 150/5200-33A provides guidance on use of land that could attract hazardous wildlife on or near airports. The FAA recommends implemen-tation of the standards and practices contained in the AC by operators of certifi ed public-use airports, operators of noncertified public-use airports, and developers of projects, facilities and activities on or near airports. Standards and practices addressed in the AC are:
• Separation criteria for hazardous wildlife at-tractants on or near airports;
• Land-use practices on or near airports that potentially attract hazardous wildlife;
• Procedures for wildlife hazard management by operators of public-use airports; and,
• FAA review of proposed land-use changes.
[This AC cancels AC 150/5200-33, Hazardous Wildlife Attractants on or Near Airports, dated May 1, 1997.]
Precision Approach Path Indicator (PAPI) Systems. U.S. Federal Aviation Administration (FAA). Advisory Circular (AC) 150/5345-28E. May 25, 2004. 14 pp. Figures, references. Available on the Internet at <http://www2.faa.gov/arp/150acs.cfm> or from GPO.*
Precision approach path indicator (PAPI) sys-tems provide pilots with visual glide path guid-
ance during approach for landing. This AC contains FAA standards, specifi cations and requirements for PAPI systems and for equipment tests.
In addition to containing PAPI qualification requirements, this AC provides references to related FAA ACs, FAA standards and draw-ings, SAE International standards, Illuminating Engineering Society Transactions, and select U.S. Department of Defense military specifi cations and standards.
Three principal changes appear in this updated AC:
• The section “Siting and Installation Standards” has been moved to AC 150/5340-30, Design and Installation Details for Airport Visual Aids;
• A chromaticity [precise specification of color] test requirement has been added; and,
• An optional go/no go PAPI lamp-monitoring output function has been added.
[This AC cancels AC 150/5345-28D, Precision Approach Path Indicator (PAPI) Systems, dated May 23, 1985.] ■
Sources
* U.S. Government Printing Offi ce (GPO)732 North Capitol St. NWWashington, DC 20401 U.S.
** National Technical Information Service (NTIS)5285 Port Royal RoadSpringfi eld, VA 22161 U.S.Internet: <www.ntis.gov>LI
BRARY
31FLIGHT SAFETY FOUNDATION • FLIGHT SAFETY DIGEST • NOVEMBER 2004
Turbine Disk Fails During Departure
The following information provides an awareness of problems through which such occurrences may be prevented in the future. Accident/incident briefs are
based on preliminary information from govern-ment agencies, aviation organizations, press infor-mation and other sources. This information may not be entirely accurate.
Some Cabin Crewmembers Not Told About Emergency Landing PlansBoeing 767-200. Substantial damage. No injuries.
An uncontained failure of the no. 1 (left) engine occurred about six minutes after the airplane
departed from an airport in Queensland, Australia, for a scheduled fl ight to New Zealand. The fl ight crew fl ew the airplane back to the departure air-port and landed without further incident.
The accident report said that the failure of the General Electric CF6-80A turbofan engine re-sulted from “the fracture and liberation of a large segment from the fi rst-stage high-pressure turbine
disk.” Among components damaged by the uncon-tained debris was a leading-edge-fl ap panel above the no. 1 engine. Because of the damage, the fl ight crew did not use the leading-edge fl aps during the return fl ight.
The report said that fatigue cracks had developed in the turbine disk in an area that had been dam-aged by shot-peening during manufacture or repair of the disk. (Shot-peening is a process in which metal shot is blasted against a metal part to strengthen it.)
“While subsequent fatigue testing of other [disks] with similar surface damage did not conclusively identify a loss of fatigue life resulting from the peen-ing processes, it is known that overly heavy or abusive shot-peening can prove detrimental to fatigue per-formance,” the report said. “As a result of the fi nd-ings of the investigation, the engine manufacturer has implemented several changes to the manufacturing and repair shot-peening processes, to avoid the sur-face damage found on the failed disk.”
The Australian Civil Aviation Safety Authority and the U.S. Federal Aviation Administration subsequently mandated the manufacturer’s changes to the shot-peening processes.
ACCIDENT/INCIDENT BRIEFS
The accident report said that the uncontained engine failure resulted from
fatigue cracks in an area damaged by shot-peening that had been performed
either during the manufacture of the engine or during repairs.
— FSF EDITORIAL STAFF
AIR
CA
RR
IER
FLIGHT SAFETY FOUNDATION • FLIGHT SAFETY DIGEST • NOVEMBER 200432
A C C I D E N T S / I N C I D E N T S
The investigation also found that after the engine failed, there was a miscommunication of the fl ight crew’s intention to prepare the passengers for an emergency landing.
“The fl ight crew’s subsequent call for the ‘brace’ position at 500 feet thus came as a surprise to the unaware cabin crew, some of whom adopted the unprepared emergency landing procedures, calling ‘emergency, grab your ankles’ to the passengers,” the report said. “The aircraft operator, as part of its own investigation into the occurrence, has developed a series of recommendations aimed at addressing the crew-communication defi ciencies experienced … after the engine failure.”
Airplane Strikes Rudder of Aircraft on Intersecting TaxiwayAirbus A319. Minor damage. No injuries. Canadair CL-600 Challenger. Minor damage. No injuries.
While being taxied for takeoff at an airport in the United States, the Airbus A319 struck
the Canadair CL-600, which was on a taxiway, holding short of an active runway.
The crews of both airplanes had received taxiing instructions to the same runway. The A319 captain said that, as he taxied his airplane, he observed the CL-600 on an intersecting taxiway and that he “felt confi dent there was adequate room to safely pass them.” He said that when he was certain that his airplane had passed the CL-600’s tail, he looked forward and “in approximately one second, we came to a stop. I looked left and saw our wing tip against the [CL-600’s] rudder.”
The CL-600 crew said that they were parked on the taxiway when they felt a “jolt” to their airplane.
Both airplanes were taxied back to the gate area.
Vehicle Strikes Airplane at GateBoeing 737. Minor damage. No injuries.
The crew was preparing for departure from an airport in Northern Ireland and had re-
ceived clearances for push-back and start when
they heard and felt something strike the airplane. The fl ight crew interrupted the “cleared for start” checklist, and a member of the ground crew told the captain that a collision had occurred.
The captain left the airplane to investigate and observed that a vehicle that typically was used to move ground equipment within the apron (ramp) area had struck the airplane on the left side below the fl ight deck windows. He observed two “large penetrations” — 20 centimeters (66 inches) long and 30 centimeters (98 inches) long — in the airplane’s outer skin, the report said.
The driver of the vehicle said that he inadvertently had placed his foot on the accelerator instead of the brake and that he was unable to stop the vehicle before its roof struck the fuselage.
“During his attempt to avoid the collision, the driver turned the steering wheel hard left; as a consequence, a lamp-cluster mounted on the nearside rear corner of the [vehicle’s] roof struck the fuselage side as the vehicle came to rest, result-ing in a second penetration of the fuselage skin,” the report said.
Tug Strikes Radome During TowBAE Systems ATP. Substantial damage. No injuries.
After the aircraft was pushed back from the gate for departure from an airport in Ireland, the
captain asked the ground-handling personnel to pull the aircraft forward to allow clearance for another aircraft that was being pushed back from an adjacent gate. As the ATP was being pulled forward, the tug’s (tractor’s) roof struck the aircraft’s radome.
The aircraft manufacturer told investigators that the tow bar used in the ground operation was not approved for towing the ATP. The tow bar was 133.5 inches (339.1 centimeters) long; the ap-proved custom-built tow bar for the ATP is 140.0 inches (355.6 centimeters) long.
The tow bar used in the ground operation had been supplied by the operator of the ATP. The operator also had recommended use of the tug, which was 6.0 feet (1.8 meters) tall.
AIR
TA
XI/
CO
MM
UT
ER
FLIGHT SAFETY FOUNDATION • FLIGHT SAFETY DIGEST • NOVEMBER 2004 33
A C C I D E N T S / I N C I D E N T S
“With the tug and tow bar in use, it was possible for the tug to strike the radome when the front of the tug in use was at an angle of about 60 degrees to the centerline of the aircraft,” the accident report said. “This angle was probably never envisaged in operation, as it would have been considered exces-sive. … A smaller, more maneuverable tug would have been more suitable [for the operation].”
The ground-handling personnel told investigators that they were apprehensive about towing the air-craft forward with its propellers turning.
“They acceded to the request of the captain in order to expedite the departure,” the report said.
After the accident, the ground-handling contrac-tor issued a line-maintenance notice stating that “the only way the aircraft is to be towed forward is to request that the engines be shut down, [safety] pins installed and tug reversed to the tow position,” the report said.
Cabin-pressure Anomaly Prompts Emergency DescentFairchild SA227-DC Metro 23. No damage. No injuries.
The airplane was being fl own at Flight Level 220 (approximately 22,000 feet) over Western
Australia when the fl ight crew observed an indica-tion that the cabin altitude was increasing at a rate of about 8,000 feet per minute.
“The crew, suspecting a pressurization [system] failure, donned oxygen masks and directed the passengers to do the same,” the incident report said.
The crew received clearance from air traffi c control to conduct a descent to 14,000 feet.
“Once level at the amended cruise altitude, the use of passenger oxygen masks was discontin-ued, and the fl ight proceeded to Perth,” the re-port said. “Company maintenance investigation could not detect the reason for the pressurization fault. Extensive troubleshooting was carried out in accordance with the manufacturer’s mainte-nance manual, followed by ground runs and a test fl ight. The aircraft and its systems performed normally.
“The aircraft was placed on a maintenance watch and returned to service, where it has since [been] operated without incident.”
Landing Gear Collapses During TaxiPiper PA-23-250E Aztec. Substantial damage. No injuries.
The airplane was being taxied to the fuel pumps at an airport in New Zealand after a domestic
cargo fl ight. As the airplane slowed to stop, the right-main landing gear collapsed.
An investigation found that the forward attach-ment bolt on the right-main landing-gear drag brace had failed because of fatigue, possibly caused by stress that resulted from “out-of-round bush-ings in the drag brace,” the fi nal accident report said.
The airplane, which was manufactured in 1973, had been damaged in an off-fi eld emergency land-ing nine years before this incident. There was no indication that the drag brace or the attachment bolt were replaced during subsequent repairs, and “stress initiators might have been created during the accident that then led to the bolt eventually failing,” the report said.
The accident investigation led to a recommenda-tion that the director of civil aviation publish guidelines for “the appropriate re-use and inspec-tion of parts from accident-damaged aircraft.” The director accepted the recommendation.
Crew Fails to Extend Landing GearCessna Citation 550. Substantial damage. No injuries.
The fl ight crew was conducting a nighttime emergency medical services fl ight in Canada
with two advanced-life-support paramedics aboard. The fi rst offi cer, who was type-rated in the airplane, was the pilot fl ying and was in the left seat, which was consistent with company policy.
At about 10,000 feet during the descent, the crew selected the speed brakes. The accident report said
FLIGHT SAFETY FOUNDATION • FLIGHT SAFETY DIGEST • NOVEMBER 200434
A C C I D E N T S / I N C I D E N T S
that the speed brakes remained extended for the remainder of the fl ight. The airplane fl ight manual calls for the speed brakes to be retracted no lower than 50 feet.
The crew conducted a nonprecision instrument approach to Runway 30. Surface winds were from 220 degrees at 30 knots, gusting to 37 knots. Because of the wind conditions, the crew decided to land the airplane with the fl aps in the approach position, rather than in the landing position.
“The landing-gear-warning horn sounded four times before the aircraft passed the fi nal ap-proach fi x (FAF) and was silenced by the crew each time,” the report said. “The fi rst offi cer did not call for the landing gear to be extended, nor did he call for the ‘Before Landing’ checklist to be completed. The captain did not remind the fi rst offi cer to extend the landing gear and ac-complish the before-landing checks. … After passing the FAF, the landing-gear-warning horn sounded three more times but was again silenced by the crew.”
The airplane’s nose pitched down just before touchdown on the runway. The fl ight crew per-ceived that the landing gear collapsed after touch-down. The airplane slid on its lower fuselage and stopped about 500 feet (153 meters) from the end of the 5,120-foot (1,562-meter) runway.
“The crew carried out an evacuation and pro-ceeded to the airport terminal building,” the report said. “When they returned to the aircraft to retrieve their belongings, the crew discovered that the gear was in the ‘up’ position, as was the landing-gear selector.”
Airplane Strikes Mountain During ‘Dark Night’ FlightCessna 310K. Destroyed. One fatality.
Night visual meteorological conditions pre-vailed for the business fl ight in the United
States, and no fl ight plan had been fi led.
About three minutes after departure, the pilot was told by air traffi c control (ATC) that his altitude was “at his discretion, and he said that he was beginning a climb from 3,000 feet. Three
minutes later, radar contact and radio contact were lost. Witnesses said that the night was clear and dark, with no moon. One witness observed an airplane at about 3,000 feet shortly before hearing an explosion.
The wreckage was found at the 3,750-foot level of a mountain.
A friend of the pilot said that in the days before the accident, the pilot had conducted a number of fl ights to transport his customers around the area and that he had been suffering from a cold.
A preliminary investigation found that the spark plugs in the right engine were worn and that the spark plugs in the left engine were “a combination of ‘worn out — severe’ and ‘worn out — normal.’” The investigation was continuing.
Commander Stalls DuringLow-altitude ManeuveringRockwell 690A Commander. Destroyed. One fatality.
The pilot was fl ying the twin-turboprop air-plane to an airport in the United States to
pick up one of its owners. The destination airport was reporting a few clouds at 300 feet, a broken ceiling at 900 feet, an overcast at 3,200 feet, 0.5 statute mile (0.8 kilometer) visibility with snow and surface winds from 290 degrees at 10 knots, gusting to 15 knots.
The pilot conducted a very-high-frequency om-nidirectional radio (VOR) approach to Runway 21. Two witnesses said that they heard the pilot report crossing the fi nal approach fi x inbound; they observed the airplane emerge from the overcast slightly high and fast, and enter a steeply banked turn. A heavy snowfall then obscured the airplane from their view.
Another witness observed the airplane turn about 270 degrees “just above the power lines.” The wit-ness said that the wings began to wobble, and the airplane pitched nose-down and descended almost vertically to the ground.
The accident report said that the probable causes of the accident were “the pilot’s inadequate [planning for] the approach and his failure to
CO
RP
OR
AT
E/B
US
INE
SS
FLIGHT SAFETY FOUNDATION • FLIGHT SAFETY DIGEST • NOVEMBER 2004 35
A C C I D E N T S / I N C I D E N T S
maintain airspeed, which resulted in a stall.” The report said that contributing factors were “low-altitude fl ight maneuvering in an attempt to lose excessive altitude and realign the airplane for landing, and [the pilot’s] failure to perform a missed approach.”
Broken Pitch-change Knob Cited in Airplane’s Descent Into WaterSocata TB-10 Tobago. Destroyed. Four fatalities.
Daytime visual meteorological conditions pre-vailed for the sightseeing fl ight in Denmark.
The airplane was in cruise fl ight between 1,000 feet and 1,500 feet when it descended and struck water just off the coastline.
A preliminary investigation found that one of the propeller blades had failed before the airplane struck the water and had turned approximately 180 degrees, and that engine power probably had been set at “idle” before the accident, the report said. Further investigation revealed that a pitch-change knob had broken on one of the propeller blades.
“If the pitch-change knob breaks off, it will not be possible to control the propeller blade angle, and severe vibrations will occur,” the report said.
The propeller manufacturer had issued a service letter before the accident calling for modifi cation of the pitch-change knob “at the next coming overhaul,” the report said. The accident airplane would have undergone the modification in 2006.
The investigation was continuing.
Engine Fails at 150 FeetDuring Initial Climb
Luscombe 8A. Destroyed. No injuries.
Four months after the pilot purchased the airplane, he observed a larger-than-normal
decrease in engine speed when he turned off the left magneto while preparing for a fl ight in England. After the left magneto was repaired, the
pilot fl ew the airplane about fi ve hours without incident.
About one month after the magneto was repaired, the pilot was conducting a takeoff from his pri-vate airstrip when engine speed began to decrease and the engine began to run rough. Application of carburetor heat restored normal engine power, and the pilot fl ew the airplane to an airport where repairs could be made.
After extensive checks and repairs — including adjustment of the fuel-air mixture, cleaning the carburetor and spark plugs and replacement of the induction pipe gaskets — maintenance tech-nicians told the pilot that the engine malfunction had been traced to a “mag problem” and that the problem had been rectifi ed.
The pilot fl ew the airplane back to his airstrip without incident. On the next fl ight, the pilot had diffi culty hand-starting the engine (by pull-ing the propeller). Prefl ight checks of the engine were satisfactory, and the pilot conducted a take-off. About 150 feet above the ground, the engine failed. The pilot turned right to avoid tall trees and began a descent toward an adjacent valley. At about 50 feet, he increased pitch attitude to reduce the descent rate. The airplane stalled and touched down hard.
The airplane was classifi ed as a total loss by the pilot’s insurance company. “As it will not be re-paired, the cause of the engine failure is unlikely to be determine in the near future,” the accident report said.
Airplane Rolls Into Ditch After Hand-starting ProcedureAeronca 7AC. Substantial damage. No injuries.
The pilot was taxiing the airplane to the run-way for takeoff from an airport in Canada
when the engine failed. The pilot, who was the only person in the airplane, exited and tried to hand-start the engine.
A preliminary report said that the engine started, and the pilot tried unsuccessfully to stop the air-plane as it moved forward, struck a taxiway light, entered a ditch and struck a directional sign.
OT
HE
R G
EN
ER
AL
AV
IAT
ION
FLIGHT SAFETY FOUNDATION • FLIGHT SAFETY DIGEST • NOVEMBER 200436
A C C I D E N T S / I N C I D E N T S
The airplane did not have a parking brake, and the pilot did not chock the wheels before he started the engine.
Landing Gear Damaged During Go-aroundPiper PA-32-301 Saratoga. Substantial damage. No injuries.
The pilot, who had an airline transport pilot certificate, was conducting an approach
in daytime visual meteorological conditions to Runway 36 at an airport in the United States. The runway was 2,155 feet (657 meters) long and 70 feet (21 meters) wide, and had a 518-foot (158-meter) displaced threshold.
A nearby airport was reporting surface winds from 200 degrees at nine knots.
The pilot said that after the fi xed-gear airplane touched down on the runway, he decided that a go-around was required. He retracted the fl aps and applied full power. The left-main landing gear separated from the airplane and the right-main landing gear was bent when they struck an elevated roadway off the end of the runway.
The airplane remained airborne, and the pilot landed it at the nearby airport.
Damaged NOTAR Fan Blades Prompt Precautionary LandingMD Helicopters MD 902 Explorer.Minor damage. No injuries.
The helicopter was in cruise fl ight in England when a passenger heard a noise “similar to
a seat being moved” that originated above and behind the seating area, the report said. Ten min-utes later, the “Check NOTAR Balance” warning illuminated on the integrated instrument display system (IIDS), and the pilot conducted a precau-tionary landing.
After landing, three tests were conducted on the anti-torque NOTAR fan balance. (The NOTAR
system, an alternative to the conventional anti-torque rotor, uses a fan mounted within the helicopter to produce anti-torque thrust at the tail boom.) All three tests showed that the fan was unbalanced. An inspection of the fan re-vealed damage to nine of the 13 fan blades and the fan liner but did not determine the cause of the damage.
The fan was replaced, and the damaged blades were sent to the helicopter manufacturer for ad-ditional tests. The investigation was continuing.
Sightseeing Helicopter Strikes Power Lines, Tree
Bell 206L-4 LongRanger. Destroyed. Five fatalities, one serious injury.
The helicopter was the second of two aircraft being fl own on a charter sightseeing fl ight
in India. About fi ve minutes after departure, the pilot turned the helicopter left, and the helicopter struck a tree.
The accident report said that the probable cause was that the pilot observed power lines “very late” and that he “applied rapid cyclic control, resulting in the helicopter decelerating, loss of translational lift [and] increased power demand, which was not available.”
Helicopter Encounters Downdraft, Strikes Ground
Robinson R22 Beta. Substantial damage. No injuries.
Winds were from the northeast at 15 knots when the pilot conduced a takeoff from
a helipad near a mountaintop communications facility in South Africa.
The pilot said that he conducted an in-ground-effect hover check before the liftoff and that he was fl ying the helicopter about two feet above ground level when the helicopter entered a downdraft and struck the ground about 100 meters (328 feet) from the helipad. ■
RO
TOR
CR
AFT
Now you have the safety tools to make a difference.
The Flight Safety Foundation is a comprehensive and practical resource on
compact disc to help you prevent the leading causes of fatalities in com mer cial aviation:
approach-and-landing ac ci dents (ALAs), including those involving controlled fl ight into ter rain (CFIT).
Put the FSF to work for you TODAY!• Separate lifesaving facts from fi ction among the data that confi rm ALAs and CFIT are the leading killers in avi a tion. Use FSF data-driven studies to reveal
eye-opening facts that are the nuts and bolts of the FSF ALAR Tool Kit.
• Volunteer specialists on FSF task forces from the international aviation industry studied the facts and de vel oped data-based con clu sions and recommendations to help pilots, air traffi c controllers and others prevent ALAs and CFIT. You can apply the results of this work — NOW!
• Review an industrywide consensus of best practices included in 34 FSF ALAR Briefi ng Notes. They provide practical in for ma tion that every pilot should know … but the FSF data confi rm that many pilots didn’t know — or ignored — this information. Use these benchmarks to build new standard operating pro ce dures and to im prove current ones.
• Related reading provides a library of more than 2,600 pages of factual information: sometimes chilling, but always useful. A versatile search engine will help you explore these pages and the other components of the FSF ALAR Tool Kit. (This collection of FSF publications would cost more than US$3,300 if purchased individually!)
• Print in six different languages the widely acclaimed FSF CFIT Checklist, which has been adapted by users for ev ery thing from checking routes to evaluating airports. This proven tool will enhance CFIT awareness in any fl ight department.
• Five ready-to-use slide presentations — with speakers’ notes — can help spread the safety message to a group, and enhance self-development. They cover ATC communication, fl ight op er a tions, CFIT prevention, ALA data and ATC/aircraft equipment. Customize them with your own notes.
• An approach and landing accident: It could happen to you! This 19-minute video can help enhance safety for every pilot — from student to professional — in the approach-and-landing environment.
• CFIT Awareness and Prevention: This 33-minute video includes a sobering description of ALAs/CFIT. And listening to the crews’ words and watching the accidents unfold with graphic depictions will imprint an un for get ta ble lesson for every pilot and every air traffi c controller who sees this video.
• Many more tools — including posters, the FSF Approach-and-landing Risk Awareness Tool and the FSF Approach-and-landing Risk Reduction Guide — are among the more than 590 mega bytes of in for ma tion in the FSF ALAR Tool Kit. An easy-to-navigate menu and book marks make the FSF ALAR Tool Kit user-friendly. Applications to view the slide pre sen ta tions, videos and pub li ca tions are included on the CD, which is designed to operate with Microsoft Windows or Apple Macintosh operating systems.
Tool Kit
Flight Safety Foundation
Approach-and-landing Accident Reduction
Order the FSF :Member price: US$40 Nonmember price: $160 Quantity discounts available!
Contact: Ahlam Wahdan, membership services coordinator, +1 (703) 739-6700, ext. 102.
Recommended System Requirements:
Windows®
• A Pentium®-based PC or compatible computer• At least 128MB of RAM• Windows 98/ME/2000/XP system software
Mac® OS• A 400 MHz PowerPC G3 or faster Macintosh computer• At least 128MB of RAM• Mac OS 8.6/9, Mac OS X v10.2.6–v10.3x
Mac OS and Macintosh are trademarks of Apple Computer Inc. registered in the United States and other countries. Microsoft and Windows and are either registered trademarks or trade marks of Microsoft Corp. in the United States and/or other countries.
The FSF ALAR Tool Kit is not endorsed or sponsored by Apple Computer Inc. or Microsoft Corp.
Flight Safety FoundationAn independent, industry-sup port ed,
nonprofi t or ga ni za tion for the exchange of safety information
for more than 50 years
What can you do to improve aviation safe ty?Join Flight Safety Foundation.
• Receive 54 FSF periodicals including Accident Pre ven tion, Cabin Crew Safety and Flight Safety Digest that members may reproduce and use in their own publications.
• Receive discounts to attend well-es tab lished safety seminars for airline and corporateaviation managers.
• Receive member-only mailings of special reports on important safety issues such as controlled fl ight into terrain (CFIT), approach-and-landing accidents, human factors, and fatigue coun ter mea sures.
• Receive discounts on Safety Services including operational safety audits.
Your organization on the FSF membership list and Internet sitepresents your commitment to safety to the world.
Want more information about Flight Safety Foundation?
Contact Ann Hill, director, membership and developmentby e-mail: <hill@fl ightsafety.org> or by telephone: +1 (703) 739-6700, ext. 105.
Visit our Internet site at <www.fl ightsafety.org>.
We Encourage ReprintsArticles in this publication, in the interest of aviation safety, may be reprinted in whole or in part, but may not be offered for sale directly or indirectly, used commercially or distributed electronically on the Internet or on any other electronic media without the express written permission of Flight Safety Foundation’s director of publications. All uses must credit Flight Safety Foun da tion, Flight Safety Digest, the specifi c article(s) and the author(s). Please send two copies of the reprinted material to the director of pub li ca tions. These restrictions apply to all Flight Safety Foundation publications. Reprints must be ordered from the Foundation. For more information, contact the director of publications by telephone: +1 (703) 739-6700, ext. 116; or by e-mail: <rozelle@fl ightsafety.org>.
What’s Your Input?In keeping with the Foundation’s independent and non par ti san mission to disseminate objective safety in for ma tion, FSF publications solicit credible con tri bu tions that foster thought-provoking dis cus sion of aviation safety issues. If you have an article proposal, a completed manuscript or a technical paper that may be appropriate for Flight Safety Digest, please contact the director of publications. Rea son able care will be taken in handling a manu script, but Flight Safety Foundation assumes no responsibility for material submitted. The publications staff reserves the right to edit all pub lished sub mis sions. The Foundation buys all rights to manuscripts and payment is made to authors upon publication. Contact the Publications De part ment for more in for ma tion.
Flight Safety DigestCopyright © 2004 by Flight Safety Foundation Inc. All rights reserved. ISSN 1057-5588
Suggestions and opinions expressed in FSF pub li ca tions belong to the author(s) and are not nec es sar i ly endorsed by Flight Safety Foundation. This information is not intended to supersede operators’/manufacturers’ policies,
practices or requirements, or to supersede gov ern ment regulations.
Staff: Roger Rozelle, director of publications; Mark Lacagnina, senior editor; Wayne Rosenkrans, senior editor; Linda Werfelman, senior editor; Rick Darby, associate editor; Karen K. Ehrlich, web and print production coordinator; Ann L. Mullikin, pro duc tion designer;
Susan D. Reed, production specialist; and Patricia Setze, librarian, Jerry Lederer Aviation Safety Library
Subscriptions: One year subscription for 12 issues includes postage and handling: US$480. Include old and new addresses when requesting address change. • Attention: Ahlam Wahdan, membership services coordinator, Flight Safety Foun da tion, Suite 300, 601 Madison Street, Al ex an dria, VA 22314 U.S. • Tele phone: +1 (703) 739-6700 • Fax: +1 (703) 739-6708 • E-mail: <wahdan@fl ightsafety.org>
Recommended