REPUBLIC OF KIRIBATI
FISHING LICENSE REVENUES
IN KIRIBATI
2017 Report
Ministry of Fisheries and Marine Resource Development and Ministry of
Finance and Economic Development
December 2017
1
Table of Contents Acronyms ...................................................................................................................................................... 2 1 Background and Introduction................................................................................................................ 3 2 Overall Revenue Trends........................................................................................................................ 3
2.1 Total Revenue ............................................................................................................................... 3
2.2 Volumes ........................................................................................................................................ 5
2.3 Prices and Catch Values ................................................................................................................ 7
2.4 Value Capture ............................................................................................................................... 9
3 International and Regional Agreements .............................................................................................. 11 3.1 Vessel Day Scheme ..................................................................................................................... 11
3.2 Other Agreements ....................................................................................................................... 12
4 Revenue Projections ............................................................................................................................ 12 4.1 El Niño Southern Oscillation ...................................................................................................... 13
4.2 Phoenix Islands Protected Area. ................................................................................................. 13
4.3 Conservation of tuna stocks ........................................................................................................ 13
5 The Way Forward ............................................................................................................................... 15
List of Figures Figure 1. Total Fishing Revenue (Excl. Development Fund), Kiribati, 2007-16 ......................................... 4
Figure 2. Total Catch by Gear, Kiribati, 2007-16 ......................................................................................... 6
Figure 3. Total Catch by Species (metric tonnes), Kiribati, 2006-16 ........................................................... 7
Figure 4. International Index of Skipjack Tuna Prices (US$) 2016 .............................................................. 8
Figure 5. Value of Catch Per Tonne by Gear in Real (2010) USD, Kiribati 2007-16 .................................. 8
Figure 6. Total Catch Value by Gear, Kiribati, 2006-16 .............................................................................. 9
Figure 7. Revenues as Proportion of Value and Per Tonne, Kiribati, 2007-16 .......................................... 10
Figure 8. Drivers of Revenue Growth (Index measure), Kiribati, 2006-16 ................................................ 11
Figure 9. Volume of BET Catch by FFA Members, 1997-2016 ................................................................ 14
List of Tables Table 1: Total Fishing License Revenue (Excl. Development Funds), Kiribati, 2006-2016 ........................ 4
Table 2: Total Catch by Gear (metric tonnes), Kiribati, 2006-2016 ............................................................. 6
Table 3: Total Catch by Species (metric tonnes), Kiribati, 2006-2016......................................................... 7
Table 4: Value per Tonne by Gear (Real 2010 USD), Kiribati, 2006-2016 ................................................. 9
Table 5: Total Catch Value by Gear, Kiribati, 2006-2016 (USD Millions).................................................. 9
Table 6: Revenues as a Proportion of Value and Per Tonne, Kiribati, 2006-16 ......................................... 10
Table 7: Fishing Agreements 2016 ............................................................................................................. 12
2
Acronyms
ABS Australian Bureau of Statistics EEZ Exclusive Economic Zone ENSO El Niño Southern Oscillation FFA Forum Fisheries Agency GDP Gross Domestic Product GoK Government of Kiribati IATTC Inter-American Tropical Tuna Commission IUU Illegal Unregulated Unreported MFED Ministry of Finance and Economic Development MFMRD Ministry of Fisheries and Marine Resources Development PIPA Phoenix Islands Protected Area PNA Parties to the Nauru Agreement RBA Reserve Bank of Australia SPC Secretariat of the Pacific Community TAE Total Allowable Effort VDS Vessel Day Scheme WCPFC Western and Central Pacific Fishing Commission
3
1 Background and Introduction This is the fourth review of fishing revenue carried out by the MFMRD in collaboration with the MFED,
SPC and FFA for the purpose of monitoring revenue from fishing licensing fees in Kiribati. The objective of
this review is to monitor the revenue from fishing license fees in Kiribati and ensure maximum sustainable
value is being obtained.
The information used in this review has been obtained from bodies such as MFED, MFMRD, SPC and FFA.
The report provides a summary of the following: revenue, volumes of catch, prices, multilateral and
bilateral agreements and sets out future trends.
The FFA countries accounts for approximately 56.4 percent of the world’s catch of tuna, or 49.8 percent
of the total value. Tuna is estimated to be worth USD 5.3 billion in the global market – USD2.6 million in
FFA countries alone. Of the fishing nations in the Pacific, Kiribati has had the highest volume of catch over
the past three years, contributing 28.4 percent to the regional total in 2016.
2 Overall Revenue Trends This section discusses the following key drivers of revenue trends: i) volumes of catch; ii) market prices of
catch; and iii) changes in revenue as a proportion of the market value of catch. The Vessel Day Scheme
(VDS) continues to remain the main factor for improving revenue performances from fishing licenses.
2.1 Total Revenue
Fishing revenue, and particularly fishing license revenue, is the main income source for the Government
of Kiribati accounting for 75 percent of total Government revenue in 2016. Over the last four years, since
the implementation of the VDS there has been a substantial increase in the revenue from fishing licenses
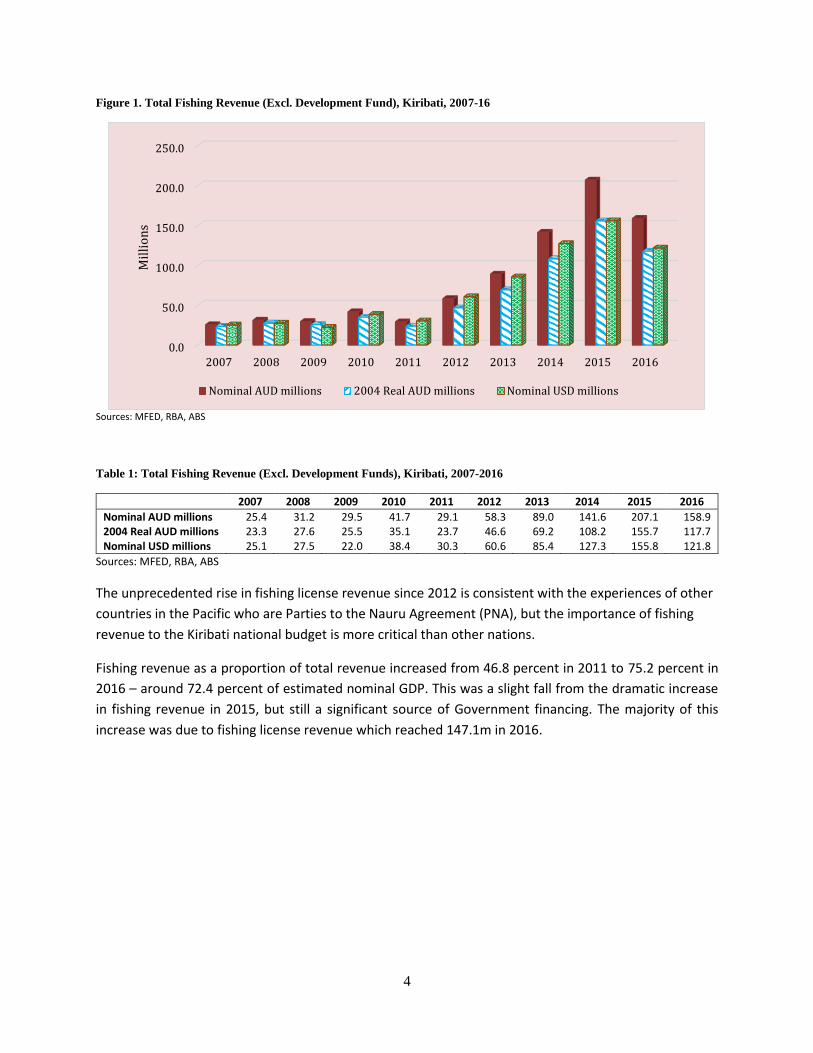
and transshipment fees (Figure 1 and Table 1). As illustrated in Figure 1 and Table 1, just 29.1 million in
total revenue was collected in 2009. Collections increased dramatically each year, reaching a peak of 207.1
million by 2015 – a 612 percent increase over 4 years.1
In 2016, the total revenue received declined to an estimated AUD 158.8 million, which is still high by
historical standards, but highlights the importance of managing volatile fishing revenue as a key fiscal
issue for Government.
1 There is a slight change in the 2015 figure reported in 2016 Fisheries Revenue Report: the 2015 figure used at the time of report writing was AUD 197.8 million. Audited figures by Ministry of Finance and Economic Development over the following year confirms the final value to be AUD 207.8 million.
4
Figure 1. Total Fishing Revenue (Excl. Development Fund), Kiribati, 2007-16
Sources: MFED, RBA, ABS
Table 1: Total Fishing Revenue (Excl. Development Funds), Kiribati, 2007-2016
2007 2008 2009 2010 2011 2012 2013 2014 2015 2016
Nominal AUD millions 25.4 31.2 29.5 41.7 29.1 58.3 89.0 141.6 207.1 158.9 2004 Real AUD millions 23.3 27.6 25.5 35.1 23.7 46.6 69.2 108.2 155.7 117.7 Nominal USD millions 25.1 27.5 22.0 38.4 30.3 60.6 85.4 127.3 155.8 121.8
Sources: MFED, RBA, ABS
The unprecedented rise in fishing license revenue since 2012 is consistent with the experiences of other
countries in the Pacific who are Parties to the Nauru Agreement (PNA), but the importance of fishing
revenue to the Kiribati national budget is more critical than other nations.
Fishing revenue as a proportion of total revenue increased from 46.8 percent in 2011 to 75.2 percent in
2016 – around 72.4 percent of estimated nominal GDP. This was a slight fall from the dramatic increase
in fishing revenue in 2015, but still a significant source of Government financing. The majority of this
increase was due to fishing license revenue which reached 147.1m in 2016.
0.0
50.0
100.0
150.0
200.0
250.0
2007 2008 2009 2010 2011 2012 2013 2014 2015 2016
Mil
lio
ns
Nominal AUD millions 2004 Real AUD millions Nominal USD millions
5
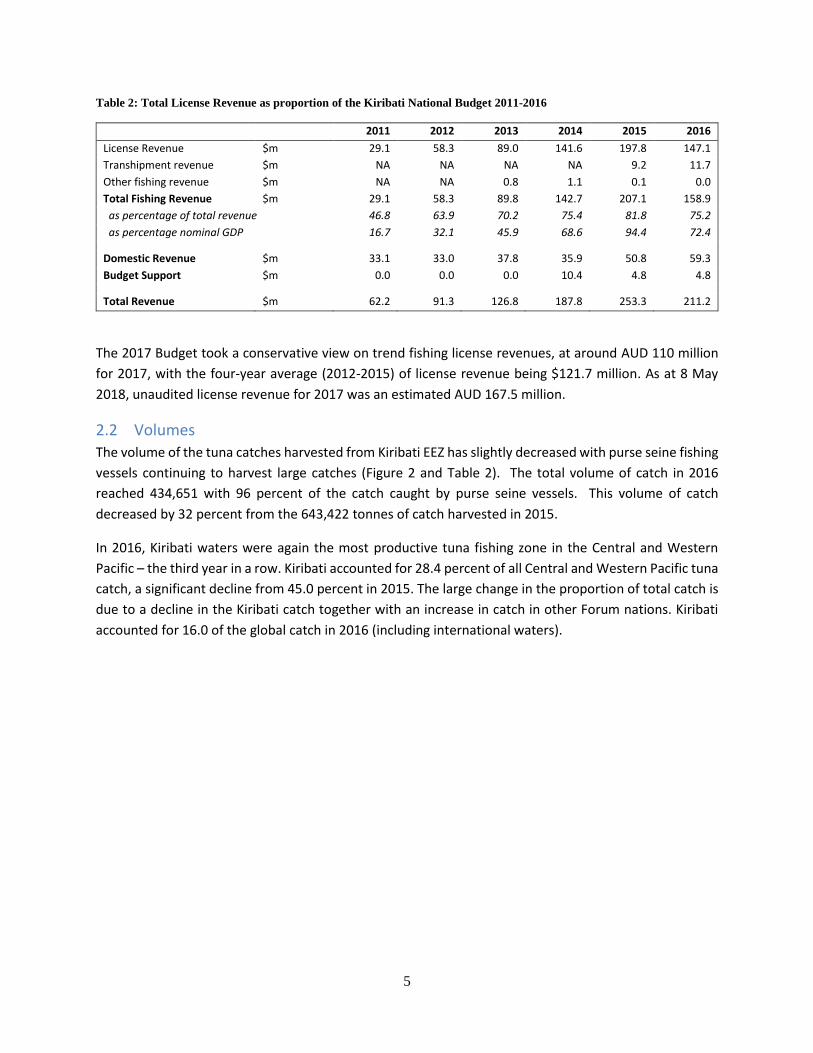
Table 2: Total License Revenue as proportion of the Kiribati National Budget 2011-2016
2011 2012 2013 2014 2015 2016
License Revenue $m 29.1 58.3 89.0 141.6 197.8 147.1
Transhipment revenue $m NA NA NA NA 9.2 11.7
Other fishing revenue $m NA NA 0.8 1.1 0.1 0.0
Total Fishing Revenue $m 29.1 58.3 89.8 142.7 207.1 158.9
as percentage of total revenue 46.8 63.9 70.2 75.4 81.8 75.2
as percentage nominal GDP 16.7 32.1 45.9 68.6 94.4 72.4
Domestic Revenue $m 33.1 33.0 37.8 35.9 50.8 59.3
Budget Support $m 0.0 0.0 0.0 10.4 4.8 4.8
Total Revenue $m 62.2 91.3 126.8 187.8 253.3 211.2
The 2017 Budget took a conservative view on trend fishing license revenues, at around AUD 110 million
for 2017, with the four-year average (2012-2015) of license revenue being $121.7 million. As at 8 May
2018, unaudited license revenue for 2017 was an estimated AUD 167.5 million.
2.2 Volumes
The volume of the tuna catches harvested from Kiribati EEZ has slightly decreased with purse seine fishing
vessels continuing to harvest large catches (Figure 2 and Table 2). The total volume of catch in 2016
reached 434,651 with 96 percent of the catch caught by purse seine vessels. This volume of catch
decreased by 32 percent from the 643,422 tonnes of catch harvested in 2015.
In 2016, Kiribati waters were again the most productive tuna fishing zone in the Central and Western
Pacific – the third year in a row. Kiribati accounted for 28.4 percent of all Central and Western Pacific tuna
catch, a significant decline from 45.0 percent in 2015. The large change in the proportion of total catch is
due to a decline in the Kiribati catch together with an increase in catch in other Forum nations. Kiribati
accounted for 16.0 of the global catch in 2016 (including international waters).
6
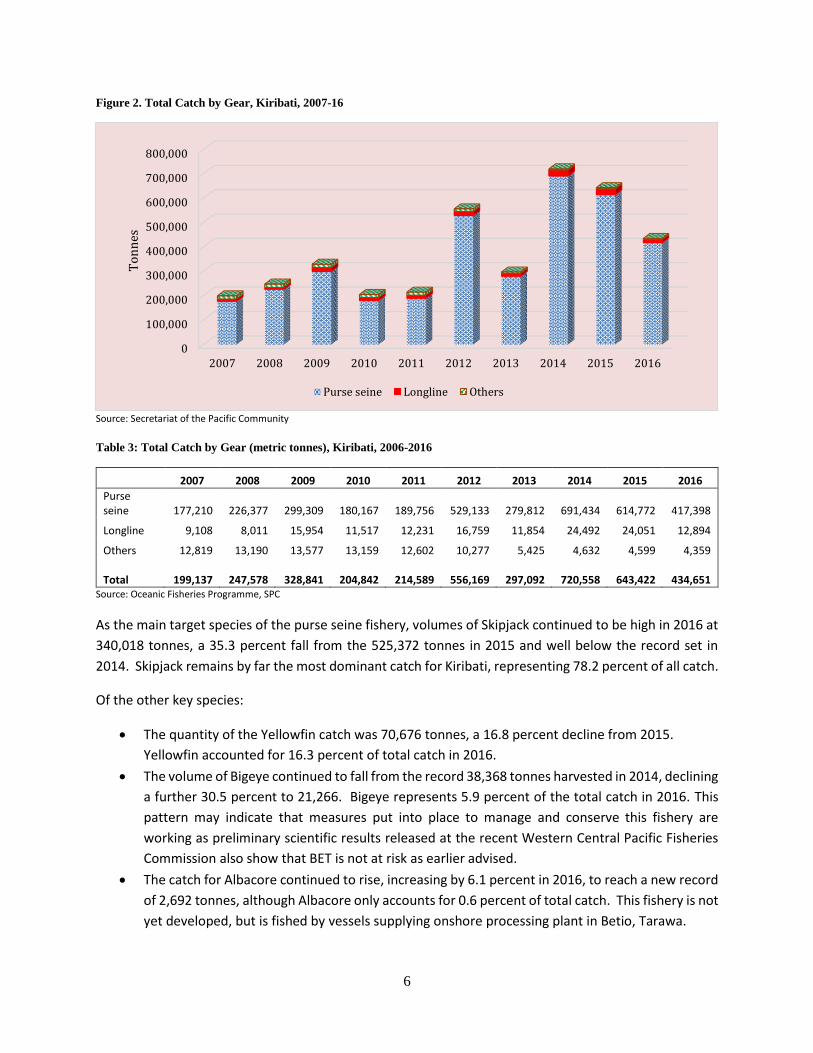
Figure 2. Total Catch by Gear, Kiribati, 2007-16
Source: Secretariat of the Pacific Community
Table 3: Total Catch by Gear (metric tonnes), Kiribati, 2006-2016
2007 2008 2009 2010 2011 2012 2013 2014 2015 2016
Purse seine 177,210
226,377
299,309
180,167
189,756
529,133
279,812
691,434
614,772
417,398
Longline 9,108 8,011 15,954 11,517 12,231 16,759 11,854 24,492 24,051 12,894
Others 12,819 13,190 13,577 13,159 12,602 10,277 5,425 4,632 4,599 4,359
Total
199,137
247,578
328,841
204,842
214,589
556,169
297,092
720,558
643,422
434,651 Source: Oceanic Fisheries Programme, SPC
As the main target species of the purse seine fishery, volumes of Skipjack continued to be high in 2016 at
340,018 tonnes, a 35.3 percent fall from the 525,372 tonnes in 2015 and well below the record set in
2014. Skipjack remains by far the most dominant catch for Kiribati, representing 78.2 percent of all catch.
Of the other key species:
The quantity of the Yellowfin catch was 70,676 tonnes, a 16.8 percent decline from 2015.
Yellowfin accounted for 16.3 percent of total catch in 2016.
The volume of Bigeye continued to fall from the record 38,368 tonnes harvested in 2014, declining
a further 30.5 percent to 21,266. Bigeye represents 5.9 percent of the total catch in 2016. This
pattern may indicate that measures put into place to manage and conserve this fishery are
working as preliminary scientific results released at the recent Western Central Pacific Fisheries
Commission also show that BET is not at risk as earlier advised.
The catch for Albacore continued to rise, increasing by 6.1 percent in 2016, to reach a new record
of 2,692 tonnes, although Albacore only accounts for 0.6 percent of total catch. This fishery is not
yet developed, but is fished by vessels supplying onshore processing plant in Betio, Tarawa.
0
100,000
200,000
300,000
400,000
500,000
600,000
700,000
800,000
2007 2008 2009 2010 2011 2012 2013 2014 2015 2016
To
nn
es
Purse seine Longline Others
7
In terms of purse seine by-catch, Bigeye accounted for 3.7 percent of the total catch, an increase from the
2.8 percent experienced in 2015. The 2016 rate of by-catch for Bigeye is above the regional average of 3.3
percent. If Kiribati is excluded from the regional totals, the difference is even more pronounced, with
Bigeye only accounting for 3.1 percent of the total purse seine catch in other fisheries.
Yellowfin accounted for 15.5 percent of the total purse seine catch, well below the regional average of
22.7 percent (25.7 percent excluding Kiribati).
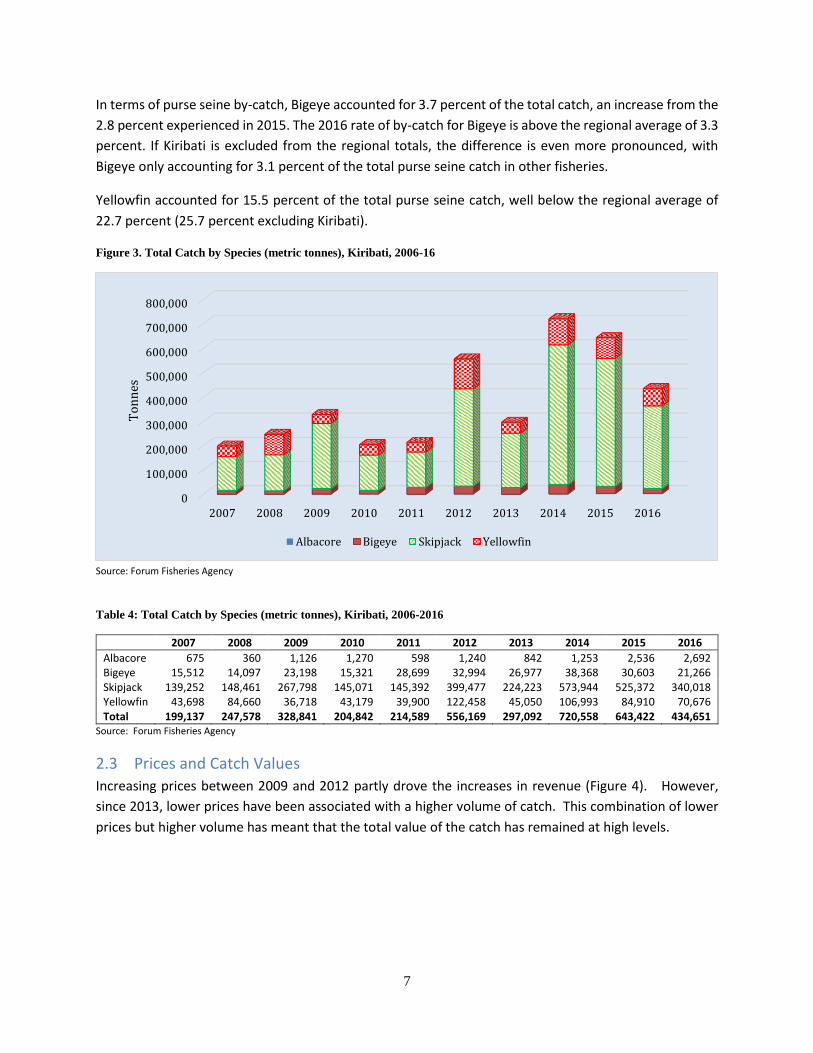
Figure 3. Total Catch by Species (metric tonnes), Kiribati, 2006-16
Source: Forum Fisheries Agency
Table 4: Total Catch by Species (metric tonnes), Kiribati, 2006-2016
2007 2008 2009 2010 2011 2012 2013 2014 2015 2016
Albacore 675 360 1,126 1,270 598 1,240 842 1,253 2,536 2,692 Bigeye 15,512 14,097 23,198 15,321 28,699 32,994 26,977 38,368 30,603 21,266 Skipjack 139,252 148,461 267,798 145,071 145,392 399,477 224,223 573,944 525,372 340,018 Yellowfin 43,698 84,660 36,718 43,179 39,900 122,458 45,050 106,993 84,910 70,676 Total 199,137 247,578 328,841 204,842 214,589 556,169 297,092 720,558 643,422 434,651
Source: Forum Fisheries Agency
2.3 Prices and Catch Values
Increasing prices between 2009 and 2012 partly drove the increases in revenue (Figure 4). However,
since 2013, lower prices have been associated with a higher volume of catch. This combination of lower
prices but higher volume has meant that the total value of the catch has remained at high levels.
0
100,000
200,000
300,000
400,000
500,000
600,000
700,000
800,000
2007 2008 2009 2010 2011 2012 2013 2014 2015 2016
To
nn
es
Albacore Bigeye Skipjack Yellowfin
8
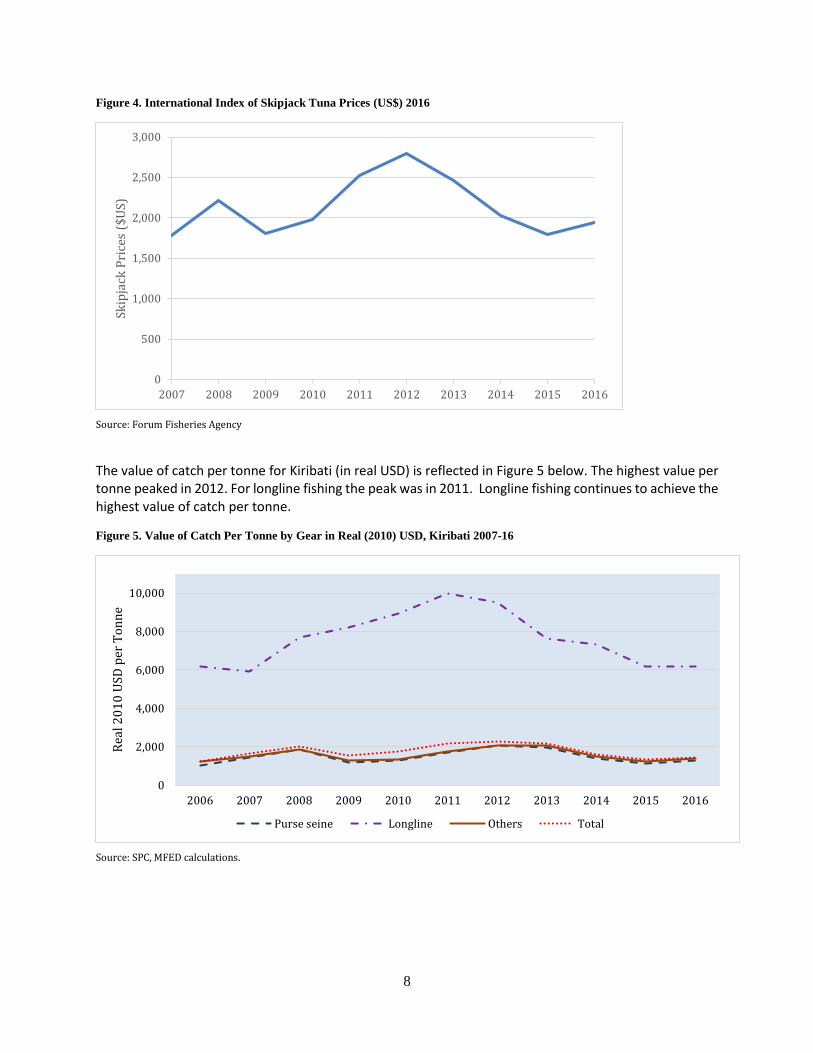
Figure 4. International Index of Skipjack Tuna Prices (US$) 2016
Source: Forum Fisheries Agency
The value of catch per tonne for Kiribati (in real USD) is reflected in Figure 5 below. The highest value per tonne peaked in 2012. For longline fishing the peak was in 2011. Longline fishing continues to achieve the highest value of catch per tonne.
Figure 5. Value of Catch Per Tonne by Gear in Real (2010) USD, Kiribati 2007-16
Source: SPC, MFED calculations.
0
500
1,000
1,500
2,000
2,500
3,000
2007 2008 2009 2010 2011 2012 2013 2014 2015 2016
Skip
jack
Pri
ces
($U
S)
0
2,000
4,000
6,000
8,000
10,000
2006 2007 2008 2009 2010 2011 2012 2013 2014 2015 2016
Rea
l 20
10
USD
per
To
nn
e
Purse seine Longline Others Total
9
Table 5: Value per Tonne by Gear (Real 2010 USD), Kiribati, 2006-2016
2007 2008 2009 2010 2011 2012 2013 2014 2015 2016
Purse seine 1,456 1,849 1,198 1,305 1,762 2,191 2,097 1,504 1,249 1,455 Longline 5,964 7,756 8,233 8,964 10,363 10,027 8,205 7,947 6,721 6,815 Others 1,519 1,869 1,294 1,350 1,842 2,175 2,210 1,631 1,372 1,514 Total 1,666 2,042 1,543 1,738 2,257 2,426 2,342 1,724 1,455 1,615
Source: Forum Fisheries Agency, World Bank, MFEP.
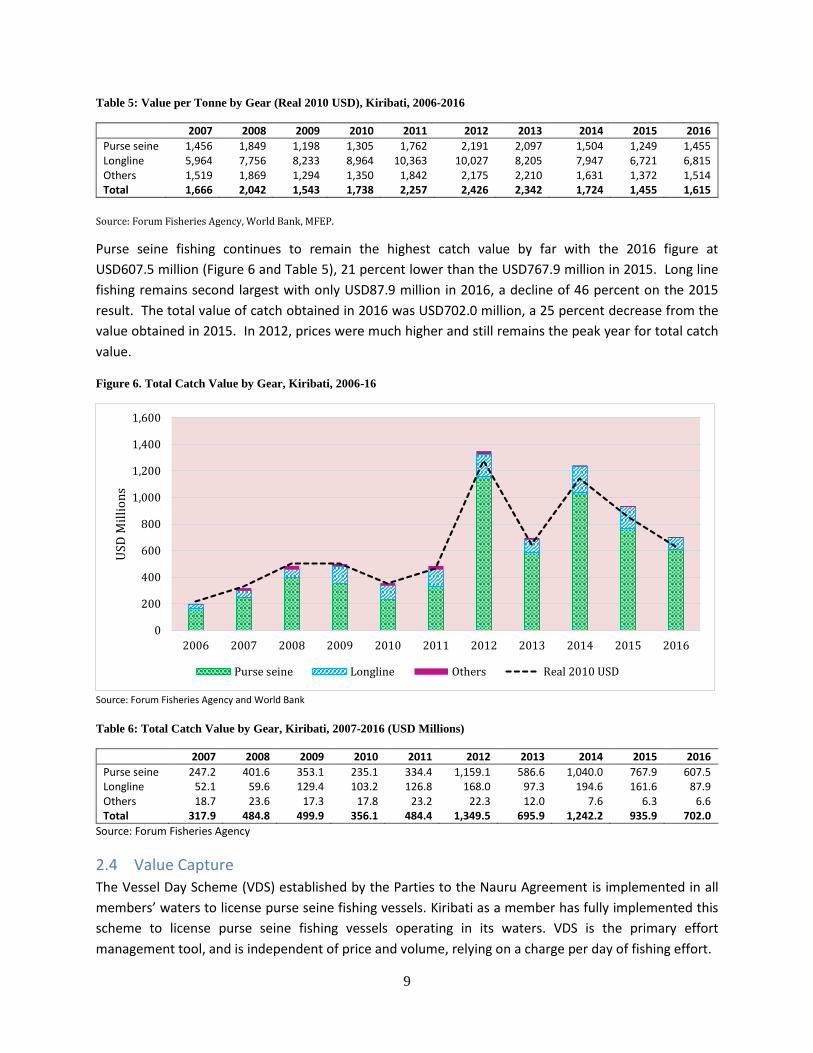
Purse seine fishing continues to remain the highest catch value by far with the 2016 figure at
USD607.5 million (Figure 6 and Table 5), 21 percent lower than the USD767.9 million in 2015. Long line
fishing remains second largest with only USD87.9 million in 2016, a decline of 46 percent on the 2015
result. The total value of catch obtained in 2016 was USD702.0 million, a 25 percent decrease from the
value obtained in 2015. In 2012, prices were much higher and still remains the peak year for total catch
value.
Figure 6. Total Catch Value by Gear, Kiribati, 2006-16
Source: Forum Fisheries Agency and World Bank
Table 6: Total Catch Value by Gear, Kiribati, 2007-2016 (USD Millions)
2007 2008 2009 2010 2011 2012 2013 2014 2015 2016
Purse seine 247.2 401.6 353.1 235.1 334.4 1,159.1 586.6 1,040.0 767.9 607.5 Longline 52.1 59.6 129.4 103.2 126.8 168.0 97.3 194.6 161.6 87.9 Others 18.7 23.6 17.3 17.8 23.2 22.3 12.0 7.6 6.3 6.6 Total 317.9 484.8 499.9 356.1 484.4 1,349.5 695.9 1,242.2 935.9 702.0
Source: Forum Fisheries Agency
2.4 Value Capture
The Vessel Day Scheme (VDS) established by the Parties to the Nauru Agreement is implemented in all
members’ waters to license purse seine fishing vessels. Kiribati as a member has fully implemented this
scheme to license purse seine fishing vessels operating in its waters. VDS is the primary effort
management tool, and is independent of price and volume, relying on a charge per day of fishing effort.
0
200
400
600
800
1,000
1,200
1,400
1,600
2006 2007 2008 2009 2010 2011 2012 2013 2014 2015 2016
USD
Mil
lio
ns
Purse seine Longline Others Real 2010 USD
10
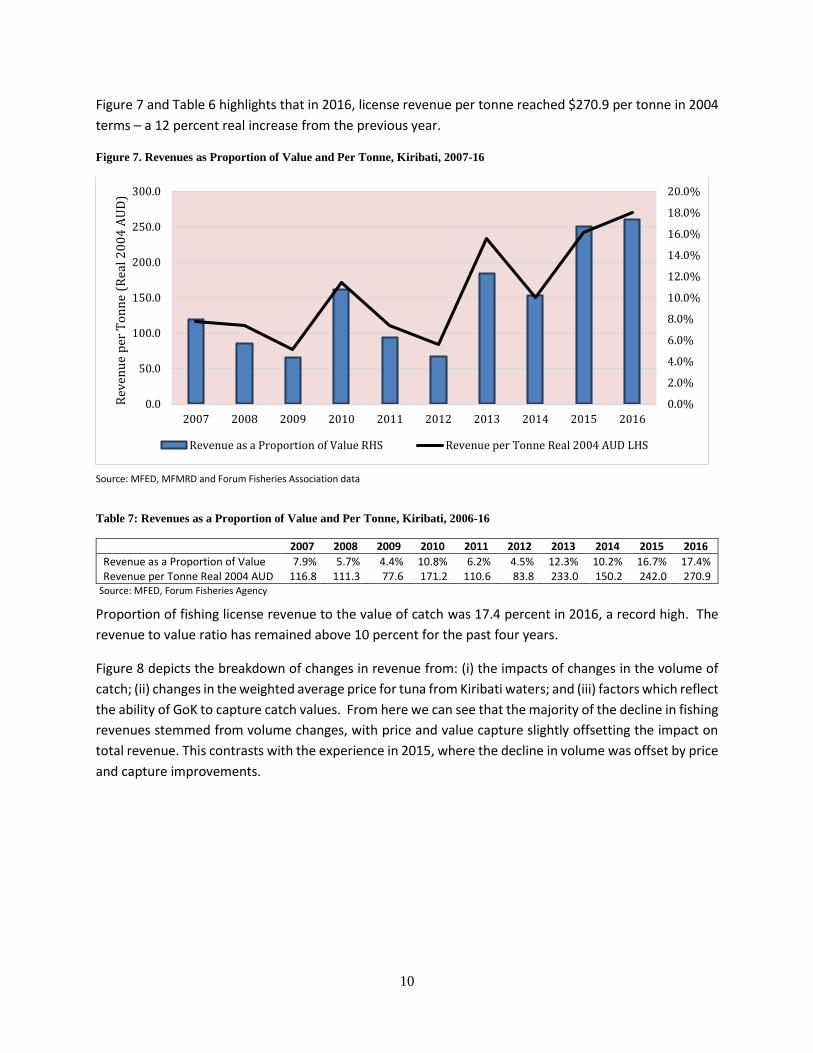
Figure 7 and Table 6 highlights that in 2016, license revenue per tonne reached $270.9 per tonne in 2004
terms – a 12 percent real increase from the previous year.
Figure 7. Revenues as Proportion of Value and Per Tonne, Kiribati, 2007-16
Source: MFED, MFMRD and Forum Fisheries Association data
Table 7: Revenues as a Proportion of Value and Per Tonne, Kiribati, 2006-16
2007 2008 2009 2010 2011 2012 2013 2014 2015 2016
Revenue as a Proportion of Value 7.9% 5.7% 4.4% 10.8% 6.2% 4.5% 12.3% 10.2% 16.7% 17.4% Revenue per Tonne Real 2004 AUD 116.8 111.3 77.6 171.2 110.6 83.8 233.0 150.2 242.0 270.9
Source: MFED, Forum Fisheries Agency
Proportion of fishing license revenue to the value of catch was 17.4 percent in 2016, a record high. The
revenue to value ratio has remained above 10 percent for the past four years.
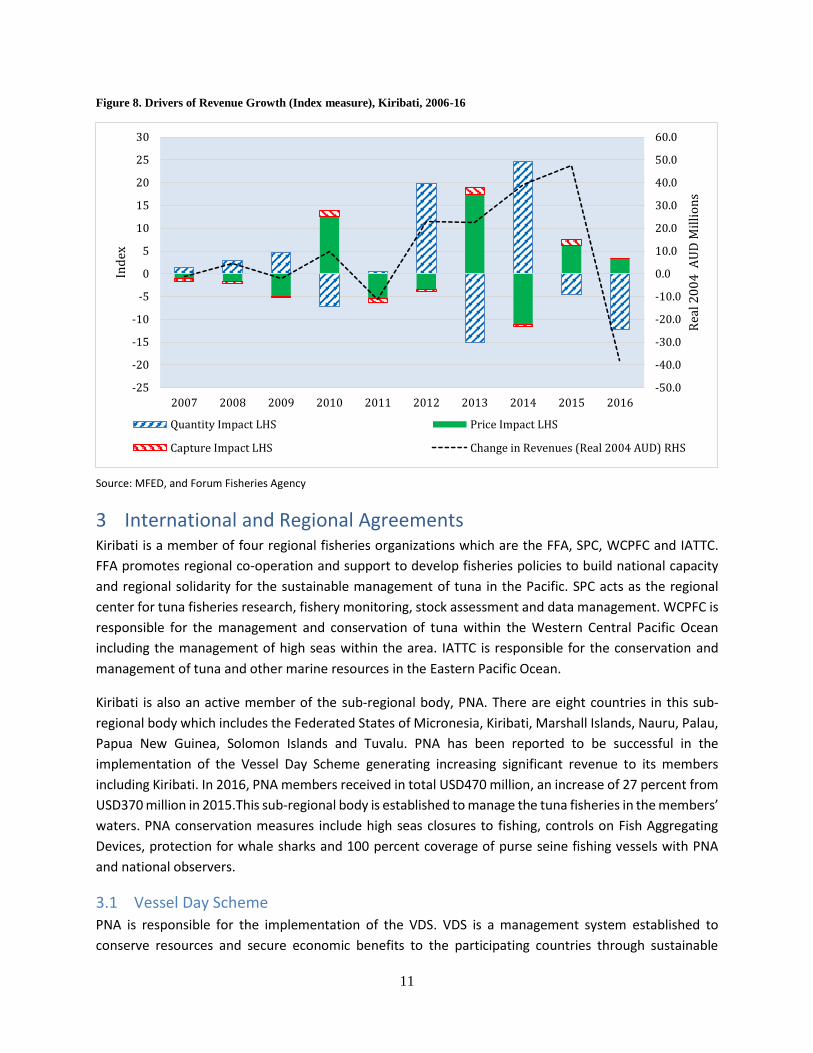
Figure 8 depicts the breakdown of changes in revenue from: (i) the impacts of changes in the volume of
catch; (ii) changes in the weighted average price for tuna from Kiribati waters; and (iii) factors which reflect
the ability of GoK to capture catch values. From here we can see that the majority of the decline in fishing
revenues stemmed from volume changes, with price and value capture slightly offsetting the impact on
total revenue. This contrasts with the experience in 2015, where the decline in volume was offset by price
and capture improvements.
0.0%
2.0%
4.0%
6.0%
8.0%
10.0%
12.0%
14.0%
16.0%
18.0%
20.0%
0.0
50.0
100.0
150.0
200.0
250.0
300.0
2007 2008 2009 2010 2011 2012 2013 2014 2015 2016
Rev
enu
e p
er T
on
ne
(Rea
l 20
04
AU
D)
Revenue as a Proportion of Value RHS Revenue per Tonne Real 2004 AUD LHS
11
Figure 8. Drivers of Revenue Growth (Index measure), Kiribati, 2006-16
Source: MFED, and Forum Fisheries Agency
3 International and Regional Agreements Kiribati is a member of four regional fisheries organizations which are the FFA, SPC, WCPFC and IATTC.
FFA promotes regional co-operation and support to develop fisheries policies to build national capacity
and regional solidarity for the sustainable management of tuna in the Pacific. SPC acts as the regional
center for tuna fisheries research, fishery monitoring, stock assessment and data management. WCPFC is
responsible for the management and conservation of tuna within the Western Central Pacific Ocean
including the management of high seas within the area. IATTC is responsible for the conservation and
management of tuna and other marine resources in the Eastern Pacific Ocean.
Kiribati is also an active member of the sub-regional body, PNA. There are eight countries in this sub-
regional body which includes the Federated States of Micronesia, Kiribati, Marshall Islands, Nauru, Palau,
Papua New Guinea, Solomon Islands and Tuvalu. PNA has been reported to be successful in the
implementation of the Vessel Day Scheme generating increasing significant revenue to its members
including Kiribati. In 2016, PNA members received in total USD470 million, an increase of 27 percent from
USD370 million in 2015.This sub-regional body is established to manage the tuna fisheries in the members’
waters. PNA conservation measures include high seas closures to fishing, controls on Fish Aggregating
Devices, protection for whale sharks and 100 percent coverage of purse seine fishing vessels with PNA
and national observers.
3.1 Vessel Day Scheme
PNA is responsible for the implementation of the VDS. VDS is a management system established to
conserve resources and secure economic benefits to the participating countries through sustainable
-50.0
-40.0
-30.0
-20.0
-10.0
0.0
10.0
20.0
30.0
40.0
50.0
60.0
-25
-20
-15
-10
-5
0
5
10
15
20
25
30
2007 2008 2009 2010 2011 2012 2013 2014 2015 2016
Rea
l 20
04
AU
D M
illi
on
s
Ind
ex
Quantity Impact LHS Price Impact LHS
Capture Impact LHS Change in Revenues (Real 2004 AUD) RHS
12
development. The scheme sets overall limits on the number of days purse seine fishing vessels can be
licensed to fish in PNA waters (Total Allowable Effort). Days are allocated to each country (Party Allowable
Effort) to manage but the arrangement also allows days to be transferred to other participating countries
in the scheme. The scheme has been considered to be very successful since its implementation providing
these eight PNA member countries with significant revenue. The members combined have experienced
an increase of more than seven-fold from the USD64 million in revenue in 2010 to an estimated USD470
million in 2016. PNA ministers agreed to maintain the minimum benchmark fee for VDS days for 2016 at
USD8,000 but most fishing nations are paying significantly more than this benchmark price to ensure
security of fishing days in these lucrative waters.
The PNA total allowable effort was set at 44,890 days for 2016 and indicative 45,590 days for 2017 and
2018. Kiribati has continued its efforts to remain within its Party Allowable Efforts.
All members of the PNA except Kiribati have signed up for the long-line VDS system. Kiribati will trial a
catch-based management system based on the allocated longline PAE as it seriously considers the
sustainability of the tuna stocks. Kiribati plans to implement its catch management system in mid-2018.
3.2 Other Agreements
Kiribati has several bi-lateral agreements with its traditional partners fishing in its waters since early
1990’s. There are also other fishing agreements with countries such as the European Union and United
States of America. The latter is a multi-lateral treaty involving other Pacific Island Parties including Kiribati.
Note that no EU vessels operated in Kiribati waters in 2016 therefore no revenue was received from this
arrangement last year. UST treaty vessels had bilateral arrangements with Kiribati once their allocated
days under the UST treaty were fully utilized.
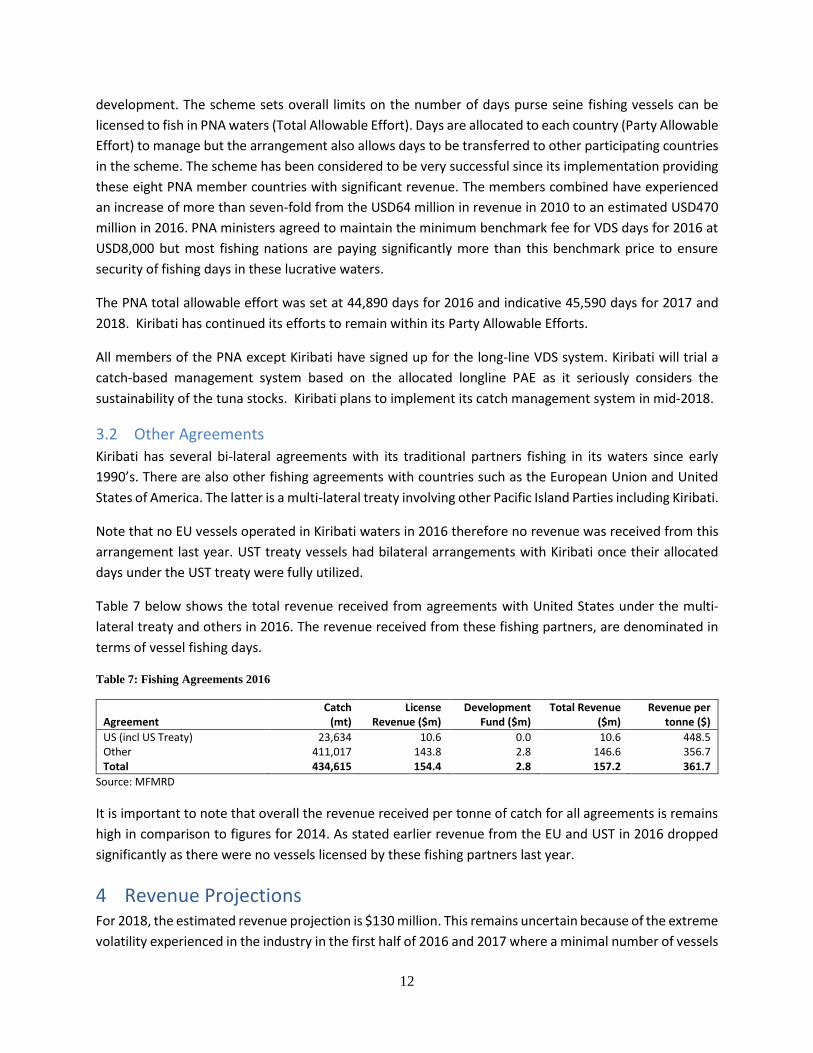
Table 7 below shows the total revenue received from agreements with United States under the multi-
lateral treaty and others in 2016. The revenue received from these fishing partners, are denominated in
terms of vessel fishing days.
Table 7: Fishing Agreements 2016
Agreement Catch
(mt) License
Revenue ($m) Development
Fund ($m) Total Revenue
($m) Revenue per
tonne ($)
US (incl US Treaty) 23,634 10.6 0.0 10.6 448.5 Other 411,017 143.8 2.8 146.6 356.7 Total 434,615 154.4 2.8 157.2 361.7
Source: MFMRD
It is important to note that overall the revenue received per tonne of catch for all agreements is remains
high in comparison to figures for 2014. As stated earlier revenue from the EU and UST in 2016 dropped
significantly as there were no vessels licensed by these fishing partners last year.
4 Revenue Projections For 2018, the estimated revenue projection is $130 million. This remains uncertain because of the extreme
volatility experienced in the industry in the first half of 2016 and 2017 where a minimal number of vessels
13
fished in Kiribati waters early in the year. Weather patterns will play a large part in the movement of fish,
and exchange rate volatility will affect the total revenue. Protection of endangered species of tuna such
as BET will continue to be an issue of concern.
4.1 El Niño Southern Oscillation
The El Niño Southern Oscillation (ENSO) event that commenced in May 2015 ended in May 20162.El Niño
is an irregular natural occurring event that is associated with warmer waters in the central Pacific. In the
Western and Central Pacific Ocean (WCPO), tuna stocks tend to move eastwards and are more abundant
during El Nińo period. For Kiribati, El Niño means higher rainfall and higher fish stocks which are attracted
to the warmer seas.
Currently ENSO indicators in the Pacific Ocean are neutral. Most climate models show that the central
Pacific Ocean will continue to cool and the likelihood of La Niña developing is about 50 percent. In a La
Niña event, drought conditions prevail in Kiribati and fish stocks are lower than normal.
4.2 Phoenix Islands Protected Area. PIPA remains closed prohibiting fishing. This area is 11.3 percent of the Exclusive Economic Zone of
Kiribati. The total area is equivalent to the size of the State of California. PIPA is the largest designated
Marine Protected Area in the world and was placed on the World Heritage List in 2010. PIPA aims to
conserve fisheries stocks and maintain biodiversity. The World Heritage List describes PIPA as a
“superlative natural phenomenon of global importance”3.
The effects of the closure of PIPA were originally uncertain, however, revenue in 2016 was not unduly
affected as MFMRD has continued its efforts to increase revenue through other means. The Ministry
continued to increase transshipment revenue and strengthened its monitoring and compliance efforts to
fight IUU fishing activities in close collaboration with the Police for vessels operating in the EEZ.
In June 2015, a Marshall Islands-flagged Taiwanese purse seine fishing vessel was seized for illegal fishing
activities in the PIPA region. The owners paid USD2 million in fines in 2017. For 2016, revenue from
penalties accumulated to AUD2.2 million. That figure doubled in 2017 as various fines for vessels
amounted to AU$4.4 million, indicating that MFMRD is committed to fighting IUU fishing activities in its
waters.
4.3 Conservation of tuna stocks
The 2017 assessment by SPC4 concluded that the status of bigeye tuna is not in an overfished status and
no overfishing is occurring. The assessment used a new growth data confirmed to provide a more accurate
growth for bigeye compared with the old growth data used in previous assessment. 20 percent is the
limit that the WCPFC has decided represents an unacceptable risk to the stock. The BET tuna catch in
2 Bureau of Meteorology, Australia 3 www.whc.unesco.org 4 Pacific Community, “The Western and Central Pacific Tuna Fishery: 2014 Overview and Status of Stocks.”
14
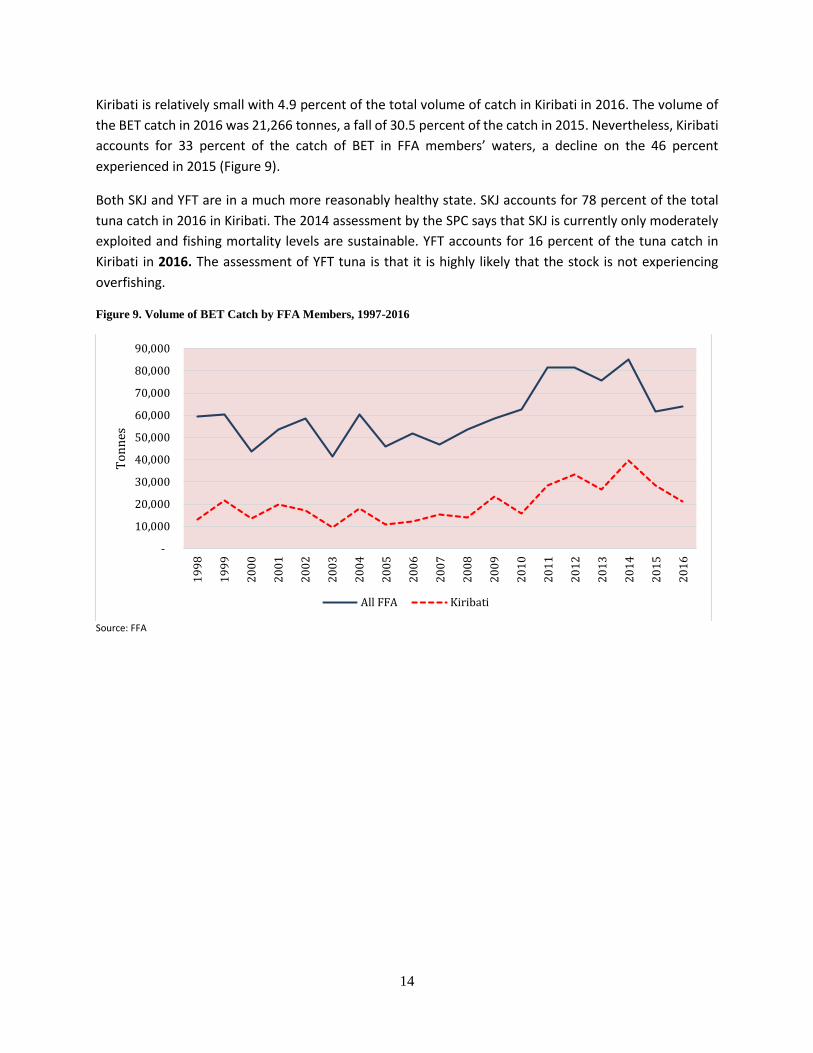
Kiribati is relatively small with 4.9 percent of the total volume of catch in Kiribati in 2016. The volume of
the BET catch in 2016 was 21,266 tonnes, a fall of 30.5 percent of the catch in 2015. Nevertheless, Kiribati
accounts for 33 percent of the catch of BET in FFA members’ waters, a decline on the 46 percent
experienced in 2015 (Figure 9).
Both SKJ and YFT are in a much more reasonably healthy state. SKJ accounts for 78 percent of the total
tuna catch in 2016 in Kiribati. The 2014 assessment by the SPC says that SKJ is currently only moderately
exploited and fishing mortality levels are sustainable. YFT accounts for 16 percent of the tuna catch in
Kiribati in 2016. The assessment of YFT tuna is that it is highly likely that the stock is not experiencing
overfishing.
Figure 9. Volume of BET Catch by FFA Members, 1997-2016
Source: FFA
-
10,000
20,000
30,000
40,000
50,000
60,000
70,000
80,000
90,000
19
98
19
99
20
00
20
01
20
02
20
03
20
04
20
05
20
06
20
07
20
08
20
09
20
10
20
11
20
12
20
13
20
14
20
15
20
16
To
nn
es
All FFA Kiribati
15
5 The Way Forward With the Government’s Kiribati 20 Year vision, focusing on fisheries and tourism sectors, MFMRD aims to
develop a transshipment hub in Tarawa and Kiritimati offering services for fishing vessels to support their
operations when fishing in Kiribati and nearby waters. This will also include expanding tuna processing
which will produce positive results in the near future to both Kiribati and fishing operators.
A new freight agreement with Nauru Airlines means that greater quantities of higher-grade tuna will be
able to be exported in the future. In addition, the signing of the agreement with Solomon Airlines will also
contribute to the export of fish overseas. Both have commenced in 2017 and will provide additional export
income and boost employment through value addition of these resources in country.
Monitoring and surveillance of fishing vessel movements continues. The observer program continues to
assist monitoring and surveillance efforts through the placement of observers on board vessels operating
in the waters of Kiribati. In 2016, Kiribati purse-seine flagged vessels including chartered vessels were 100
percent covered by observers. An observer coverage of 5 percent was attained for Kiribati longline vessels
in 2016.
The Government of Kiribati is keen to explore wider benefits from participation in the value-added
products for tuna. The GoK is keen to expand opportunities for employment in the fishing industry such
as in overseas plants. Fishing vessels and supporting vessels such as mother carriers and tankers operating
in Kiribati waters are also required to employ a minimum number of crew during the term of the license.
The key to the maximization of revenue from tuna fishing is the long-term sustainability of the industry.
Greater protection for BET tuna, as well as other commercially valuable species, and enforcement of the
PNA Total Allowable Effort, together with the operations of PIPA will remain the key areas for
sustainability of the fishing stock.
Recommended