Fish, Shellfish and Nearshore Habitat: Exploring the Land-water Interface
Denise Breitburg Smithsonian Environmental Research Center
Image: www c
Fish, Shellfish and Nearshore Habitat: Exploring the Land-water Interface
Denise Breitburg Smithsonian Environmental Research Center
Image: www c
Land use & shoreline hardening Diel-cycling hypoxia and acidification
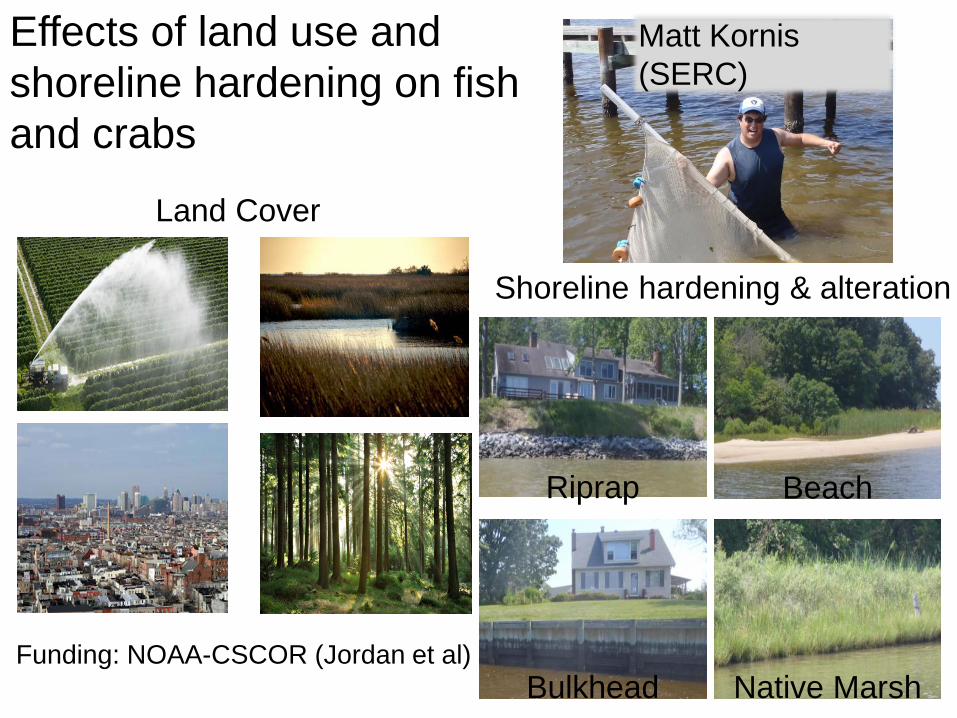
Effects of land use and shoreline hardening on fish and crabs
Land Cover
Riprap
Bulkhead
Beach
Native Marsh
Shoreline hardening & alteration
Matt Kornis (SERC)
Funding: NOAA-CSCOR (Jordan et al)
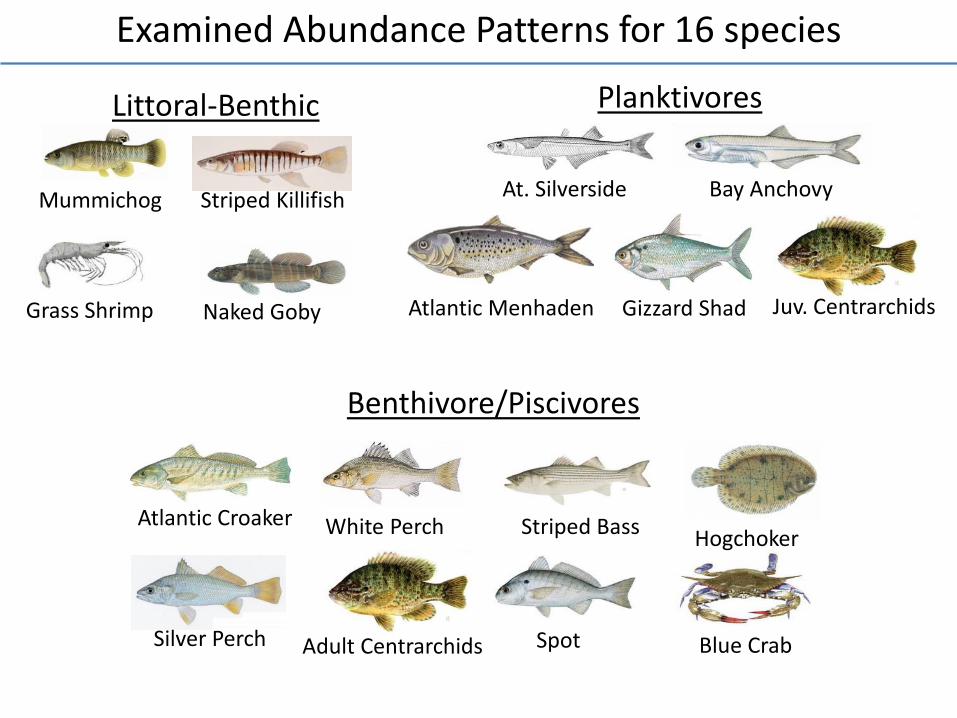
Examined Abundance Patterns for 16 species
Littoral-Benthic
Naked Goby
Mummichog Striped Killifish
Grass Shrimp
Blue Crab
White Perch Striped Bass
Adult Centrarchids Spot
Atlantic Croaker
Silver Perch
Benthivore/Piscivores
Hogchoker
At. Silverside Bay Anchovy
Planktivores
Atlantic Menhaden Juv. Centrarchids Gizzard Shad
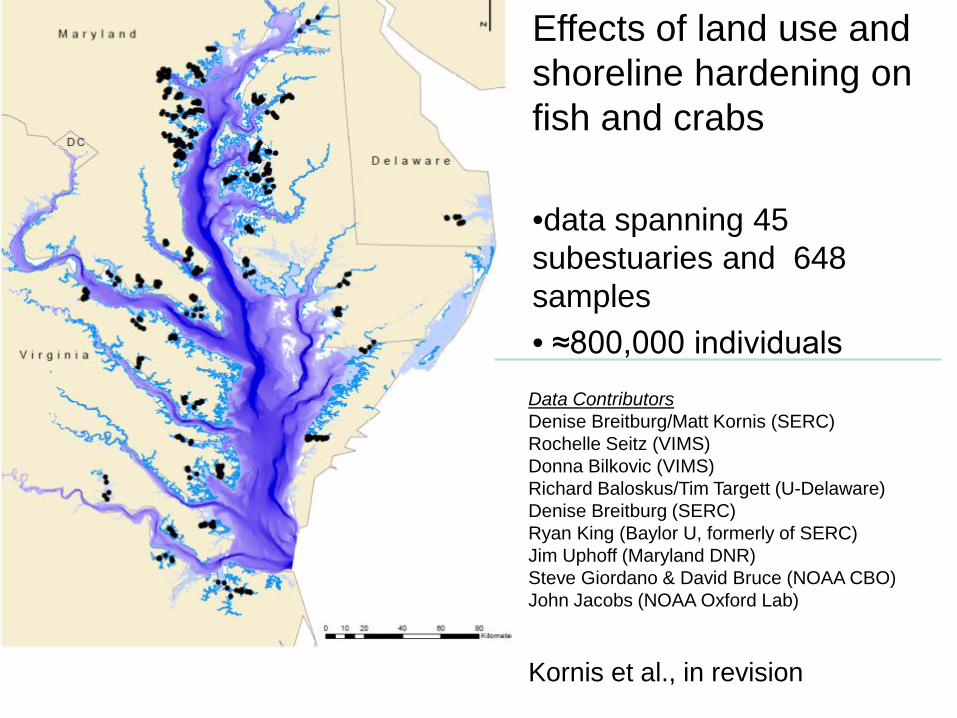
Effects of land use and shoreline hardening on fish and crabs •data spanning 45 subestuaries and 648 samples • ≈800,000 individuals
Data Contributors Denise Breitburg/Matt Kornis (SERC) Rochelle Seitz (VIMS) Donna Bilkovic (VIMS) Richard Baloskus/Tim Targett (U-Delaware) Denise Breitburg (SERC) Ryan King (Baylor U, formerly of SERC) Jim Uphoff (Maryland DNR) Steve Giordano & David Bruce (NOAA CBO) John Jacobs (NOAA Oxford Lab) Kornis et al., in revision
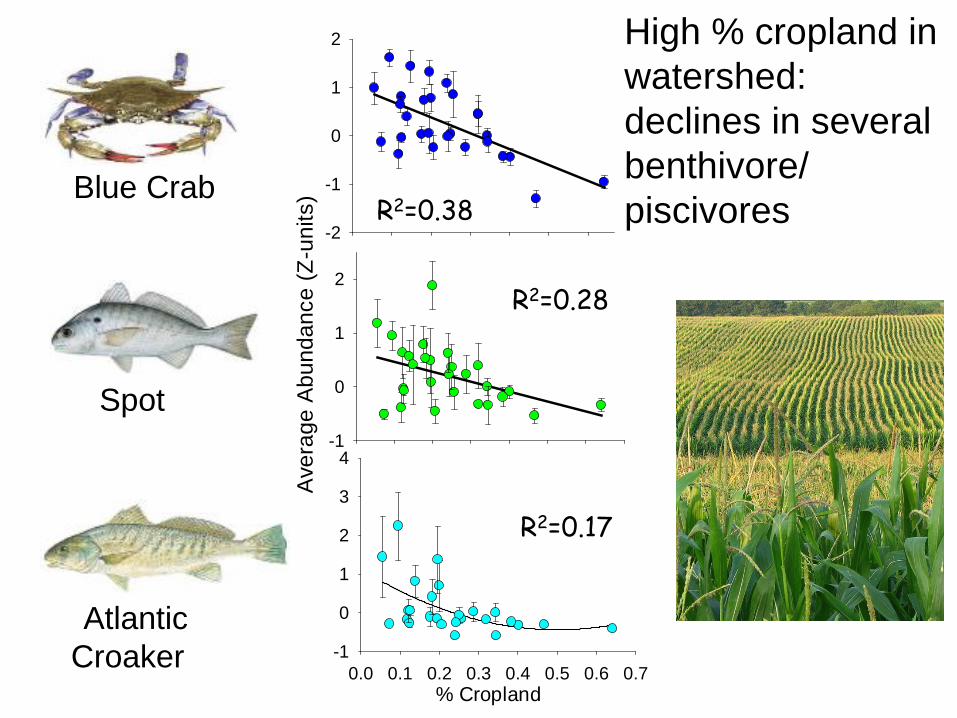
Blue Crab
Spot
Atlantic Croaker
-2
-1
0
1
2
Ave
rage
Abu
ndan
ce (Z
-uni
ts)
-1
0
1
2
% Cropland0.0 0.1 0.2 0.3 0.4 0.5 0.6 0.7
-1
0
1
2
3
4
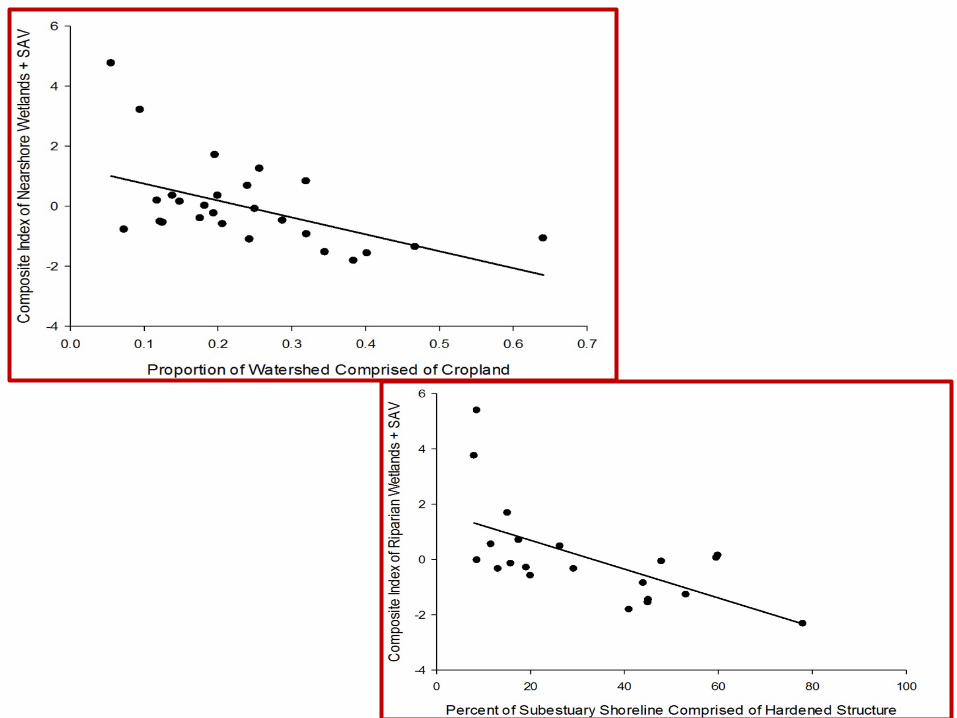
Proportion of Watershed Comprised of Cropland
R2=0.38
R2=0.17
R2=0.28
High % cropland in watershed: declines in several benthivore/ piscivores
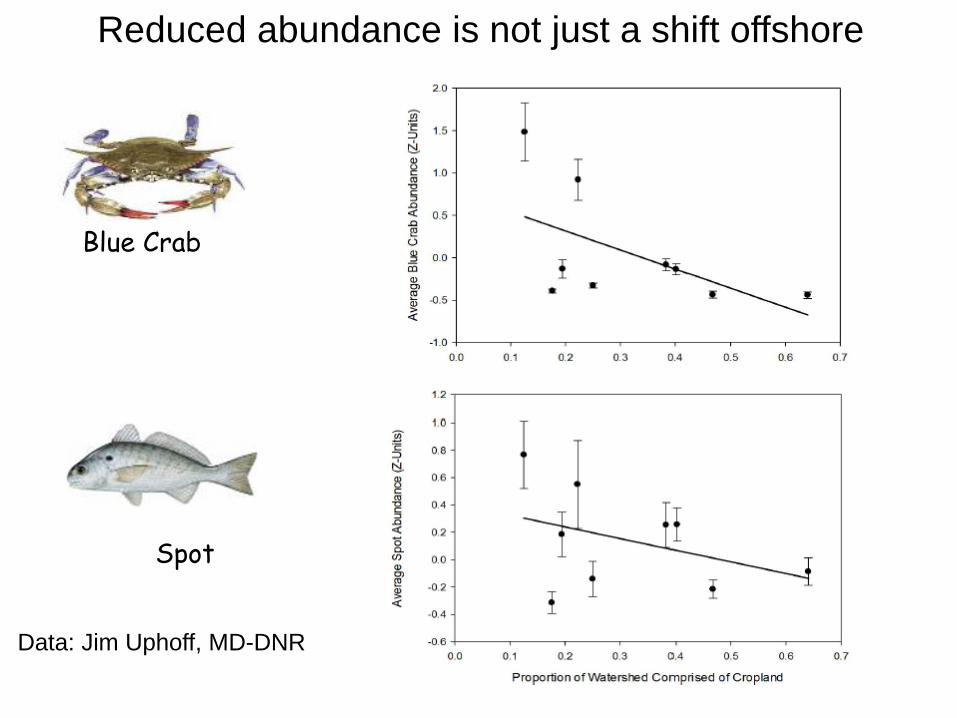
Blue Crab
Spot
Reduced abundance is not just a shift offshore
Data: Jim Uphoff, MD-DNR
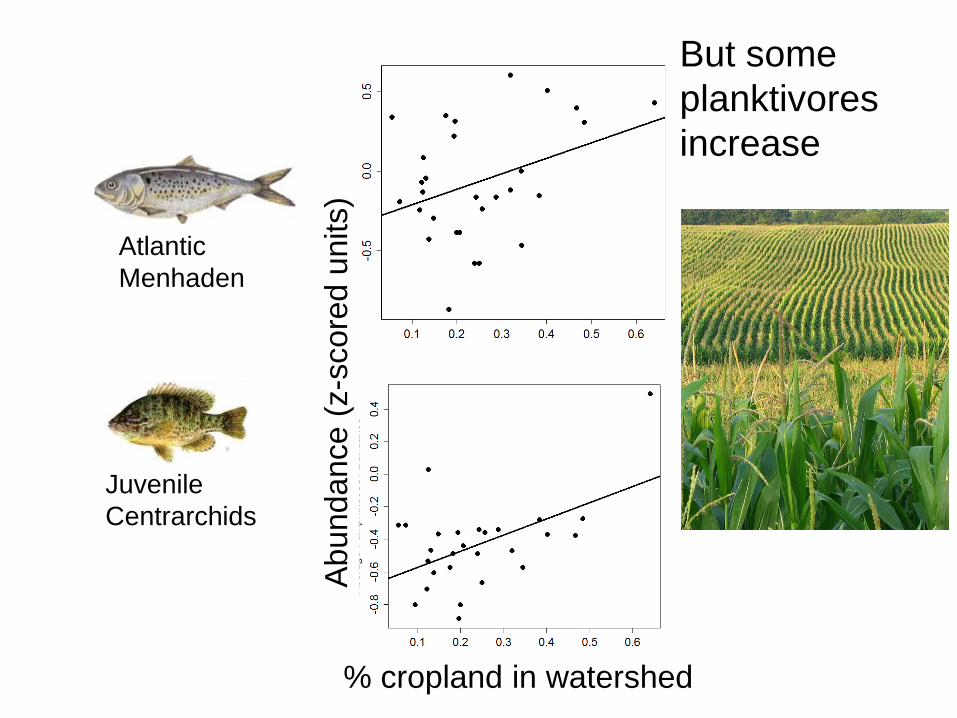
Atlantic Menhaden
Juvenile Centrarchids
But some planktivores increase
% cropland in watershed
Abun
danc
e (z
-sco
red
units
)
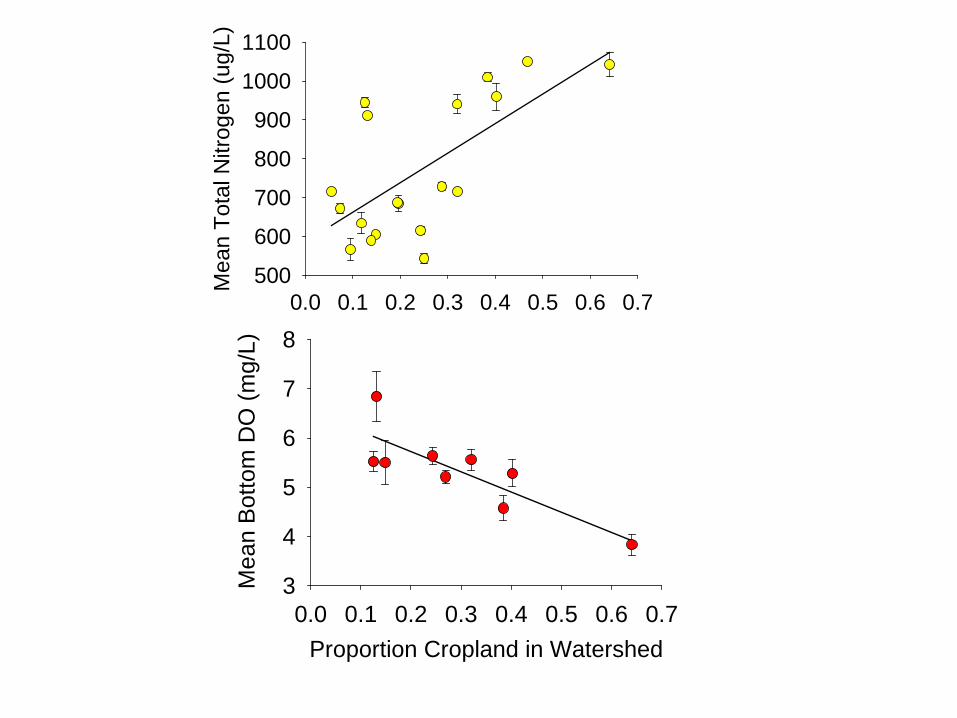
Proportion Cropland in Watershed0.0 0.1 0.2 0.3 0.4 0.5 0.6 0.7
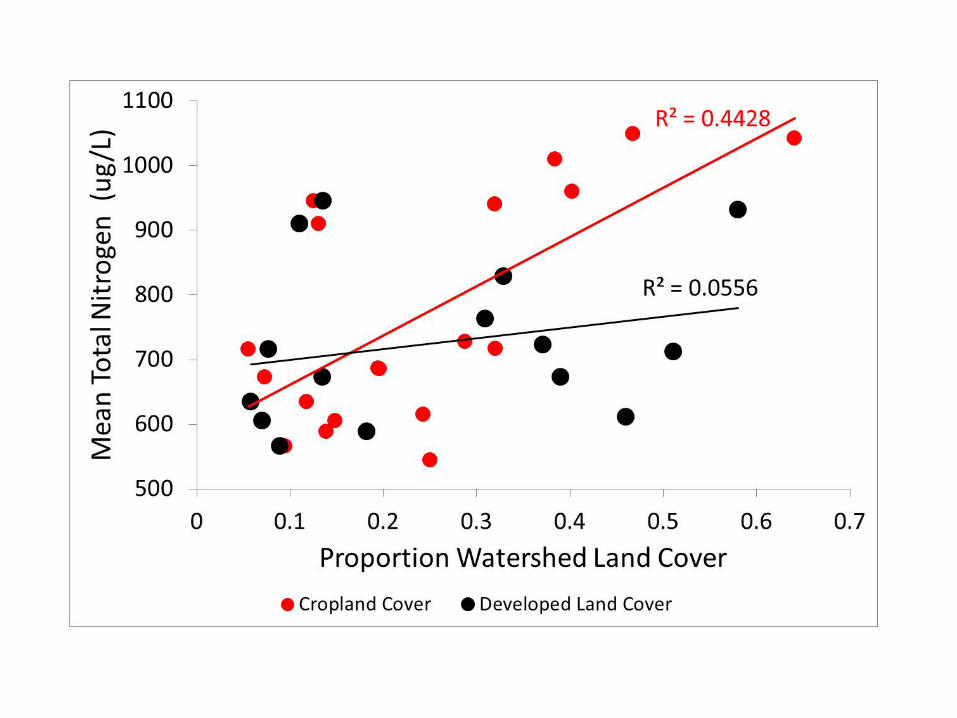
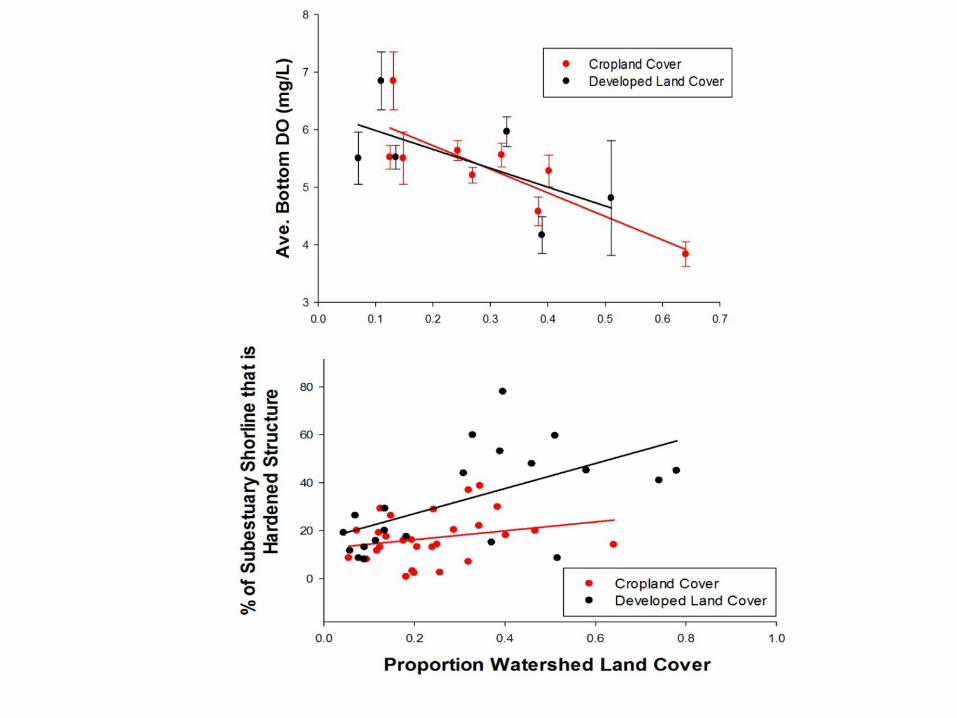
Mea
n B
otto
m D
O (m
g/L)
3
4
5
6
7
80.0 0.1 0.2 0.3 0.4 0.5 0.6 0.7
Mea
n To
tal N
itrog
en (u
g/L)
500
600
700
800
900
1000
1100
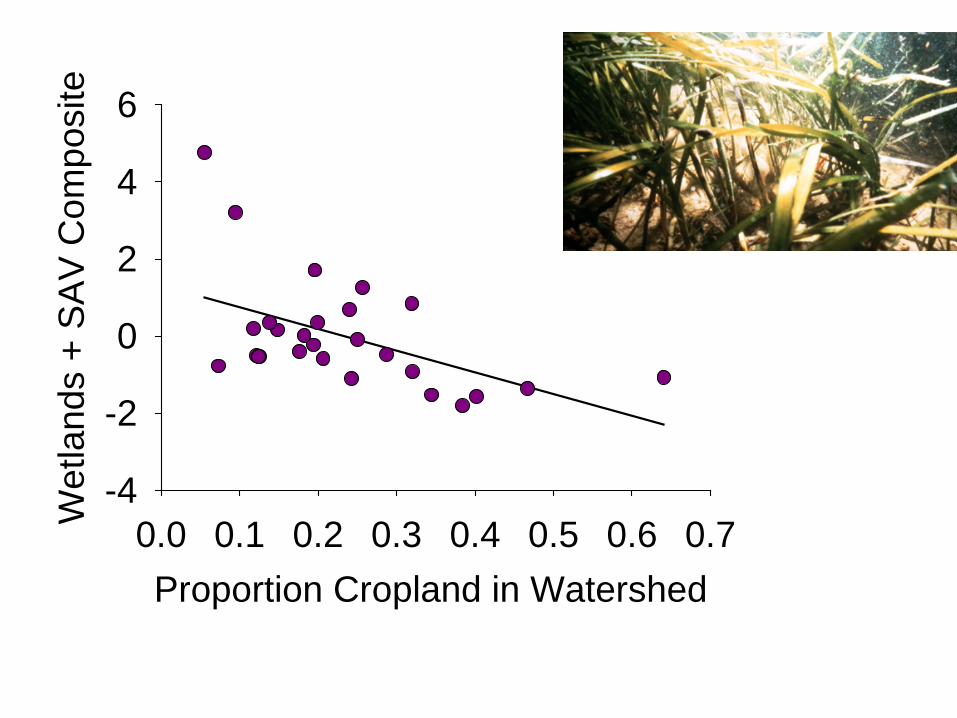
Proportion Cropland in Watershed 0.0 0.1 0.2 0.3 0.4 0.5 0.6 0.7W
etla
nds
+ S
AV
Com
posi
te
-4
-2
0
2
4
6
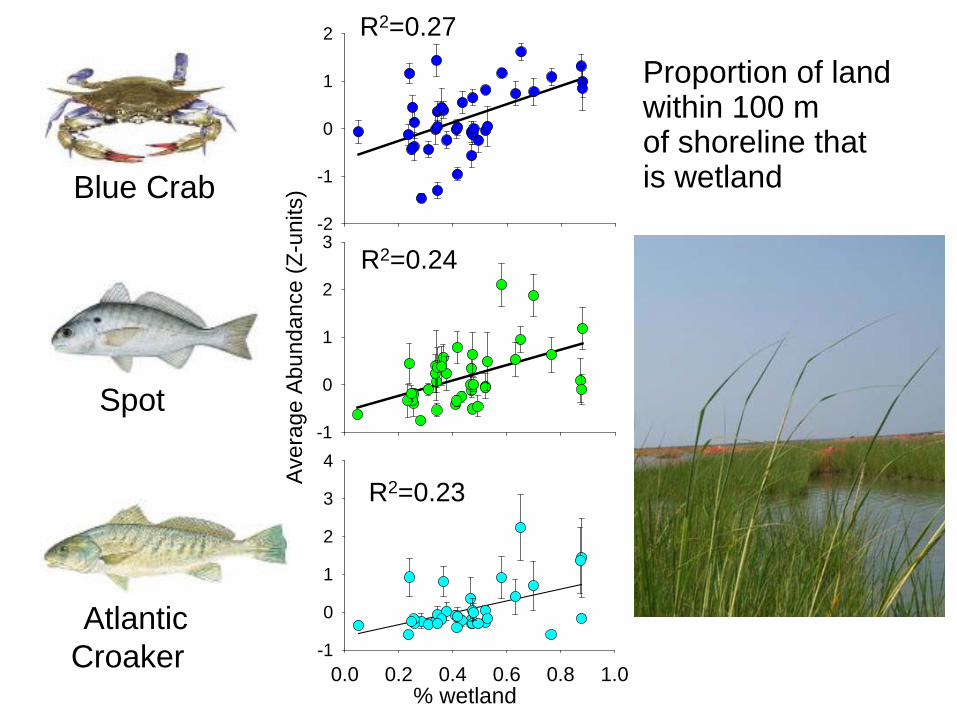
Proportion of land within 100 m of shoreline that is wetland
-2
-1
0
1
2
Ave
rage
Abu
ndan
ce (Z
-uni
ts)
-1
0
1
2
3
% wetland 0.0 0.2 0.4 0.6 0.8 1.0
-1
0
1
2
3
4
Blue Crab
Spot
Atlantic Croaker
R2=0.27
R2=0.24
R2=0.23
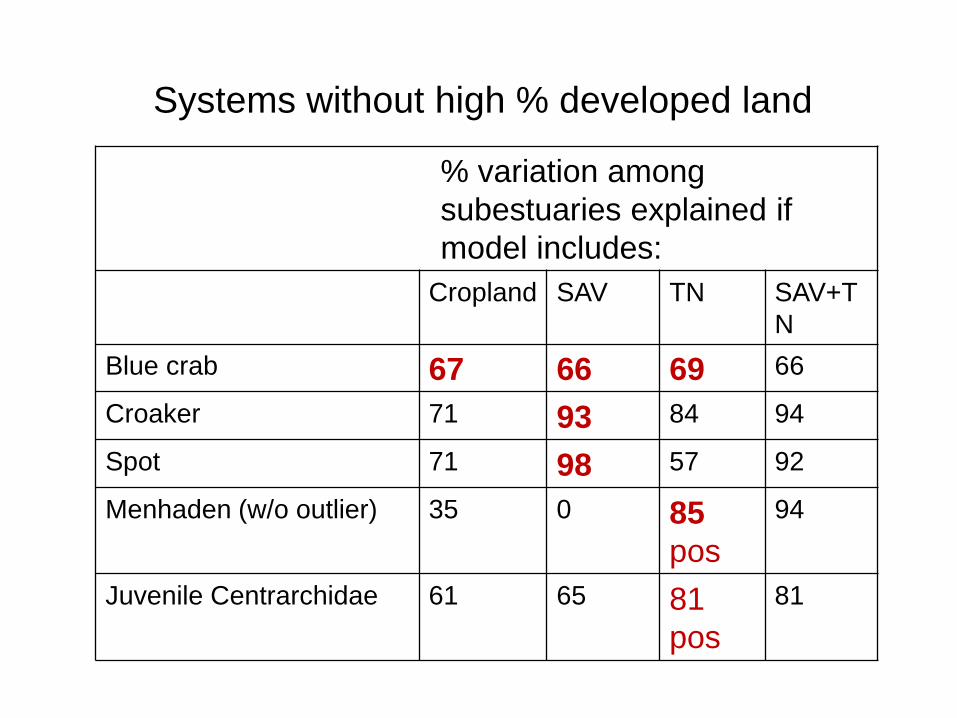
% variation among subestuaries explained if model includes:
Cropland SAV TN SAV+TN
Blue crab 67 66 69 66
Croaker 71 93 84 94
Spot 71 98 57 92
Menhaden (w/o outlier) 35 0 85 pos
94
Juvenile Centrarchidae 61 65 81 pos
81
Systems without high % developed land
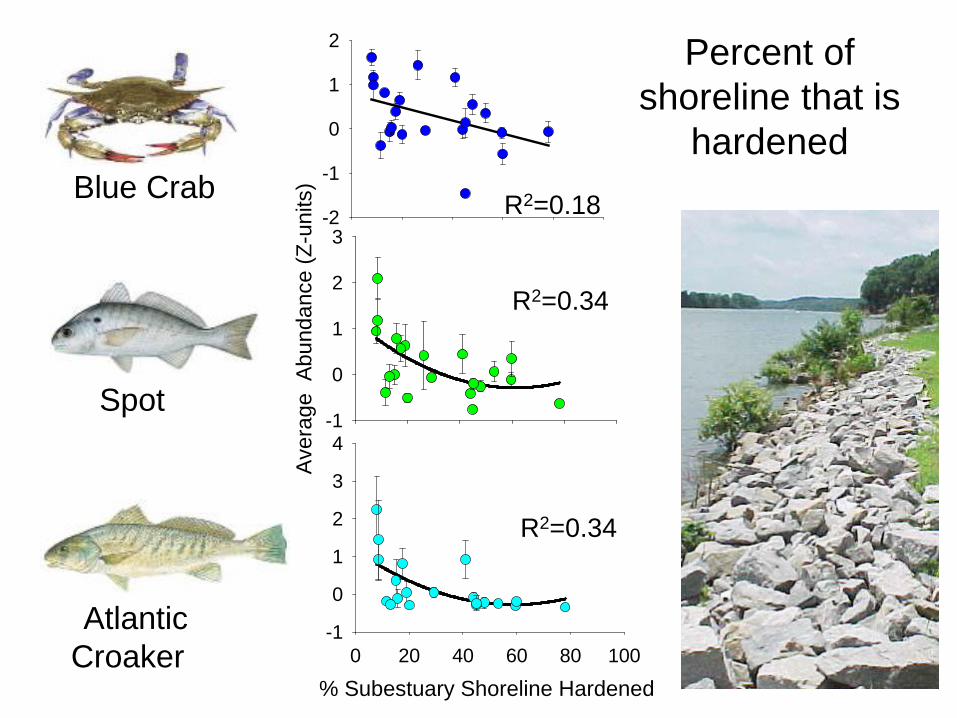
-2
-1
0
1
2
Ave
rage
Abu
ndan
ce (Z
-uni
ts)
-1
0
1
2
3
% Subestuary Shoreline Hardened 0 20 40 60 80 100
-1
0
1
2
3
4
Blue Crab
Spot
Atlantic Croaker
R2=0.18
R2=0.34
R2=0.34
Percent of shoreline that is
hardened
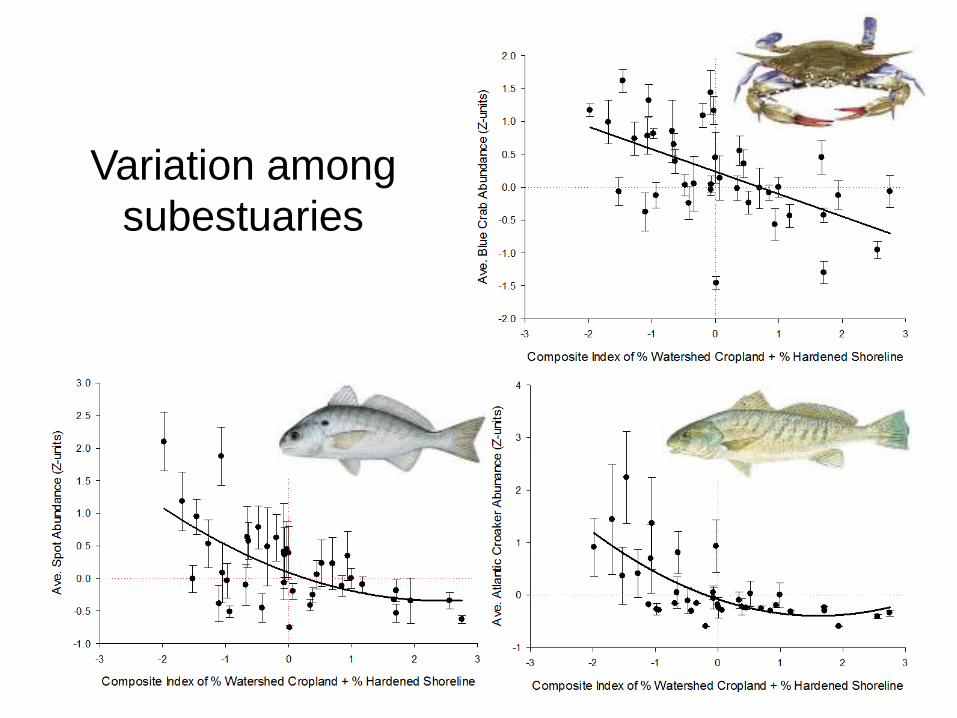
Variation among subestuaries
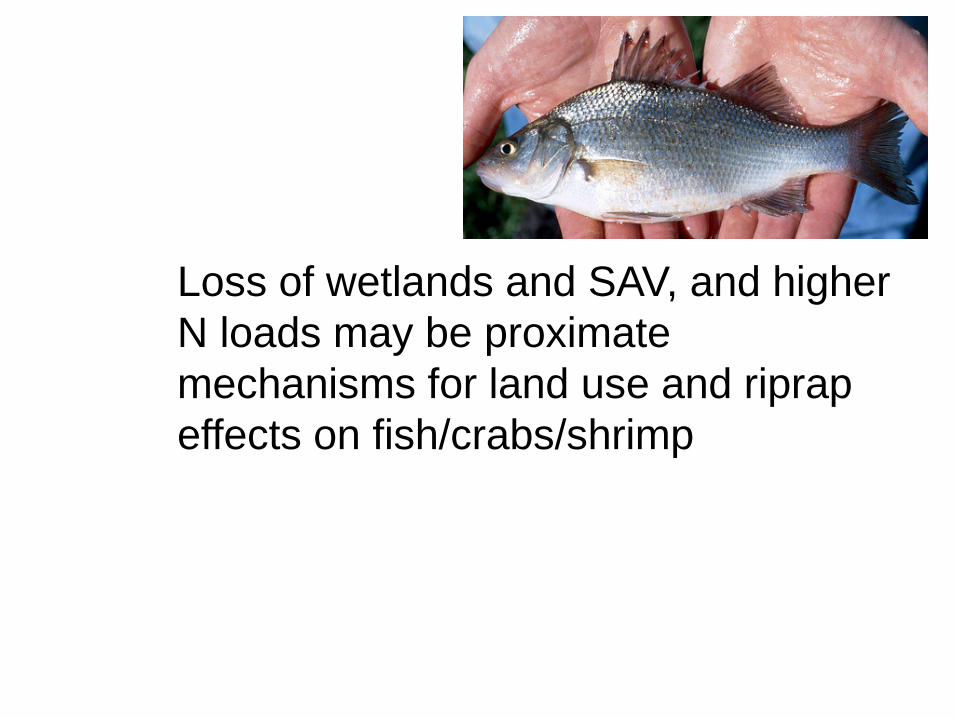
Loss of wetlands and SAV, and higher N loads may be proximate mechanisms for land use and riprap effects on fish/crabs/shrimp
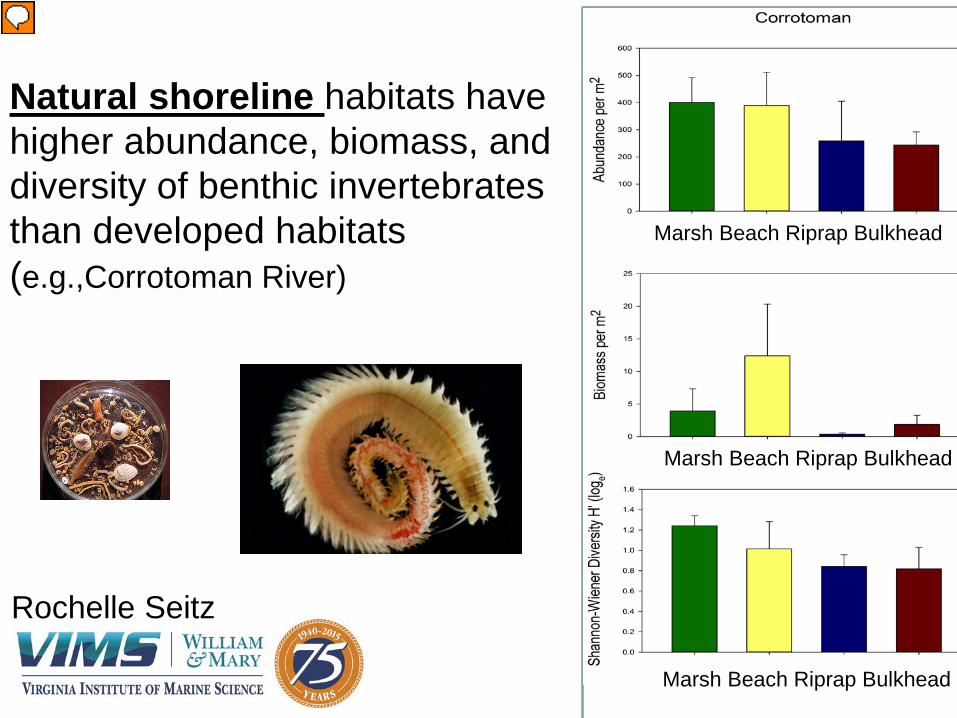
Natural shoreline habitats have higher abundance, biomass, and diversity of benthic invertebrates than developed habitats (e.g.,Corrotoman River)
Marsh Beach Riprap Bulkhead
Marsh Beach Riprap Bulkhead
Marsh Beach Riprap Bulkhead
Rochelle Seitz
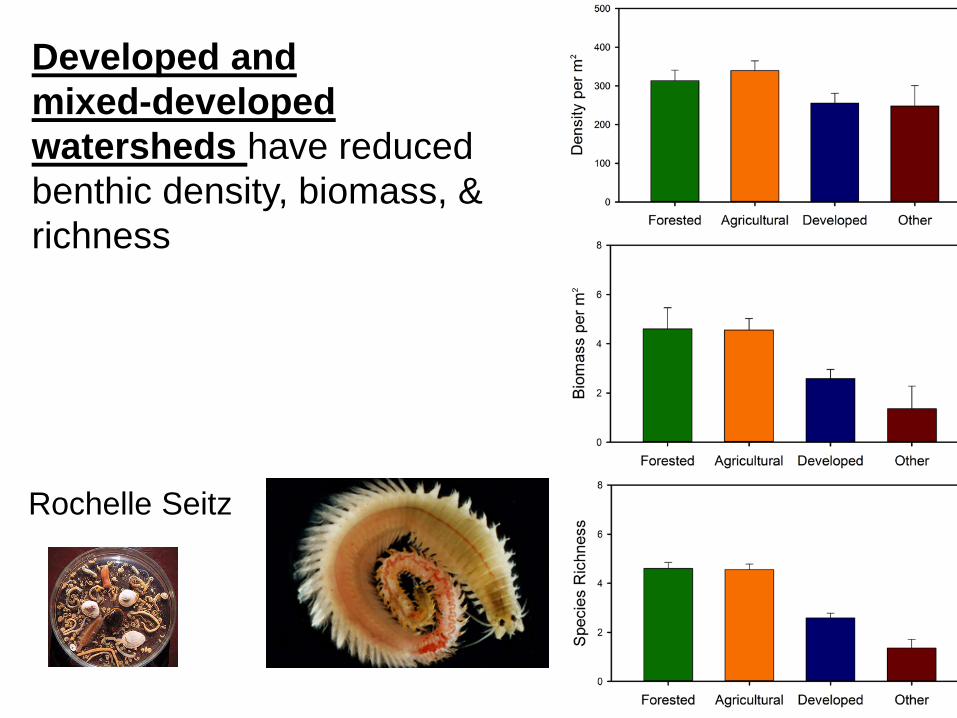
Developed and mixed-developed watersheds have reduced benthic density, biomass, & richness
Rochelle Seitz
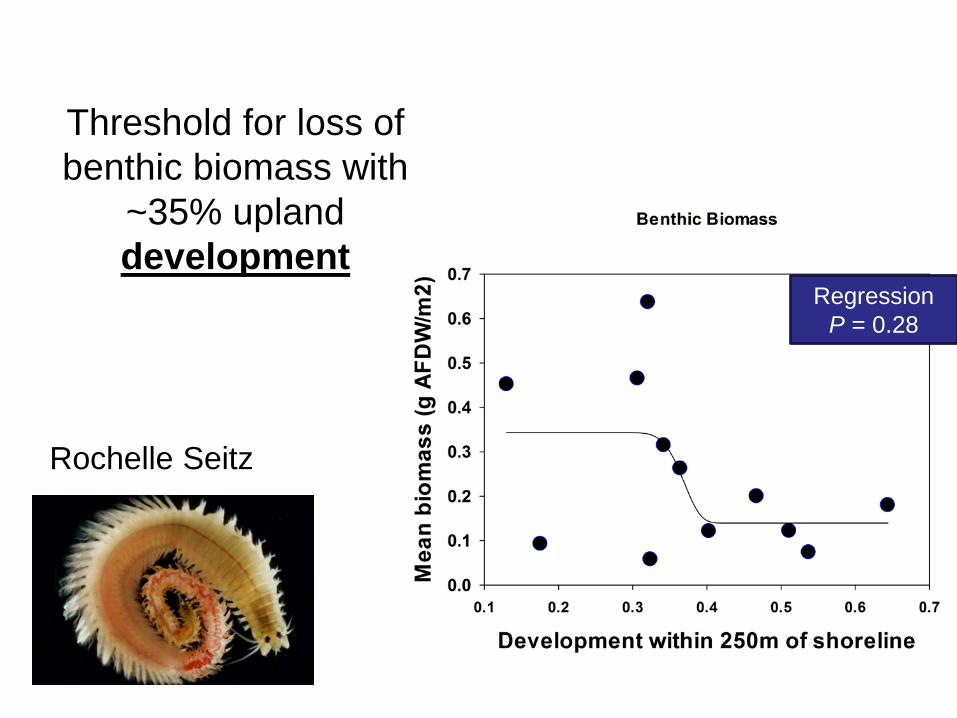
Threshold for loss of benthic biomass with
~35% upland development
Regression P = 0.28
Rochelle Seitz
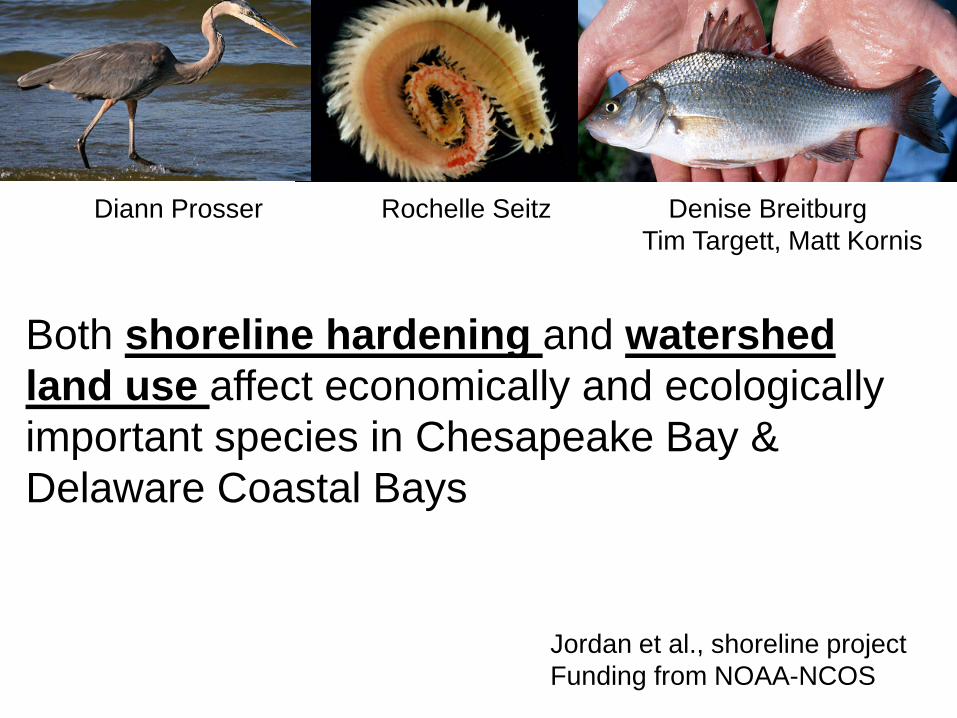
Both shoreline hardening and watershed land use affect economically and ecologically important species in Chesapeake Bay & Delaware Coastal Bays
Jordan et al., shoreline project Funding from NOAA-NCOS
Diann Prosser Rochelle Seitz Denise Breitburg Tim Targett, Matt Kornis
Climate change in the shallows – interacting effects of diel-cycling hypoxia and acidification Denise Breitburg Andrew Keppel Seth Miller Rebecca Burrell

Atmospheric CO2
Acidification Respiration
+CO2
Hypoxia/ deoxygenation
-O2
nutrients
Multiple stressors – management, understanding
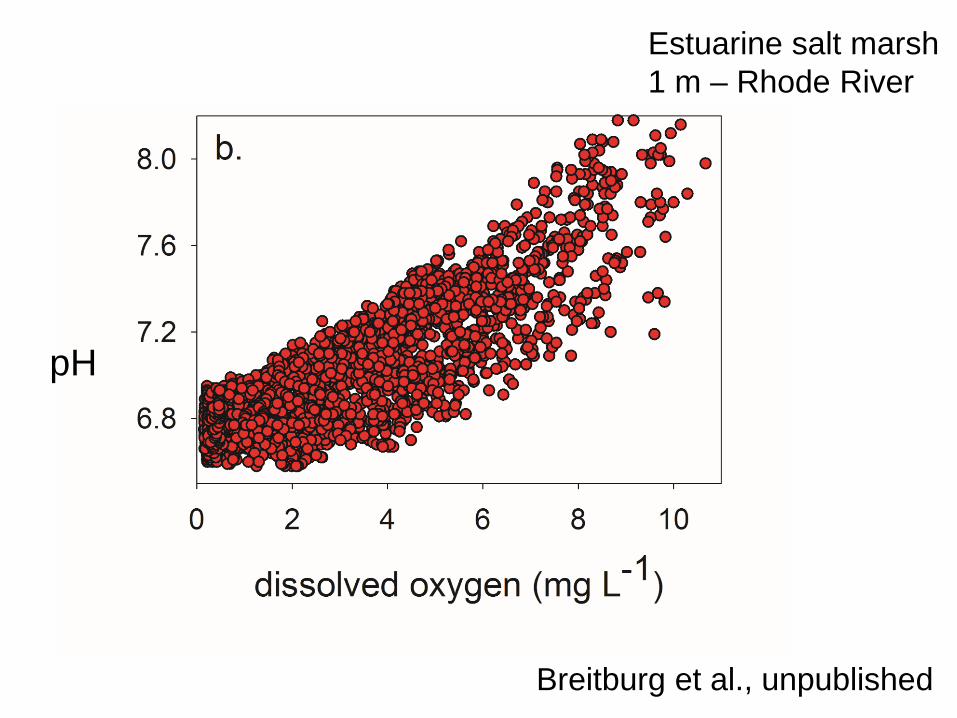
Breitburg et al., unpublished
Estuarine salt marsh 1 m – Rhode River
pH
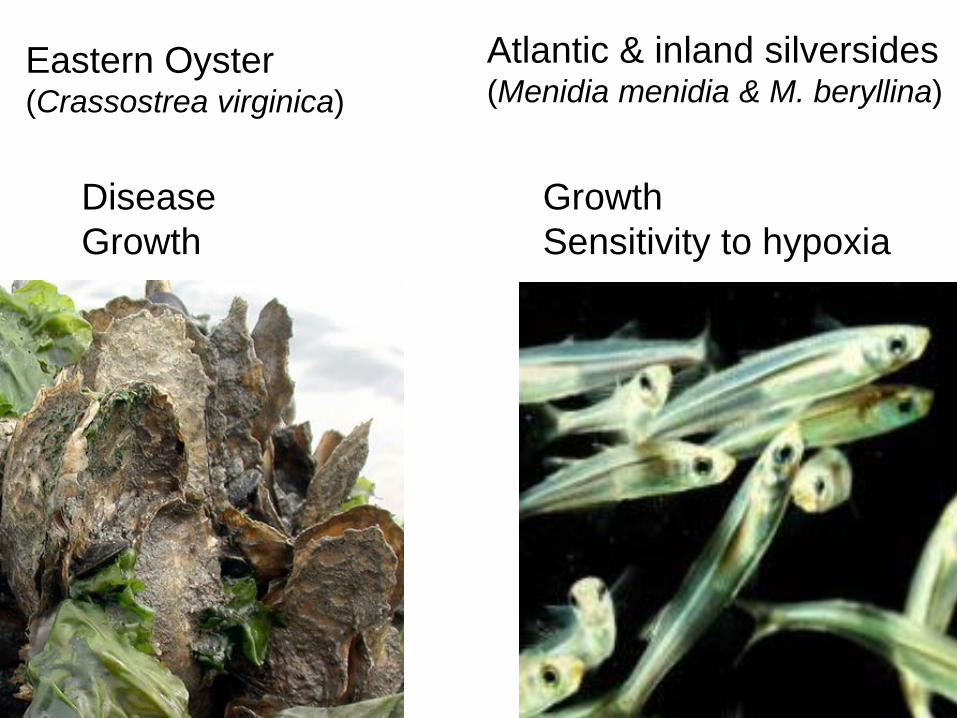
Disease Growth
Eastern Oyster (Crassostrea virginica)
Growth Sensitivity to hypoxia
Atlantic & inland silversides (Menidia menidia & M. beryllina)
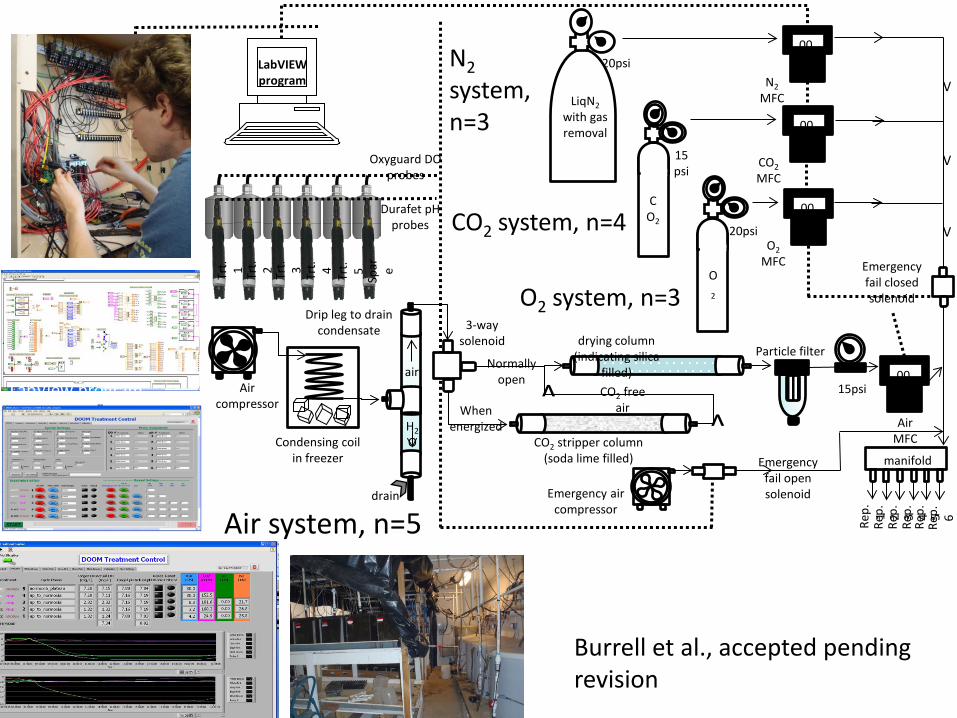
LabVIEW program
manifold
Rep.
1
Rep.
2
Rep.
3
Rep.
4
Rep.
5
Rep.
6
N2 MFC
00.00 N2
system, n=3
CO2 system, n=4
O2 system, n=3
20psi
LiqN2 with gas removal
V
V
O2 MFC
00.00 20psi
O2
CO2 MFC
00.00
15psi
CO2
Emergency fail closed solenoid
Air system, n=5
Air compressor
Condensing coil in freezer
Drip leg to drain condensate
CO2 stripper column (soda lime filled)
drying column (indicating silica
filled)
Particle filter
00.00
drain
CO2 free air
^ ^
Normally open
When energized
3-way solenoid
air
H2O
Air MFC
15psi
V
Emergency air compressor
Emergency fail open solenoid
Oxyguard DO probes
Durafet pH probes
Trt. 1 Trt. 2 Trt. 3 Trt. 4 Trt. 5
Spar e
air
H2O
Burrell et al., accepted pending revision
LabView program
0.00.51.01.52.02.53.03.54.04.55.05.56.06.57.07.58.08.59.09.5
10.010.511.0
Dis
solv
ed o
xyge
n (m
g/L)
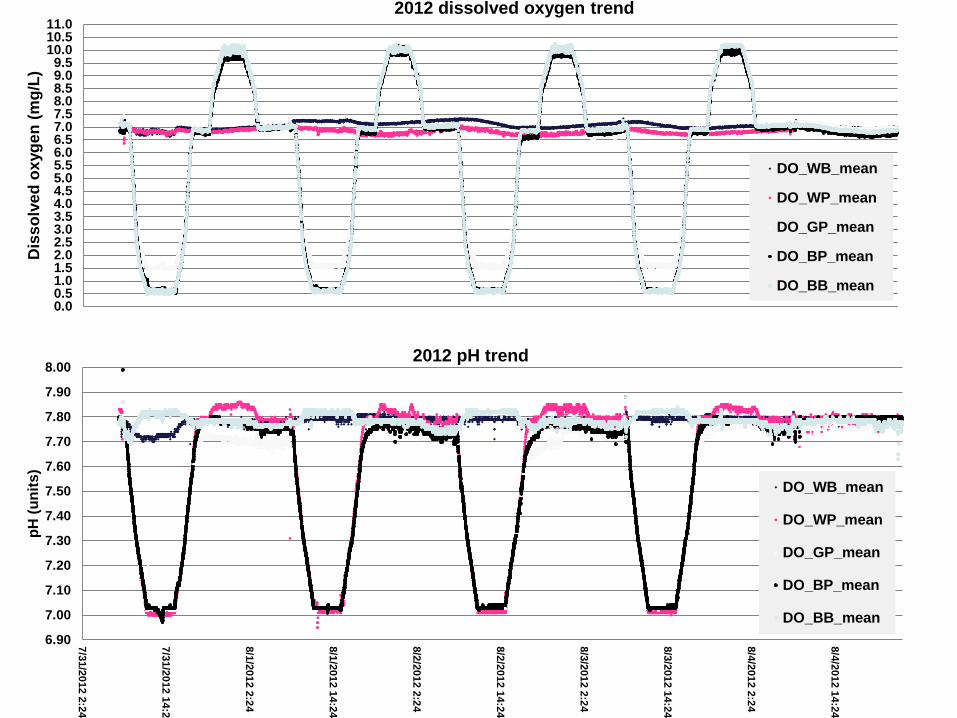
2012 dissolved oxygen trend
DO_WB_mean
DO_WP_mean
DO_GP_mean
DO_BP_mean
DO_BB_mean
6.90
7.00
7.10
7.20
7.30
7.40
7.50
7.60
7.70
7.80
7.90
8.00
7/31/2012 2:24
7/31/2012 14:2
8/1/2012 2:24
8/1/2012 14:24
8/2/2012 2:24
8/2/2012 14:24
8/3/2012 2:24
8/3/2012 14:24
8/4/2012 2:24
8/4/2012 14:24
pH (u
nits
)
2012 pH trend
DO_WB_mean
DO_WP_mean
DO_GP_mean
DO_BP_mean
DO_BB_mean
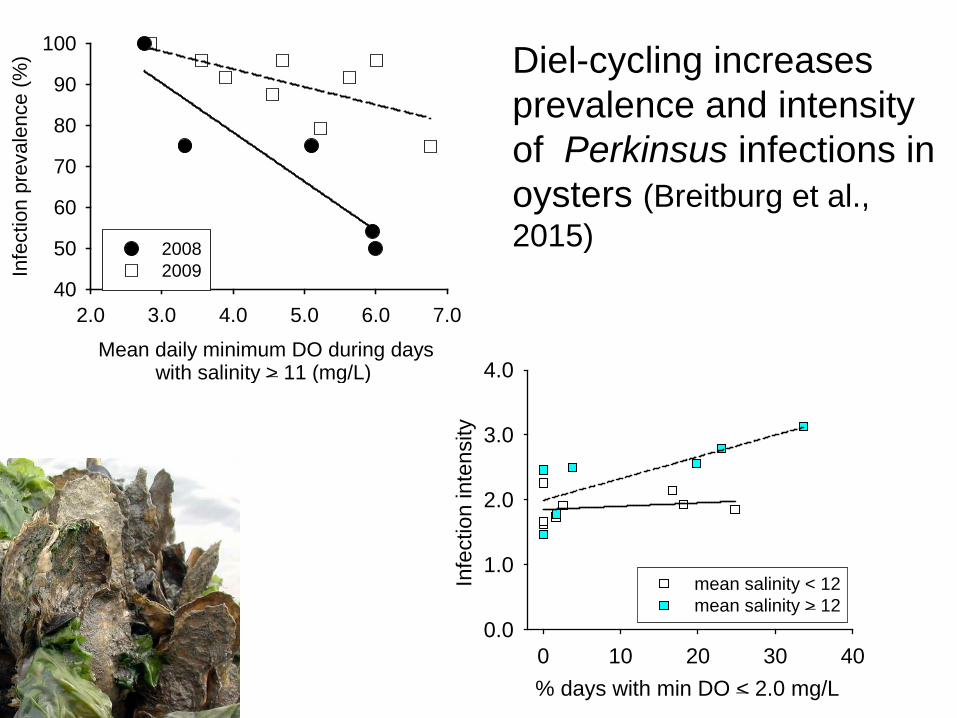
Mean daily minimum DO during days with salinity > 11 (mg/L)
2.0 3.0 4.0 5.0 6.0 7.0
Infe
ctio
n pr
eval
ence
(%)
40
50
60
70
80
90
100
20082009
Diel-cycling increases prevalence and intensity of Perkinsus infections in oysters (Breitburg et al., 2015)
% days with min DO < 2.0 mg/L 0 10 20 30 40
Infe
ctio
n in
tens
ity
0.0
1.0
2.0
3.0
4.0
mean salinity < 12mean salinity > 12
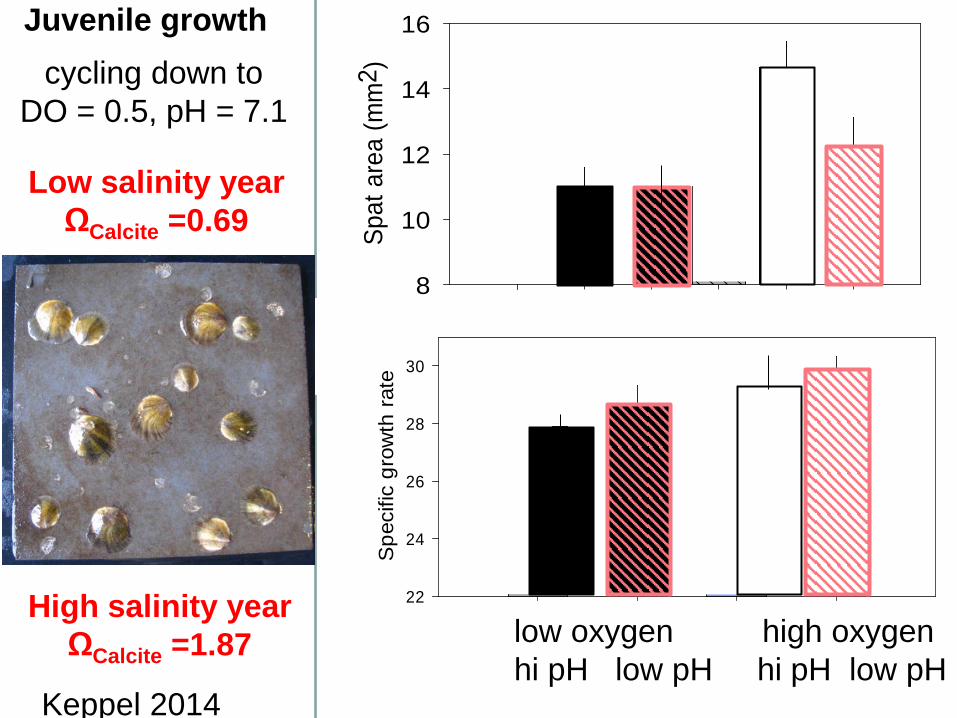
Low salinity year ΩCalcite =0.69
High salinity year ΩCalcite =1.87
Spat
are
a (m
m2 )
8
10
12
14
16
Severe cycling hypoxia, Normcapnia Severe cycling hypoxia, Severe cycling pH Normoxia, Normcapnia Normoxia, Normcapnia: 14.6631 Normoxia, Severe cycling pH
Severe cycling hypoxia, Normcapnia Severe cycling hypoxia, Severe cycling pH Normoxia, Normcapnia Normoxia, Severe cycling pH Col 8 Col 9 Col 10 Col 11
low oxygen high oxygen hi pH low pH hi pH low pH
Juvenile growth cycling down to
DO = 0.5, pH = 7.1
low oxygen high oxygen hi pH low pH hi pH low pH C
Spe
cific
gro
wth
rate
22
24
26
28
30
Severe cycling hypoxia - Normcapnia Severe cycling hypoxia - Cycling pH Normoxia - Normcapnia Normoxia - Cycling pH
low oxygen high oxygen hi pH low pH hi pH low pH Keppel 2014
Prop
ortio
n ph
agoc
ytic
hem
ocyt
es
0.00
0.05
0.10
0.15
0.20
Severe cycling hypoxia - Normcapnia Severe cycling hypoxia - Cycling pH Normoxia - Normcapnia Normoxia - Cycling pH
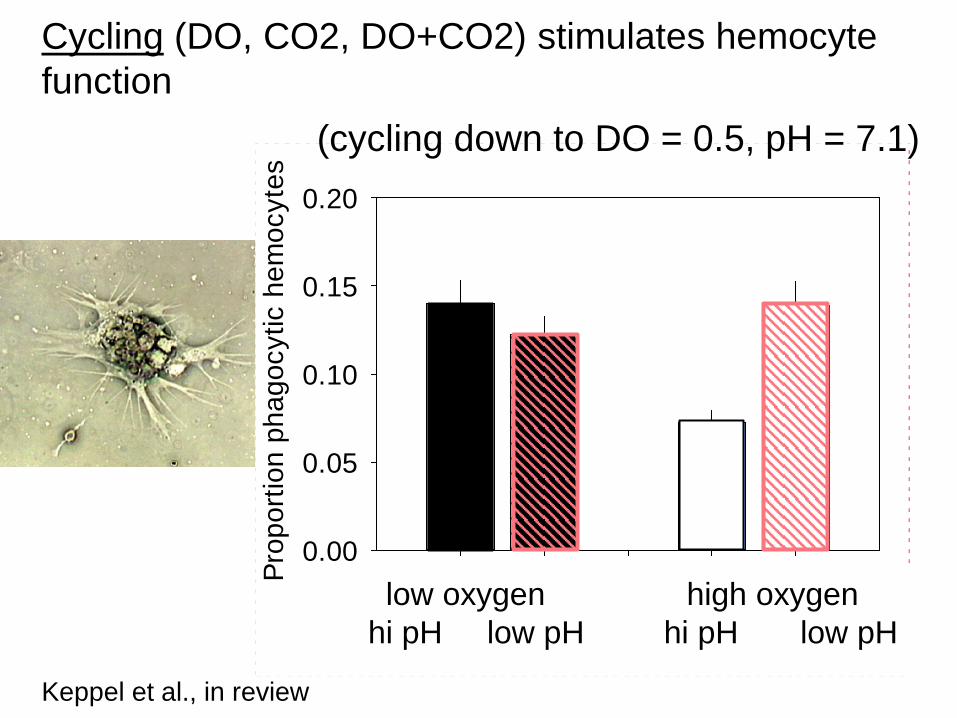
Cycling (DO, CO2, DO+CO2) stimulates hemocyte function
low oxygen high oxygen hi pH low pH hi pH low pH
(cycling down to DO = 0.5, pH = 7.1)
Keppel et al., in review
Infe
ctio
n In
tens
ity
(mea
n of
all
dise
ased
oys
ters
)
0.8
1.0
1.2
1.4
1.6
1.8
Severe cycling hypoxia - Normcapnia Severe cycling hypoxia - Cycling pH Moderate cycling hypoxia - Cycling pH Normoxia - Normcapnia Normoxia - Cycling pH
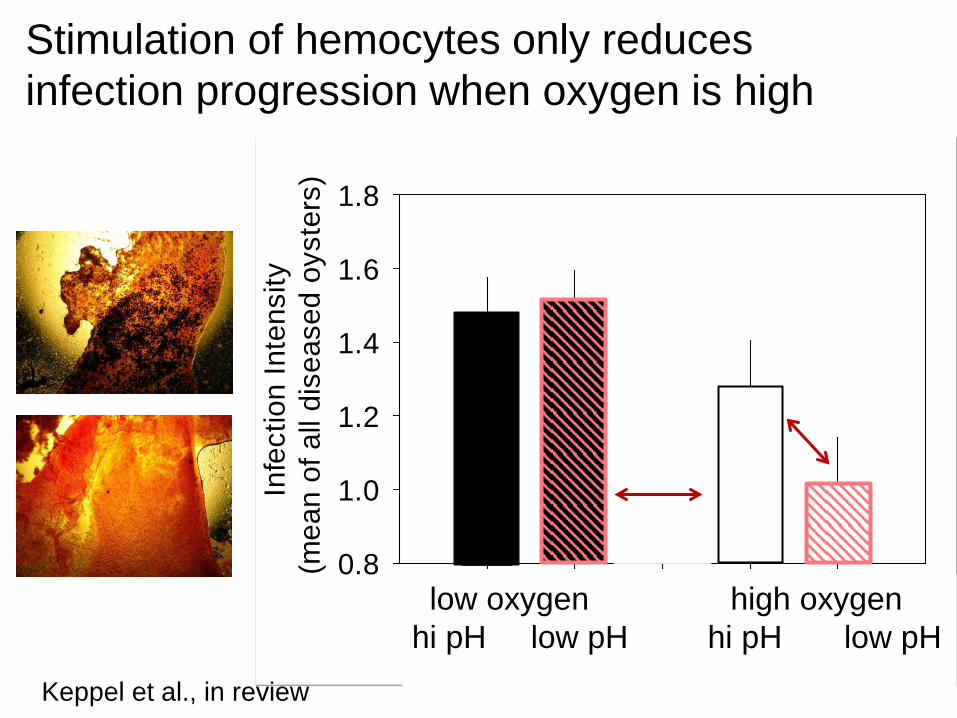
Stimulation of hemocytes only reduces infection progression when oxygen is high
low oxygen high oxygen hi pH low pH hi pH low pH Keppel et al., in review
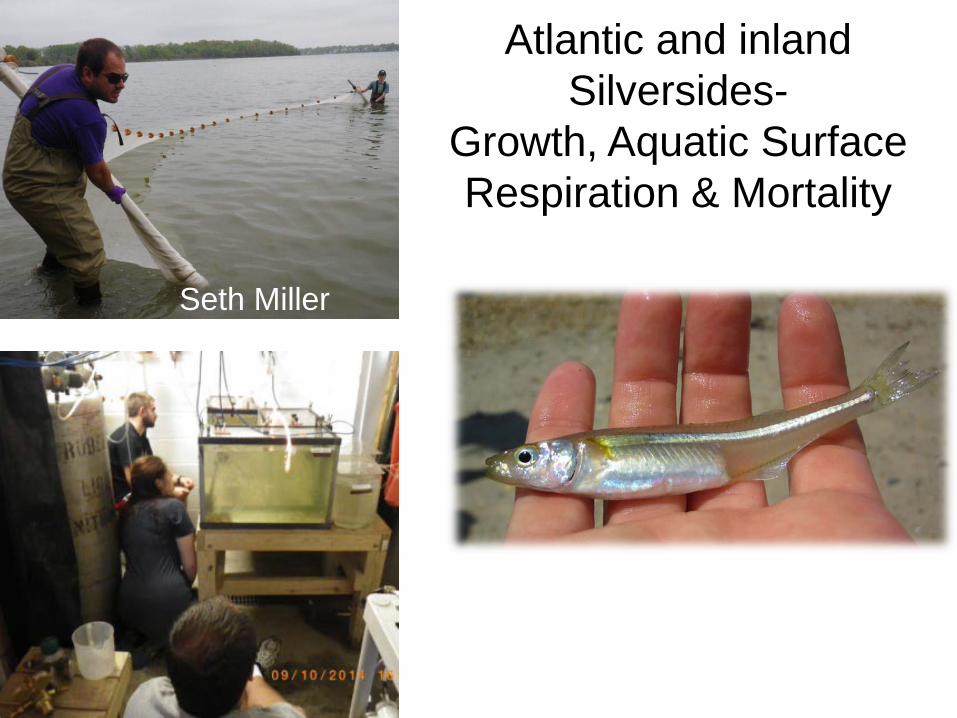
Atlantic and inland Silversides-
Growth, Aquatic Surface Respiration & Mortality
Seth Miller
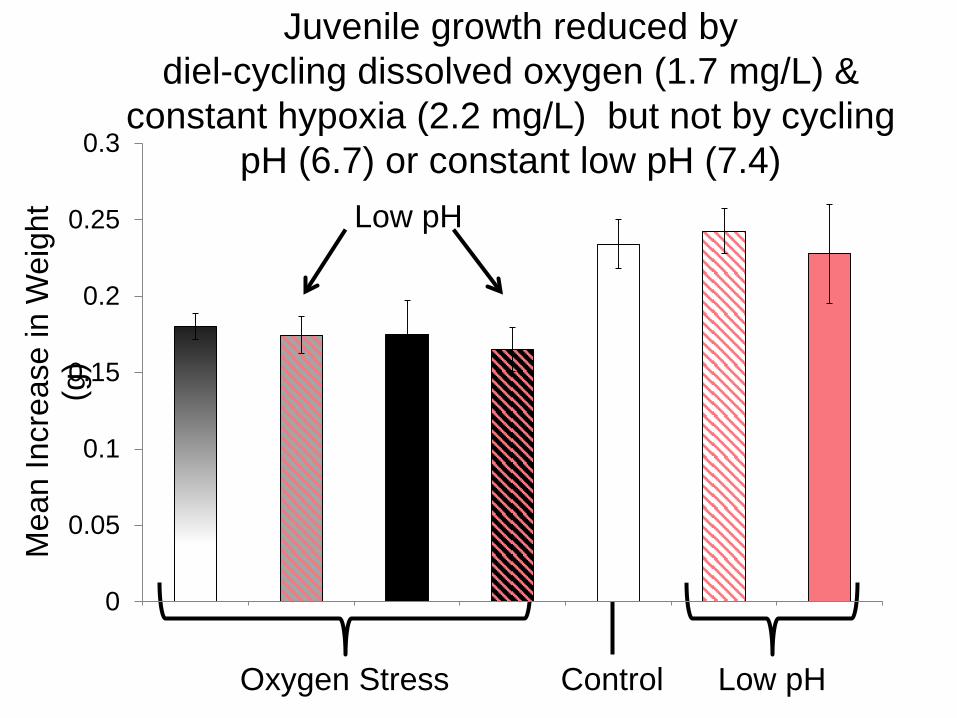
Juvenile growth reduced by diel-cycling dissolved oxygen (1.7 mg/L) &
constant hypoxia (2.2 mg/L) but not by cycling pH (6.7) or constant low pH (7.4)
Oxygen Stress Control Low pH
0
0.05
0.1
0.15
0.2
0.25
0.3
Mea
n In
crea
se in
Wei
ght
(g)
Low pH
0
0.5
1
1.5
2
2.5
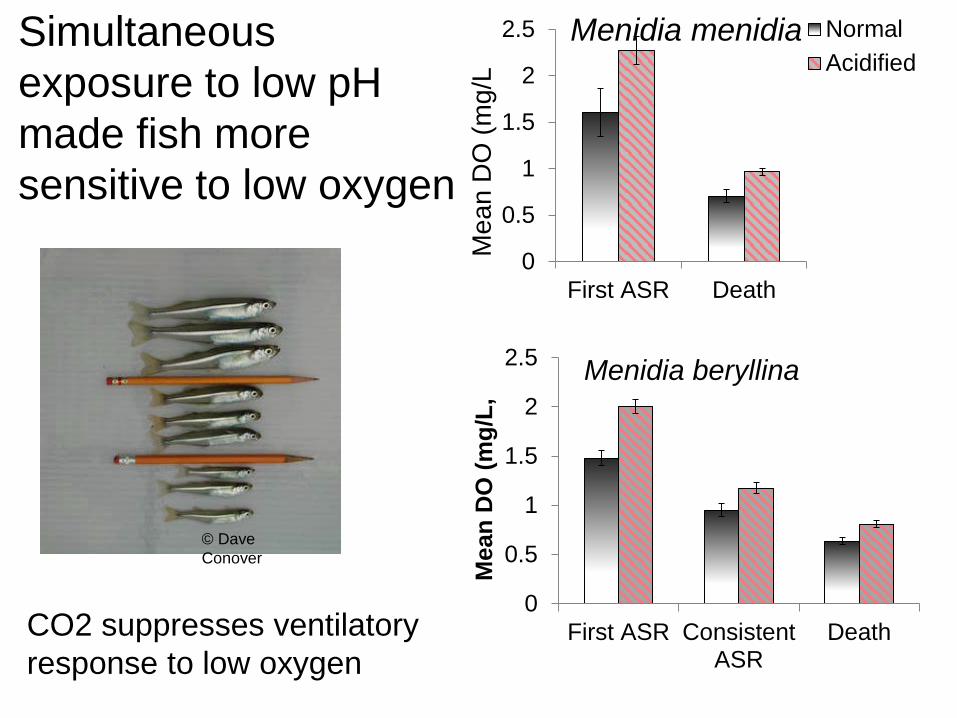
First ASR Death
Mea
n D
O (m
g/L
Menidia menidia NormalAcidified
0
0.5
1
1.5
2
2.5
First ASR ConsistentASR
Death
Mea
n D
O (m
g/L,
Menidia beryllina
© Dave Conover
Simultaneous exposure to low pH made fish more sensitive to low oxygen
CO2 suppresses ventilatory response to low oxygen
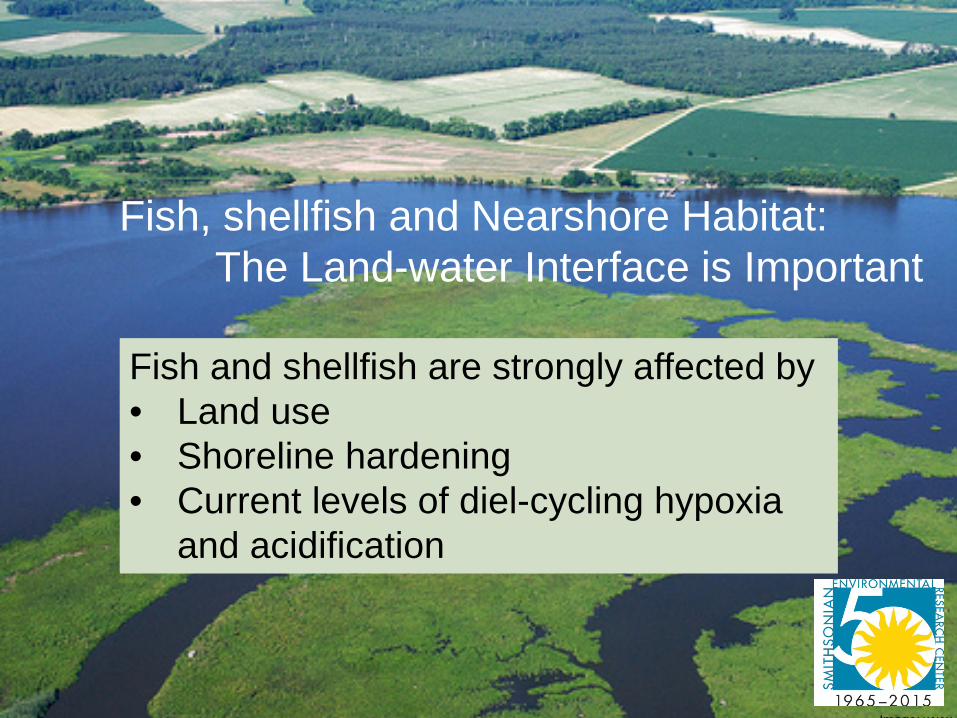
Fish, shellfish and Nearshore Habitat: The Land-water Interface is Important
Image: www c
Fish and shellfish are strongly affected by • Land use • Shoreline hardening • Current levels of diel-cycling hypoxia
and acidification
Recommended