Fiscal Multicointegration and Sustainability in OECD Economies
Rajlakshmi De1
Professor Lori Leachman, Faculty Advisor
Professor Kent Kimbrough, Faculty Advisor
Duke University
Durham, North Carolina
2013
1 Rajlakshmi De graduated from Duke University in May 2013 with High Distinction in Economics. She is currently a
Research Fellow at Stanford Law School for the 2013-2014 academic year and can be reached at [email protected].

2
Acknowledgements
I am extremely grateful to Professor Lori Leachman for offering helpful advice throughout all the stages
of my project and being an incredible mentor along the way. I also thank Professor Kent Kimbrough for
offering constant feedback and encouragement through the honors seminar course. I am also grateful to
my fellow students in the honors seminar who provided me with comments and helpful critique.

3
Abstract
Policies surrounding government expenditures and revenues are often concerned with the size of the
national public debt and whether it is sustainable or not. In this paper, the recent fiscal trends of 14
OECD nations are assessed as sustainable or unsustainable by employing the multicointegration
framework and asserting corresponding criteria for sustainability. Denmark, Norway, Finland, Canada,
Sweden, Portugal, and Austria are found to exhibit sustainable fiscal policies during the paper’s sample
period, whereas the policies of the United States, Italy, France, Netherlands, United Kingdom, Spain,
and Japan are determined to be unsustainable.
JEL classification: E6; E61; E62; E66
Keywords: Fiscal; Sustainability; Multicointegration

4
I. Introduction
Policymakers and economists have often voiced concerns about rising public debt levels and
whether national fiscal policies are sustainable or not as a result, especially in recent years when
debt/GDP figures have reached near 100 percent or higher in nations such as Japan, Italy, Canada, the
United States, and Portugal. In the United States, for example, politicians hardly ever agree on the
appropriateness of the size of the public debt and whether it has implications for either raising revenue
or reducing expenditures. In Spain, recent news reports note that its debt/GDP is the highest recorded
since 1910, causing concern about whether the fiscal trends are unsustainable and need reform.
Debt/GDP percentages are also sometimes influential for policymaking targets, such as the required
(though not enforced) 60 percent limit on debt/GDP for Eurozone countries. Debt/GDP percentages in
2010 for 15 OECD nations are shown in Figure 1.
FIGURE 1
PERCENT PUBLIC DEBT TO GDP IN 15 OECD COUNTRIES, 2010
However, Debt/GDP figures alone are not insightful in determining whether fiscal policy trends
are sustainable or not. This is because a country with higher GDP growth can finance larger deficits
0 50 100 150 200 250
Sweden
Norway
Denmark
Finland
Spain
Netherlands
Austria
United Kingdom
France
Portugal
United States
Belgium
Canada
Italy
Japan
Source: OECD Factbook

5
much more readily than a country with a lower GDP growth rate. This importance of economic growth
to debt repayment was illustrated recently when Moody’s, a credit rating agency, removed the United
Kingdom’s AAA credit rating, citing that the medium-term growth outlook is “sluggish” (Pratley).
Therefore, in order to substantiate or contradict fears about debt/GDP percentages in various OECD
nations, analyses must account for fiscal policy decisions occurring in a dynamic setting where GDP
growth is variable and affect the stochastic discount factor of debt. To achieve this, a multicointegration
framework is employed to analyze the fiscal policies of 14 OECD nations, where multicointegration is
the existence of dynamic equilibria relationships of both a first cointegrating relation between revenue
flow and spending flow and a second cointegrating relation between the stock of debt and the flow of
revenue. These two relationships are measured for each nation in order to check first for the
accumulation of deficits (or surpluses) and secondly for a corrective policy response to the accumulated
debt (or savings). Revenue and expenditure data are percentages of GDP. This framework is employed
because, as noted by Bohn (1995,1998) and Leachman et al. (2005), the presence of multicointegration
(with corrective policy responses) using this specification indicates sustainability regardless of whether
GDP growth is higher or lower than the interest rate on sovereign debt as well as ruling out a
government’s need to use default or inflation to absolve debt.
Criteria for sustainability are drawn from past literature that requires both multicointegration and
corrective policy responses to be classified as sustainable. However, it is asserted that countries
accumulating surpluses are not required to fulfill the multicointegration and corrective policy response
criteria for this study. In particular, Norway, Finland and Denmark do not exhibit both
multicointegration and corrective policy responses in this study’s sample time period, but they exhibit
persistent surpluses and thus are classified as having sustainable fiscal trends. Norway provides an
interesting case study of a negative relationship between public expenditures/GDP and revenues/GDP,
which has not been previously documented in the literature. Finally, I determine that Norway, Finland,
Denmark, Sweden, Canada, Portugal, and Austria exhibit sustainable fiscal policy during the sample
time period, whereas the United States, Italy, France, Netherlands, United Kingdom, Japan, and Spain
have unsustainable fiscal practices during the sample time period. The sample period is 1974-2010 for
most nations, with the exception of Portugal and France, which begin in 1977 and 1978, respectively,
due to data limitations.
In Sections II and III, the fiscal sustainability literature is reviewed with emphasis on the
evolution towards multicointegration and its empirical derivation, as well as an explanation of the

6
practical limitations of this framework for surplus countries. In Sections IV and V, the data is described
and a five-step methodology is executed: tests to confirm the data is appropriate for multicointegration,
regression between stock-flow variables, determining presence of multicointegration or cointegration,
applying sustainability criteria to assess countries’ fiscal practices, and contextualizing results through
country case studies. Finally, some concluding remarks for further policy are provided. Empirical results
from Leachman et al. (2005), a study measuring fiscal sustainability from an earlier sample period, are
provided in the Appendix.
II. Literature Review
The literature on fiscal sustainability is expansive, reflecting both the difficulty and the
importance of assessing nations’ fiscal practices. Burnside (2005) provides a review of the theoretical
underpinnings and the empirical tools in fiscal sustainability analysis. Both the theoretical and empirical
literature often examine the government’s lifetime budget constraint. The lifetime budget constraint
states that the government’s debt obligations are equal to the present value of future primary surpluses
and seignorage revenue. Sims (1994), Woodford (1995), and Cochrane (2001, 2005) derive theoretical
results of the lifetime budget constraint on price levels and monetary or fiscal policy in closed economy
models. Dupor (2000), Daniel (2001), and Corsetti and Mackowiak (2005) also analyze theoretical
implications of fiscal models on currency crises and exchange rates for open economies.
To expand the theoretical inquiries, the lifetime budget constraint has been tested through
various empirical papers. Hamilton and Flavin (1986), Wilcox (1989), and Kremers (1989) have
empirically tested the budget constraint for the United States, but the studies arrive at contradicting
results. Cointegration between spending and revenue streams, which requires a nonstationary
relationship between spending and revenue, is a standard approach for testing whether the government
adheres to its lifetime budget constraint. Trehan and Walsh (1988, 1990), Hakkio and Rush (1991),
Haug (1991), Ahmed and Rogers (1995), Smith and Zin (1988), and Leachman (1996) have empirically
tested for cointegration in the United States, Canada and the United Kingdom, and results are sometimes
contradicting in these studies as well.
The seminal work of Barro (1979, 1989) on tax smoothing, that spending is financed by debt or
taxes, so optimal debt is determined by minimizing the present value of tax distortions, spawned an
enormous literature on the political and institutional variables that are important in understanding public
finance. Cukierman and Meltzer (1989) expand the tax smoothing model to find that the variation in

7
wage-earning ability is related to debt accumulation because of redistributive policies. Alesina and
Tabellini (1990) reject the tax smoothing model, noting that debt issuance is strategic by policymakers,
and due to the uncertainty over who will be appointed in the future, there is a bias towards deficits.
Alesina and Perotti (1995) support the bias towards budget deficits and provide more explanations, such
as the “fiscal illusion” of voters underestimating future tax burdens and the oversupply of public projects
due to representatives overestimating the benefits to their own districts relative to the national financing
costs.
Not only did the political economy literature note the bias towards budget deficits, but Bohn
(1995) also noted the importance of the GDP growth rate in affecting stochastic discount factors such
that certain countries could run persistent deficits due to high economic growth. He formalized the
limitations of traditional cointegration approaches by showing that the previous deterministic models did
not capture the transversality condition that can be met through modeling in a stochastic setting. Correct
discounting is critical in economies where the rate of growth has been higher than the real interest rate.
Such an economy can sustain persistent deficits because high rates of economic growth lower the
stochastic discount factor, diminishing the debt burden. Bohn (1998) outlines and tests for a corrective
mechanism in the budgeting process that enables an economy to sustain balance regardless of whether
the rate of economic growth is above or below the real interest rate on sovereign debt. Therefore,
multicointegration has replaced simple cointegration studies to accommodate the corrective policy
mechanism (Leachman et al., 2005).
Leachman et al. (2005) provide formalization of the corrective policy response criteria, which
delineate that deficit countries should have increasing revenue responses (or decreasing expenditure
responses) to debt buildup while surplus countries should have decreasing revenue responses (or
increasing expenditure responses) to savings buildup. They also investigated the presence of
multicointegration, which assesses two cointegration relationships: the first between the flow variables
of spending and revenue, and the second between the flow variable of revenue and the stock variable of
debt. These conditions jointly characterize multicointegration between government spending and
revenue and, in conjunction with appropriate policy responses, indicate fiscal sustainability in all states
of nature. It is important to underscore that multicointegration and the corrective policy response ensure
that a country’s budgeting strategy is sustainable even when the rate of economic growth falls short of
the real interest rate on sovereign debt. Leachman et al. (2005) test 15 OECD countries (similar but not
8
identical to the 15 countries studied here) for a sample period of 1960-98 and they find that only Norway
and the United Kingdom exhibited fiscal processes consistent with the revised criteria.
After the Leachman et al. (2005) study, other scholars have been able to utilize its formalization
of criteria for sustainability in several applied papers. Escario et al. (2012) is a recent example of a study
that utilizes the Leachman et al. criteria. They apply it to understanding recent data in Spain, with their
time series ranging from 1857-2000, with an emphasis on using the multicointegration methodology to
analyze Spanish long-run fiscal sustainability. However, they also adjust the model to fit the recurrent
use of monetization. They find that seignorage was essential in guaranteeing long-run government
solvency, concluding that the current deprivation of monetization, due to the Eurozone, is linked to the
current crisis.
I also employ much of the Leachman et al. framework to empirically test an updated sample of
14 OECD countries. However, I depart from previous frameworks in my criteria’s assessment of surplus
countries. Rather than expecting multicointegration or even corrective policy responses, I discuss
(through practical case studies) that surplus countries may have extremely valid reasons for building up
savings. In addition, I augment the literature by providing an unusual example of a negative relationship
between spending/GDP and revenue/GDP, which has not been discussed previously. Due to updating
the sample period, I also find very different empirical results compared to any past studies.
III. Theoretical Context
In a theoretical framework, fiscal sustainability involves forecasting and expectations of the
future. This is because sustainability is a condition of the government’s intertemporal budget constraint:
in the long run, sustainability requires that the discounted sum of expected government expenditures
cannot exceed the discounted sum of expected revenues. This means it is possible for a government to
engage in prolonged periods of large government deficits and still be sustainable, but the key
requirement is that future surpluses must compensate past deficits.
The definition of fiscal sustainability rests on the intertemporal budget constraint, so in reality
sustainability is unknown because future budgeting is unknown. Cointegration and multicointegration
techniques are employed as a result of this limitation because they examine long-run relationships
between public revenue and expenditure to determine whether the current trends are at least on a
sustainable path. Cointegration occurs when the revenue and expenditure series share a common

9
stochastic drift. In other words, spending and revenue series are cointegrated if they are individually I(1)
but some linear combination of them is I(0). As discussed in the literature review, multicointegration has
replaced cointegration as the necessary test of fiscal sustainability. Multicointegration requires two
cointegrating relationships. The first cointegrating relationship required is between the flow variables of
spending and revenue. In equation (2), spending = ΔYt and revenues = ΔXt and they are cointegrated if Zt is
I(0) because it is a linear combination of them.
(2) Zt = ΔYt – K0ΔXt where Zt is I(0) if ΔYt and ΔXt are cointegrated
K0 captures whether a country accumulates deficits or surpluses. Zt is the residual term, and this means
that the equation can be conceptualized as ΔYt= K0ΔXt + Zt. If a nation accumulates higher spending than
revenue, it will have a slope greater than 1 and is considered a deficit nation, whereas a nation that
accumulates higher revenues than spending will have a slope less than 1 and is considered a surplus
nation. If the cointegration holds true, Zt is I(0) and it can be accumulated into an I(1) series, St,
represented in equation (3).
(3) St = ∑ is I(1) because it is the accumulation of Zt
The second cointegrating relationship required for multicointegration is between the accumulated
residual of the first cointegrating relationship St which represents accumulated deficits (debt), and either
of the flow variables. In equation (4), this is accomplished by being I(0) through some linear
combination of the stock and flow variables. In equation (4), revenues are shown as the covariate, but
either flow variable (revenues or expenditures) can be used to establish the stock and flow cointegrating
relationship.
(4) et = – K1ΔXt where et is I(0) if and ΔXt are cointegrated
The second round pertains to how the flow variables are related to debt (or savings), so this second
cointegrating relationship measures the appropriateness of policy responses to buildups of debt (or
savings). Conceptualizing equation (4) as = K1ΔXt + et , a corrective policy response for deficit nations
is K1>0 because that represents a positive trend between debt and revenues. Surplus countries should
lower revenues in conjunction with increases in savings (according to corrective policy response
literature), and since represents the accumulated savings for a surplus nation, this would require
K1<0.
Engsted et al. (1997) find favorable statistical properties when the two levels of cointegration are
estimated simultaneously. Equation (2) is first accumulated, which is shown below in equation (5):
(5) ∑ = ∑
– K0∑

10
The relation is equation (3) can then be substituted into equation (5), written below in equation (6):
(6) = ∑ – K0∑
Finally, equation (6) is substituted into equation (4) and accumulated series are rewritten such that
∑ = Yt and ∑
= Xt. and a constant, α0, and a time trend, α1td, are added to account for the
possibility of deterministic trends. The one-step specification is written below in equation (7):
(7) Yt = K0Xt + K1 ΔXt + α0 + α1td + et
To review, Yt represents the accumulated expenditure stream, Xt represents the accumulated revenue
stream, and td = trend, which can be linear or quadratic. ΔXt is the first difference of the accumulated
revenue series, meaning it is simply the revenue series.
Multicointegration leads to a nonstationary et in equation (7), but this alone is insufficient for
sustainability. In the Leachman et al. sample, the United States was multicointegrated, but debt
accumulation was accompanied by declines in government revenue. Bohn (1995) and Leachman et al.
(2005) highlight the importance of corrective policy response criteria, which must be fulfilled in
addition to multicointegration.
If K0 > 1, sustainability requires K1 > 0.
If K0 < 1, sustainability requires K1 < 0.
As discussed, K0 captures whether a country accumulates deficits or surpluses. If spending
accumulates more than revenue, then the slope of the relationship will be greater than 1, which is
characteristic of deficit countries. The opposite rationale derives why K0<1 indicates a surplus country.
K1 is the relationship between revenue flow and stock of debt. If K1 is positive, then as debt increases,
revenue also increases, which is a favorable policy response for deficit countries. The corrective policy
response criteria can also be summarized as the following: deficit countries must increase revenues to
accommodate rising levels of debt, while surplus countries must decrease revenues to accommodate
rising levels of public sector wealth.
I argue that the current theories provide a comprehensive framework for assessing sustainability
if a nation is running persistent deficits: both multicointegration and fulfillment of the corrective policy
response criteria are required. However, these theories lack a practical discussion of how to assess
countries with persistent surpluses, especially when they do not fulfill the sustainability criteria. Section
V. will provide examples of countries that do not fulfill either the multicointegration or corrective policy
response criteria, but are classified as sustainable because of their accumulations of surpluses, and the
rationale behind this classification will be further discussed in a case study of Norway.
11
IV. Data
The OECD Factbook Statistics database was used to obtain spending and revenue series, as a
percent of GDP, for 15 OECD economies: Austria, Belgium, Canada, Denmark, Finland, France, Italy,
Japan, Netherlands, Norway, Portugal, Spain, Sweden, United Kingdom, and USA. In order to be
included in the sample, countries were required to have at least 30 data observations, which excluded
many countries, such as Germany and Poland. In addition, data was not taken before 1974 due to the
major monetary re-structuring, the Bretton Woods system, during the early 1970s. The OECD Factbook
Statistics reported the data as from consolidated government figures of revenue and spending in real
terms and the data was already reported as percentages of real GDP, as recommended by Bohn (1995,
1998) and Ball et al. (1998).
V. Empirical Specification
My empirical method requires five steps: verifying that the spending and revenue series contain
unit roots, regression estimation, determining presence of multicointegration or cointegration, applying
sustainability criteria to assess countries’ fiscal practices, and contextualizing results through country
case studies.
Verifying unit roots in the spending and revenue series
The multicointegration analysis employed in this project requires that the flow variables
(Revenue/GDP and Expenditure/GDP) are nonstationary, which is equivalent to having a unit root. The
Augmented Dickey-Fuller (ADF) Test is used to verify that the series are both nonstationary. Because
the null hypothesis of the ADF Test is that a unit root exists, insignificant test statistics are needed to
continue with multicointegration analysis. Table 1 shows the results of the ADF test on the
Revenues/GDP and Expenditures/GDP series. Using a 5 percent significance level, Belgium is rejected
from the further multicointegration analysis because it appears to have stationary series for both revenue
and expenditure.

12
Regression estimation
As mentioned in the Theoretical Framework, Engsted et al. (1997) developed the following one-
step multicointegration equation:
(7) Yt = K0Xt + K1 ΔXt + α0 + α1td + et
where Yt represents the accumulated expenditure stream, Xt represents the accumulated revenue stream,
and td = trend, which can be linear or quadratic. ΔXt is the first difference of the accumulated revenue
series, meaning it is simply the revenue series. K0 captures the relationship between the flow variables of
spending and revenue and K1 captures the relationship between those flow variables and the stock
variable of their accumulations. Equation (7) was estimated for each country, and the structure of the
time trend (whether it is absent, linear or quadratic) was determined solely based on the overall
significance of the estimation in order to maximize the efficiency of the estimation. Table 2 displays the
regression results. Significance for K0 is reported with respect to a null hypothesis of K0 = 1 because the
designation of deficit or surplus country is done with respect to 1. From these results, the three surplus
nations are apparent because they have K0<1: Norway, Denmark and Finland. Norway in particular
actually has a negative value, which will be explained in a case study discussion. The remaining 11
countries are deficit nations, but the magnitudes of their K0 values are insightful in characterizing the
magnitude of their deficit accumulations, and more importantly, the sign and magnitude of their K1
values are imperative in describing the appropriateness of their policy responses to debt. For example,
the United Kingdom is not building a large deficit (K0=1.101), but its response it not corrective (K1= -
0.815). The deficit accumulation for Portugal is similar to that of the United Kingdom (K0=1.094), but
its response is one of the highest (K1=2.857) which is a good sign for sustainability. However, these
results alone do not determine sustainability; the following sections will build on these estimations in
order to complete the analysis.
Tests for Multicointegration or Cointegration
To continue the sustainability analysis, the regression results must be used to test for the
presence of multicointegration within fiscal practices. There are two methods for testing
multicointegration: ADF tests on regression residuals or the Johansen Cointegration Test. Both tests are
completed for the analysis because each test alone faces limitations.

13
TABLE 1
ADF STATISTICS FOR SPENDING/GDP AND REVENUE/GDP
Country Spending/GDP Revenue/GDP
Austria
Belgium
Canada
Denmark
Finland
France
Italy
Japan
Netherlands
Norway
Portugal
Spain
Sweden
United Kingdom
USA
-3.114
-3.627**
-2.004
-2.164
-1.835
-2.388
-2.066
-3.378*
-2.559
-1.950
-2.591
-2.070
-2.574
-0.433
-1.131
-1.573
-3.780**
-0.066
-1.194
-2.882
-2.942
-1.280
-1.757
-2.996
-2.541
-2.412
-1.042
-3.276*
-1.777
-1.656
NOTE.—Critical values for the ADF statistic vary by sample size and are drawn from the
MacKinnon distribution function for unit root test statistics. * indicates α = 0.10 significance level. **
indicates α = 0.05 significance level. *** indicates α = 0.01 significance level.
The ADF approach requires testing the residual et from equation (7), the one-step regression
equation developed by Engsted et al. Multicointegration is indicated by a stationary et residual series
(statistically significant ADF statistic). Table 3 presents the results of the ADF test on the residuals from
equation (7). The Johansen test was also employed to check for multicointegration because it was
directly designed for testing cointegration between I(1) series. The Johansen Test returns the rank
(number) of cointegrating vectors, but one of the important limitations of the Johansen Test is that it
sometimes fails to determine the rank because no particular rank is statistically significant. For example,
the Johansen Test applied to Austria from 1974-2010 cannot determine whether the number of

14
TABLE 2
MULTICOINTEGRATION COEFFICIENTS
Country K0 K1 Con t t2
Austria
Canada
Denmark
Finland
France
Italy
Japan
Netherlands
Norway
Portugal
Spain
Sweden
United Kingdom
USA
1.217***
1.074***
0.998
0.981***
1.229**
1.460***
1.122***
1.507***
-0.609***
1.094***
1.452***
1.028***
1.074***
1.101***
1.638***
7.228***
4.132***
-1.380**
0.236
2.922***
-1.654
-0.725***
-5.889***
2.857***
-2.259***
0.298
-0.815
1.009
-81.354***
-271.481***
-184.272***
35.225
-23.569
-97.816***
41.520
10.849
319.753***
-63.551***
38.605***
-30.172
42.596*
-30.797
-2.47**
--------
--------
--------
-7.992
-5.170
---------
22.078***
83.255***
---------
5.848**
--------
--------
--------
--------
--------
--------
--------
--------
-0.219***
--------
--------
--------
--------
-0.183***
--------
--------
--------
NOTE.— Based on the equation: Yt = K0Xt + K1 ΔXt + α0 + α1td, where Y = accumulated spending
~I(2) and X = accumulated revenues ~I(2). * indicates α = 0.10 significance level. ** indicates α = 0.05
significance level. *** indicates α = 0.01 significance level. Significance for K0 is reported with
respect to a null hypothesis of K0 = 1.
cointegrating vectors is 0, 1, or 2. The results of the Johansen Test are reported in Table 3. Due to the
limitations and sometimes opposing results of the ADF and Johansen Test, I have chosen a methodology
where multicointegration in either test is coded as multicointegration. Portugal was multicointegrated by
ADF but not Johansen, and Sweden was multicointegrated by Johansen but not by ADF, and both were
coded as “Multicointegrated” in my methodology. The following countries were found to exhibit
multicointegration: Austria, Canada, Denmark, Portugal, and Sweden.
The non-multicointegrated nations still have the possibility of exhibiting simple cointegration
between spending and revenue, which would be indicated by a Johansen rank of 1 or a statistically

15
significant ADF test of the residual from a simple regression of Spending versus Revenues, as in
equation (8).
(8) Zt = ΔYt – K0ΔXt where Zt is I(0) if ΔYt and ΔXt are cointegrated
As with multicointegration, the methodology for determining cointegration used here is to accept it if
TABLE 3
MULTICOINTEGRATION AND COINTEGRATION RESULTS
Country ADF for
Multicoint.
Johansen
Rank
ADF for
Coint.
Result
Austria
Canada
Denmark
Finland
France
Italy
Japan
Netherlands
Norway
Portugal
Spain
Sweden
United Kingdom
USA
-3.099**
-2.793*
-2.614*
-1.287
-1.746
-2.189
-0.300
-2.473
-1.925
-3.438***
-1.597
-1.168
-1.095
-0.796
----
----
----
1
----
0
0
1
0
0
----
2
0
0
-4.057***
-1.836
-2.342
-2.721*
-1.754
-1.879
-2.244
-4.206***
-1.840
-3.338**
-1.649
-2.126
-1.223
-0.621
Multicointegrated
Multicointegrated
Multicointegrated
Cointegrated
Neither
Neither
Neither
Cointegrated
Neither
Multicointegrated
Neither
Multicointegrated
Neither
Neither
NOTE.— Critical values for the ADF statistic vary by sample size and are drawn from the
MacKinnon distribution function for unit root test statistics. * indicates α = 0.10 significance level. **
indicates α = 0.05 significance level. *** indicates α = 0.01 significance level.
cointegration of spending and revenue is supported by either the Johansen rank or the ADF cointegration
test. Table 3 presents results from the ADF multicointegration test, the Johansen rank, the ADF
cointegration test, and the final result based on the methodology described.

16
Sustainability Criteria and Ranking
As described in the Literature Review and Theoretical Framework, the most updated theories
require both multicointegration and a corrective policy response in order for a country’s fiscal practices
to be considered sustainable. The corrective policy response criteria are repeated here:
If K0 > 1, sustainability requires K1 > 0.
If K0 < 1, sustainability requires K1 < 0.
This corrective policy response can also be summarized as the following: deficit countries must increase
revenues to accommodate rising levels of debt, while surplus countries must decrease revenues to
accommodate rising levels of public sector wealth.
However, I question the practicality of past criteria for surplus countries. There are plausible
reasons why a country should implement fiscal policy that widens surpluses, instead of contracting
them. If a surplus is widening due to a transient source of government revenue, such as oil revenue, it is
preferable to build up savings currently and later spend them when the windfall source of revenue is
depleted. For countries where there may be an issue of temporary revenue windfall, it is preferable to
incur large savings rather than be perfectly balanced because a current balanced budget would be more
likely to lead to a future unsustainable deficit (or difficult expenditure cuts) when the source is depleted.
As a result surplus nations are automatically considered to be sustainable in this paper. The complete
sustainability criteria are as follows:
Persistent surpluses (K0<1) are considered sustainable.
If deficits are persistent (K0>1), sustainability requires both multicointegration and a corrective policy
response (K1 > 0), which is consistent with past literature.
Table 4 summarizes the results of applying the sustainability criteria to the 14 OECD countries. All
surplus countries were designated as sustainable, which includes Denmark, Norway and Finland. Deficit
countries were classified using the multicointegration and corrective policy response frameworks.
Canada, Sweden, Portugal and Austria were classified as sustainable because despite deficit
accumulation, they exhibited both multicointegration and a positive revenue response to debt. Three
countries—USA, Italy, and France—also exhibited the positive revenue responses to debt, but they had
no cointegrating vectors and were thus unsustainable. Netherlands, United Kingdom, Japan, and Spain
all had a decreasing relationship between revenue and debt buildup, and were therefore unsustainable.
Netherlands interestingly was cointegrated, but this is of little value if the policy response is incorrect.

17
TABLE 4
SUSTAINABILITY ASSESSMENT
SUSTAINABLE
Canada, K1 > 0, multicointegrated
Sweden, K1 > 0, multicointegrated
Portugal, K1 > 0, multicointegrated
Austria, K1 > 0, multicointegrated
SUSTAINABLE
UNSUSTAINABLE
USA, K1 > 0, neither
Italy, K1 > 0, neither
France, K1 > 0, neither
Netherlands, K1 < 0, cointegrated
United Kingdom, K1 < 0, neither
Japan, K1 < 0, neither
Spain, K1 < 0, neither
SUSTAINABLE
Denmark, K1 > 0, multicointegrated
Norway, K1 < 0, neither
Finland, K1 < 0, cointegrated
Further Discussion
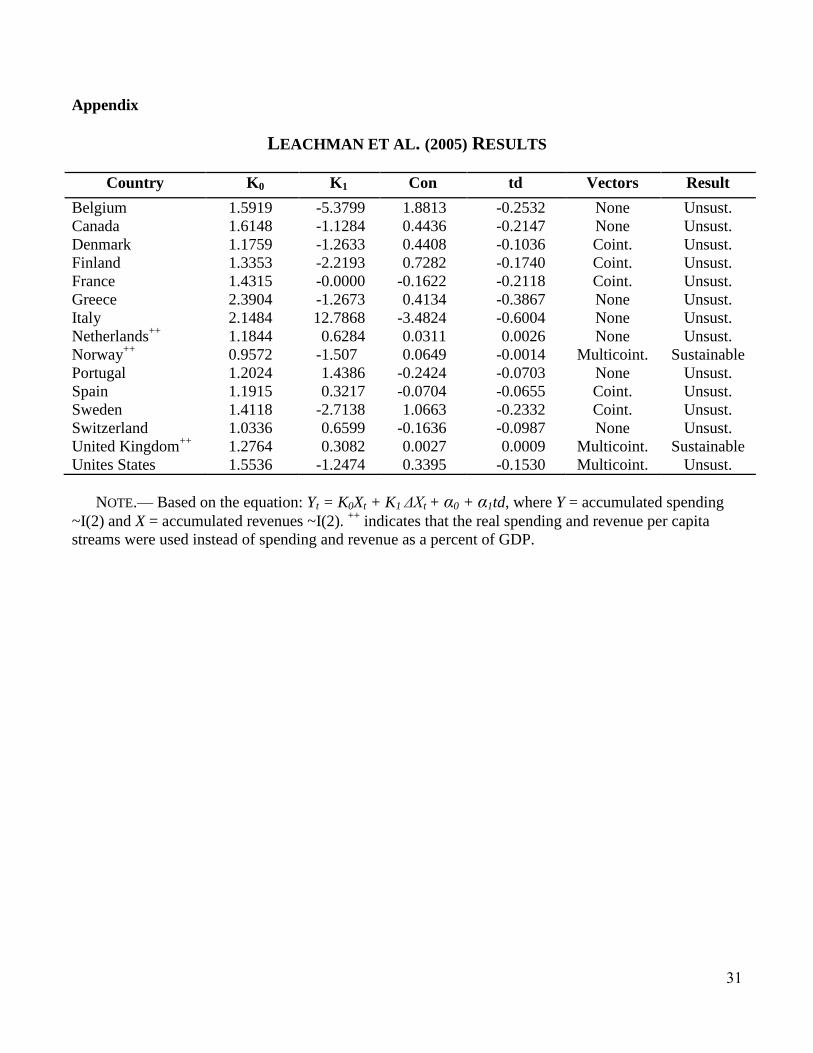
In order to contextualize these results, it is useful to look for departures from the results found in
an earlier sample period by Leachman et al. (2005). I have included their results in the Appendix. Two
of the most dramatic changes are present in the fiscal practices for Canada and the United Kingdom. I
have assessed Canada as fiscally sustainable, because though it ran overall deficits, Canada exhibited
multicointegration and also had the appropriate policy response of decreasing deficits in response to debt
buildup. However, in the Leachman et al. sample, which captured 1960-98 (as opposed to 1974-2010),
Canada failed every criterion: it had widening deficits and did not exhibit even simple cointegration. On
the other hand, I have assessed the United Kingdom as fiscally unsustainable, and it failed every
criterion: it had widening deficits and did not exhibit even simple cointegration. This is a dramatic
change compared to the Leachman et al. sample period in which it was fiscally sustainable
(multicointegrated and decreasing deficits). In the Leachman et al. study, of 15 countries tested, the
Persistent deficits (K0 > 1) Persistent surplus (K0 < 1)
Mu
ltic
oin
t.
AN
D
corr
ecti
ve
po
licy
Not
Mu
ltic
oin
t.
OR
not
corr
ecti
ve
poli
cy

18
United Kingdom was one of only two countries determined to fulfill all of the sustainability criteria (in
addition to Norway), so it is particularly surprising that its fiscal practices have since declined. Norway
is still found to be fiscally sustainable as in the past sample period, but it still presents a particularly
interesting case study in this paper. In my updated sample period, Norway fails to be multicointegrated
and it also fails to have a corrective policy response for its surplus issue. However, by my revised
criteria I have allowed all surplus countries to be assessed as sustainable. Norway demonstrates this
practicality especially well through its current windfall of oil profits, which are partly siphoned into
government revenues through Norway’s model of state capitalism. Because this source of wealth is a
limited resource (oil reserves), it is essential that Norway builds its savings (and therefore widens
surpluses) to prepare for a future without oil. Norway is also fascinating in my study because of its
negative K0 value, which I will interpret in a later section and which has yet to be seen in any previous
literature. The United States presents an interesting example because it changes from being
multicointegrated to not even simply cointegrated, although in both studies it is characterized as
unsustainable. In Leachman et al, the USA fails the coefficient corrective mechanism criteria, whereas
in my study, the coefficients are appropriate but the lack of even simple cointegration prevents a
sustainable assessment. Finally, the Netherlands is also a very intriguing case study; it is an example of
how the cointegration tests can pass, but alone do not ensure sustainability. Netherlands is cointegrated,
but this is of no real beneficial quality, because Netherlands builds up deficits and shows no revenue
response.
Norway
Norway, Finland and Denmark are categorized as sustainable because of their persistent
surpluses. This result illustrates the divergence from multicointegration and corrective policy response
sustainability theory: Norway and Finland would be unsustainable because they lack multicointegration
and Denmark would be unsustainable because its policy response to surplus is increased revenue. In
addition to lacking cointegration, Norway also increases revenue in response to surplus, though this is
difficult to notice because K1 is negative. Norway has a negative K0, making it the only country that has
a negative correlation between the flow variables: as revenue goes up, spending goes down. Figure 2
verifies that as time increases, the latter occurred: revenue increased while spending decreased. That
makes K1 easier to interpret: it represents a negative relationship between debt accumulation and

19
revenue response. The widening surpluses (evidenced by negative K0) indicate that debt decreased over
the time period, so the revenue response increase over the time period.
The current theory would characterize this behavior—persistent surplus with increases in
revenue—as unsustainable. However, a discussion about Norway’s economy shows that rather,
Norway’s practices exhibit sustainability. Given the importance of a strong GDP to public finance,
Norway displays consistent high levels of GDP per capita. Norway today is one of the wealthiest nations
in the world, measured both by GDP per capita and in capital stock. On the United Nations Human
Development Index, Norway has been among the three top countries for several years, and in 2012 it
was ranked 1st
(UNDP).
Norway is particularly prosperous due to its huge stocks of natural resources combined with a
skilled labor force. Norway is a developed mixed economy, where the state owns large stakes in many
private companies, including oil companies. Norway is the world’s eighth largest oil exporter, and this
contributes significantly to government revenues. Petroleum currently accounts for 30 percent of
government revenues. Therefore the large and increasing surpluses in Norway are unlikely to remain so
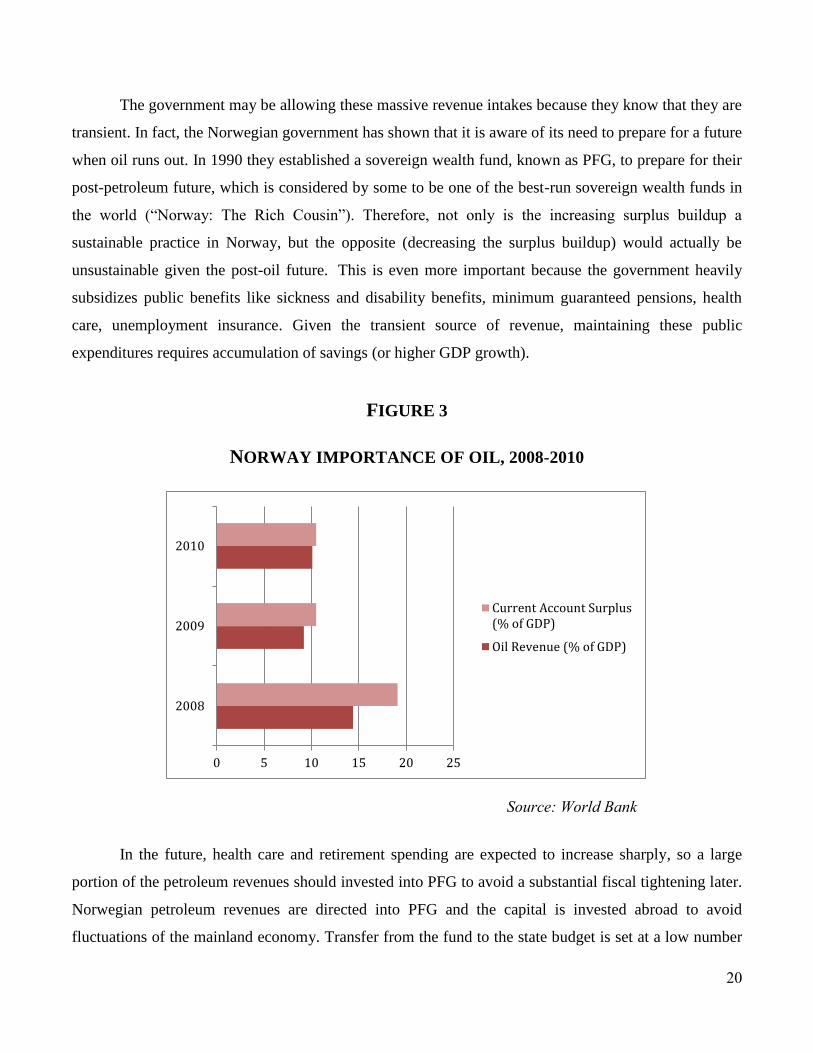
once natural petroleum reserves run out. Figure 3 shows the high importance of oil in the Norwegian
economy.
FIGURE 2
NORWAY REVENUES/GDP AND EXPENDITURES/GDP, 1974-2010
Norway
40
45
50
55
60
1970 1980 1990 2000 2010Year
Revenues Expenditures
% o
f G
DP
20
The government may be allowing these massive revenue intakes because they know that they are
transient. In fact, the Norwegian government has shown that it is aware of its need to prepare for a future
when oil runs out. In 1990 they established a sovereign wealth fund, known as PFG, to prepare for their
post-petroleum future, which is considered by some to be one of the best-run sovereign wealth funds in
the world (“Norway: The Rich Cousin”). Therefore, not only is the increasing surplus buildup a
sustainable practice in Norway, but the opposite (decreasing the surplus buildup) would actually be
unsustainable given the post-oil future. This is even more important because the government heavily
subsidizes public benefits like sickness and disability benefits, minimum guaranteed pensions, health
care, unemployment insurance. Given the transient source of revenue, maintaining these public
expenditures requires accumulation of savings (or higher GDP growth).
FIGURE 3
NORWAY IMPORTANCE OF OIL, 2008-2010
In the future, health care and retirement spending are expected to increase sharply, so a large
portion of the petroleum revenues should invested into PFG to avoid a substantial fiscal tightening later.
Norwegian petroleum revenues are directed into PFG and the capital is invested abroad to avoid
fluctuations of the mainland economy. Transfer from the fund to the state budget is set at a low number
0 5 10 15 20 25
2008
2009
2010
Current Account Surplus(% of GDP)
Oil Revenue (% of GDP)
Source: World Bank

21
(4 percent) to ensure gradual and sustainable phasing in of petroleum revenues. In addition to PFG,
government has taken several additional measures to ensure future sustainability. Though not a member
of the European Union (EU), Norway has joined the European Free Trade Association, which gives
Norwegian companies access to European markets. The government is also encouraging new
“mainland” industries that would be internationally competitive, like the formation of nine “centers of
expertise,” including Oslo Cancer Cluster (Aldridge 2008).
Canada
Canada, Sweden, Portugal, and Austria are the group that under past frameworks would be the
only countries considered sustainable. They are multicointegrated and have the appropriate corrective
policy responses. Canada in particular has become dramatically more sustainable since the Leachman et
al. results in which it was neither multicointegrated nor had the correct policy response. In Figure 4, a
dramatic shift is visible in the mid-1990s: the difference between spending and revenue decreases, and
after this shift, most years are either balanced budgets or surpluses. Canada’s method of fiscal
restructuring was through substantial cuts in government spending, rather than large tax increases. The
1995 budget called for six to seven dollars in expenditure cuts for every dollar of increased taxes. The
Canadian government cut defense, unemployment insurance, transportation, business subsidies, aid to
provincial governments, and began to transform the Canada Pension Plan from a pay-as-you-go
structure to a partially funded system (Henderson and Anderson). As a result of these, Canada’s
government debt burden is among the lowest in the Group of Eight (G8) nations.
The diversified nature of the Canadian economy also bodes well for its future sustainability. Like
many developed countries, the service industry is a dominant sector of the Canadian economy.
However, unlike many developed countries, primary sectors like logging and oil are also important
industries in Canada. In addition, its manufacturing and commercial fishing industries are also
important. Canada, like Norway, is one of the few developed countries that is a net exporter of oil and
natural gas. With its vast Athabasca oil sands, also known as “dirty oil,” Canada has the third largest
reserves of oil in the world. In addition, Canada has considerable mineral resources of coal, copper, iron
ore, and gold. Export, especially of its vast natural resources, is a significant part of Canadian economy.
Though Canada exhibits current sustainability and a diverse economy, like many other
developed welfare states, the healthcare system is a significant economic factor. Because most aspects of
the healthcare insurance system are financed by provincial government revenues and due to the rising

22
costs of healthcare, healthcare has grown to become the largest component of Canadian provincial
budgets. The growing costs of social expenditure, especially health, are one potential threat to future
sustainability trends. Long term sustainability of the mining and petroleum industries are also important
concerns; however, large discoveries of new reserves continue to be made.
FIGURE 4
CANADA REVENUES/GDP AND EXPENDITURES/GDP, 1974-2010
Netherlands
The Netherlands was the only country that had persistent deficits and was characterized by
simple cointegration. By both current theory and this paper’s methodology, the Netherlands is
unsustainable for its negative revenue response to debt buildup. Like Canada, the Netherlands appears to
have a visible shift in stricter fiscal practice in the mid-1990s, and this could also be indicated by the
presence of cointegration in this sample compared to no cointegration in the Leachman et al. sample
period of 1970-98. The shift can potentially be explained by the political changes occurring in the
Netherlands during the mid-1990s that resulted in greater conservatism. In fact, from 1994-2007, the
Netherlands practice was to deliberately underestimate the next year’s national income growth in order
to dampen the growth of debt (van der Ploeg).
35
40
45
50
55
1970 1980 1990 2000 2010Year
Revenues Expenditures
% o
f G
DP
Canada

23
Since the financial sector is an important aspect of the Dutch economy, the 2008 global financial
crisis, which was instigated by the housing collapse and aggressive sub-prime mortgage lending in the
United States, and subsequent European debt crisis, has had severe negative repercussions for the Dutch
economy. As a result, the government had to bail out several financial institutions. The recent credit
crises in Europe have also led to the loosening of previously stern financial policies. This probably
increased government expenditures, especially due to the bailout and slow economic growth.
Unfortunately, though the economy has shown some signs of recovery since 2009, the Dutch economy
is currently in recession again, making austerity measures even more difficult to implement.
However, the economic situation is not all bleak for the Netherlands. Based on GDP per capita,
the Netherlands is one of the top 10 richest countries in the world. It is a desirable destination for foreign
direct investment and is a European hub for transportation. In addition, the Netherlands boosts a highly
mechanized agricultural sector that produces large surpluses for export. The Netherlands has also
managed to maintain its AAA credit rating even as larger economies like the United Kingdom have not.
FIGURE 5
NETHERLANDS REVENUES/GDP AND EXPENDITURES/GDP, 1974-2010]
45
50
55
60
1970 1980 1990 2000 2010Year
Revenues Expenditures
% o
f G
DP
Netherlands

24
USA
Despite being unsustainable, the USA, France, and Italy at least exhibited positive revenue
responses to their debt accumulation. More research is required, but this group as well as three countries
ranked below them may illustrate the importance of political systems for attaining fiscal sustainability.
The United States is the world’s largest national economy and its GDP is about a quarter of the global
GDP. It contains an abundance of natural resources, a well-developed infrastructure, and a highly
productive workforce with high levels of research and capital investment. The majority of global
currency reserves have been saved in U.S. dollars. Clearly, the United States economy has the strength
needed to generate greater growth and revenue, but due to political polarizations, it is difficult to
implement the appropriate economic policies to accomplish a fiscally sustainable trend. However, the
United States has improved its policy response since the Leachman et al. sample in which it had a
negative revenue response. Figure 6 illustrates the period of surpluses during the end of the Clinton
presidency, which was not captured by Leachman et al. However, the Bush era tax cut and the financing
of the Iraq and Afghanistan wars coincided with a return to deficit spending. Figure 7 compares military
expenditures with the overall primary deficit, both as percentages of GDP from 2008-2010 to show that
military spending accounts for a significant part of government outlays.
FIGURE 6
USA REVENUES/GDP AND EXPENDITURES/GDP, 1974-2010
30
35
40
45
1970 1980 1990 2000 2010Year
Revenues Expenditures
% o
f G
DP
USA

25
FIGURE 7
USA IMPORTANCE OF MILITARY SPENDING, 2008-2010
The United States’ strategy to address the housing collapse of 2007-2008 and subsequent
financial crisis from aggressive sub-prime lending was stimulus spending. This resulted in bail outs of
several financial institutions and major companies in the automobile industry. The stimulus spending
stabilized the financial sector and prevented the economy from going into depression, but significantly
added to the public expenditures. The gridlock in Congress and its inability to arrive at a compromise
solution for entitlement reform or revenue increases to reduce national debt resulted in the downgrading
of the United States’ credit rating from AAA to AA+ in 2011 by Standard and Poor’s (S&P). The
economic outlook is further exacerbated by the aging baby boomer generation and the associated
increase in social security and health care costs.
United Kingdom
The United Kingdom is joined by Japan and Spain as failing all measures because of their lack of
even simple cointegration and their negative revenue responses to debt accumulation. The United
Kingdom is the most surprising because it was one of only two countries in Leachman et al.’s 15-
country sample that was multicointegrated and sustainable (along with Norway). Despite its shift in
sustainability assessments, the United Kingdom has not built up massive deficits, which is evidenced by
the low K0 value of 1.074. In addition, Figure 8 shows that the United Kingdom has experienced
balanced budgets in the late 1980s and a couple years of surplus around the turn of the century.
Spending in the United Kingdom has soared in recent years, which is visible in the final data
points in Figure 8. Like the United States, the British government issued bailout packages to banks in
0 5 10 15
2008
2009
2010
Primary Deficit (% ofGDP)
Military Spending (%of GDP)
Source: World Bank

26
2008. However, the UK’s general strategy has been public austerity rather than stimulus. The U.K.
economy has been weak in recent years and has experienced a double dip recession between 2008 and
2012, resulting in a loss of its AAA credit rating from the Moody’s credit rating agency. It is estimated
that 14 million people were at the risk of poverty and the economic inequality in the U.K. is growing
faster than in any other developed country. Larch (2012) is part of the political economy literature on
budget deficits, and finds a positive relationship between income inequality and accumulation of budget
deficits. This is consistent with the current situation in the United Kingdom, where economic inequality
is rising and budget deficits are also rising. Larch suggests that this may be due to the government’s role
in providing welfare services and redistributive policies in times of economic inequality, which could
both increase government expenditure and hamper economic growth.
Like other developed welfare states, the government provides health care and other social
welfare programs which are increasing in cost. The United Kingdom is currently undergoing significant
healthcare reform as a result of the increasing expenditure burden of its public healthcare system on the
government expenditures. This reform emphasizes competition between public and private providers of
healthcare and reduces the number of bureaucratic staff officials involved in the provision of healthcare
services.
FIGURE 8
UNITED KINGDOM REVENUES/GDP AND EXPENDITURES/GDP, 1974-2010
35
40
45
50
1970 1980 1990 2000 2010Year
Revenues Expenditures
% o
f G
DP
United Kingdom
27
VI. Conclusion
This paper has employed the multicointegration framework to analyze the sustainability of fiscal
practices for OECD economies. In addition, it has shown that these sustainability statuses can vary
greatly over time: results changed dramatically compared with an earlier sample period conducted by
Leachman et al. in which “unsustainable” countries such as Canada and Finland are now among the
highest ranked and countries like the United Kingdom moved from “multicointegrated and sustainable”
to unsustainable and not even cointegrated.
The methodology used for Norway, Finland and Denmark suggested a more practical approach
to assessing countries that have persistent surpluses. If series are not multicointegrated or do not have
decreasing revenue responses, that could indicate a deliberate preparation for the future rather than
government hoarding excess resources. Therefore, unlike theory suggests, multicointegration is not
necessarily an appropriate goal for surplus nations that are deliberately preparing for future periods of
less growth or less revenue. Similarly, the policy response coefficient does not need to be negative for
these countries for the same reason. This paper also discussed the interpretation of a negative K0, which,
due to being an uncommon finding, had not been addressed in previous literature.
Policymakers can see the different approaches to fiscal practice inherent in this sample of OECD
economies. The Scandinavian countries—Norway, Finland, Sweden, and Denmark—were all identified
as sustainable. These are powerful examples that strong social safety nets and large public expenditures
can be sustainable as long as revenue responds to debt buildup. On the other hand, Canada’s dramatic
fiscal reforms led to their fiscal sustainability through reducing public expenditures considerably. A
limitation of multicointegration analysis is that it cannot give a semblance of causation in terms of what
policies cause better fiscal sustainability. Even though causation cannot be determined, the different
approaches to fiscal sustainability send an important message to policymakers: fiscal reform has no
singular path. Clearly the Scandinavian and the Canadian approaches to fiscal practices are extremely
different, yet both are sustainable.
In order to determine a better understanding of which fiscal practices are better suited for which
nations, the next step should be analyses into political systems and into demographic profiles. As
discussed with the United States, the nature of political agreements in a practical setting is very
important to what economic policies have the potential to succeed. In addition, demographic profiles
need to be better understood. Nations with aging demographic profiles will require greater preparation

28
for a future in which revenue generation will become more difficult, whereas countries experiencing
population growth or in-migration are helped by their future ability to repay current debt burdens.
Incorporating these political and development indicators will help to nuance the discussion such that
policymakers and economists can transition from speculation about whether debt is unmanageable and
instead transition to tailored policies that promote national and global wellbeing.

29
References
Alesina, Alberto, and Roberto Perotti. 1995. “The Political Economy of Budget Deficits.” Staff Papers
– International Monetary Fund 42 (1): 1-31.
Alesina, Alberto, and Guido Tabellini. 1990. “A Positive Theory of Fiscal Deficits and Government
Debt.” Review of Economic Studies 57 (3): 403-414.
Archer, Clive. 2008. The European Union. New York, NY: Routledge.
Ball, L., D. W. Elmendorf, and N. G. Mankiw. 1998. “The Deficit Gamble.” Journal of Money,
Credit and Banking 30 (1): 699—720.
Barro, Robert. 1979. “On the Determination of the Public Debt.” The Journal of Political Economy 87
(5); 940-971.
Barro, Robert. 1989. “The Ricardian Approach to Budget Deficits.” Journal of Economic Perspectives 3
(2): 37-54.
Bohn, H. 1995. “The Sustainability of Budget Deficits in a Stochastic Economy.” Journal of Money,
Credit and Banking 27 (1): 257—71.
Bohn, H. 1998. “The Behavior of U.S. Public Debt and Deficits.” Quarterly journal of Economics 113
(1): 949—63.
Burnside, Craig. 2005. Fiscal Sustainability in Theory and Practice: A Handbook. Washington, D.C.:
World Bank.
Chang, Michele. 2009. Monetary Integration in the Eurozone. Basingstoke, NY: Palgrave Macmillan.
Cochrane, John H. 2001. “Long-Term Debt and Optimal Policy in the Fiscal Theory of the Price Level.”
Econometrica 69 (1): 69-116.
Corsetti, Giancarlo, and Bartosz Mackowiak. 2006. “Fiscal Imbalances and the Dynamics of Currency
Crises.” European Economic Review 50 (5): 1317-38.
Cukierman, Alex, and Allan Meltzer. 1989. “A Political Theory of Government Debt and Deficits in a
Neo-Ricardian Framework.” Tepper School of Business Paper 808.
Daniel, Betty. 2001. “A Fiscal Theory of Currency Crises.” International Economic Review 42 (4): 969-
88.
Dupor, William. 2000. “Exchange Rates and the Fiscal Theory of the Price Level.” Journal of Monetary
Economics 45 (3): 613-30.
Engsted, T., and S. Johansen. 1997. “Granger’s Representation Theorem and Multicointegration.”
European University Institute Working Paper Eco. No. 97/15.
Engsted, T., J. Gonzalo, and N. Haldrup. 1997. “Testing for Multicointegration.” Economic Letters 56:
259—66.
Escario, Regina, Maria Gadea, and Marcela Sabate. 2012. “Multicointegration, seignorage and fiscal
sustainability. Spain 1857-2000.” Journal of Policy Modeling 34 (2): 270—283.
Granger, C. W. J. 1989. “Investigation of Reproduction, Sales and Inventory Relationships Using
Multicointegration and Non-Symmetric Error Correction Models.” Journal of Applied
Econometrics 4 (1): 145—59.
Granger, C. W. J., and T. H. Lee. 1990. “Multicointegration,” in Advances in Econometrics:
Cointegration, Spurious Regression and Unit Roots, edited by G. F. Rhodes, Jr. and I. B.
Fomlsy. New York: JAI Press, 71—84.
Hamilton, J. D., and M. A. Flavin. 1986. “On the Limitations of Government Borrowi-ng: A Framework
for Empirical Testing.” American Economic Review 76: 808–16.
Henderson, David, and Jerrod Anderson. 2011. “Canada’s Reversed Fiscal Crisis.” Mercatus Center,
George Mason University Working Paper No. 11-25.

30
Johansen, Soren, Rocco Mosconi, and Bent Nielsen. 2000. “Cointegration analysis in the presence of
structural breaks in the deterministic trend.” Econometrics Journal 3 (1): 216—249.
Kremers, J. 1989. “US Federal Indebtedness and the Conduct of Fiscal Policy.” Journal of Monetary
Economics 23: 219–38
Larch, Martin. 2012. “Fiscal Performance and Income Inequality: Are Unequal Societies More Deficit-
Prone? Some Cross-Country Evidence.” International Review for Social Sciences 65 (1): 53-80.
Leachman, L., 1996. ‘‘New Evidence on the Ricardian Equivalence Theorem: A Multi-Cointegration
Approach.” Applied Economics 28: 1–10.
Leachman, Lori, Alan Bester, Guillermo Rosas, and Peter Lange. 2005. “Multicointegration and
Sustainability of Fiscal Practices.” Economic Inquiry 43 (2): 454—466.
Leachman, Lori, Guillermo Rosas, Peter Lange, and Alan Bester. 2007. “The Political Economy of
Budget Deficits.” Economics & Politics 19 (3): 369—420.
Mundell, Robert. 1961. “A theory of Optimum Currency Areas.” American Economic Review 51 (4):
509—517.
“Norway: The Rich Cousin.” The Economist Newspaper Limited 2013. 2 Feb. 2013.
Pratley, Nils. “It's hard to quibble with Moody's removal of UK's AAA status.” The Guardian. 25 Feb.
2013.
Sims, Christopher. 1994. “A Simple Model for the Determination of the Price Level and the Interaction
of Monetary and Fiscal Policy.” Economic Theory 4(3): 381-99.
Trehan, B., and C. E. Walsh. 1990. ‘‘Testing Intertemporal Budget Constraints: Theory and
Applications to US Federal Budget and Current Account Deficits.’’ Federal Reserve Banks of
San Francisco. Unpublished manuscript.
Uctum, M., and M. Wickens. 1996. “Debt and Deficit Ceilings, and Sustainability of Fiscal Policies:
An Intertemporal Analysis.” Federal Reserve Bank, Bank of New York Research Paper No.
9615.
Van der Ploeg, Frederick. 2008. “Structural reforms, public investment and the fiscal stance: A prudent
approach.” Oxford University and the University of Amsterdam.
Von Hagen, Jurgen. 2008. “European Experiences with Fiscal Rules and Institutions,” in Elizabeth
Garrett, Elizabeth A. Graddy, and Howell E. Jackson (eds.), Fiscal Challenges – An
Interdisciplinary Approach to Budget Policy, Cambridge: Cambridge University Press.
Von Hagen, Jurgen. 2010. “The Sustainability of Public Finances and Fiscal Policy Coordination in the
EMU.” CASE-Center for Social and Economic Research 412.
Von Hagen, Jurgen, and I. J. Harden. 1994. “National Budget Processes and Fiscal Performance.”
European Economy Reports and Studies 3 (1): 311—418.
Von Hagen, Jurgen, and Charles Wyplosz. 2008. “EMU’s Decentralized System of Fiscal Policy.”
European Economy – Economic Papers 306, Directorate General Economic and Monetary
Affairs, European Commission.
Von Hagen, Jurgen, Mark Hallerberg, and Rolf R. Strauch. 2007. “The Design of Fiscal Rules and
Forms of Governance in European Union Countries.” European Journal of Political Economy 23
(2): 338—359.
Wilcox, D. W. 1987. ‘‘The Sustainability of Government Deficits: Implications of the Present Value
Borrowing Constraint.’’ Board of Governors of the Federal Reserve System Working Paper No.
77: 9.
Woodford, Michael. 1995. “Price Level Determinacy without Control of a Monetary Aggregate.”
Carnegie-Rochester Conference Series on Public Policy 43 (12): 1-46.
31
Appendix
LEACHMAN ET AL. (2005) RESULTS
Country K0 K1 Con td Vectors Result
Belgium
Canada
Denmark
Finland
France
Greece
Italy
Netherlands++
Norway++
Portugal
Spain
Sweden
Switzerland
United Kingdom++
Unites States
1.5919
1.6148
1.1759
1.3353
1.4315
2.3904
2.1484
1.1844
0.9572
1.2024
1.1915
1.4118
1.0336
1.2764
1.5536
-5.3799
-1.1284
-1.2633
-2.2193
-0.0000
-1.2673
12.7868
0.6284
-1.507
1.4386
0.3217
-2.7138
0.6599
0.3082
-1.2474
1.8813
0.4436
0.4408
0.7282
-0.1622
0.4134
-3.4824
0.0311
0.0649
-0.2424
-0.0704
1.0663
-0.1636
0.0027
0.3395
-0.2532
-0.2147
-0.1036
-0.1740
-0.2118
-0.3867
-0.6004
0.0026
-0.0014
-0.0703
-0.0655
-0.2332
-0.0987
0.0009
-0.1530
None
None
Coint.
Coint.
Coint.
None
None
None
Multicoint.
None
Coint.
Coint.
None
Multicoint.
Multicoint.
Unsust.
Unsust.
Unsust.
Unsust.
Unsust.
Unsust.
Unsust.
Unsust.
Sustainable
Unsust.
Unsust.
Unsust.
Unsust.
Sustainable
Unsust.
NOTE.— Based on the equation: Yt = K0Xt + K1 ΔXt + α0 + α1td, where Y = accumulated spending
~I(2) and X = accumulated revenues ~I(2). ++
indicates that the real spending and revenue per capita
streams were used instead of spending and revenue as a percent of GDP.
Recommended