May 7, 2020
FIRST QUARTER 2020 EARNINGS CALL

Business Update
Gary NorcrossChairman, President and CEO
1Q 2020 Results
Woody WoodallChief Financial Officer
SPEAKERS
3
DISCLOSURES
Forward-looking StatementsOur discussions today, including this presentation and any comments made by
management, contain “forward-looking statements” within the meaning of the U.S. federal
securities laws. Any statements that refer to future events or circumstances, including our
future strategies or results, or that are not historical facts, are forward-looking statements.
Actual results could differ materially from those projected in forward-looking statements due
to a variety of factors, including the risks and uncertainties set forth in our earnings press
release dated May 7, 2020, our annual report on Form 10-K for 2019 and our other filings
with the SEC. We undertake no obligation to update or revise any forward-looking
statements. Please see the Appendix for additional details on forward-looking statements.
Non-GAAP MeasuresThis presentation will reference certain non-GAAP financial information. For a description
and reconciliation of non-GAAP measures presented in this document, please see the
Appendix attached to this presentation or visit the Investor Relations section of the FIS
website at www.fisglobal.com.

BUSINESS UPDATE
5
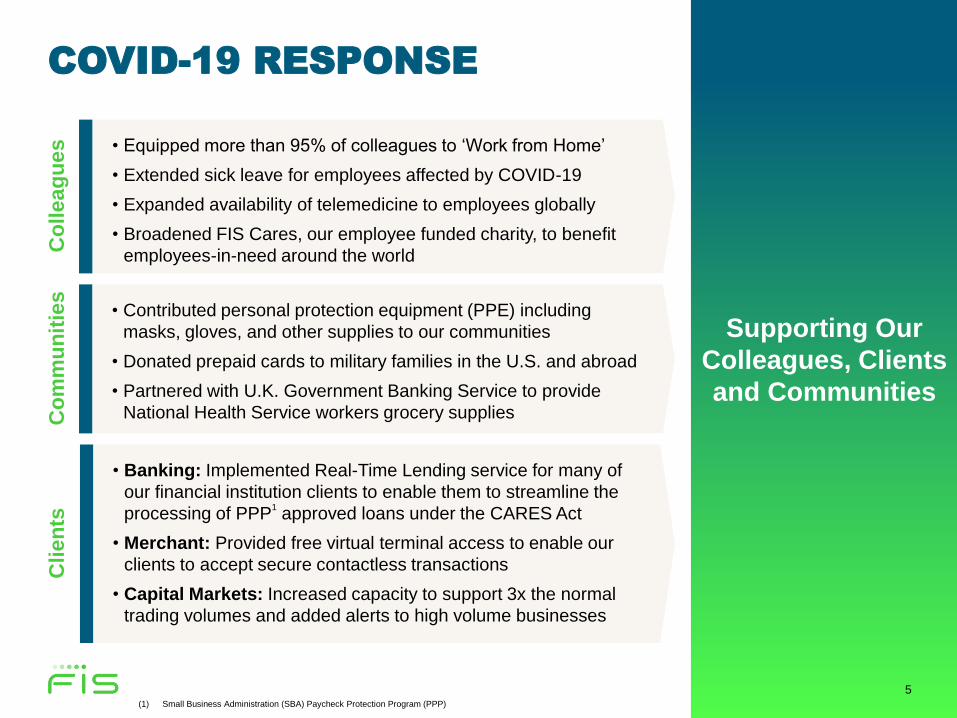
COVID-19 RESPONSE
(1) Small Business Administration (SBA) Paycheck Protection Program (PPP)
Co
mm
un
itie
s
• Contributed personal protection equipment (PPE) including
masks, gloves, and other supplies to our communities
• Donated prepaid cards to military families in the U.S. and abroad
• Partnered with U.K. Government Banking Service to provide
National Health Service workers grocery supplies
Cli
en
ts
• Banking: Implemented Real-Time Lending service for many of
our financial institution clients to enable them to streamline the
processing of PPP1approved loans under the CARES Act
• Merchant: Provided free virtual terminal access to enable our
clients to accept secure contactless transactions
• Capital Markets: Increased capacity to support 3x the normal
trading volumes and added alerts to high volume businesses
Supporting Our
Colleagues, Clients
and Communities
Co
lle
ag
ues • Equipped more than 95% of colleagues to ‘Work from Home’
• Extended sick leave for employees affected by COVID-19
• Expanded availability of telemedicine to employees globally
• Broadened FIS Cares, our employee funded charity, to benefit
employees-in-need around the world
5

6
DURABLE BUSINESS MODEL
HIGHLY RECURRING
REVENUE MODEL
EXPOSURE TO NON-
CYCLICAL MARKETS
ENHANCING
PROFITABILITY
STRONG BALANCE
SHEET
• Mission-critical
applications
• Diverse revenue
streams provide
resiliency
• Investing for growth
• Leading technology
solutions provider to
financial services
• Unique large
merchant and
eCommerce/omni
capabilities
• Integration ahead
of schedule
• Implemented crisis
expense levers
• Ample liquidity
• Strong free cash
flow generation
FIS is well positioned to navigate uncertainty
For a description of non-GAAP measures and a reconciliation of GAAP to non-GAAP measures, see Appendix.

7
LONG-TERM GROWTH STRATEGY
Advancing the way the world
pays, banks and invests …
by applying our powerful
client value proposition
7
WORLD-CLASS SCALE
DATA AND INSIGHTS
ACCESS TO INNOVATION
Invest
Pay
Bank
8
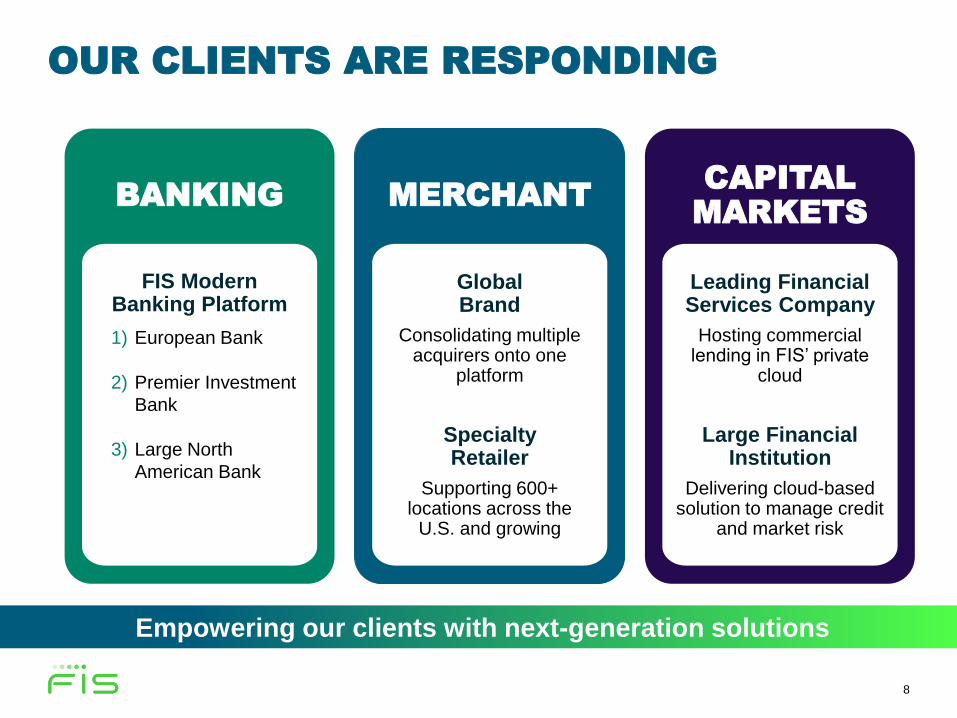
OUR CLIENTS ARE RESPONDING
BANKING MERCHANTCAPITAL
MARKETS
Empowering our clients with next-generation solutions
Leading Financial Services Company
Hosting commercial lending in FIS’ private
cloud
Large Financial Institution
Delivering cloud-based solution to manage credit
and market risk
Global Brand
Consolidating multiple acquirers onto one
platform
Specialty Retailer
Supporting 600+ locations across the
U.S. and growing
FIS Modern Banking Platform
1) European Bank
2) Premier Investment
Bank
3) Large North
American Bank

1Q 2020 RESULTS

10
$1.16
$1.28
$2,057
$3,078
1Q 2020 ACCOMPLISHMENTS
1Q 2020 RESULTS IMPACTED BY COVID-19
• Organic revenue grew 2%, including ~1 point headwind
from 1Q19 non-recurring revenue
‒ Banking reported 1% organic growth, including ~2 point
headwind from 1Q19 non-recurring revenue
‒ Merchant reported flat organic revenue growth,
significantly impacted by COVID-19
‒ Capital Markets reported 7% organic growth, primarily
due to revenue from recent new sales
‒ Reclassified certain non-strategic businesses from
Merchant and Banking into the Corporate and Other
segment, representing less than 2% of revenue
INTEGRATION AHEAD OF SCHEDULE with
minimal disruption from COVID-19
• Revenue synergies increased 25% QOQ to $100 million
• Achieved cost synergies increased 25% QOQ to $580
million1
• Raising and accelerating cost synergy target by $100
million to at least $700 million exiting 20201
NEW CLIENT DELIVERY CONTINUED with
minimal disruption from COVID-19
• Mobilized remote delivery for Professional Services and
implementations
Revenue ($ in millions)
Adjusted EBITDA ($ in millions)
Adjusted EPS
50% Growth
(2% Organic)
71% Growth
(40.5% Margin, Up 510 bps)
10%
Growth
(1) Synergies are shown on an annual run-rate basis with future targets defined as expectations for achievement exiting 2020, respectively.
For a description of non-GAAP measures and a reconciliation of GAAP to non-GAAP measures, see Appendix.
1Q20
1Q19
$729
$1,2471Q20
1Q19
1Q20
1Q19

11
INTEGRATION AHEAD OF SCHEDULE($ millions, annual run-rate achievement)
• Achieved approximately $100 million in
annual run-rate revenue synergies exiting
1Q20, up 25% since the end of 4Q19
• Recent wins include another significant
Premium Payback client and two large new
bank referral agreements
Revenue Synergy Update1
Close
$200M
$400M
$500M
$300M
$100M
(1) Synergies are shown on an annual run-rate basis with future targets defined as expectations for achievement exiting 2020 and 2022.
~$580M Achieved
in 1Q 2020
Close
$200M
$400M
Increasing Target
to at least $700M
by YE 2020 $600M
Cost Synergy Update1
• Achieved approximately $580 million in annual
run-rate cost synergies exiting 1Q20, up 25%
since the end of 4Q19
• Accelerating expense initiatives to enable at
least $700 million dollars in cost synergies by
the end of this year
~$100M Achieved
in 1Q 2020
Total YE 2020
Target of $200M
Total YE 2022
Goal of $550M
12
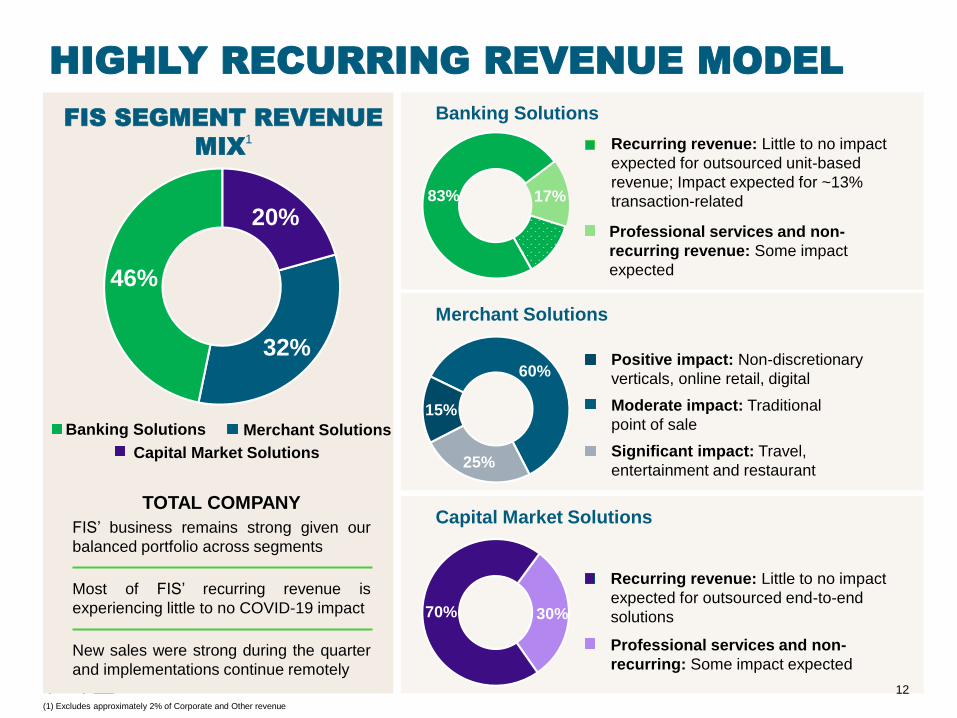
32%
46%
20%
HIGHLY RECURRING REVENUE MODEL
Banking Solutions
17%83%
30%70%
Merchant Solutions
Recurring revenue: Little to no impact
expected for outsourced unit-based
revenue; Impact expected for ~13%
transaction-related
Professional services and non-
recurring revenue: Some impact
expected
Capital Market Solutions
Recurring revenue: Little to no impact
expected for outsourced end-to-end
solutions
Professional services and non-
recurring: Some impact expected
FIS SEGMENT REVENUE
MIX1
TOTAL COMPANY
FIS’ business remains strong given our
balanced portfolio across segments
Most of FIS’ recurring revenue is
experiencing little to no COVID-19 impact
New sales were strong during the quarter
and implementations continue remotely
60%
25%
15%
Positive impact: Non-discretionary
verticals, online retail, digital
Significant impact: Travel,
entertainment and restaurant
Moderate impact: Traditional
point of sale
Capital Market Solutions
Banking Solutions Merchant Solutions
12
(1) Excludes approximately 2% of Corporate and Other revenue
13
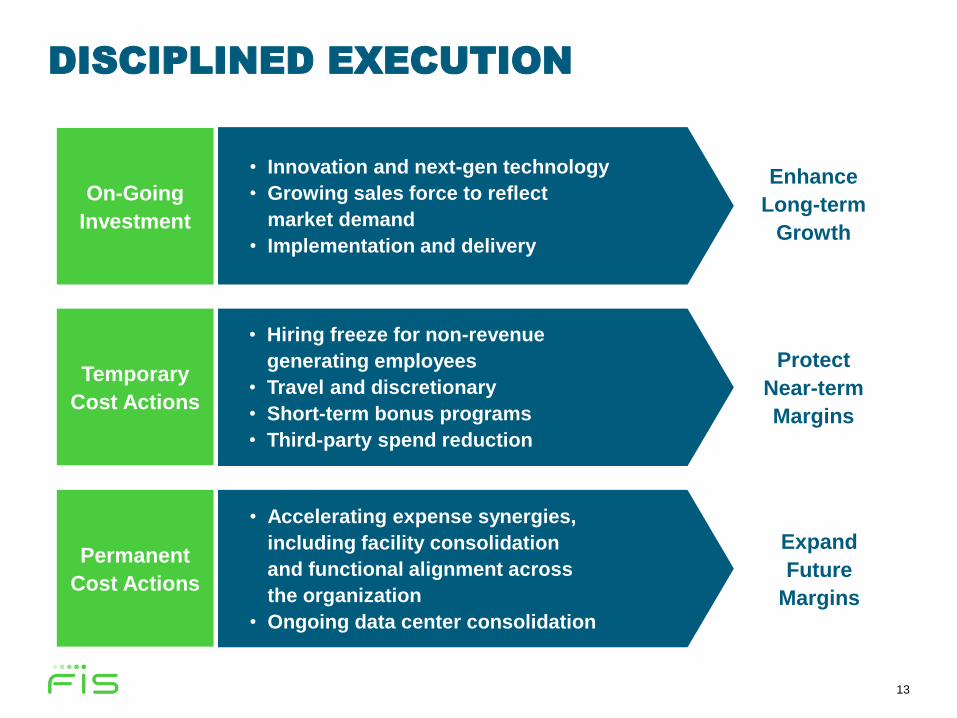
DISCIPLINED EXECUTION
Protect
Near-term
Margins
• Hiring freeze for non-revenue
generating employees
• Travel and discretionary
• Short-term bonus programs
• Third-party spend reduction
Enhance
Long-term
Growth
• Innovation and next-gen technology
• Growing sales force to reflect
market demand
• Implementation and delivery
Expand
Future
Margins
• Accelerating expense synergies,
including facility consolidation
and functional alignment across
the organization
• Ongoing data center consolidation
On-Going
Investment
Temporary
Cost Actions
Permanent
Cost Actions

14
STRONG BALANCE SHEET
AND LIQUIDITY PROFILE
March 31, 2020
$1.4
$1.6
$3.0
Baa2/BBB
Cash
Available Borrowing Capacity(1)
Total Liquidity
Investment Grade Credit Ratings
(1) $5.5 billion revolving credit facility less outstanding commercial paper and drawn revolver balances.
($ in billions)
Next bond maturity: €500M in 1Q 2021


16
APPENDIX

17
FORWARD-LOOKING STATEMENTS
This presentation and today’s webcast contain “forward-looking statements” within the meaning of the U.S. federal securities laws. Statements that are not
historical facts, including statements about anticipated financial outcomes, including any earnings guidance of the Company, projected revenue or expense
synergies, business and market conditions, outlook, foreign currency exchange rates, deleveraging plans, expected dividends and share repurchases, the
Company’s sales pipeline and anticipated profitability and growth, as well as other statements about our expectations, beliefs, intentions, or strategies
regarding the future, are forward-looking statements. These statements relate to future events and our future results, and involve a number of risks and
uncertainties. Forward-looking statements are based on management’s beliefs, as well as assumptions made by, and information currently available to,
management. Any statements that refer to beliefs, expectations, projections or other characterizations of future events or circumstances and other
statements that are not historical facts are forward-looking statements.
Actual results, performance or achievement could differ materially from those contained in these forward-looking statements. The risks and uncertainties
that forward-looking statements are subject to include the following, without limitation:
• the outbreak of the novel coronavirus (“COVID-19”) and measures to reduce its spread, including the impact of governmental or voluntary actions such
as business shutdowns and stay-at-home orders;
• the duration of the COVID-19 pandemic and its impacts, including the general impact of an economic recession, reductions in consumer and business
spending, and instability of the financial markets across the globe;
• the economic and other impacts of COVID-19 on our clients which affect the sales of our solutions and services and the implementation of such
solutions;
• the risk of losses in the event of defaults by merchants (or other parties) to which we extend credit in our card settlement operations or in respect of any
chargeback liability;
• changes in general economic, business and political conditions, including those resulting from COVID-19 or other pandemics, intensified international
hostilities, acts of terrorism, changes in either or both the United States and international lending, capital and financial markets and currency
fluctuations;
• the risk that the Worldpay transaction will not provide the expected benefits, or that we will not be able to achieve the cost or revenue synergies
anticipated;
• the risk that the integration of FIS and Worldpay will be more difficult, time-consuming or expensive than anticipated;
• the risk that other acquired businesses will not be integrated successfully, or that the integration will be more costly or more time-consuming and
complex than anticipated;
• the risk that cost savings and other synergies anticipated to be realized from other acquisitions may not be fully realized or may take longer to realize
than expected;
• the risks of doing business internationally;

18
FORWARD-LOOKING STATEMENTS
• the effect of legislative initiatives or proposals, statutory changes, governmental or other applicable regulations and/or changes in industry requirements,
including privacy and cybersecurity laws and regulations;
• the risks of reduction in revenue from the elimination of existing and potential customers due to consolidation in, or new laws or regulations affecting, the
banking, retail and financial services industries or due to financial failures or other setbacks suffered by firms in those industries;
• changes in the growth rates of the markets for our solutions;
• failures to adapt our solutions to changes in technology or in the marketplace;
• internal or external security breaches of our systems, including those relating to unauthorized access, theft, corruption or loss of personal information
and computer viruses and other malware affecting our software or platforms, and the reactions of customers, card associations, government regulators
and others to any such events;
• the risk that implementation of software (including software updates) for customers or at customer locations or employee error in monitoring our
software and platforms may result in the corruption or loss of data or customer information, interruption of business operations, outages, exposure to
liability claims or loss of customers;
• the reaction of current and potential customers to communications from us or regulators regarding information security, risk management, internal audit
or other matters;
• competitive pressures on pricing related to the decreasing number of community banks in the U.S., the development of new disruptive technologies
competing with one or more of our solutions, increasing presence of international competitors in the U.S. market and the entry into the market by global
banks and global companies with respect to certain competitive solutions, each of which may have the impact of unbundling individual solutions from a
comprehensive suite of solutions we provide to many of our customers;
• the failure to innovate in order to keep up with new emerging technologies, which could impact our solutions and our ability to attract new, or retain
existing, customers;
• an operational or natural disaster at one of our major operations centers;
• failure to comply with applicable requirements of payment networks or changes in those requirements;
• fraud by merchants or bad actors; and
• other risks detailed in the “Risk Factors” and other sections of our Annual Report on Form 10-K for the fiscal year ended December 31, 2019, in our
quarterly reports on Form 10-Q and in our other filings with the Securities and Exchange Commission.
Other unknown or unpredictable factors also could have a material adverse effect on our business, financial condition, results of operations and prospects.
Accordingly, readers should not place undue reliance on these forward-looking statements. These forward-looking statements are inherently subject to
uncertainties, risks and changes in circumstances that are difficult to predict. Except as required by applicable law or regulation, we do not undertake (and
expressly disclaim) any obligation and do not intend to publicly update or review any of these forward-looking statements, whether as a result of new
information, future events or otherwise.
19
FIS USE OF NON-GAAP FINANCIAL INFORMATION
Generally Accepted Accounting Principles (GAAP) is the term used to refer to the standard framework of guidelines for financial accounting in the
United States. GAAP includes the standards, conventions, and rules accountants follow in recording and summarizing transactions and in the
preparation of financial statements. In addition to reporting financial results in accordance with GAAP, we have provided certain non-GAAP financial
measures.
These non-GAAP measures include constant currency revenue, organic revenue growth, EBITDA, adjusted EBITDA, adjusted EBITDA margin,
adjusted net earnings, adjusted EPS, and free cash flow. These non-GAAP measures may be used in this release and/or in the attached
supplemental financial information.
We believe these non-GAAP measures help investors better understand the underlying fundamentals of our business. As further described below,
the non-GAAP revenue and earnings measures presented eliminate items management believes are not indicative of FIS’ operating performance.
The constant currency and organic revenue growth measures adjust for the effects of exchange rate fluctuations, while organic revenue growth also
adjusts for acquisitions and divestitures, giving investors further insight into our performance. Finally, free cash flow provides further information
about the ability of our business to generate cash. For these reasons, management also uses these non-GAAP measures in its assessment and
management of FIS’ performance.
Constant currency revenue represents reported revenue excluding the impact of fluctuations in foreign currency exchange rates in the current
period.
Organic revenue growth is constant currency revenue, as defined above, for the current period compared to an adjusted revenue base for the prior
period, which is adjusted to add pre-acquisition revenue of acquired businesses for a portion of the prior year matching the portion of the current
year for which the business was owned, and subtract pre-divestiture revenue for divested businesses for the portion of the prior year matching the
portion of the current year for which the business was not owned, for any acquisitions or divestitures by FIS.
EBITDA reflects earnings from continuing operations before interest, taxes, depreciation and amortization.
Adjusted EBITDA is EBITDA, as defined above, excluding certain costs and other transactions which management deems non-operational in
nature, the removal of which improves comparability of operating results across reporting periods. This measure is reported to the chief operating
decision maker for purposes of making decisions about allocating resources to the segments and assessing their performance. For this reason,
adjusted EBITDA, as it relates to our segments, is presented in conformity with Accounting Standards Codification 280, Segment Reporting, and is
excluded from the definition of non-GAAP financial measures under the Securities and Exchange Commission's Regulation G and Item 10(e) of
Regulation S-K.
Adjusted EBITDA margin reflects adjusted EBITDA, as defined above, divided by revenue.
20
FIS USE OF NON-GAAP FINANCIAL INFORMATION
Adjusted net earnings excludes the impact of certain costs and other transactions which management deems non-operational in nature, the removal of
which improves comparability of operating results across reporting periods. It also excludes the impact of acquisition-related purchase accounting
amortization and equity method investment earnings (loss), both of which are recurring.
Adjusted EPS reflects adjusted net earnings, as defined above, divided by weighted average diluted shares outstanding.
Free cash flow reflects net cash provided by operating activities, adjusted for the net change in settlement assets and obligations and excluding certain
transactions that are closely associated with non-operating activities or are otherwise non-operational in nature and not indicative of future operating cash
flows, less capital expenditures. Free cash flow does not represent our residual cash flow available for discretionary expenditures, since we have
mandatory debt service requirements and other non-discretionary expenditures that are not deducted from the measure.
Any non-GAAP measures should be considered in context with the GAAP financial presentation and should not be considered in isolation or as a substitute
for GAAP measures. Further, FIS’ non-GAAP measures may be calculated differently from similarly titled measures of other companies. Reconciliations of
these non-GAAP measures to related GAAP measures, including footnotes describing the specific adjustments, are provided in the attached schedules
and in the Investor Relations section of the FIS website, www.fisglobal.com.

21
RECONCILIATION OF GAAP TO NON-GAAP
($ millions, unaudited)
Amounts in tables may not sum or calculate due to rounding.
(1) In year adjustments primarily include adding revenue from the Worldpay and Virtus acquisitions.
Revenue Q2 2019 Q3 2019 Q4 2019 FY 2019
Merchant Solutions $ 97 $ 705 $ 1,090 $ 1,942
Banking Solutions 1,357 1,444 1,498 5,671
Capital Market Solutions 594 611 669 2,447
Corporate and Other 65 62 84 272
Consolidated FIS $ 2,112 $ 2,822 $ 3,341 $ 10,333
In Year Adjustments (1)
Merchant Solutions $ 986 $ 298 $ - $ 2,171
Banking Solutions 86 29 - 200
Capital Market Solutions 21 19 19 77
Corporate and Other - - - -
Consolidated FIS $ 1,094 $ 346 $ 19 $ 2,447
Adjusted Base
Merchant Solutions $ 1,083 $ 1,003 $ 1,090 $ 4,113
Banking Solutions 1,443 1,473 1,498 5,871
Capital Market Solutions 615 630 687 2,524
Corporate and Other 65 62 84 272
Consolidated FIS $ 3,206 $ 3,168 $ 3,360 $ 12,780

22
RECONCILIATION OF GAAP TO NON-GAAP
($ millions, unaudited)
Amounts in tables may not sum or calculate due to rounding.
Three months ended March 31, 2020
Capital
Merchant Banking Market Corporate
Solutions Solutions Solutions and Other Total
Revenue 935$ 1,462$ 631$ 50$ 3,078$
FX 4 9 3 - 16
Constant Currency Revenue 939$ 1,471$ 633$ 50$ 3,094$
Three months ended March 31, 2019
Capital
Merchant Banking Market Corporate
Solutions Solutions Solutions and Other Total
Revenue 50$ 1,373$ 572$ 62$ 2,057$
In Year Adjustments 887 83 19 - 989
Adjusted Base 937$ 1,457$ 591$ 62$ 3,045$
Organic Growth -% 1% 7% (18)% 2%

23
RECONCILIATION OF GAAP TO NON-GAAP
($ millions, unaudited)
2020 2019
Net earnings attributable to FIS common stockholders 15$ 148$
Provision (benefit) for income taxes (30) 32
Interest expense, net 80 75
Other, net 43 60
Operating income, as reported 108$ 315$
Depreciation and amortization, excluding purchase accounting amortization 230 195
Non-GAAP adjustments:
Purchase accounting amortization 684 173
Acquisition, integration and other costs 225 46
Adjusted EBITDA 1,247$ 729$
Three months ended
March 31,

24
RECONCILIATION OF GAAP TO NON-GAAP
($ millions, except per share amounts, unaudited)
2020 2019
Earnings (loss) before income taxes and equity method investment earnings (loss) (11)$ 188$
Provision (benefit) for income taxes (30) 32
Equity method investment earnings (loss) (1) (7)
Net (earnings) loss attributable to noncontrolling interest (3) (1)
Net earnings attributable to FIS common stockholders 15$ 148$
Non-GAAP adjustments:
Purchase accounting amortization 684 173
Acquisition, integration and other costs 225 100
Loss (gain) on sale of businesses and investments - 6
Non-operating (income) expense 39 -
Equity method investment (earnings) loss 1 7
Provision for income taxes on non-GAAP adjustments (162) (56)
Total non-GAAP adjustments 787$ 230$
Adjusted net earnings, net of tax 802$ 378$
Net earnings (loss) per share - diluted attributable to FIS common stockholders 0.02$ 0.45$
Non-GAAP adjustments:
Purchase accounting amortization 1.09 0.53
Acquisition, integration and other costs 0.36 0.31
Loss (gain) on sale of businesses and investments - 0.02
Non-operating (income) expense 0.06 -
Equity method investment (earnings) loss - 0.02
Provision for income taxes on non-GAAP adjustments (0.26) (0.17)
Adjusted net earnings per share - diluted attributable to FIS common stockholders 1.28$ 1.16$
Weighted average shares outstanding-diluted 625 326
Three months ended
March 31,
25
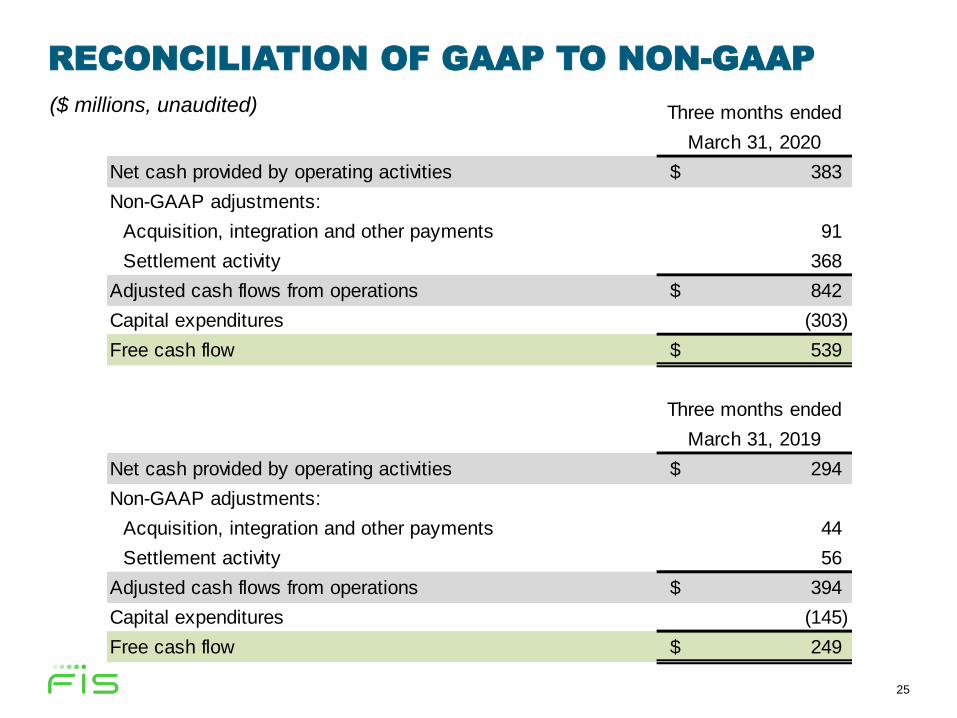
RECONCILIATION OF GAAP TO NON-GAAP
($ millions, unaudited) Three months ended
March 31, 2020
Net cash provided by operating activities 383$
Non-GAAP adjustments:
Acquisition, integration and other payments 91
Settlement activity 368
Adjusted cash flows from operations 842$
Capital expenditures (303)
Free cash flow 539$
Three months ended
March 31, 2019
Net cash provided by operating activities 294$
Non-GAAP adjustments:
Acquisition, integration and other payments 44
Settlement activity 56
Adjusted cash flows from operations 394$
Capital expenditures (145)
Free cash flow 249$
Recommended