May 11, 2009
First Quarter 2009Presentation Results
Juan LladóCEO
TEC
NIC
AS
REU
NID
AS
TEC
NIC
AS
REU
NID
AS
11
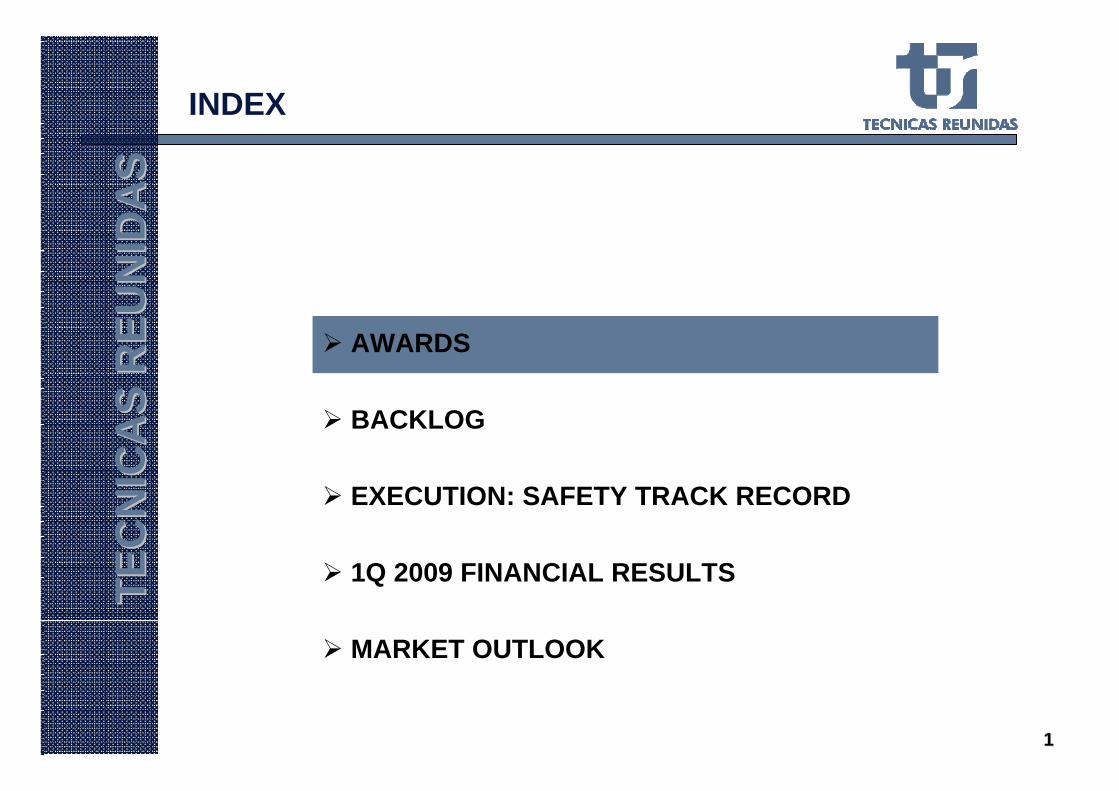
AWARDS
BACKLOG
EXECUTION: SAFETY TRACK RECORD
1Q 2009 FINANCIAL RESULTS
MARKET OUTLOOK
TEC
NIC
AS
REU
NID
AS
TEC
NIC
AS
REU
NID
AS
INDEX
22
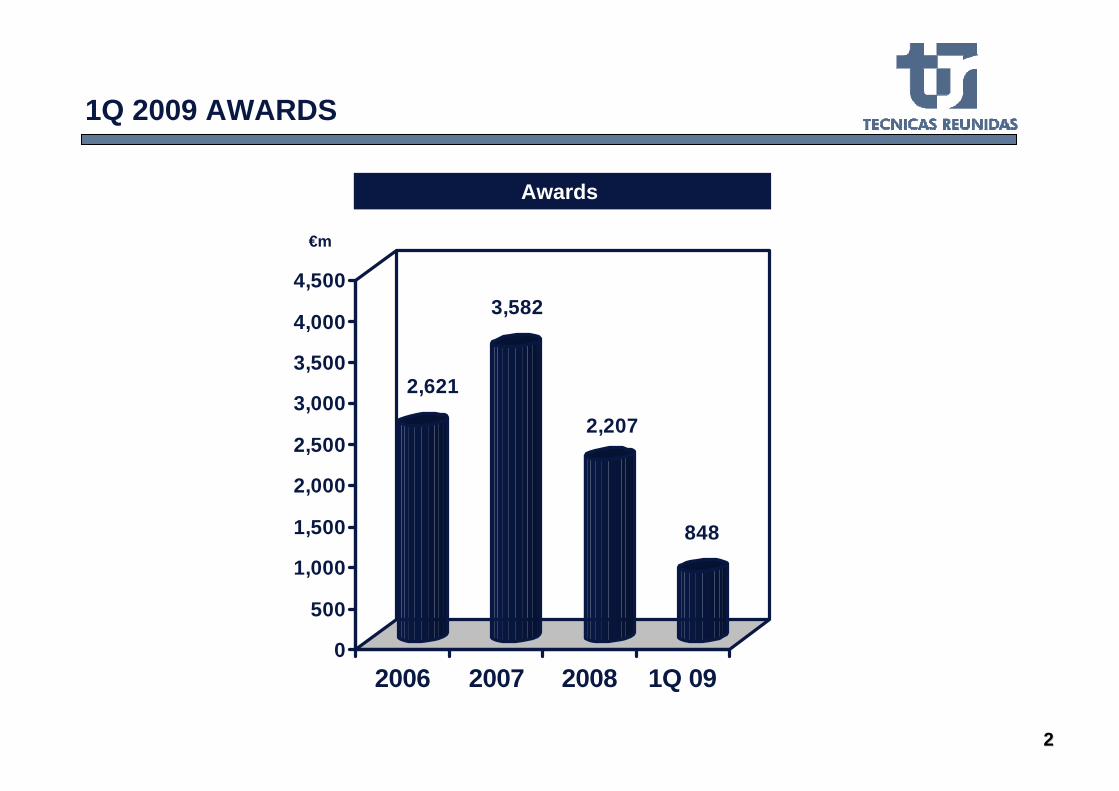
Awards
€m
1Q 2009 AWARDS
2,621
3,582
2,207
848
0
500
1,000
1,500
2,000
2,500
3,000
3,500
4,000
4,500
2006 2007 2008 1Q 09
33
1Q 2009 AWARDS
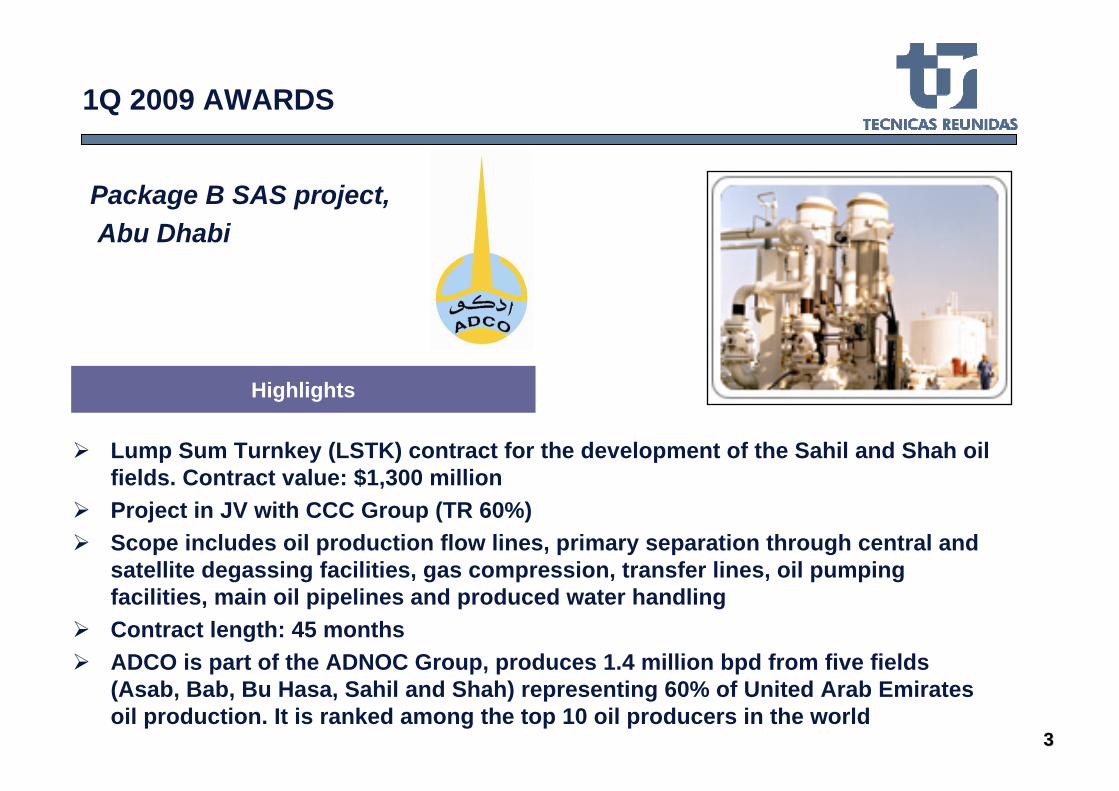
Lump Sum Turnkey (LSTK) contract for the development of the Sahil and Shah oil fields. Contract value: $1,300 millionProject in JV with CCC Group (TR 60%)Scope includes oil production flow lines, primary separation through central and satellite degassing facilities, gas compression, transfer lines, oil pumping facilities, main oil pipelines and produced water handlingContract length: 45 monthsADCO is part of the ADNOC Group, produces 1.4 million bpd from five fields (Asab, Bab, Bu Hasa, Sahil and Shah) representing 60% of United Arab Emirates oil production. It is ranked among the top 10 oil producers in the world
Highlights
Package B SAS project,Abu Dhabi
44
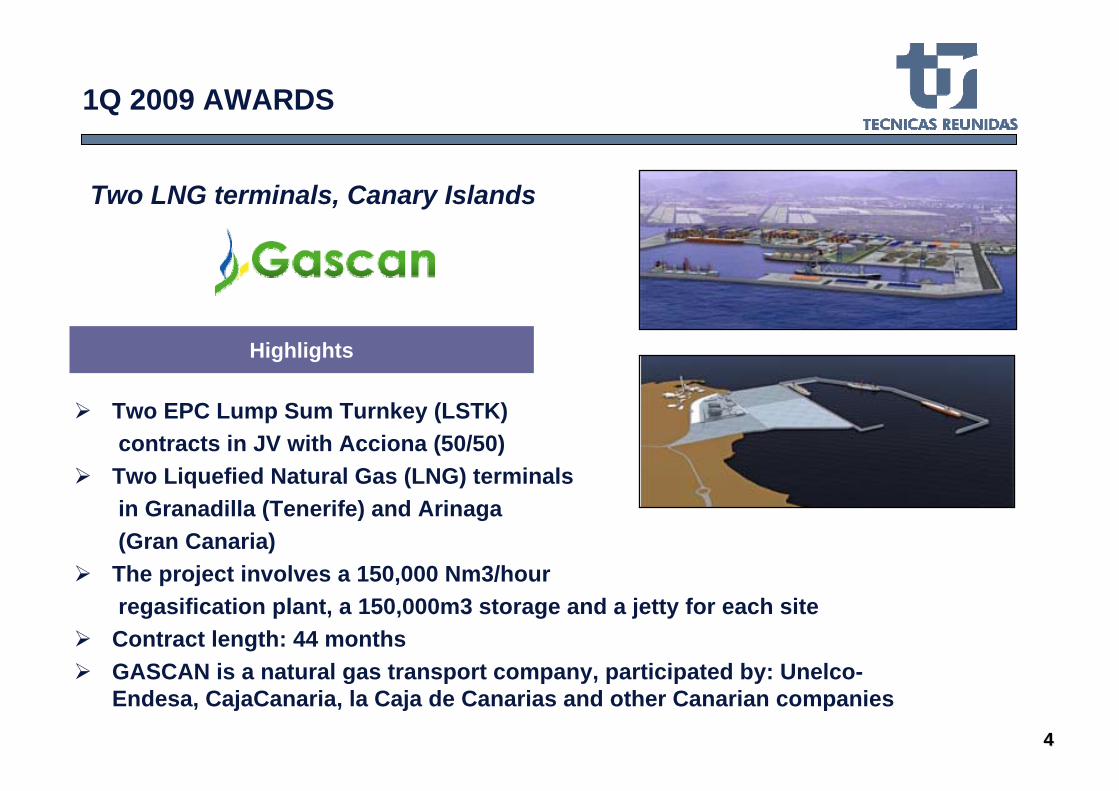
Two EPC Lump Sum Turnkey (LSTK)contracts in JV with Acciona (50/50)
Two Liquefied Natural Gas (LNG) terminalsin Granadilla (Tenerife) and Arinaga(Gran Canaria)
The project involves a 150,000 Nm3/hourregasification plant, a 150,000m3 storage and a jetty for each site
Contract length: 44 monthsGASCAN is a natural gas transport company, participated by: Unelco-Endesa, CajaCanaria, la Caja de Canarias and other Canarian companies
Highlights
Two LNG terminals, Canary Islands
1Q 2009 AWARDS
55
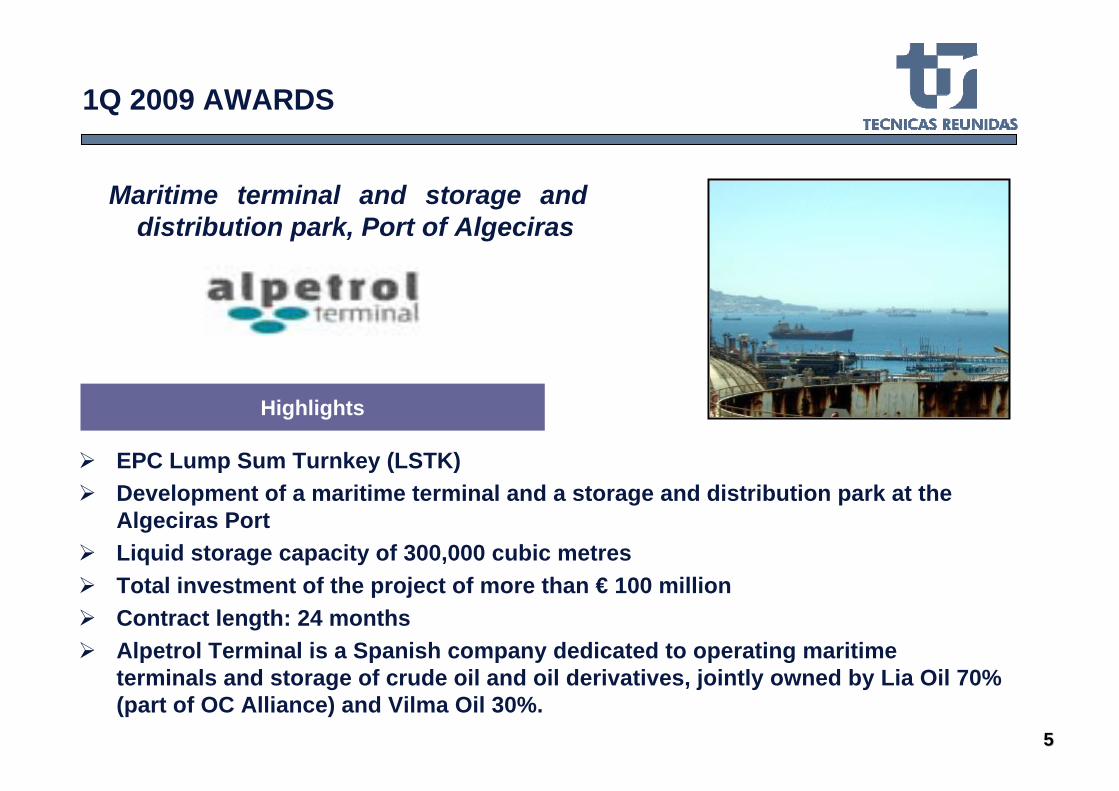
EPC Lump Sum Turnkey (LSTK)Development of a maritime terminal and a storage and distribution park at the Algeciras PortLiquid storage capacity of 300,000 cubic metresTotal investment of the project of more than € 100 millionContract length: 24 monthsAlpetrol Terminal is a Spanish company dedicated to operating maritime terminals and storage of crude oil and oil derivatives, jointly owned by Lia Oil 70% (part of OC Alliance) and Vilma Oil 30%.
1Q 2009 AWARDS
Highlights
Maritime terminal and storage and distribution park, Port of Algeciras
66
AWARDS
BACKLOG
EXECUTION: SAFETY TRACK RECORD
1Q 2009 FINANCIAL RESULTS
MARKET OUTLOOK
TEC
NIC
AS
REU
NID
AS
TEC
NIC
AS
REU
NID
AS
77
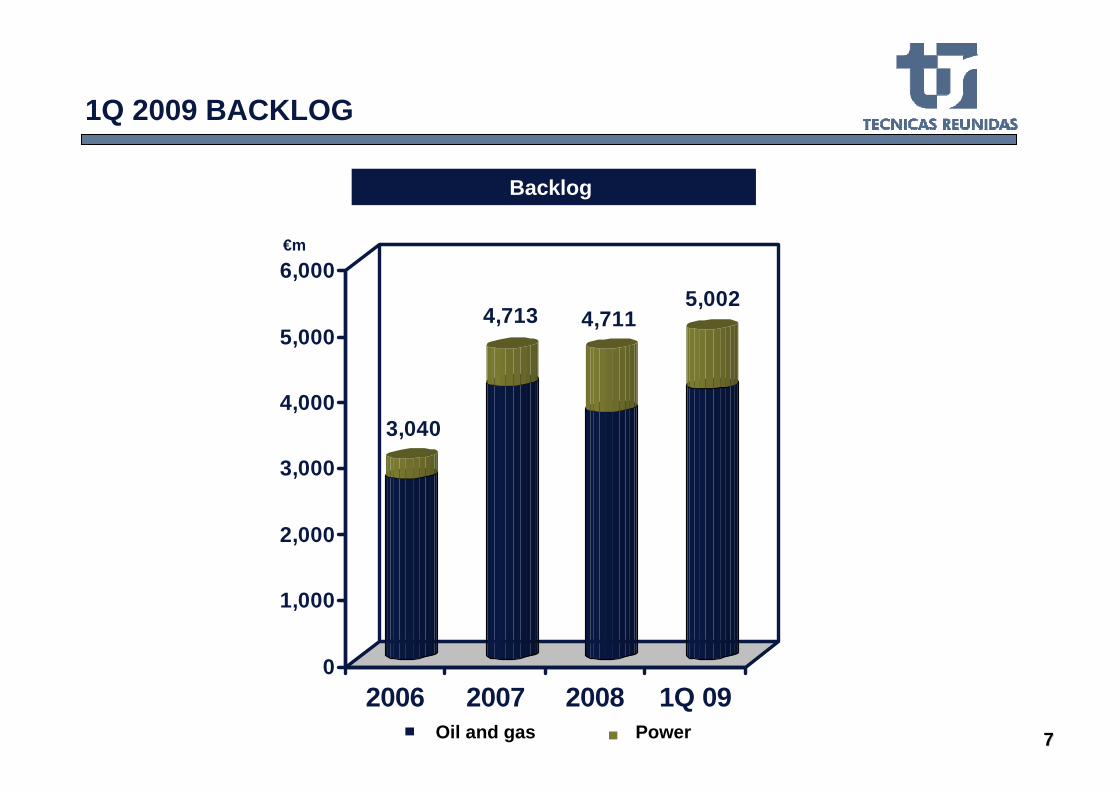
1Q 2009 BACKLOG
Backlog
€m
Oil and gas Power
3,040
4,713 4,7115,002
0
1,000
2,000
3,000
4,000
5,000
6,000
2006 2007 2008 1Q 09
88
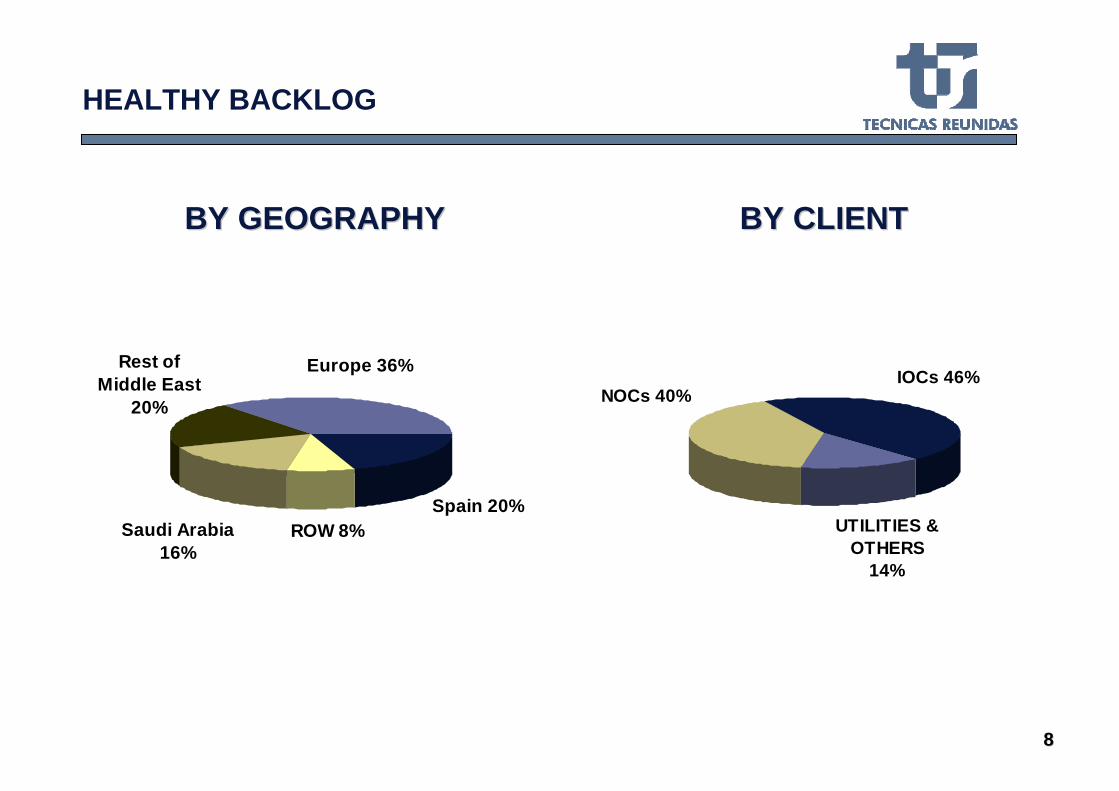
HEALTHY BACKLOG
Spain 20%ROW 8%
Europe 36%Rest of Middle East
20%
Saudi Arabia 16%
BY CLIENTBY CLIENTBY GEOGRAPHYBY GEOGRAPHY
UTILITIES & OTHERS
14%
IOCs 46%NOCs 40%
99
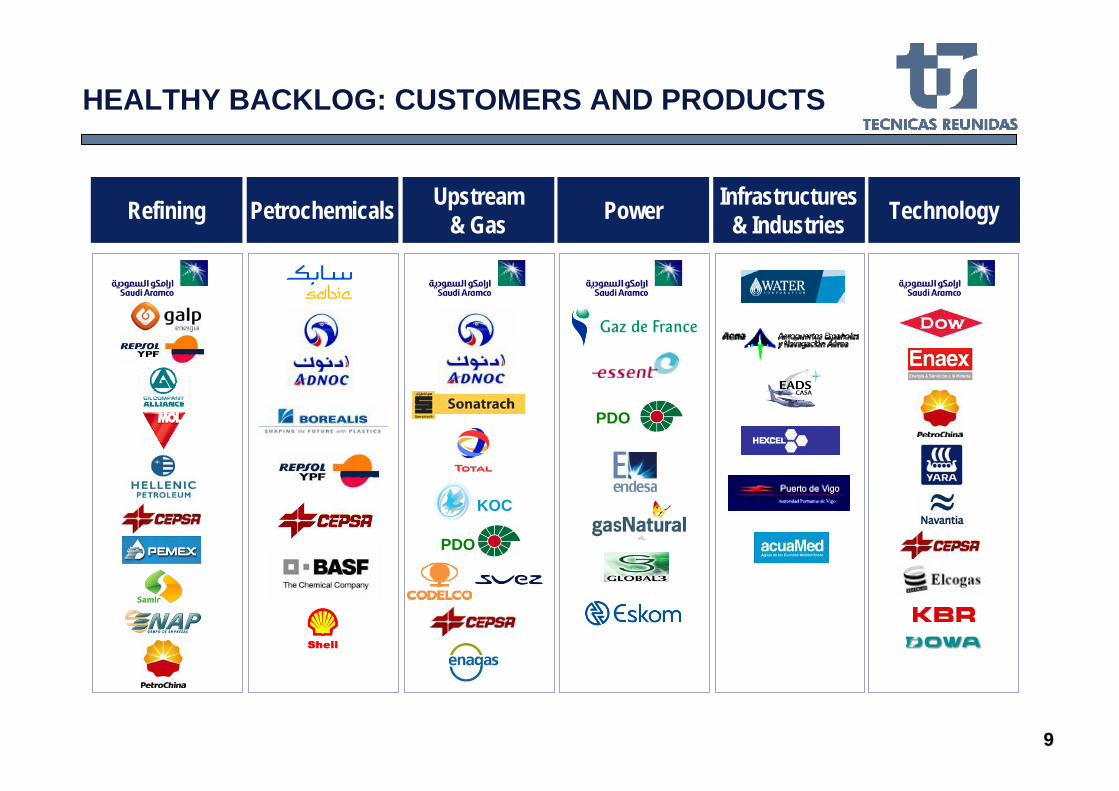
HEALTHY BACKLOG: CUSTOMERS AND PRODUCTS
Refining Petrochemicals Upstream& Gas Power Infrastructures
& Industries Technology
KOC
PDO
PDO
1010
AWARDS
BACKLOG
EXECUTION: SAFETY TRACK RECORD
1Q 2009 FINANCIAL RESULTS
MARKET OUTLOOK
TEC
NIC
AS
REU
NID
AS
TEC
NIC
AS
REU
NID
AS
1111
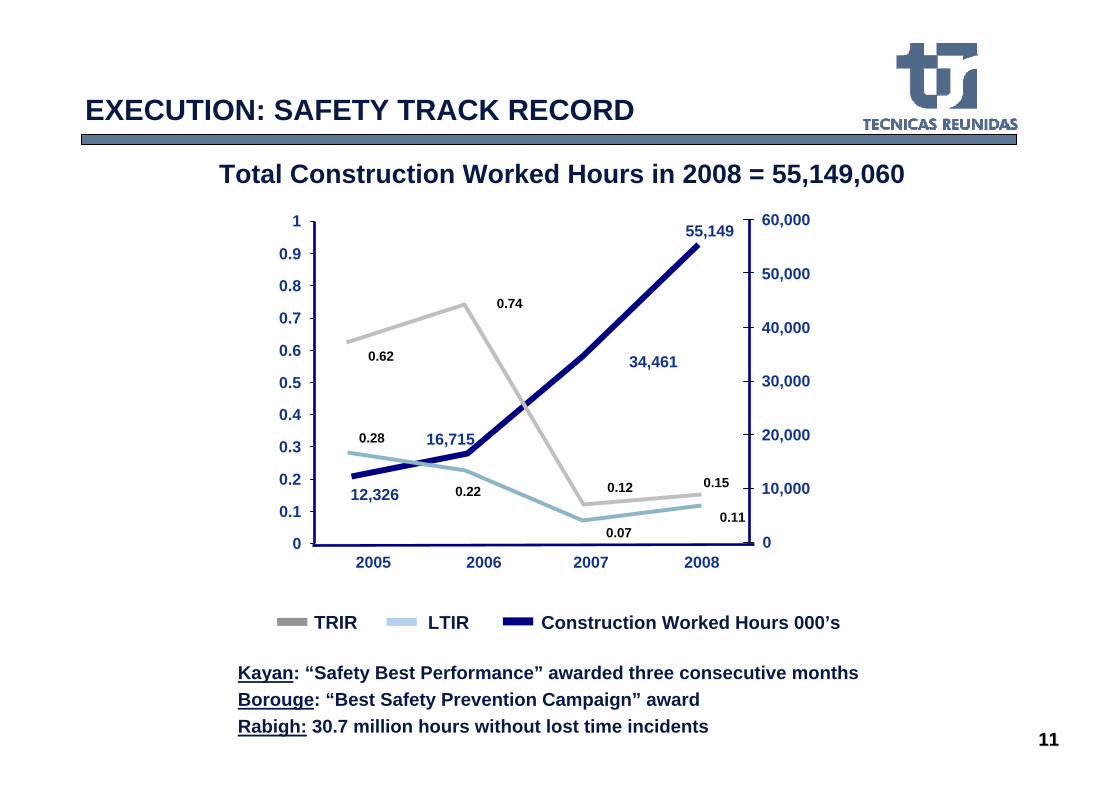
Kayan: “Safety Best Performance” awarded three consecutive monthsBorouge: “Best Safety Prevention Campaign” awardRabigh: 30.7 million hours without lost time incidents
EXECUTION: SAFETY TRACK RECORD
Total Construction Worked Hours in 2008 = 55,149,060
TRIR LTIR Construction Worked Hours 000’s
0
60,000
50,000
40,000
30,000
20,000
10,000
1
0.9
0.8
0.7
0.6
0.5
0.4
0.3
0.2
0.1
02005 2006 2007 2008
12,326
16,715
34,461
55,149
0.62
0.74
0.12 0.15
0.28
0.22
0.070.11
1212
AWARDS
BACKLOG
EXECUTION: SAFETY TRACK RECORD
1Q 2009 FINANCIAL RESULTS
MARKET OUTLOOK
TEC
NIC
AS
REU
NID
AS
TEC
NIC
AS
REU
NID
AS
1313
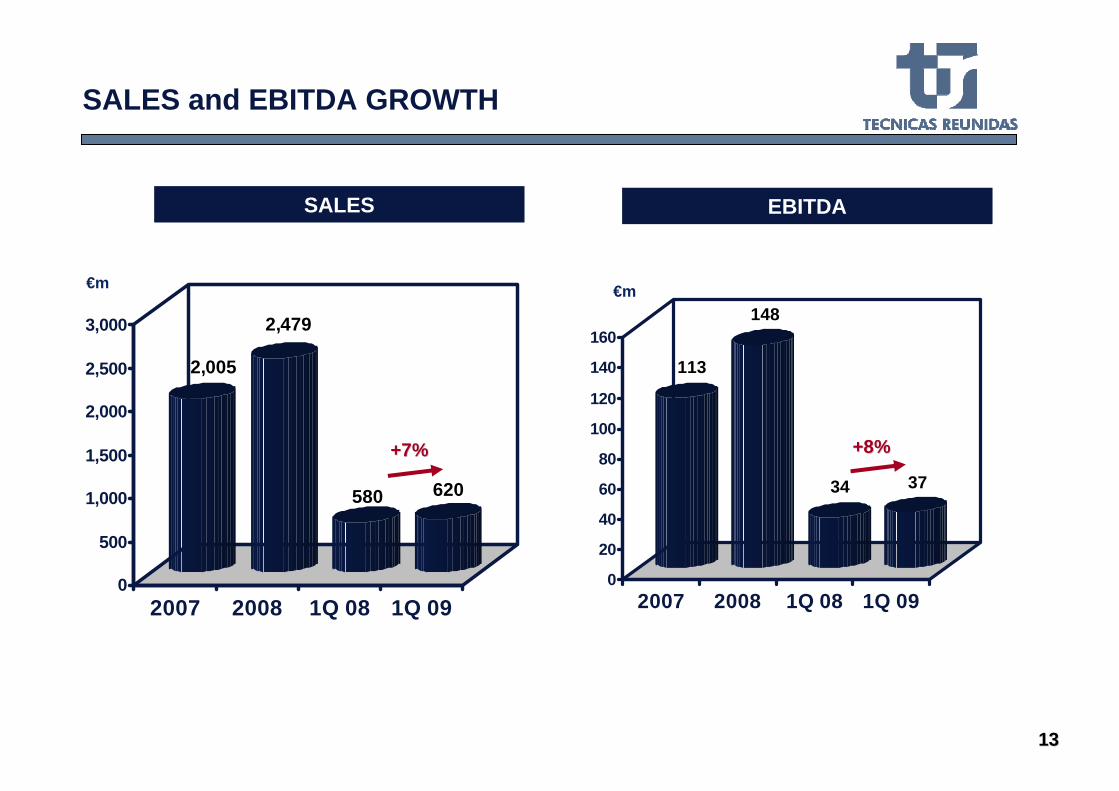
SALES and EBITDA GROWTH
2,005
2,479
580 620
0
500
1,000
1,500
2,000
2,500
3,000
2007 2008 1Q 08 1Q 09
SALES
€m
EBITDA
€m
113
148
34 37
0
20
40
60
80
100
120
140
160
2007 2008 1Q 08 1Q 09
+7%+7% +8%+8%
1414
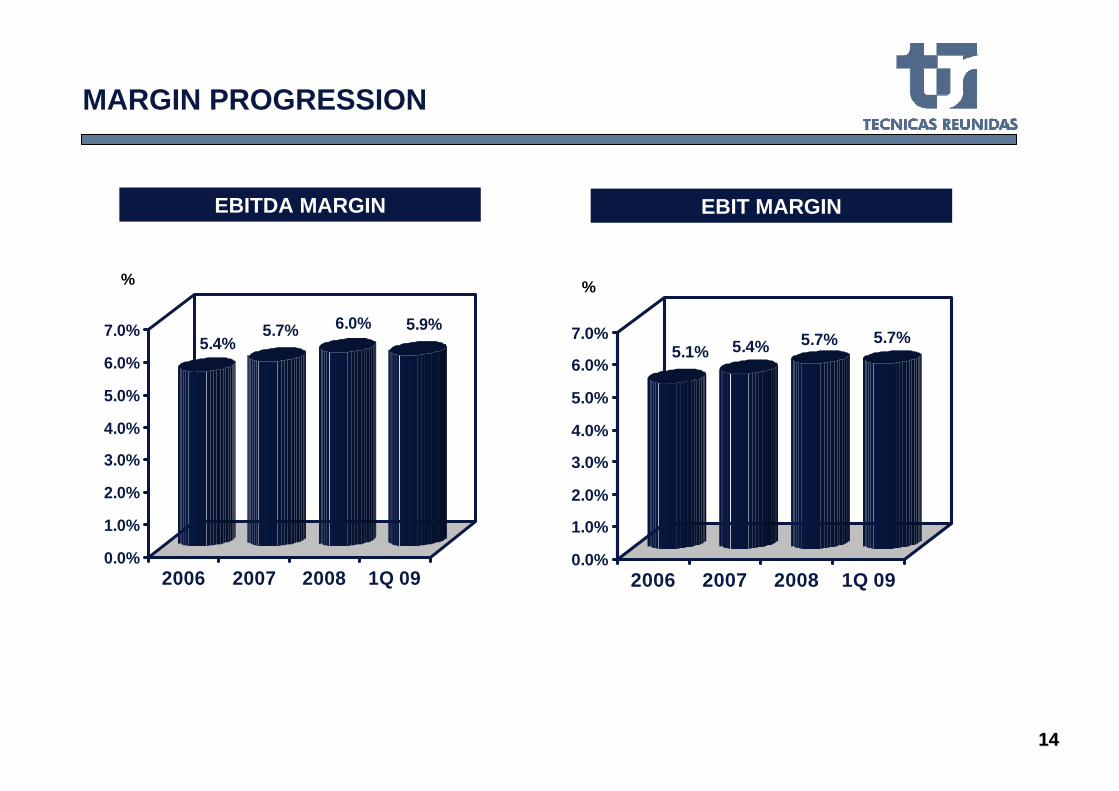
MARGIN PROGRESSION
5.4%5.7% 6.0% 5.9%
0.0%
1.0%
2.0%
3.0%
4.0%
5.0%
6.0%
7.0%
2006 2007 2008 1Q 09
EBITDA MARGIN
%
EBIT MARGIN
%
5.1% 5.4% 5.7% 5.7%
0.0%
1.0%
2.0%
3.0%
4.0%
5.0%
6.0%
7.0%
2006 2007 2008 1Q 09
1515
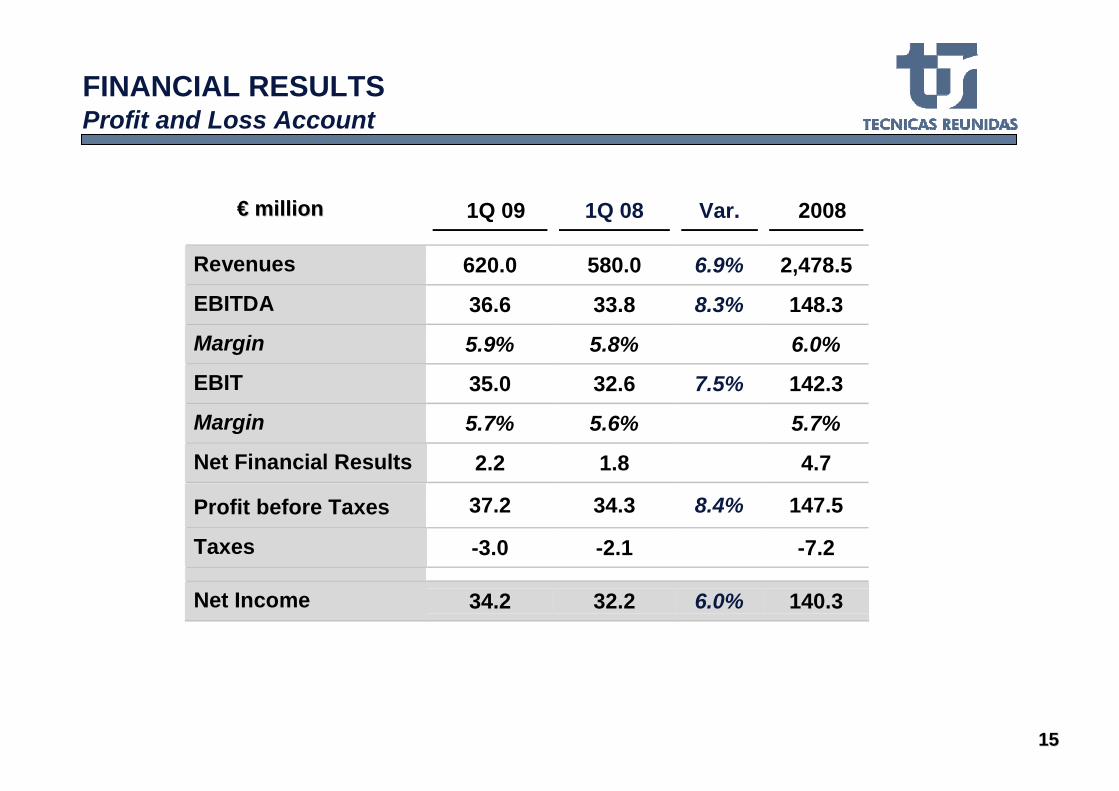
FINANCIAL RESULTSProfit and Loss Account
1Q 09 1Q 08 Var. 2008
Revenues 620.0 580.0 6.9% 2,478.5
EBITDA 36.6 33.8 8.3% 148.3
Margin 5.9% 5.8% 6.0%
EBIT 35.0 32.6 7.5% 142.3
Margin 5.7% 5.6% 5.7%
Net Financial Results 2.2 1.8 4.7
Profit before Taxes 37.2 34.3 8.4% 147.5
Taxes -3.0 -2.1 -7.2
Net Income 34.2 32.2 6.0% 140.3
€€ millionmillion
1616
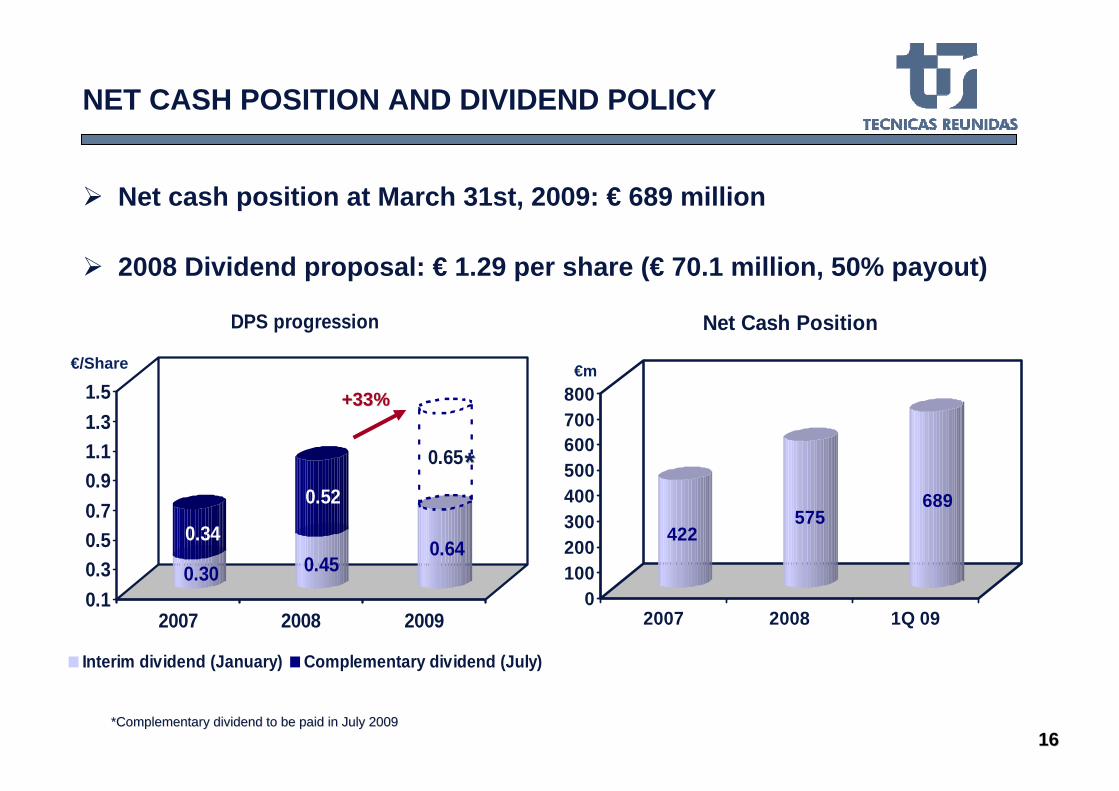
NET CASH POSITION AND DIVIDEND POLICY
422575
689
0100200300400500600700800
2007 2008 1Q 09
Net Cash Position
0.30
0.340.45
0.52
0.64
0.65
0.10.30.50.70.91.11.31.5
2007 2008 2009
DPS progression
Interim dividend (January) Complementary dividend (July)
+33%+33%€m€/Share
**ComplementaryComplementary dividenddividend toto be be paidpaid in July 2009in July 2009
**
Net cash position at March 31st, 2009: € 689 million
2008 Dividend proposal: € 1.29 per share (€ 70.1 million, 50% payout)
1717
AWARDS
BACKLOG
EXECUTION: SAFETY TRACKRECORD
1Q 2009 FINANCIAL RESULTS
MARKET OUTLOOK
TEC
NIC
AS
REU
NID
AS
TEC
NIC
AS
REU
NID
AS
1818
MARKET OUTLOOK: Facing the crisis from a strong base
Overhead cost control
Mantaining a variable cost structure
Efficient procurement to lower costs for our clients
Adapting to customer needs
FACING THE CRISIS FACING THE CRISIS ……
1919
MARKET OUTLOOK: Facing the crisis from a strong base
Healthy backlog with projects that span until 2012
Expanded client base that allows access to a larger share of themarket
Large and diversified bidding pipeline in:
RefiningUpstream & GasPower
Execution under less stressed conditions
Strong Balance Sheet position
…… FROM A STRONG BASEFROM A STRONG BASE
2020
Disclaimer
This document has been prepared by Tecnicas Reunidas S.A. (the Company) solely for use at presentations held in connection with the announcement of the Company's results for the first quarter of 2009.
This document contains forward-looking statements of the Company and/or its management. These forward-looking statements such as statements relating to the Company's or management's intent belief or current expectations of the future growth in the Company's business and capital expenditure in the oil and gas industry in general are subject to risks and variables that are beyond the Company's control and that could materially and adversely affect the outcome and financial effects of the facts expressed implied or projected herein.
The Company is under no obligation to update or keep current the information contained in this presentation including any looking forward-statements or to correct any inaccuracies that may later become apparent.
No representation or warranty express or implied is made as to and no reliance should be placed on the fairness accuracy completeness or correctness of the information or opinions contained herein. None of the Company or any of its affiliates advisors or representatives shall have any liability whatsoever for any loss arising from any use of this document or its contents or otherwise arising in connection with this document.
This document is only provided for information purposes and does not constitute nor may it be interpreted as an offer to sell or exchange or acquire or solicitation for offers to purchase any share in the Company. Any decision to buy or invest in shares in relation to a specific issue must be made on the basis of the information contained in the relevant prospectus filed by the Company in relation to such specific issue.
Recommended