Financing the U.S. Trade Deficit
James K. Jackson
Specialist in International Trade and Finance
October 7, 2016
Congressional Research Service
7-5700
www.crs.gov
RL33274

Financing the U.S. Trade Deficit
Congressional Research Service
Summary The U.S. merchandise trade deficit is a part of the overall U.S. balance of payments, a summary
statement of all economic transactions between the residents of the United States and the rest of
the world, during a given period of time. Some Members of Congress and other observers have
grown concerned over the magnitude of the U.S. merchandise trade deficit and the associated
increase in U.S. dollar-denominated assets owned by foreigners. International trade recovered
from the global financial crisis of 2008-2009 and the subsequent slowdown in global economic
activity that reduced global trade flows and, consequently, reduced the size of the U.S. trade
deficit. Now, however, U.S. exporters face new challenges with an increase in the international
exchange value of the dollar relative to other key currencies and the slow rate of economic
growth in important export markets in Europe and Asia. This report provides an overview of the
U.S. balance of payments, an explanation of the broader role of capital flows in the U.S.
economy, an explanation of how the country finances its trade deficit or a trade surplus, and the
implications for Congress and the country of the large inflows of capital from abroad. The major
observations indicate that
The current account balance, the broadest measure of U.S. trade in goods,
services, and certain income flows, worsened by 18% in 2015 from that recorded
in 2014. Foreign-owned assets in the United States continued to outpace U.S.
ownership of foreign assets, reflecting the deficit in the current account, but the
net amount, or the difference between U.S.-acquisition of foreign assets and
foreign acquisition of U.S. assets, dropped by about one-third in 2015 compared
with 2014 and down by over half since 2012. The relative decline in foreign
acquisitions of U.S. assets in 2015 reflected a drop in the net private purchases of
U.S. corporate stocks and a decline by one-third in net private purchases of U.S.
treasury securities. In addition, foreign official purchases of U.S. portfolio
purchases shifted from positive net purchases in 2014 to negative net purchases
in 2015, including a 38% decline in purchases of corporate stocks and a 58%
decline in official purchases of U.S. Treasury securities. Foreign private net
purchases of U.S. Treasury securities in 2015 fell by one-third from those in
2014, but foreign private purchases of U.S. equities increased by 20% in 2015
compared with 2014. At the same time, foreign direct investment increased by
83% in 2015 compared with 2014, rising from $207 billion in 2014 to $379
billion in 2015; U.S. direct investment abroad in 2015 rose slightly above the
amount invested in 2014, although U.S. net purchases of foreign equities and
debt securities in 2015 fell by 75%, compared with net purchases in 2014. The
inflow of capital from abroad supplements domestic sources of capital and likely
allows the United States to maintain its current level of economic activity at
interest rates that are below the level they likely would be without the capital
inflows.
Foreign official and private acquisitions of dollar-denominated assets likely will
generate a stream of returns to overseas investors that would have stayed in the
U.S. economy and supplemented other domestic sources of capital had the assets
not been acquired by foreign investors. In general terms, foreign private holders
of U.S. Treasury securities are taxed on their interest income, depending on U.S.
tax conventions with other countries.
Financing the U.S. Trade Deficit
Congressional Research Service
Contents
Background ..................................................................................................................................... 1
Capital Flows and the Dollar ........................................................................................................... 1
The U.S. Balance of Payments ........................................................................................................ 5
The U.S. Net International Investment Position ............................................................................ 14
Implications ................................................................................................................................... 19
Figures
Figure 1. Foreign Exchange and Interest Rate Derivatives Turnover in April of the Year
Indicated ....................................................................................................................................... 4
Figure 2. Share of Foreign Exchange turnover by Currency, April 2016 ........................................ 5
Figure 3. Foreign Private and Official Purchases of U.S. Treasury Securities, 2007-2015 ........... 11
Figure 4. Net Inflows of Private and Official Sources of Capital, 2007-2015 .............................. 12
Figure 5. Foreign Official and Private Investment Positions
in the United States, 1994-2015 ................................................................................................. 18
Figure 6. U.S. and Foreign Investment Position, By Major Component, 2015 ............................. 19
Tables
Table 1. Selected Indicators of the Size of the Global Capital Markets, 2013 ................................ 2
Table 2. U.S. International Transactions, Selected Accounts .......................................................... 6
Table 3. Summary of the Net Balances by Major Accounts in the U.S. Balance
of Payments .................................................................................................................................. 9
Table 4. Net Foreign Purchases of Long-Term U.S. Securities ..................................................... 12
Table 5. U.S. Net International Investment Position ..................................................................... 15
Contacts
Author Contact Information .......................................................................................................... 20

Financing the U.S. Trade Deficit
Congressional Research Service 1
Background By standard convention, the balance of payments accounts are based on a double-entry
bookkeeping system. As a result, each transaction entered as a credit must have a corresponding
debit and vice versa. This means that a surplus or deficit in one part of the accounts necessarily
will be offset by a deficit or surplus, respectively, in another account so that, overall, the accounts
are in balance. This convention also means that a deficit in one account, such as the merchandise
trade account, is not necessarily the same as a debt.1 The trade deficit can become a debt
equivalent depending on how the deficit is financed and the expectations of those who hold the
offsetting dollar-denominated U.S. assets. The balance of payments accounts are divided into
three main sections: the current account, which includes the exports and imports of goods and
services and personal and government transfer payments; the capital account, which includes
such capital transfers as international debt forgiveness; and the financial account, which includes
official transactions in financial assets and private transactions in financial assets and direct
investment in businesses and real estate. In these accounts, exports are recorded as a positive
amount even though they represent an outflow of goods and services from the economy, because
they represent a credit for which there is a specific obligation of repayment. Similarly, although
imports represent an inflow of goods and services to the economy, they are recorded as a negative
amount, because they represent a debt that must be repaid.
When the basic structure of the balance of payments was established, merchandise trade
transactions dominated the accounts. Financial transactions recorded in the capital accounts
generally reflected the payments and receipts of funds that corresponded to the importing and
exporting of goods and services. As a result, the capital accounts generally represented
“accommodating” transactions, or financial transactions associated directly with the buying and
selling of goods and services. During this early period, exchange rates between currencies were
fixed, and private capital flows, such as foreign investment, were heavily regulated so that nearly
all international flows of funds were associated with merchandise trade transactions and with
some limited government transactions.
Since the 1970s, however, private capital flows have grown markedly as countries have
liberalized their rules governing overseas investing and as nations have adopted a system of
floating exchange rates, where the rates are set by market forces. Floating exchange rates have
spurred demand for the dollar. The dollar also is sought for investment purposes as it has become
a vehicle itself for investment and speculation and it serves as a major trade invoicing currency.
This means that the balance of payments records not only the accommodating flows of capital
which correspond to imports and exports of goods and services, but also autonomous flows of
capital that are induced by a broad range of economic factors that are unrelated directly to the
trading of merchandise goods.
Capital Flows and the Dollar Liberalized capital flows and floating exchange rates have greatly expanded the amount of
autonomous capital flows between countries. These capital transactions are undertaken in
response to commercial incentives or political considerations that are independent of the overall
balance of payments or of particular accounts. As a result of these transactions, national
1 For additional information about the causes of the U.S. trade deficit, see CRS Report RL31032, The U.S. Trade
Deficit: Causes, Consequences, and Policy Options, by Craig K. Elwell.

Financing the U.S. Trade Deficit
Congressional Research Service 2
economies have become more closely linked, the process some refer to as “globalization.” The
data in Table 1 provide selected indicators of the relative sizes of the various capital markets in
various countries and regions and the relative importance of international foreign exchange
markets. In 2013, these markets amounted to over $900 trillion, or more than 50 times the size of
the U.S. economy. Worldwide, foreign exchange and interest rate derivatives, which are the most
widely used hedges against movements in currencies, were valued at $655 trillion in 2013, more
than twice the size of the combined total of all public and private bonds, equities, and bank assets.
For the United States, such derivatives total more than three times as much as all U.S. bonds,
equities, and bank assets.
Table 1. Selected Indicators of the Size of the Global Capital Markets, 2013
(billions of dollars)
Gross
Domestic
Product
(GDP)
Total
Official
Reserves
Bonds, Equities, and Bank Assets Exchange Market Derivatives
Total
Stock Market
Capitalization
Debt
Securities
Bank
Assets Total
OTC
Foreign
Exchange
Derivatives
OTC
Interest
Rate
Derivatives
World $75,470.9 $12,127.7 $286,584.7 $62,552.0 $97,288.6 $126,744.1 $655,352 $70,553 $584,799
European
Union
16,705.2 570.0 91,326.4 12,646.3 29,964.2 48,715.9 NA NA NA
Euro
Area
13,109.7 331.0 66,100.7 7,539.2 22,461.4 36,100.2 266,845 25,177 241,668
United
Kingdom
2,680.1 92.4 20,207.1 4,035.4 5,750.6 10,421.2 61,415 8,789 52,626
United
States
16,768.1 133.5 72,695.5 22,280.7 34,494.3 15,920.5 234,401 61,019 173,382
Japan 4,919.6 1,237.2 28,359.7 4,599.3 12,260.7 11,499.7 66,673 14,122 52,551
Emerging
markets
29,104.8 7,984.4 56,384.1 11,232.7 11,225.1 33,926.3 NA NA NA
Source: Global Financial Stability Report, International Monetary Fund, April 2015. Statistical Appendix, Table 1;
Quarterly Review, Bank for International Settlements, March, 2015, Tables 20b and 21b.
Note: “Total derivatives” does not include equity and commodity-linked derivatives. April 2015 was the last
time the IMF published these data.
Another aspect of capital mobility and capital inflows is the impact such capital flows have on the
international exchange value of the dollar. Demand for U.S. assets, such as financial securities,
translates into demand for the dollar, since U.S. securities are denominated in dollars. As demand
for the dollar rises or falls according to overall demand for dollar-denominated assets, the value
of the dollar changes. These exchange rate changes, in turn, have secondary effects on the prices
of U.S. and foreign goods, which tend to alter the U.S. trade balance. At times, foreign
governments intervene in international capital markets to acquire the dollar directly or to acquire
Treasury securities in order to strengthen the value of the dollar against particular currencies. In
addition, various central banks moved aggressively following the Asian financial crisis in the
1990s to bolster their holdings of dollars in order to use the dollars to support their currencies
should the need arise.
The dollar is also heavily traded in financial markets around the globe and, at times, plays the role
of a global currency. Disruptions in this role have important implications for the United States
and for the smooth functioning of the international financial system. During the decade preceding
Financing the U.S. Trade Deficit
Congressional Research Service 3
the recent global financial crisis, banks and other financial institutions expanded their global
balance sheets from $10 trillion in 2000 to $34 trillion in 2007. These assets were comprised
primarily of dollar-denominated claims on non-bank entities, including retail and corporate
lending, loans to hedge funds, and holdings of structured finance products based on U.S.
mortgages and other underlying assets. As the crisis unfolded, the short-term dollar funding
markets served as a major conduit through which financial distress was transmitted across
financial markets and national borders, according to analysts with the Bank for International
Settlements (BIS).2 When these short-term dollar funding markets collapsed in the early stages of
the crises, the U.S. Federal Reserve engaged in extraordinary measures, including a vast system
of currency swap arrangements with central banks around the world, to supply nearly $300
billion. After initially expanding the then-existing reciprocal currency arrangements (swap lines)
with the European Central Bank, the Bank of England, the Swiss National Bank, and the Bank of
Japan, the Federal Reserve made an unprecedented announcement in October 2008 that it would
provide swap lines to “accommodate whatever quantity of U.S. dollar funding is necessary” to
stem the dollar shortage.3 At the same time, the U.S. Treasury announced a money market
guarantee program to stop the withdrawal of funds from the money markets and to offset the
withdrawals by providing public funds.
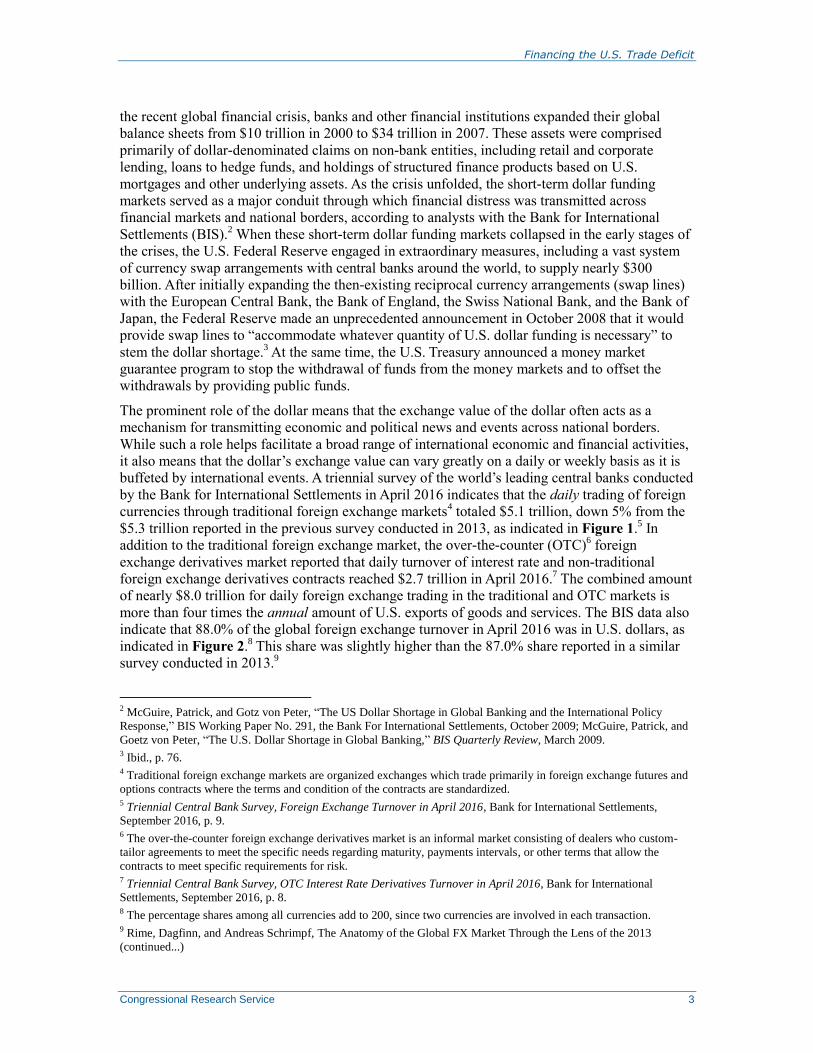
The prominent role of the dollar means that the exchange value of the dollar often acts as a
mechanism for transmitting economic and political news and events across national borders.
While such a role helps facilitate a broad range of international economic and financial activities,
it also means that the dollar’s exchange value can vary greatly on a daily or weekly basis as it is
buffeted by international events. A triennial survey of the world’s leading central banks conducted
by the Bank for International Settlements in April 2016 indicates that the daily trading of foreign
currencies through traditional foreign exchange markets4 totaled $5.1 trillion, down 5% from the
$5.3 trillion reported in the previous survey conducted in 2013, as indicated in Figure 1.5 In
addition to the traditional foreign exchange market, the over-the-counter (OTC)6 foreign
exchange derivatives market reported that daily turnover of interest rate and non-traditional
foreign exchange derivatives contracts reached $2.7 trillion in April 2016.7 The combined amount
of nearly $8.0 trillion for daily foreign exchange trading in the traditional and OTC markets is
more than four times the annual amount of U.S. exports of goods and services. The BIS data also
indicate that 88.0% of the global foreign exchange turnover in April 2016 was in U.S. dollars, as
indicated in Figure 2.8 This share was slightly higher than the 87.0% share reported in a similar
survey conducted in 2013.9
2 McGuire, Patrick, and Gotz von Peter, “The US Dollar Shortage in Global Banking and the International Policy
Response,” BIS Working Paper No. 291, the Bank For International Settlements, October 2009; McGuire, Patrick, and
Goetz von Peter, “The U.S. Dollar Shortage in Global Banking,” BIS Quarterly Review, March 2009. 3 Ibid., p. 76. 4 Traditional foreign exchange markets are organized exchanges which trade primarily in foreign exchange futures and
options contracts where the terms and condition of the contracts are standardized. 5 Triennial Central Bank Survey, Foreign Exchange Turnover in April 2016, Bank for International Settlements,
September 2016, p. 9. 6 The over-the-counter foreign exchange derivatives market is an informal market consisting of dealers who custom-
tailor agreements to meet the specific needs regarding maturity, payments intervals, or other terms that allow the
contracts to meet specific requirements for risk. 7 Triennial Central Bank Survey, OTC Interest Rate Derivatives Turnover in April 2016, Bank for International
Settlements, September 2016, p. 8. 8 The percentage shares among all currencies add to 200, since two currencies are involved in each transaction. 9 Rime, Dagfinn, and Andreas Schrimpf, The Anatomy of the Global FX Market Through the Lens of the 2013
(continued...)

Financing the U.S. Trade Deficit
Congressional Research Service 4
Figure 1. Foreign Exchange and Interest Rate Derivatives Turnover in April of the
Year Indicated
(billions of U.S. dollars)
Source: Bank for International Settlements.
(...continued)
Triennial Survey, Quarterly Review, Bank for International Settlements, December 2013.

Financing the U.S. Trade Deficit
Congressional Research Service 5
Figure 2. Share of Foreign Exchange turnover by Currency, April 2016
(percent shares)
Source: Bank for International Settlements.
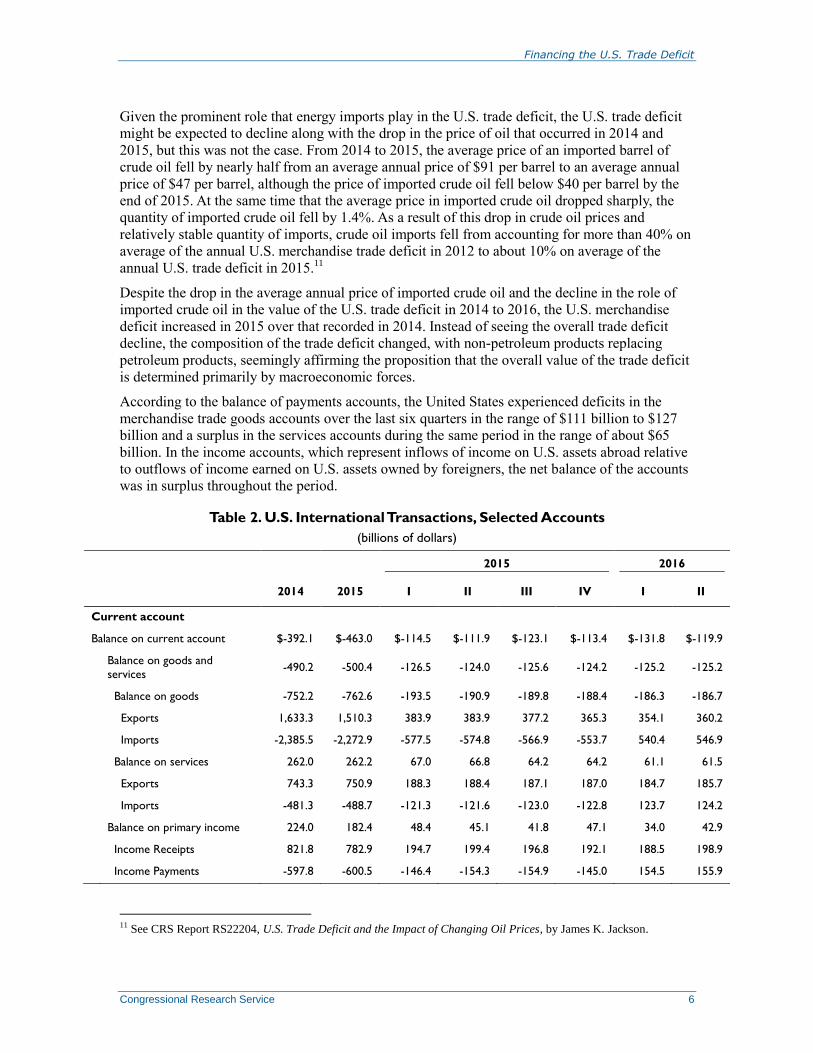
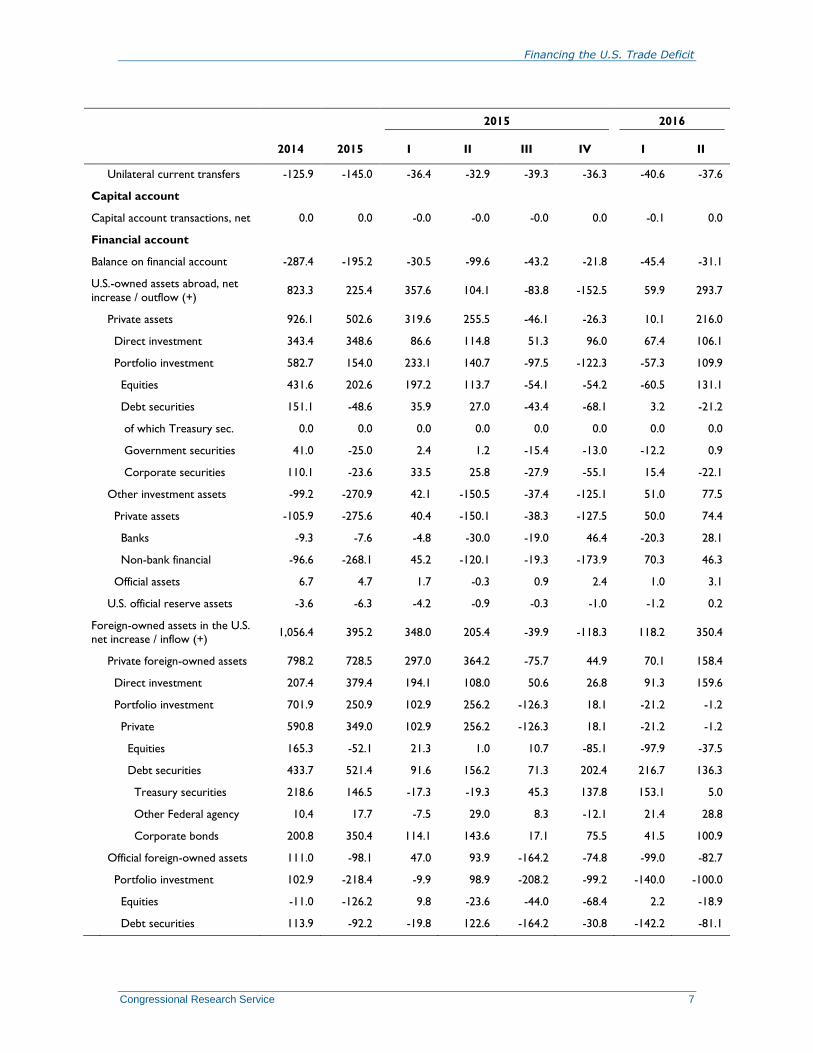
The U.S. Balance of Payments Table 2 presents a summary of the major accounts in the U.S. balance of payments over the four
quarters of 2015 and the first two quarters of 2016. The data indicate that throughout the period,
the U.S. current account, or the balance of exports and imports of goods, services and transfers,
was in deficit, or the United States imported more goods and services than it exported. The
current account balance represents the broadest measure of U.S. trade in goods, services, and
certain income flows. The balance worsened by 16% from 2014 to 2015. On a quarterly basis, the
deficit in the current account has varied from quarter to quarter, although remaining negative,
reflecting a broad range of economic activities.
Most economists argue that, given the current composition of the U.S. economy, foreign capital
inflows play an important role by bridging the gap between domestic supplies of and demand for
capital, or between the total amount of saving in the economy relative to the total amount of
investment. Indeed, economists generally argue that it is this interplay between the demand for
and the supply of credit in the economy, rather than the flow of manufactured goods and services,
that drives the broad inflows and outflows of capital and serves as the major factor in determining
the international exchange value of the dollar and, therefore, the overall size of the nation’s trade
deficit or surplus. Capital inflows, in turn, place upward pressure on the dollar’s exchange rate,
pushing the exchange value of the dollar up relative to other currencies. As the dollar rises in
value, the price of U.S. exports rises and the price of imports falls, which tends to increase the
current account deficit.10
The import role capital flows play in determining the overall trade balance is demonstrated in the
recent changes that have occurred in the price of oil and its impact on the U.S. trade deficit.
10 CRS Report R44546, The Economic Effects of Trade: Overview and Policy Challenges, by James K. Jackson.
Financing the U.S. Trade Deficit
Congressional Research Service 6
Given the prominent role that energy imports play in the U.S. trade deficit, the U.S. trade deficit
might be expected to decline along with the drop in the price of oil that occurred in 2014 and
2015, but this was not the case. From 2014 to 2015, the average price of an imported barrel of
crude oil fell by nearly half from an average annual price of $91 per barrel to an average annual
price of $47 per barrel, although the price of imported crude oil fell below $40 per barrel by the
end of 2015. At the same time that the average price in imported crude oil dropped sharply, the
quantity of imported crude oil fell by 1.4%. As a result of this drop in crude oil prices and
relatively stable quantity of imports, crude oil imports fell from accounting for more than 40% on
average of the annual U.S. merchandise trade deficit in 2012 to about 10% on average of the
annual U.S. trade deficit in 2015.11
Despite the drop in the average annual price of imported crude oil and the decline in the role of
imported crude oil in the value of the U.S. trade deficit in 2014 to 2016, the U.S. merchandise
deficit increased in 2015 over that recorded in 2014. Instead of seeing the overall trade deficit
decline, the composition of the trade deficit changed, with non-petroleum products replacing
petroleum products, seemingly affirming the proposition that the overall value of the trade deficit
is determined primarily by macroeconomic forces.
According to the balance of payments accounts, the United States experienced deficits in the
merchandise trade goods accounts over the last six quarters in the range of $111 billion to $127
billion and a surplus in the services accounts during the same period in the range of about $65
billion. In the income accounts, which represent inflows of income on U.S. assets abroad relative
to outflows of income earned on U.S. assets owned by foreigners, the net balance of the accounts
was in surplus throughout the period.
Table 2. U.S. International Transactions, Selected Accounts
(billions of dollars)
2015 2016
2014 2015 I II III IV I II
Current account
Balance on current account $-392.1 $-463.0 $-114.5 $-111.9 $-123.1 $-113.4 $-131.8 $-119.9
Balance on goods and
services -490.2 -500.4 -126.5 -124.0 -125.6 -124.2 -125.2 -125.2
Balance on goods -752.2 -762.6 -193.5 -190.9 -189.8 -188.4 -186.3 -186.7
Exports 1,633.3 1,510.3 383.9 383.9 377.2 365.3 354.1 360.2
Imports -2,385.5 -2,272.9 -577.5 -574.8 -566.9 -553.7 540.4 546.9
Balance on services 262.0 262.2 67.0 66.8 64.2 64.2 61.1 61.5
Exports 743.3 750.9 188.3 188.4 187.1 187.0 184.7 185.7
Imports -481.3 -488.7 -121.3 -121.6 -123.0 -122.8 123.7 124.2
Balance on primary income 224.0 182.4 48.4 45.1 41.8 47.1 34.0 42.9
Income Receipts 821.8 782.9 194.7 199.4 196.8 192.1 188.5 198.9
Income Payments -597.8 -600.5 -146.4 -154.3 -154.9 -145.0 154.5 155.9
11 See CRS Report RS22204, U.S. Trade Deficit and the Impact of Changing Oil Prices, by James K. Jackson.
Financing the U.S. Trade Deficit
Congressional Research Service 7
2015 2016
2014 2015 I II III IV I II
Unilateral current transfers -125.9 -145.0 -36.4 -32.9 -39.3 -36.3 -40.6 -37.6
Capital account
Capital account transactions, net 0.0 0.0 -0.0 -0.0 -0.0 0.0 -0.1 0.0
Financial account
Balance on financial account -287.4 -195.2 -30.5 -99.6 -43.2 -21.8 -45.4 -31.1
U.S.-owned assets abroad, net
increase / outflow (+) 823.3 225.4 357.6 104.1 -83.8 -152.5 59.9 293.7
Private assets 926.1 502.6 319.6 255.5 -46.1 -26.3 10.1 216.0
Direct investment 343.4 348.6 86.6 114.8 51.3 96.0 67.4 106.1
Portfolio investment 582.7 154.0 233.1 140.7 -97.5 -122.3 -57.3 109.9
Equities 431.6 202.6 197.2 113.7 -54.1 -54.2 -60.5 131.1
Debt securities 151.1 -48.6 35.9 27.0 -43.4 -68.1 3.2 -21.2
of which Treasury sec. 0.0 0.0 0.0 0.0 0.0 0.0 0.0 0.0
Government securities 41.0 -25.0 2.4 1.2 -15.4 -13.0 -12.2 0.9
Corporate securities 110.1 -23.6 33.5 25.8 -27.9 -55.1 15.4 -22.1
Other investment assets -99.2 -270.9 42.1 -150.5 -37.4 -125.1 51.0 77.5
Private assets -105.9 -275.6 40.4 -150.1 -38.3 -127.5 50.0 74.4
Banks -9.3 -7.6 -4.8 -30.0 -19.0 46.4 -20.3 28.1
Non-bank financial -96.6 -268.1 45.2 -120.1 -19.3 -173.9 70.3 46.3
Official assets 6.7 4.7 1.7 -0.3 0.9 2.4 1.0 3.1
U.S. official reserve assets -3.6 -6.3 -4.2 -0.9 -0.3 -1.0 -1.2 0.2
Foreign-owned assets in the U.S. net increase / inflow (+)
1,056.4 395.2 348.0 205.4 -39.9 -118.3 118.2 350.4
Private foreign-owned assets 798.2 728.5 297.0 364.2 -75.7 44.9 70.1 158.4
Direct investment 207.4 379.4 194.1 108.0 50.6 26.8 91.3 159.6
Portfolio investment 701.9 250.9 102.9 256.2 -126.3 18.1 -21.2 -1.2
Private 590.8 349.0 102.9 256.2 -126.3 18.1 -21.2 -1.2
Equities 165.3 -52.1 21.3 1.0 10.7 -85.1 -97.9 -37.5
Debt securities 433.7 521.4 91.6 156.2 71.3 202.4 216.7 136.3
Treasury securities 218.6 146.5 -17.3 -19.3 45.3 137.8 153.1 5.0
Other Federal agency 10.4 17.7 -7.5 29.0 8.3 -12.1 21.4 28.8
Corporate bonds 200.8 350.4 114.1 143.6 17.1 75.5 41.5 100.9
Official foreign-owned assets 111.0 -98.1 47.0 93.9 -164.2 -74.8 -99.0 -82.7
Portfolio investment 102.9 -218.4 -9.9 98.9 -208.2 -99.2 -140.0 -100.0
Equities -11.0 -126.2 9.8 -23.6 -44.0 -68.4 2.2 -18.9
Debt securities 113.9 -92.2 -19.8 122.6 -164.2 -30.8 -142.2 -81.1
Financing the U.S. Trade Deficit
Congressional Research Service 8
2015 2016
2014 2015 I II III IV I II
Treasury securities 100.0 -98.1 -17.7 96.4 -157.7 -19.2 -134.1 -74.4
Other Federal agency -18.5 4.4 -5.7 26.9 -10.4 -6.3 -2.3 -2.8
Corporate bonds 32.0 1.5 3.6 -0.7 3.9 -5.3 -5.8 -3.8
Other investment liabilities 8.1 120.3 18.3 18.3 18.3 18.3 18.3 18.3
Other foreign-owned assets 147.1 -235.1 51.0 -158.7 35.8 -163.2 48.1 192.0
Private 79.7 -413.5 -8.0 -170.5 -10.5 -224.6 21.9 160.0
Banks -78.5 -180.6 -17.6 -60.0 -30.2 -72.8 -40.3 84.4
Non-bank financial inst. 158.1 -233.0 9.6 -110.6 19.7 -151.8 62.3 75.6
Official 67.5 178.4 59.0 11.8 46.3 61.4 26.1 31.9
Central bank 58.5 163.0 56.7 6.6 40.2 59.5 21.6 28.7
Financial derivatives -54.3 -25.4 -40.2 1.7 0.7 12.4 13.0 25.6
Statistical discrepancy 104.7 267.8 83.9 12.3 79.9 91.6 86.5 88.8
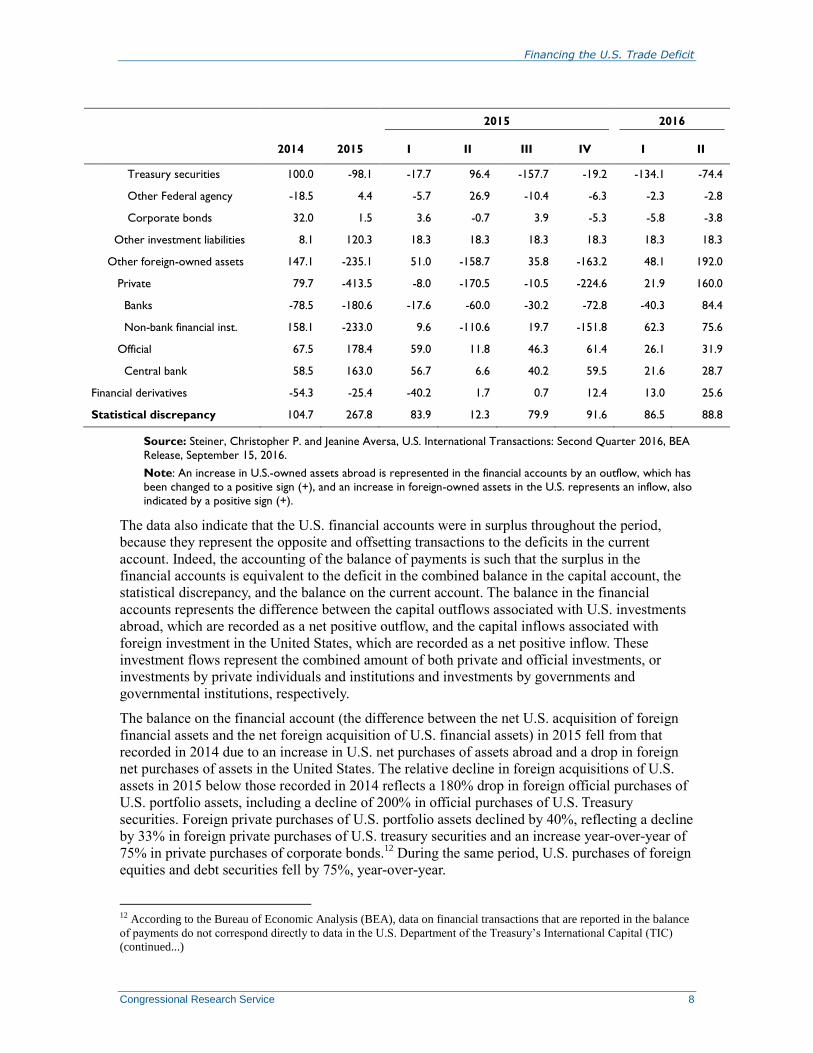
Source: Steiner, Christopher P. and Jeanine Aversa, U.S. International Transactions: Second Quarter 2016, BEA
Release, September 15, 2016.
Note: An increase in U.S.-owned assets abroad is represented in the financial accounts by an outflow, which has
been changed to a positive sign (+), and an increase in foreign-owned assets in the U.S. represents an inflow, also
indicated by a positive sign (+).
The data also indicate that the U.S. financial accounts were in surplus throughout the period,
because they represent the opposite and offsetting transactions to the deficits in the current
account. Indeed, the accounting of the balance of payments is such that the surplus in the
financial accounts is equivalent to the deficit in the combined balance in the capital account, the
statistical discrepancy, and the balance on the current account. The balance in the financial
accounts represents the difference between the capital outflows associated with U.S. investments
abroad, which are recorded as a net positive outflow, and the capital inflows associated with
foreign investment in the United States, which are recorded as a net positive inflow. These
investment flows represent the combined amount of both private and official investments, or
investments by private individuals and institutions and investments by governments and
governmental institutions, respectively.
The balance on the financial account (the difference between the net U.S. acquisition of foreign
financial assets and the net foreign acquisition of U.S. financial assets) in 2015 fell from that
recorded in 2014 due to an increase in U.S. net purchases of assets abroad and a drop in foreign
net purchases of assets in the United States. The relative decline in foreign acquisitions of U.S.
assets in 2015 below those recorded in 2014 reflects a 180% drop in foreign official purchases of
U.S. portfolio assets, including a decline of 200% in official purchases of U.S. Treasury
securities. Foreign private purchases of U.S. portfolio assets declined by 40%, reflecting a decline
by 33% in foreign private purchases of U.S. treasury securities and an increase year-over-year of
75% in private purchases of corporate bonds.12
During the same period, U.S. purchases of foreign
equities and debt securities fell by 75%, year-over-year.
12 According to the Bureau of Economic Analysis (BEA), data on financial transactions that are reported in the balance
of payments do not correspond directly to data in the U.S. Department of the Treasury’s International Capital (TIC)
(continued...)
Financing the U.S. Trade Deficit
Congressional Research Service 9
The data in Table 2 also indicate that in 2015, the flows in direct investment, particularly foreign
direct investment in the United States, experienced significant changes. U.S. direct investment
abroad rose slightly in 2015 to reach $348.6 billion, and foreign direct investment in the United
States rose by 83% to reach $379 billion. A lower value for foreign direct investment in 2014
reflected a $130 billion stock repurchase transaction that occurred between Verizon and the
French-owned Vodafone.
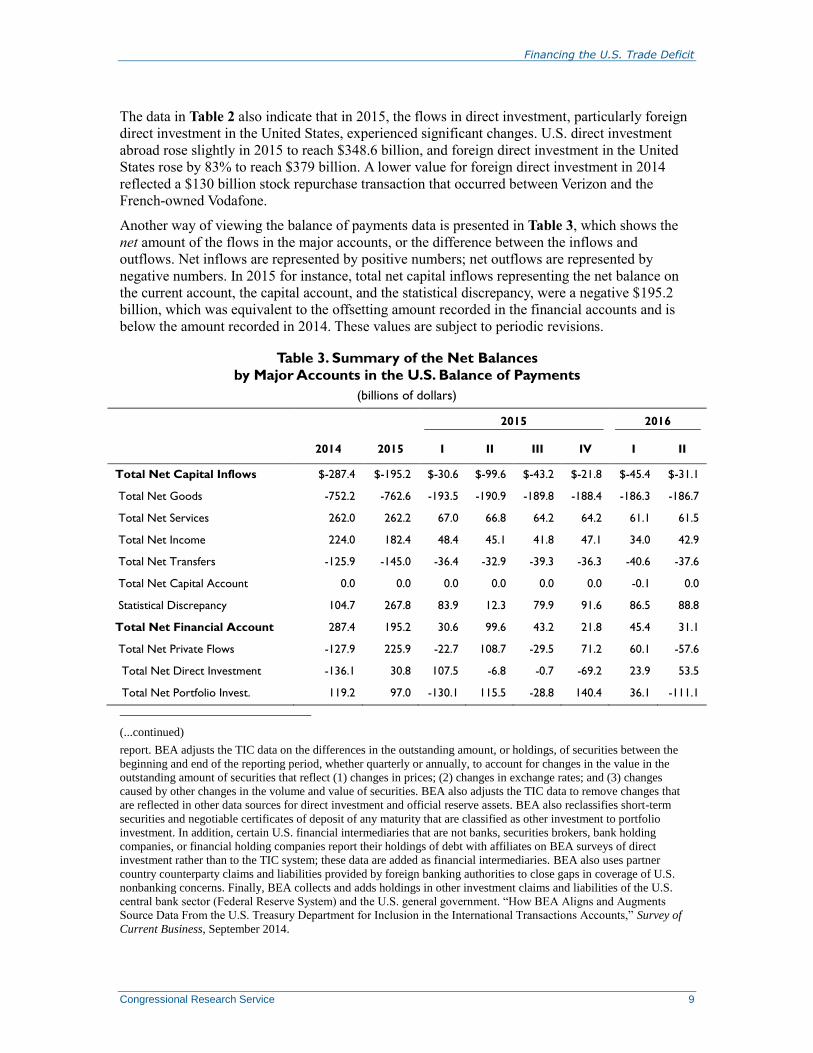
Another way of viewing the balance of payments data is presented in Table 3, which shows the
net amount of the flows in the major accounts, or the difference between the inflows and
outflows. Net inflows are represented by positive numbers; net outflows are represented by
negative numbers. In 2015 for instance, total net capital inflows representing the net balance on
the current account, the capital account, and the statistical discrepancy, were a negative $195.2
billion, which was equivalent to the offsetting amount recorded in the financial accounts and is
below the amount recorded in 2014. These values are subject to periodic revisions.
Table 3. Summary of the Net Balances
by Major Accounts in the U.S. Balance of Payments
(billions of dollars)
2015 2016
2014 2015 I II III IV I II
Total Net Capital Inflows $-287.4 $-195.2 $-30.6 $-99.6 $-43.2 $-21.8 $-45.4 $-31.1
Total Net Goods -752.2 -762.6 -193.5 -190.9 -189.8 -188.4 -186.3 -186.7
Total Net Services 262.0 262.2 67.0 66.8 64.2 64.2 61.1 61.5
Total Net Income 224.0 182.4 48.4 45.1 41.8 47.1 34.0 42.9
Total Net Transfers -125.9 -145.0 -36.4 -32.9 -39.3 -36.3 -40.6 -37.6
Total Net Capital Account 0.0 0.0 0.0 0.0 0.0 0.0 -0.1 0.0
Statistical Discrepancy 104.7 267.8 83.9 12.3 79.9 91.6 86.5 88.8
Total Net Financial Account 287.4 195.2 30.6 99.6 43.2 21.8 45.4 31.1
Total Net Private Flows -127.9 225.9 -22.7 108.7 -29.5 71.2 60.1 -57.6
Total Net Direct Investment -136.1 30.8 107.5 -6.8 -0.7 -69.2 23.9 53.5
Total Net Portfolio Invest. 119.2 97.0 -130.1 115.5 -28.8 140.4 36.1 -111.1
(...continued)
report. BEA adjusts the TIC data on the differences in the outstanding amount, or holdings, of securities between the
beginning and end of the reporting period, whether quarterly or annually, to account for changes in the value in the
outstanding amount of securities that reflect (1) changes in prices; (2) changes in exchange rates; and (3) changes
caused by other changes in the volume and value of securities. BEA also adjusts the TIC data to remove changes that
are reflected in other data sources for direct investment and official reserve assets. BEA also reclassifies short-term
securities and negotiable certificates of deposit of any maturity that are classified as other investment to portfolio
investment. In addition, certain U.S. financial intermediaries that are not banks, securities brokers, bank holding
companies, or financial holding companies report their holdings of debt with affiliates on BEA surveys of direct
investment rather than to the TIC system; these data are added as financial intermediaries. BEA also uses partner
country counterparty claims and liabilities provided by foreign banking authorities to close gaps in coverage of U.S.
nonbanking concerns. Finally, BEA collects and adds holdings in other investment claims and liabilities of the U.S.
central bank sector (Federal Reserve System) and the U.S. general government. “How BEA Aligns and Augments
Source Data From the U.S. Treasury Department for Inclusion in the International Transactions Accounts,” Survey of
Current Business, September 2014.

Financing the U.S. Trade Deficit
Congressional Research Service 10
2015 2016
2014 2015 I II III IV I II
Total Net Private 8.1 195.1 -130.1 115.5 -28.8 140.4 36.1 -111.1
Total Net Equity Securities -266.3 -254.7 -175.9 -112.7 64.8 -30.9 -37.4 -168.6
Total Net Debt Securities 282.6 570.0 55.7 129.2 114.6 270.5 213.5 157.5
Total Net Treasury Sec. 218.6 146.5 -17.3 -19.3 45.3 137.8 153.1 5.0
Other Government -30.6 42.7 -9.8 27.8 23.8 0.9 33.5 27.9
Corporate 90.7 374.1 80.6 117.8 45.0 130.6 26.1 123.0
Other 4.0 6.8 2.2 2.9 0.5 1.2 0.8 1.6
Total Net Official 111.0 -98.1 47.0 93.9 -164.2 -74.8 -99.0 -82.7
Total Net Portfolio 102.9 -218.4 -9.9 98.9 -208.2 -99.2 -140.0 -100.0
Total Net Equity Securities -11.0 -126.2 9.8 -23.6 -44.0 -68.4 2.2 -18.9
Total Net Debt Securities 113.9 -92.2 -19.8 122.6 -164.2 -30.8 -142.2 -81.1
Total Net Treasury Sec. 100.0 -98.1 -17.7 96.4 -157.7 -19.2 -134.1 -74.4
Other Government -18.5 4.4 -5.7 26.9 -10.4 -6.3 -2.3 -2.8
Corporate 32.0 1.5 3.6 -0.7 3.9 -5.3 -5.8 -3.8
Other 0.4 0.1 0.0 0.1 0.0 -0.1 0.0 0.0
Total Net Other 0.0 0.0 -47.0 -93.9 164.2 74.8 99.0 82.7
Total Net Other 246.3 35.8 8.9 -8.3 73.2 -38.1 -2.9 114.5
Private 185.6 -137.9 -48.3 -20.4 27.9 -97.0 -28.1 85.7
Banks -69.2 -173.0 -12.8 -29.9 -11.2 -119.1 -20.1 56.3
Other Financial 254.8 35.1 -35.6 9.5 39.1 22.1 -8.0 29.4
Other Government 60.8 173.7 57.3 12.1 45.3 59.0 25.2 28.8
Total Net Official Reserves 3.6 6.3 -4.2 -0.9 -0.3 -1.0 -1.2 0.2
Financial Derivatives -54.3 -25.4 40.2 -1.7 -0.7 -12.4 13.0 25.6
Source: Data developed by CRS from data published by the Department of Commerce.
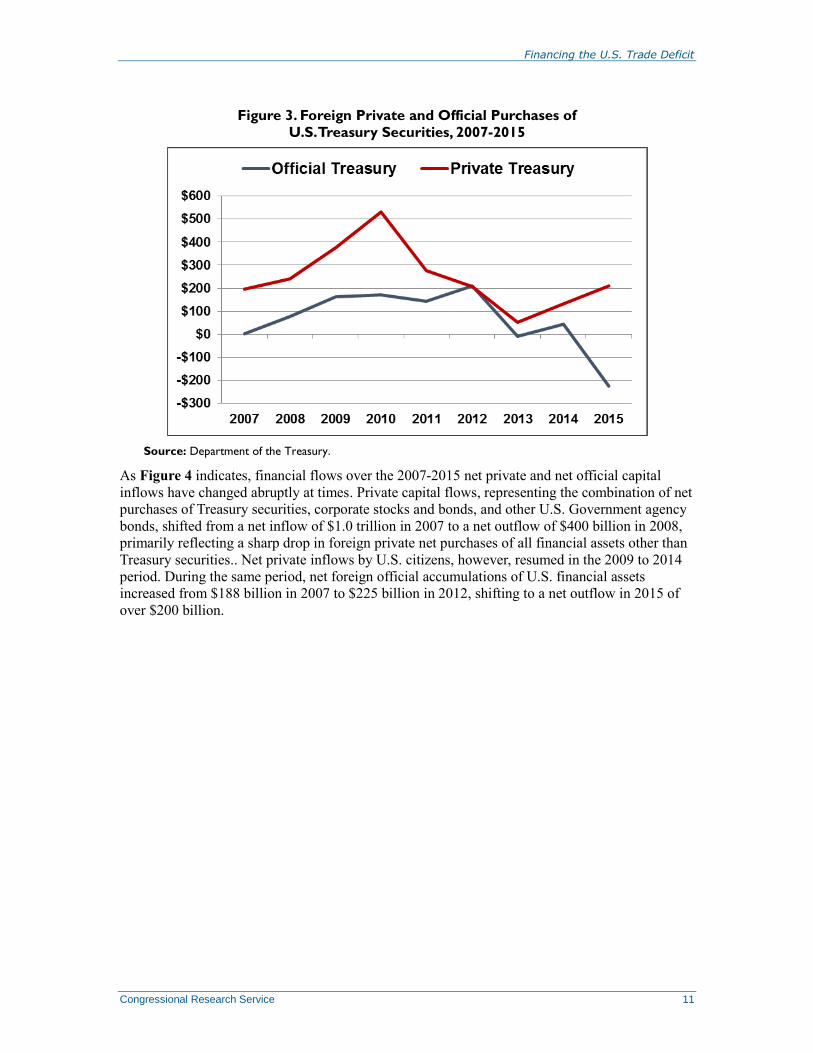
Treasury Department data indicate that foreign private net purchases of Treasury securities have
shifted between positive and negative values at various times, as indicated in Figure 3.13
Foreign
official net acquisitions of Treasury securities have also tended to change abruptly on an annual
basis, at times reflecting the role of the dollar and dollar-denominated securities as safe haven
assets. During the midst of the financial crisis in 2009 and 2010, for instance, foreign private
investors sharply increased their net purchases of Treasury securities, which rose to over $500
billion in 2010. From 2010 to 2013, however, as concerns over financial market stability eased
foreign private net purchases of Treasury securities fell to $52 billion in 2013. Similarly, foreign
governments increased their net purchases of Treasury securities in 2008 and 2009, which they
maintained until foreign official net purchases fell in 2013 and again in 2015 when foreign
official entities liquidated more than $200 billion in treasury securities.
13 Department of the Treasury, Treasury International Capital System, available at: https://www.treasury.gov/resource-
center/data-chart-center/tic/Pages/index.aspx.
Financing the U.S. Trade Deficit
Congressional Research Service 11
Figure 3. Foreign Private and Official Purchases of
U.S. Treasury Securities, 2007-2015
Source: Department of the Treasury.
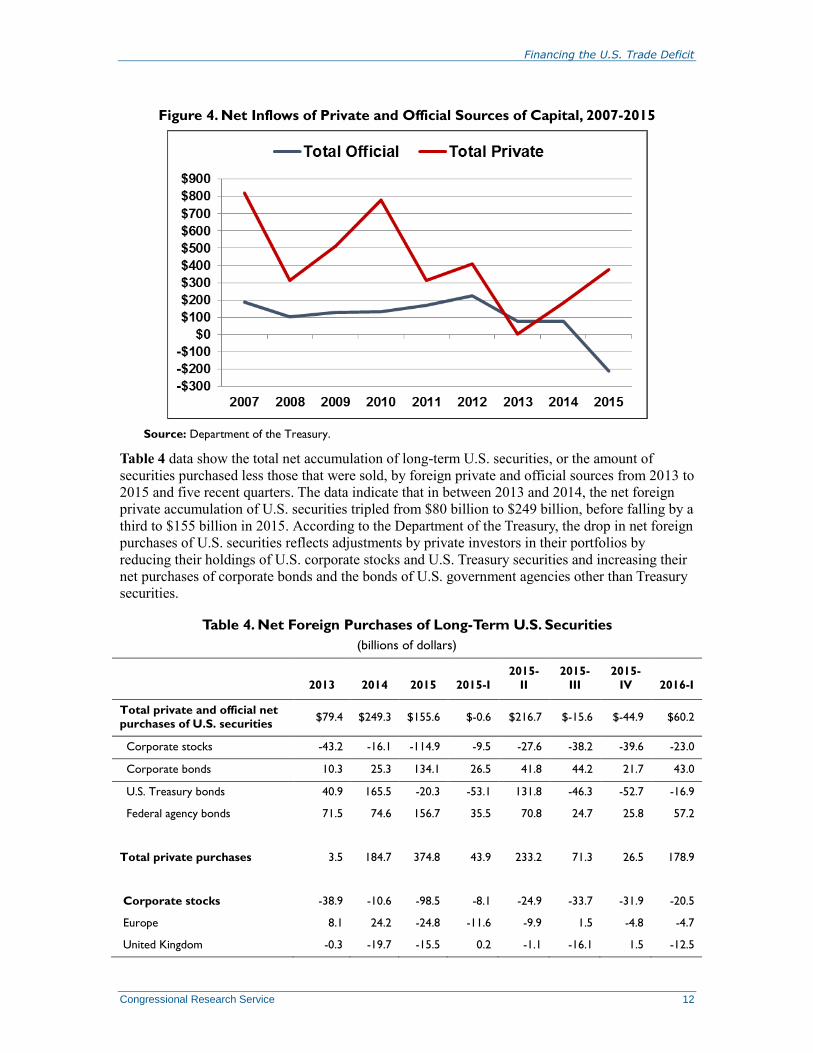
As Figure 4 indicates, financial flows over the 2007-2015 net private and net official capital
inflows have changed abruptly at times. Private capital flows, representing the combination of net
purchases of Treasury securities, corporate stocks and bonds, and other U.S. Government agency
bonds, shifted from a net inflow of $1.0 trillion in 2007 to a net outflow of $400 billion in 2008,
primarily reflecting a sharp drop in foreign private net purchases of all financial assets other than
Treasury securities.. Net private inflows by U.S. citizens, however, resumed in the 2009 to 2014
period. During the same period, net foreign official accumulations of U.S. financial assets
increased from $188 billion in 2007 to $225 billion in 2012, shifting to a net outflow in 2015 of
over $200 billion.
Financing the U.S. Trade Deficit
Congressional Research Service 12
Figure 4. Net Inflows of Private and Official Sources of Capital, 2007-2015
Source: Department of the Treasury.
Table 4 data show the total net accumulation of long-term U.S. securities, or the amount of
securities purchased less those that were sold, by foreign private and official sources from 2013 to
2015 and five recent quarters. The data indicate that in between 2013 and 2014, the net foreign
private accumulation of U.S. securities tripled from $80 billion to $249 billion, before falling by a
third to $155 billion in 2015. According to the Department of the Treasury, the drop in net foreign
purchases of U.S. securities reflects adjustments by private investors in their portfolios by
reducing their holdings of U.S. corporate stocks and U.S. Treasury securities and increasing their
net purchases of corporate bonds and the bonds of U.S. government agencies other than Treasury
securities.
Table 4. Net Foreign Purchases of Long-Term U.S. Securities
(billions of dollars)
2013 2014 2015 2015-I
2015-
II
2015-
III
2015-
IV 2016-I
Total private and official net
purchases of U.S. securities $79.4 $249.3 $155.6 $-0.6 $216.7 $-15.6 $-44.9 $60.2
Corporate stocks -43.2 -16.1 -114.9 -9.5 -27.6 -38.2 -39.6 -23.0
Corporate bonds 10.3 25.3 134.1 26.5 41.8 44.2 21.7 43.0
U.S. Treasury bonds 40.9 165.5 -20.3 -53.1 131.8 -46.3 -52.7 -16.9
Federal agency bonds 71.5 74.6 156.7 35.5 70.8 24.7 25.8 57.2
Total private purchases 3.5 184.7 374.8 43.9 233.2 71.3 26.5 178.9
Corporate stocks -38.9 -10.6 -98.5 -8.1 -24.9 -33.7 -31.9 -20.5
Europe 8.1 24.2 -24.8 -11.6 -9.9 1.5 -4.8 -4.7
United Kingdom -0.3 -19.7 -15.5 0.2 -1.1 -16.1 1.5 -12.5

Financing the U.S. Trade Deficit
Congressional Research Service 13
2013 2014 2015 2015-I
2015-
II
2015-
III
2015-
IV 2016-I
Canada -3.2 10.2 -12.2 5.9 -7.6 0.7 -2.7 -2.6
Latin America 4.8 3.6 -1.1 -0.1 -0.6 -0.2 -0.2 -1.1
Asia -29.6 -27.7 -33.3 -1.4 -14.8 -6.8 -10.4 -5.4
Of which: Japan -26.4 -9.2 9.5 1.9 1.4 4.9 1.3 4.4
Corporate bonds -6.8 17.6 137.7 25.8 41.3 46.5 24.1 44.0
Europe -25.8 15.3 111.0 20.5 33.9 33.4 23.1 30.1
United Kingdom 19.1 77.2 127.4 23.4 36.6 34.5 32.9 34.3
Canada -3.2 -5.6 -13.5 -1.3 -6.9 -1.7 -3.5 -3.4
Latin America -2.5 0.6 4.5 1.4 1.9 0.6 0.6 1.1
Asia 23.3 -10.2 6.3 -3.5 5.1 5.5 -0.8 6.7
Of which: Japan 0.3 -11.5 -0.3 -3.4 1.9 3.3 -2.2 3.6
U.S. Treasury bonds 52.1 133.2 210.9 -2.0 164.9 34.6 13.3 109.4
Europe 58.2 -46.1 82.6 -57.6 88.2 4.1 47.9 72.2
Canada -2.4 4.2 39.9 5.9 13.6 13.8 6.6 6.8
Latin America -8.2 29.7 -23.2 0.1 3.2 -12.8 -13.7 -15.2
Asia 109.4 212.5 -153.8 -6.1 2.5 -78.9 -71.3 -69.2
Of which: Japan 62.6 10.7 -97.1 -7.7 -19.4 -27.3 -42.8 -2.1
Federal agency bonds -2.8 44.4 124.7 28.2 51.8 23.9 20.9 46.0
Europe 45.4 31.8 45.7 10.4 24.7 2.4 8.3 15.9
United Kingdom 42.4 36.7 37.0 9.2 19.2 2.4 6.1 9.9
Canada -2.9 3.6 9.1 4.1 2.8 1.5 0.6 1.0
Latin America -9.6 -0.7 5.8 2.5 -1.4 7.7 -3.0 -0.9
Asia 51.6 51.6 93.4 19.0 42.7 13.7 17.9 38.0
Of which: Japan -39.9 0.1 31.5 4.1 9.7 7.4 10.3 20.7
Total official purchases 78.8 78.3 -212.4 -40.1 -18.9 -84.3 -69.1 -114.8
U.S. Treasury bonds -8.4 44.9 -225.9 -47.2 -35.6 -78.7 -64.3 -122.9
Other U.S. Government
securities 75.2 31.4 33.5 8.0 19.0 1.0 5.4 11.4
Corporate bonds 16.2 7.0 -3.8 0.6 0.3 -2.3 -2.4 -0.7
Corporate stocks -4.1 -4.9 -16.2 -1.5 -2.7 -4.4 -7.7 -2.6
Source: U.S. Department of the Treasury, Treasury International Capital System.
Financing the U.S. Trade Deficit
Congressional Research Service 14
The U.S. Net International Investment Position As indicated above, the data in Table 2 and Table 3 show that the trade deficit is accompanied by
an equal capital inflow that represents an accumulation of dollar-denominated assets by
foreigners. Some observers have equated the trade deficit and the associated accumulation of
foreign-owned dollar-denominated assets as a debt that the U.S. economy owes to foreigners that
will have to be repaid. This characterization, however, is not entirely appropriate. The debts
owned by foreign investors represent claims on assets, rather than loans where payments on the
principal and interest are specified according to a fixed schedule and where failure to meet the
repayment schedule can result in the loans being called in and made payable in full. While
foreign investors have expectations of a positive return on their dollar-denominated assets,
returns, except for Treasury securities, are not guaranteed, but are subject to market forces. An
important feature of claims by foreign investors on U.S. assets is that some or all of the profits or
returns on the assets can be repatriated to the home country of the foreign investor, thereby
reducing the returns that otherwise would remain in the U.S. economy. Depending on the tax
convention the United States has with other governments, private foreign investors who own U.S.
Treasury securities will owe taxes on the interest income.
According to the most commonly accepted approach to the balance of payments, macroeconomic
developments in the U.S. economy are the major driving forces behind the magnitudes of capital
flows, because the macroeconomic factors determine the overall demand for and supply of capital
in the economy. Economists generally conclude that the rise in capital inflows can be attributed to
comparatively favorable returns on investments in the United States when adjusted for risk, a
surplus of saving in other areas of the world, the well-developed U.S. financial system, the
overall stability of the U.S. economy, and the generally held view that U.S. securities, especially
Treasury securities, are high quality financial instruments that are low risk. In turn, these net
capital inflows (inflows net of outflows) bridge the gap in the United States between the amount
of credit demanded and the domestic supply of funds, likely keeping U.S. interest rates below the
level they would have reached without the foreign capital. These capital inflows also allow the
United States to spend beyond its means, including financing its trade deficit, because foreigners
are willing to lend to the United States in the form of exchanging goods, represented by U.S.
imports, for such U.S. assets as stocks, bonds, U.S. Treasury securities, and real estate and U.S.
businesses.
While this exchange of assets is implicit in the balance of payments, the Department of
Commerce explicitly accounts for this broad flow of dollar-denominated assets through the
nation’s net international investment position. The U.S. net international investment position
represents the accumulated value of U.S.-owned assets abroad and foreign-owned assets in the
United States measured on an annual basis at the end of the calendar year. Some observers refer
to the net of this investment position (or the difference between the value of U.S.-owned assets
abroad and the value of foreign-owned assets in the United States) as a debt, or indicate that the
United States is a net debtor nation, because the value of foreign-owned assets in the United
States is greater than the value of U.S.-owned assets abroad.
In fact, the nation’s net international investment position is not a measure of the nation’s
indebtedness similar to the debt borrowed by some developing countries, but it is simply an
accounting of assets. The Department of Commerce uses three different methods for valuing
direct investments that can yield different estimates for the net position, depending on the stock

Financing the U.S. Trade Deficit
Congressional Research Service 15
market value of the investments.14
For example, by year-end 2015 the overseas assets of U.S.
residents totaled $22.0 trillion, with U.S. direct investment abroad valued at historical cost, while
foreigners had acquired about $28.0 trillion in assets in the United States, with direct investment
measured at historical cost. As a result, the U.S. net international investment position was about a
negative $5.6 trillion in 2015, with direct investment measured at historical cost, but was valued
at negative $7.3 with direct investment valued at current cost, as indicated in Table 5.
Table 5. U.S. Net International Investment Position
(billions of dollars)
Type of Investment 2012 2013 2014 2015
Net international investment position of the United States:
With direct investment at current cost $-4,518.3 $-5,372.7 $-7,046.1 $-7,280.6
With direct investment at market value -4,000.1 -4,826.5 -5,913.1 -5,808.7
With direct investment at historical cost -3,794.8 -4,611.6 -5,717.6 -5,643.0
Net Financial derivatives 57.8 77.6 85.5 57.2
U.S. Assets
With direct investment at current cost 22,562.2 24,144.8 24,717.5 23,340.8
With direct investment at market value 21,002.7 21,603.8 22,413.8 21,403.1
With direct investment at historical cost 21,610.5 22,238.7 23,042.3 22,011.0
U.S. Assets excluding financial derivatives 18,942.4 21,127.7 21,503.4 20,945.4
Financial derivatives 3,619.8 3,017.1 3,214.1 2,395.4
U.S. Direct Investment Abroad
—At current cost 5,969.5 7,120.7 7,133.1 6,978.3
—At market value 4,410.0 4,579.7 4,829.4 5,040.6
—At historical cost 5,017.8 5,214.6 5,457.9 5,648.6
Portfolio Investment 7,984.0 9,206.1 9,704.3 9,606.2
—Equities 5,321.9 6,472.9 6,770.6 6,828.2
—Debt securities 2,662.1 2,733.2 2,933.6 2,777.9
Other Investment 4,416.6 4,352.5 4,231.8 3,977.3
Currency and Deposits 2,061.7 1,975.7 1,785.5 1,628.6
Loans 2,299.2 2,323.5 2,399.2 2,304.0
Other 55.7 53.4 47.0 44.7
Reserve Assets 572.4 448.3 434.3 383.6
U.S. Liabilities
With direct investment at current cost 27,080.5 29,517.4 31,763.7 30,621.4
With direct investment at market value 25,002.7 26,430.3 28,326.9 27,211.8
With direct investment at historical cost 25,405.3 26,850.3 28,759.9 27,654.0
14 For additional information, see CRS Report RL32964, The United States as a Net Debtor Nation: Overview of the
International Investment Position, by James K. Jackson.

Financing the U.S. Trade Deficit
Congressional Research Service 16
Type of Investment 2012 2013 2014 2015
U.S. Liabilities excluding financial derivatives 23,518.5 26,577.9 28,635.1 28,283.3
Financial derivatives 3,562.0 2,939.5 3,128.6 2,338.1
Foreign Direct Investment in the United States
—At current cost 4,662.4 5,814.9 6,350.1 6,543.8
—At market value 2,584.7 2,727.8 2,913.3 3,134.2
—At historical cost 2,987.3 3,147.8 3,346.3 3,576.4
Portfolio Investment 13,978.9 15,541.3 16,919.8 16,677.0
Private portfolio investment 8,615.7 9,973.9 11,175.3 11,128.7
Equity 3,843.0 4,968.9 5,664.9 5,400.2
Debt securities, of which: 4,772.8 5,005.1 5,510.5 5,728.5
Treasury securities 288.9 287.1 336.3 388.0
Treasury bonds 1,249.7 1,450.9 1,697.1 1,665.5
Corporate bonds 3,063.7 3,087.0 3,276.0 3,481.0
Official portfolio investment 5,363.1 5,567.3 5,744.5 5,548.3
Equity 702.4 895.7 977.6 818.6
Debt securities, of which: 4,660.8 4,671.6 4,766.8 4,729.6
Treasury securities 372.7 398.4 335.3 336.7
Treasury bonds 3,660.1 3,656.2 3,787.3 3,757.9
Corporate bonds 615.2 590.9 605.1 598.5
Other Investment 4,877.2 5,221.7 5,365.2 5,062.5
Other official investment 318.8 380.0 390.0 508.0
Other private investment 4,558.4 4,841.7 4,975.3 4,554.4
Currency and deposits 2,442.1 2,460.6 2,675.7 2,584.1
Loans 2,048.2 2,315.1 2,228.8 1,901.1
Total U.S. Liabilities to foreign official agencies 5,681.9 5,947.4 6,134.4 6,056.3
Total U.S. Liabilities to private entities 13,278.2 15,788.9 17,525.4 17,672.5
Source: Gohrband, Christopher, et al, The International Investment Position of the United States at the End of
the First Quarter of 2016, Year 2015, and Annual Revisions, BEA New Release, June 30, 2016.
Foreign investors who acquire U.S. assets do so at their own risk and accept the returns
accordingly. While foreign investors likely expect positive returns from their dollar-denominated
assets, the returns on most of the assets in the international investment position, except for bonds,
are not guaranteed and foreign investors stand to gain or lose on them similar to the way U.S.
domestic investors gain or lose.
As Table 5 indicates, investments in the international investment position include such financial
assets as corporate stocks and bonds, government securities, and direct investment15
in businesses
15 The United States defines foreign direct investment as the ownership or control, directly or indirectly, by one foreign
person (individual, branch, partnership, association, government, etc.) of 10% or more of the voting securities of an
incorporated U.S. business enterprise or an equivalent interest in an unincorporated U.S. business enterprise. 15 CFR
(continued...)

Financing the U.S. Trade Deficit
Congressional Research Service 17
and real estate. The value of these assets, measured on an annual basis, can change as a result of
purchases and sales of new or existing assets; changes in the financial value of the assets that
arise through appreciation, depreciation, or inflation; changes in the market values of stocks and
bonds; or changes in the value of currencies. For instance, by year-end 2015, U.S. holdings
abroad had risen in value to $22 trillion, with direct investment valued at historical cost, and
$23.2 trillion and $21.4 trillion with direct investment valued at current cost and market value,
respectively, reflecting an upward revaluation in the values of foreign corporate stocks due to an
increase in stock market values. Similarly, the value of foreign owned assets in the United States
rose in 2015 to $27.2 trillion with direct investment valued at historical cost and $30.6 trillion
with direct investment valued at market cost, with rising stock values pulling up the overall
investment position of foreign investors.
The foreign investment position in the United States continues to increase as foreigners acquire
additional U.S. assets and as the value of existing assets appreciates. These assets are broadly
divided into official and private investments, reflecting transactions by governments among
themselves and transactions among the public. While the foreign official share of the overall
amount of capital inflows has grown sharply as indicated in Table 3, the overall foreign official
share of foreign-owned assets in the United States has remained relatively modest.
As Figure 5 indicates, foreign official asset holdings were valued at about $6.0 trillion in 2015, or
about 20% of the total foreign investment position, a share that rose above 20% in 2008 as
foreign official holdings of U.S. Treasury securities rose during the global financial crisis.
Official assets include such monetary reserve assets as gold, the reserve position with the
International Monetary Fund (IMF), and holdings of foreign currency. An important component
of foreign official holdings in the United States is the acquisitions of U.S. Treasury securities by
foreign governments. At times, such acquisitions are used by foreign governments, either through
coordinated actions or by themselves, to affect the foreign exchange price of the dollar. Foreign
currency holdings account for a relatively small share of the total foreign investment position.16
(...continued)
§806.15 (a)(1). Similarly, the United States defines direct investment abroad as the ownership or control, directly or
indirectly, by one person (individual, branch, partnership, association, government, etc.) of 10% or more of the voting
securities of an incorporated business enterprise or an equivalent interest in an unincorporated business enterprise. 15
CFR §806.15 (a)(1). 16 For additional information, see CRS Report RL32462, Foreign Investment in U.S. Securities, by James K. Jackson.

Financing the U.S. Trade Deficit
Congressional Research Service 18
Figure 5. Foreign Official and Private Investment Positions
in the United States, 1994-2015
Source: Department of Commerce.
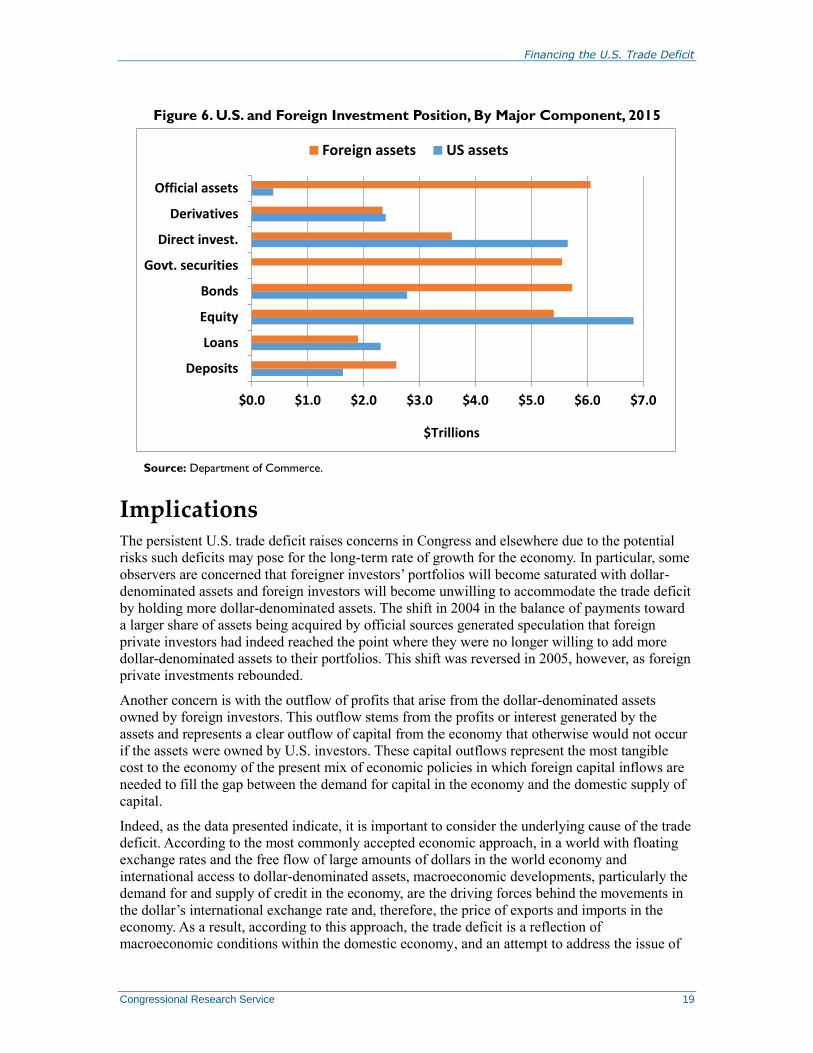
Private asset holdings are comprised primarily of direct investment in businesses and real estate,
purchases of publicly traded government securities, and corporate stocks and bonds. As indicated
in Figure 6, the composition of U.S. assets abroad and foreign-owned assets in the United States
differs in a number of ways. The strength and uniqueness of the U.S. Treasury securities markets
make these assets sought after by both official and private foreign investors, whereas U.S.
investors hold few foreign government securities. As a result, foreign official assets in the United
States far outweigh U.S. official assets abroad. Both foreign private and official investors have
been drawn at times to U.S. government securities as a safe haven investment during troubled or
unsettled economic conditions.
Financing the U.S. Trade Deficit
Congressional Research Service 19
Figure 6. U.S. and Foreign Investment Position, By Major Component, 2015
Source: Department of Commerce.
Implications The persistent U.S. trade deficit raises concerns in Congress and elsewhere due to the potential
risks such deficits may pose for the long-term rate of growth for the economy. In particular, some
observers are concerned that foreigner investors’ portfolios will become saturated with dollar-
denominated assets and foreign investors will become unwilling to accommodate the trade deficit
by holding more dollar-denominated assets. The shift in 2004 in the balance of payments toward
a larger share of assets being acquired by official sources generated speculation that foreign
private investors had indeed reached the point where they were no longer willing to add more
dollar-denominated assets to their portfolios. This shift was reversed in 2005, however, as foreign
private investments rebounded.
Another concern is with the outflow of profits that arise from the dollar-denominated assets
owned by foreign investors. This outflow stems from the profits or interest generated by the
assets and represents a clear outflow of capital from the economy that otherwise would not occur
if the assets were owned by U.S. investors. These capital outflows represent the most tangible
cost to the economy of the present mix of economic policies in which foreign capital inflows are
needed to fill the gap between the demand for capital in the economy and the domestic supply of
capital.
Indeed, as the data presented indicate, it is important to consider the underlying cause of the trade
deficit. According to the most commonly accepted economic approach, in a world with floating
exchange rates and the free flow of large amounts of dollars in the world economy and
international access to dollar-denominated assets, macroeconomic developments, particularly the
demand for and supply of credit in the economy, are the driving forces behind the movements in
the dollar’s international exchange rate and, therefore, the price of exports and imports in the
economy. As a result, according to this approach, the trade deficit is a reflection of
macroeconomic conditions within the domestic economy, and an attempt to address the issue of
$0.0 $1.0 $2.0 $3.0 $4.0 $5.0 $6.0 $7.0
Deposits
Loans
Equity
Bonds
Govt. securities
Direct invest.
Derivatives
Official assets
Foreign assets US assets
$Trillions

Financing the U.S. Trade Deficit
Congressional Research Service 20
the trade deficit without addressing the underlying macroeconomic factors in the economy likely
would prove to be of limited effectiveness.
In addition, the nation’s net international investment position indicates that the largest share of
U.S. assets owned by foreigners is held by private investors who acquired the assets for any
number of reasons. As a result, the United States is not in debt to foreign investors or to foreign
governments similar to some developing countries that run into balance of payments problems,
because the United States has not borrowed to finance its trade deficit. Instead the United States
has traded assets with foreign investors who are prepared to gain or lose on their investments in
the same way private U.S. investors can gain or lose. It is certainly possible that foreign investors,
whether they are private or official, could eventually decide to limit their continued acquisition of
dollar-denominated assets or even reduce the size of their holdings, but there is no firm evidence
that such presently is the case.
Author Contact Information
James K. Jackson
Specialist in International Trade and Finance
[email protected], 7-7751
Recommended