Financial Stocks
Kate FarleyRyan O’Connor

AgendaBrief overview of SectorBusiness AnalysisReasons for our stock pickFinancials and ValuationRecommendation

Financial SectorWorst performing sector of the S&P 500
Down over 41% YTD* compared to –14.75% of index
Uncertainty regarding Gov’t bailoutPotential bank nationalizationIncreased stake in Citigroup and AIG
Currently underweighted by 113bpsWill increase underweighting by 150bps
*As of 2/23/09


Who is HCBK?Hudson City Bancorp Inc.Regional Holding Company based out of New
JerseyTraded on the NASDAQCurrently part of S&P 500 IndexWeathered the storm better than most
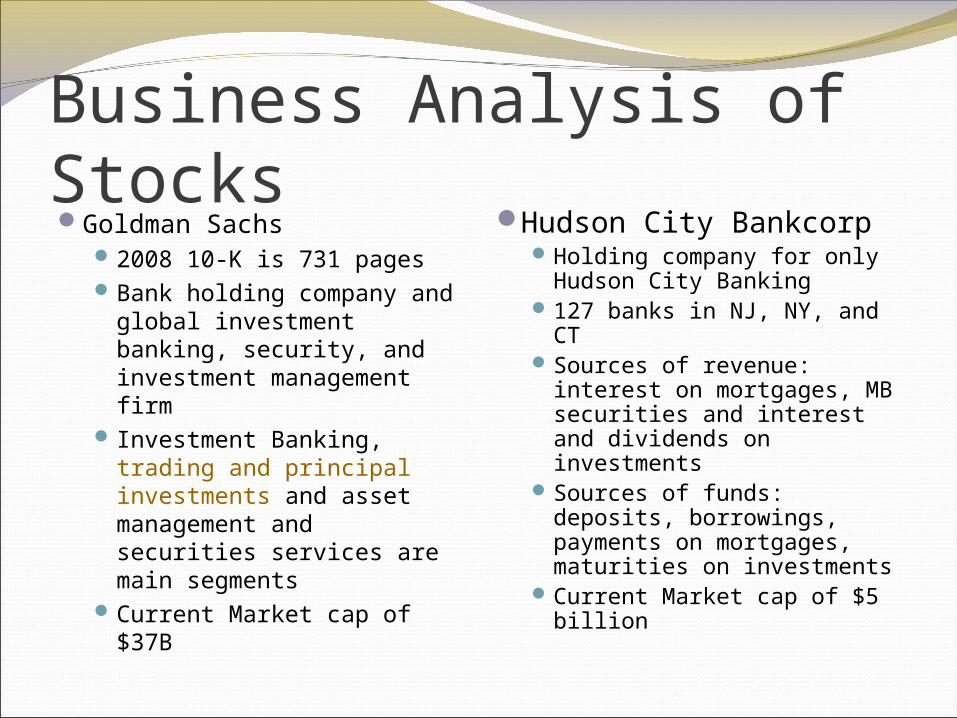
Business Analysis of StocksGoldman Sachs
2008 10-K is 731 pagesBank holding company and
global investment banking, security, and investment management firm
Investment Banking, trading and principal investments and asset management and securities services are main segments
Current Market cap of $37B
Hudson City BankcorpHolding company for only
Hudson City Banking127 banks in NJ, NY, and
CTSources of revenue:
interest on mortgages, MB securities and interest and dividends on investments
Sources of funds: deposits, borrowings, payments on mortgages, maturities on investments
Current Market cap of $5 billion

Why HCBK?Never underwritten subprime, negative
amortization or Option ARM loansStrict Maximum Loan-to-Value0.43% non-performing assetsRefused TARP money in NovemberKramer recommended staying away ( Jan 26,
2009)Named Best-Managed Bank in America Two
Years in a Row- Forbes Magazine
http://community.investopedia.com/news/IA/2009/Hudson-City-Flourishes-During-Downturn-HCBK0211.aspx?partner=YahooSA

Loan to Value Maximums
Max Loan AmountsMax LTV
Up to $600,000 90%
$ 600,100-$1,000,000 80%
$1,000,100-$1,500,000 75%
$1,500,100-$2,000,000 70%
$2,000,100-$2,500,000 65%
$2,500,100-$3,000,000 60%
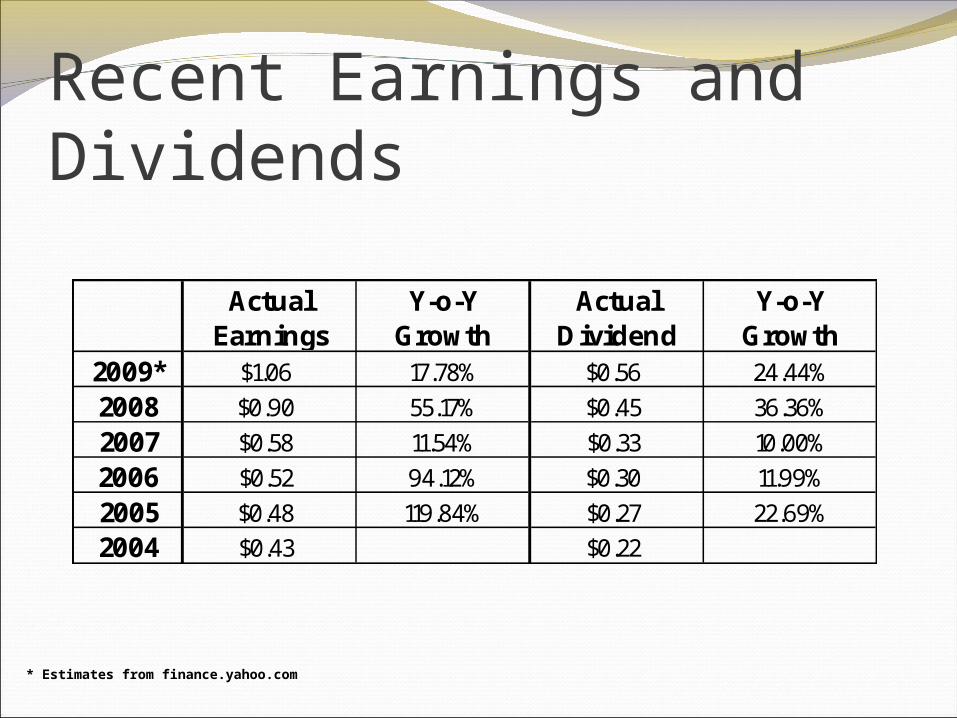
Recent Earnings and Dividends
Actual Earnings
Y-o-Y Growth
Actual Dividend
Y-o-Y Growth
2009* $1.06 17.78% $0.56 24.44%
2008 $0.90 55.17% $0.45 36.36%
2007 $0.58 11.54% $0.33 10.00%
2006 $0.52 94.12% $0.30 11.99%
2005 $0.48 119.84% $0.27 22.69%2004 $0.43 $0.22
* Estimates from finance.yahoo.com

Hudson City ValuationHigh Low Mean Current
Price/forward earnings 30.6 9.8 20.9 9.8Price/book 29.3 11 25 11
P/E/G 7.2 2.3 4.9 2.3ROE 18 5.5 8.5 9.3
Price/forward earnings 2.27 0.24 1.43 0.65Price/book 99.99 0.31 0.85 1.87
P/E/G 2.63 0.63 1.48 0.67ROE 3.65 0.35 0.68 3.65
Price/forward earnings 1.78 0.46 1.13 0.8Price/book 99.99 0.17 0.54 0.64
P/E/G 0.91 0.44 0.65 0.46ROE 2.13 0.57 1.25 0.58
HCBK v HCBK
HCBK vs SP-40
HCBK vs SP5A

Hudson City DCF ModelUsed average expenses percentage over past
3 yearsUsing 14.5% discount rate due to financials
cyclical natureAssuming no change in number of shares
outstandingTerminal Growth Rate of 4%Assuming constant margins and tax rates
based on historic figures

Valuation and Price TargetsDCF approximately $22 with 123% upside
Terminal Discount Rate of 14.5%Terminal FCF Rate of 4.0%
Ratio AnalysisGave us price target between $9 and $23
depending ratioP/B was $21.53
Our price target is $18.00 (77% upside)

Goldman Sachs ValuationHigh Mean Low Current
Price/forward earnings 40.2 18.8 9.7 15.8Price/book 8.9 3.4 1.7 2.1
P/E/G 3 1.5 0.8 1.3ROE 20.9 18 13.8 20.4
Price/forward earnings 2.03 1.48 0.22 0.96Price/book 3.62 1.62 1.24 3.62
P/E/G 2.3 1.35 0.88 1.2ROE 8.27 1.1 0.93 8.27
Price/forward earnings 2.63 0.61 0.32 0.78Price/book 1.05 0.73 0.35 0.53
P/E/G 1.1 0.76 0.42 0.72ROE 3.07 1.18 0.34 0.34
GS vs GS
GS vs SP-40
GS vs SP5A

Reasons to dump GS2 students dropped this class after being
assigned GSROE (ttm) 4.3%Sales growth predicted to drop 21% in the next
quarter and 19% in 3Q09*Took $10 billion in TARP funds and now has to
dance to the Gov’t tuneIn order to repay has to raise the money in a
government approved equity offering of similar amount
Price Target of 97.00Berkshire Hathaway has a $5 billion investment
* finance.yahoo.com

New SIM Financials Portfolio
Name Symbol % of SIM Financials
Berkshire Hathaway Inc.
BRK.A 47.2%
Wells Fargo WFC 11.7%
Hudson City Bancorp
HCBK 41.1%

RecommendationsSell entire GS position (~400bps)Purchase 340 bps of HCBK
Consensus growth rate higher than S&P 500Undervalued compared to financials and itselfNo exposure to Real Estate
Sell off 68 bps of BRKA and 22 of WFCShould bring us to underweighting of 263 bps


Off Balance Sheet Commitments Payments Due By Period
Less Than One Year
to
Three Years to More Than
Contractual Obligation Total One Year
Three Year
s
Five Year
s Five Years
(In thousands)
Mortgage loan originations $ 337,590 $ 337,590 $ — $ — $ —
Mortgage loan purchases 219,117 219,117 — — —
Mortgage-backed security purchases 516,000 516,000 — — —
Operating leases 149,776 8,404 17,31
1 16,92
5 107,13
6
Total $ 1,222,483 $ 1,081,111 $17,31
1 $16,92
5 $107,13
6

Not Selling all of WFC…DCF still gives about 25% upside with more
conservative estimates than other analystsRatio valuation gives target in high teens/low
twentiesEPS of about 28 cents in first quarter
expectedStill have dividendLowest weight in ratio
Recommended
![How much investment can financial markets cope with? A personal perspective Financial correlations: Why are stocks correlated? [structure/exogenous]](https://img.pdfslide.us/doc/110x75/56649d615503460f94a42da5/how-much-investment-can-financial-markets-cope-with-a-personal-perspective.jpg)