a division of TP ICAPa division of TP ICAP© 2018 Burton-Taylor International Consulting
Confidential – Do Not Reproduce
Knowledge Inspires SM
Financial Market
Data/Analysis
Global Share &
Segment Sizing
2018
Key Competitors
Global Market Share 2013-17
Global Segment Sizing 2013-17
Global Product Mix 2013-17
Global User Mix 2013-17
Global Institution Mix 2013-17
Information Kit

a division of TP ICAP2
© 2018 Burton-Taylor International Consulting | Confidential – Do Not Reproduce
Knowledge Inspires SM
• As a Trading, Data, Listing or Technology professional, what trends may indicate future opportunity for growth in this changing
space?
• As a user of Exchange Services or Data, which exchange is most likely to meet your Trading, Data, Listing or Technology needs?
Burton-Taylor, the world’s leading information, news and market data research and consulting firm, delivers a
comprehensive, 106-page analysis of global exchange market share, demand segmentation and vendor demographics. The
analysis is sufficiently detailed as to allow exchange trading, market data, listing or technology providers or industry analysts
to clearly understand competitive positioning currently, historically, globally, regionally and within individual demand
segments and to enable exchange services or data users to make better informed, more confident and more appropriate
trading, listing or purchase decisions, which could result in greater profitability. The report includes quantitative analysis and
detailed underlying data.
In 2017, global Exchange revenue was up 8.1% to reach USD30,744.4m.
This report allows Exchanges or industry analysts to:
• Measure the penetration and growth of competitor services
• Evaluate the past success of company and competitor actions
• Isolate and target new and changing growth opportunities
This report allows Exchange services or data users to:
• Determine the leading current, historical, regional and global
share leaders within the segments they operate
• Target a market leading vendor appropriate to their needs
Exchange Global Share & Segment Sizing 2018Key Competitors, Global Market Share 2016, Global Segment Sizing 2016, Global Market Trending 2012-16, Global Segment Trending 2012-16
Sample Findings
• Total Global Exchange Industry revenue jumped 8.1% in 2017, rising to USD30,744.4m for the year, as revenues in
Trading, Clearing & Settlement and Information Services segments support industry growth.
• Exchanges continued to see growth in Information Services revenues, with the segment recording a 9.1% increase in
revenues in 2017.
• EBIT margins in the industry remain strong, with the exchanges in this report averaging 53.6% margin, in 2017.
To subscribe to a Burton-Taylor research service please contact +1 646 201-4152. To order this report online, please visit:
http://www.burton-taylor.com/exchangereport/ and select the “Buy Report” button, on the right of the page.
Burton-Taylor International Consulting
This report will benefit:
• Exchange & Market Data Industry
Analysts
• Private Equity Firms
• Investment Bankers
• Exchange Listing
Professionals
• Exchange Trading
Professionals
• Trading Venue Professionals
• Exchange Technology
Professionals
• Strategists
• Market Data Vendors
• Product Managers
• Marketers
• Sales Managers
Details
Report Includes:
• Fifteen company “Market
Sheets”, each showing
estimated global share,
regional distribution, five-
year performance
estimates, estimated
revenue by segment and
important business
demographics
• Five-year global market
share, trend and growth
data for each of the
companies included in the
Market Sheets
• Exclusive Burton-Taylor
“Chronicles”, detailing the
historic key events for each
of the companies included
in the Market Sheets.
• Five-year segment sizing
and five-year trend and
growth data for the major
demand segments driving
growth in the Americas,
EMEA and Asia
• All underlying spreadsheet
data and assumptions
(Enterprise distribution
subscribers/buyers only)
Report Purchase Includes:
• Two hardcopies
• Report download in PDF
format
Report prices: see table for
options, next slide
+1 646 201-4152

a division of TP ICAP3
© 2018 Burton-Taylor International Consulting | Confidential – Do Not Reproduce
Knowledge Inspires SM
Burton-Taylor International Consulting
Company Market Sheet Sample Market Share Sample Segment Growth Sample
Report Content Complete
• Fifteen company “Market Sheets” showing estimated global share, regional distribution, five-year performance trend and business
demographics:
✓ included
• ASX Group
• B3
• Bolsas y Mercados Españoles (BME)
• Bolsa Mexicana de Valores (BMV Group)
• Chicago Board Options Exchange (CBOE)
• CME Group
• Deutsche Boerse
• Euronext NV
• Hong Kong Exchanges & Clearing (HKEx)
• Japan Exchange Group (JPX)
• Intercontinental Exchange (ICE)
• London Stock Exchange Group (LSEG)
• NASDAQ OMX
• Singapore Exchange (SGX)
• TMX Group
• Five-year segment sizing and trend data for the major Exchange industry segments, including: ✓ Included• Trading, Clearing & Settlement
• Information Services
• Listings & Issuer Services
• Market Technology & Access
• Other Business Activities
• Regional breakdowns of all revenue across the major Exchange industry segments within: ✓ Included
• Americas
• EMEA
• Asia
• Report Pricing – PDF Only – Up to five users within the same company may share this report USD9,500
• Report Pricing – PDF AND ALL UNDERLYING SPREADSHEET DATA – Enterprise distribution within the same company USD21,850
• Subscription Pricing – For Burton-Taylor Subscription Service Pricing Please contact [email protected] or call +1 646 201-4152
Orders
Report prices: see table at
right for pricing options
+1 646 201-4152
www.burton-taylor.com
Important Sharing Details:
• Burton-Taylor subscriptions
or reports may be
purchased EITHER with
rights to be shared by UP
TO FIVE USERS WITHIN A
SINGLE ORGANIZATION
OR with rights to be shared
WITHIN A SINGLE
ENTERPRISE
• Only ENTERPRISE
subscribers/buyers receive
both the report PDF AND
the underlying spreadsheet
data
• Purchasers wishing to
share B-T reports or data
with users outside the
purchasing organization
should contact
questions@burton-
taylor.com for pricing
• Purchasers wishing to
reprint or redistribute B-T
reports or data in
marketing, regulatory filing
or other public venues
should contact
questions@burton-
taylor.com for pricing
Exchange Global Share & Segment Sizing 2018Key Competitors, Global Market Share 2017, Global Segment Sizing 2017, Global Market Trending 2013-17, Global Segment Trending 2013-17

a division of TP ICAP4
© 2018 Burton-Taylor International Consulting | Confidential – Do Not Reproduce
Knowledge Inspires SM
About the Authors
Author Biography
David Tabaka David Tabaka joined Burton-Taylor International Consulting in October 2017 as an Analyst. David brings more than a decade of experience in research,
analysis, report generation and consulting. He is responsible for supporting the creation, development and maintenance of reports across the Company’s
verticals.
Prior to joining Burton-Taylor, Mr. Tabaka was a Senior Analyst at NextSteps Capital, a lower middle market private equity firm based in Alexandria, VA,
and its sister company, NextSteps Research, a consulting firm specializing in intellectual property research and analysis. In this capacity, Mr. Tabaka was
responsible for conducting research across a broad array of technologies; analyzing companies, industries and technology sectors, and supporting the
firm’s consulting business.
Mr. Tabaka carries an MBA from The Citadel in Charleston, South Carolina and a Bachelor’s degree from George Mason University in Fairfax, Virginia.
Andy Nybo Andy Nybo is a Director at Burton-Taylor International Consulting and, has more than 30 years’ experience in research and technology in global capital
markets. Andy joined Burton-Taylor in March 2017 and is responsible for its Exchange vertical, focusing on how competitive pressures are forcing shifts in
business models and strategic initiatives of exchanges as they seek to expand revenue across multiple business segments.
Mr. Nybo joined Burton-Taylor from TABB Group where he was a managing director in its research practice. At TABB he was responsible for managing
TABB’s listed derivatives practice focusing on listed and OTC securities markets examining how regulation, technology and shifting investor behaviors
impact global derivatives market structure. Andy has written numerous studies on derivatives markets with a particular focus on technology, market
structure and how the buy side and sell side are adapting to the changing environment.
Mr. Nybo presents regularly at a wide range of industry conferences and provides commentary for media outlets including Bloomberg TV, CBS, CNBC,
Fox Business News and Reuters TV. He also has been quoted extensively in major business publications such as The Wall Street Journal, The New York
Times, and the Financial Times.
Mr. Nybo is a member of the Board of Governors of the Security Traders Association and a member of its Listed Options Committee. He also has been a
Board Member of the Carolina Securities Traders Association since 2012.

a division of TP ICAP5
© 2018 Burton-Taylor International Consulting | Confidential – Do Not Reproduce
Knowledge Inspires SM
• This report carries distribution rights within only the purchasing organization. Under a
standard purchase, the purchaser may:• Distribute the full text of the report and any accompanying materials to up to 5 individuals within the
purchasing organization.
• Distribute limited extracts from the report, with due copyright attribution and noting of distribution
restrictions, to senior management within the purchasing organization and/or within its immediate
parent entity.
• The following usage rights are NOT permitted without prior written authorization of Burton-
Taylor International Consulting and payment of additional distribution fees as agreed from
time to time:• Enterprise-wide internal distribution of the report or any accompanying materials, in whole or in part.
• External publication or dissemination of the report or any accompanying materials, in whole or in part,
in any form, including sharing of the report or any accompanying or extracted or derived material with
any external advisors, potential investors, consultants or clients.
• To acquire enterprise, data sharing or external distribution rights to content in this report,
please contact [email protected].
• References to data in this report must be attributed to “Burton-Taylor International
Consulting”.
Important – Distribution Rights
a division of TP ICAP6
© 2018 Burton-Taylor International Consulting | Confidential – Do Not Reproduce
Knowledge Inspires SM
• Executive Summary Slide 6
• Report Overview Slide 8
• Global Exchanges Market Share Slide 11• Key Findings – Global Exchanges Market Slide 12
• Exchanges – Share Trending Slide 13
• Exchanges – Market Share 2017 Slide 14
• Exchanges – Company Growth Slide 15
• Key Competitors Slide 16• Key Findings – Key Competitors Slide 17
• Competitive Analysis – ICE Slide 18
• Competitive Analysis – CME Group Slide 22
• Competitive Analysis – Deutsche Boerse Slide 26
• Competitive Analysis – LSE Group Slide 30
• Competitive Analysis – Nasdaq Inc. Slide 34
• Competitive Analysis – HKEx Slide 38
• Competitive Analysis – B3 Slide 42
• Competitive Analysis – JPX Slide 46
• Competitive Analysis – Cboe Global Markets Slide 50
• Competitive Analysis – ASX Group Slide 54
• Competitive Analysis – Euronext NV Slide 58
• Competitive Analysis – SGX Slide 62
• Competitive Analysis – TMX Group Slide 66
• Competitive Analysis – BME Slide 70
• Competitive Analysis – BMV Group Slide 74
• Global Exchanges Segment Size Slide 78• Key Findings – Global Segment Sizing Slide 79
• Exchanges – Segment Growth Slide 80
• Exchanges – Segment Trending Slide 81
• Exchanges – Segment Sizes 2017 Slide 82
• Detailed Segment Analysis Slide 83• Exchanges – Trading, Clearing and Settlement Trending Slide 84
• Exchanges – Trading, Clearing and Settlement Share 2017 Slide 85
• Exchanges – Information Services Trending Slide 86
• Exchanges – Information Services Share 2017 Slide 87
Table of Contents

a division of TP ICAP7
© 2018 Burton-Taylor International Consulting | Confidential – Do Not Reproduce
Knowledge Inspires SM
• Detailed Segment Analysis (continued)• Exchanges – Listing and Issuer Services Trending Slide 88
• Exchanges – Listing and Issuer Services Share 2017 Slide 89
• Exchanges – Market Technology and Access Trending Slide 90
• Exchanges – Market Technology and Access Share 2017 Slide 91
• Exchanges – Other Business Trending Slide 92
• Exchanges – Other Business Share 2017 Slide 93
• Reference Slide 94• References – Methodology & Assumptions Slide 95
• References – Segment Definitions Slide 96
• References – Underlying Company Data Slide 97
• About the Authors Slide 102
Table of Contents
a division of TP ICAP8
© 2018 Burton-Taylor International Consulting | Confidential – Do Not Reproduce
Knowledge Inspires SM
Company Market Sheet – TMX Group
Add: A
dvanced d
ecis
ion d
ata
TM
mark
et analy
sis
Burt
on-T
aylo
r In
tern
ational C
onsultin
g
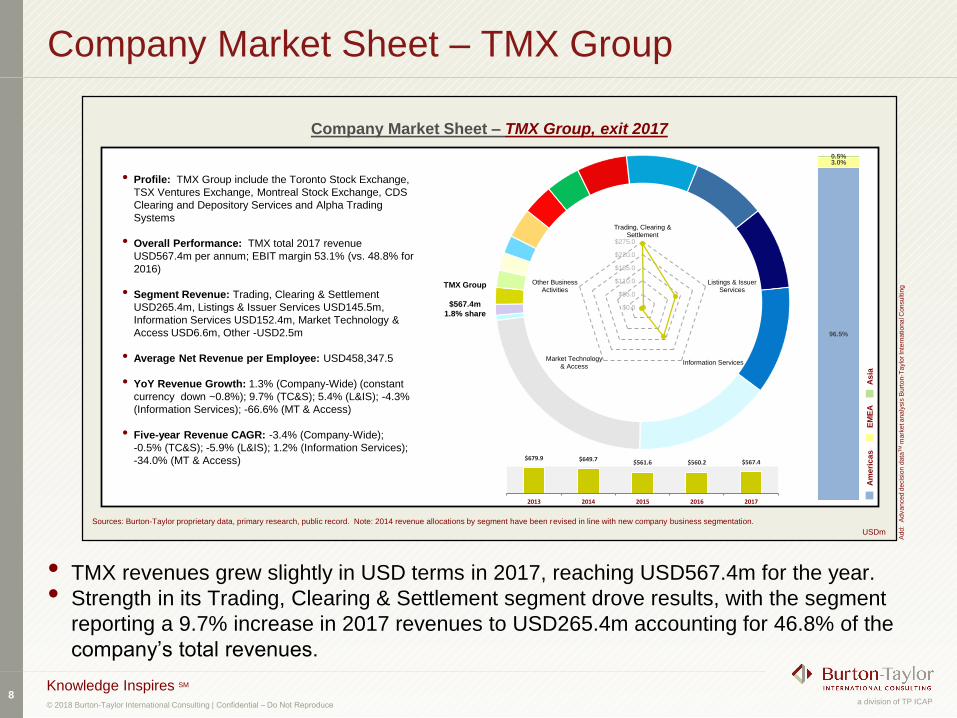
Company Market Sheet – TMX Group, exit 2017
• Profile: TMX Group include the Toronto Stock Exchange,
TSX Ventures Exchange, Montreal Stock Exchange, CDS
Clearing and Depository Services and Alpha Trading
Systems
• Overall Performance: TMX total 2017 revenue
USD567.4m per annum; EBIT margin 53.1% (vs. 48.8% for
2016)
• Segment Revenue: Trading, Clearing & Settlement
USD265.4m, Listings & Issuer Services USD145.5m,
Information Services USD152.4m, Market Technology &
Access USD6.6m, Other -USD2.5m
• Average Net Revenue per Employee: USD458,347.5
• YoY Revenue Growth: 1.3% (Company-Wide) (constant
currency down ~0.8%); 9.7% (TC&S); 5.4% (L&IS); -4.3%
(Information Services); -66.6% (MT & Access)
• Five-year Revenue CAGR: -3.4% (Company-Wide);
-0.5% (TC&S); -5.9% (L&IS); 1.2% (Information Services);
-34.0% (MT & Access)
Sources: Burton-Taylor proprietary data, primary research, public record. Note: 2014 revenue allocations by segment have been revised in line with new company business segmentation.
Am
eri
ca
sE
ME
AA
sia
USDm
• TMX revenues grew slightly in USD terms in 2017, reaching USD567.4m for the year.
• Strength in its Trading, Clearing & Settlement segment drove results, with the segment
reporting a 9.7% increase in 2017 revenues to USD265.4m accounting for 46.8% of the
company’s total revenues.
TMX Group
$567.4m
1.8% share
96.5%
3.0%0.5%
$679.9 $649.7 $561.6 $560.2 $567.4
2013 2014 2015 2016 2017
$0.0
$55.0
$110.0
$165.0
$220.0
$275.0
Trading, Clearing &Settlement
Listings & IssuerServices
Information ServicesMarket Technology
& Access
Other BusinessActivities

a division of TP ICAP9
© 2018 Burton-Taylor International Consulting | Confidential – Do Not Reproduce
Knowledge Inspires SM
• The Americas region accounted for XX.X% of global revenues in 2017, with EMEA and Asia
accounting for XX.X% and XX.X% of the total, respectively.
• ICE had greatest market share in the Americas; Deutsche Boerse in EMEA & HKSE in Asia.
Exchanges – Market Share 2017
Add: A
dvanced d
ecis
ion d
ata
TM
mark
et analy
sis
Burt
on-T
aylo
r In
tern
ational C
onsultin
g
Global Exchanges Revenue – By Region – exit 2017
0%
20%
40%
60%
80%
100%
0%
20%
40%
60%
0%
20%
40%
60%
Bloomberg
100%
80%
100%
80%
$XX,XXX.X $XX,XXX.X $XX,XXX.X
AsiaEMEAAmericasUSDm
See “References” section of this report for revenue definitions
BME
BMV
Grou
p
Other
Comm
odities
&
Energy
Interc
ontin
ental
Exch
ange
CM
E
Gro
up
Deu
tsch
e
Boe
rse
Lond
on
Stock
Exch
ange
Grou
p
NAS
DAQ B
3
A
S
X
Gr
ou
p
E
ur
on
ex
t
N
V
T
M
X
Gr
ou
p
B
M
E
B
M
V
Gr
ou
p
Ot
he
r
N
A
S
D
A
Q
B
3Interconti
nental
Exchang
e
CME
Group
Deutsc
he
Boerse
London
Stock
Exchang
e Group
NASDA
Q
Hong
Kong
Exchan
ge &
Clearin
g
B3
Japan
Exchan
ge
Group
Cboe
Global
Markets
ASX
GroupEuro
next
NV
Sing
apor
e
Exch
ange
TMX
Grou
p
BME
BMV
Grou
p
Othe
r
Invest
ment
Bankin
g
Inter
conti
nent
al
Exch
ange
CM
E
Gro
up
Deu
tsch
e
Boe
rse
N
A
S
D
A
Q
B
3
A
S
X
G
r
o
u
p
E
u
r
o
n
e
x
t
N
V
T
M
X
G
r
o
u
p
ASX GroupEuronext NVSingapore ExchangeTMX GroupBMEBMV GroupOther
Intercontinent
al Exchange
CME
Group
Deutsche
Boerse
London Stock
Exchange
Group
NASDAQ
Hong Kong
Exchange
& Clearing
B3
Japan
Exchange
Group
Cboe Global
MarketsASX GroupEuronext NVSingapore
ExchangeTMX GroupBMEBMV GroupOther
Interc
ontine
ntal
Excha
nge
CME
Grou
p
Deut
sche
Boer
se
Londo
n
Stock
Excha
nge
Group
NASD
AQ
Hon
g
Kon
g
Exch
ange
&
Clea
ring
B3
Japa
n
Exch
ange
Grou
p
Cboe
Globa
l
Marke
ts
ASX
Group
Euron
ext
NV
Singa
pore
Excha
nge
TMX
GroupBMEBMV
GroupOther
Intercontinental Exchange
CME Group
Deutsche Boerse
London Stock Exchange
Group
NASDAQ
Hong Kong Exchange &
Clearing
B3Japan Exchange Group
Cboe Global MarketsASX Group
Euronext NVSingapore Exchange
TMX GroupBME
BMV GroupOther
Intercontinental
Exchange
CME Group
Deutsche Boerse
London Stock
Exchange Group
NASDAQ
Hong Kong
Exchange &
Clearing
B3Japan Exchange
Group
Cboe Global MarketsASX Group
Euronext NVSingapore Exchange
TMX GroupBME
BMV GroupOther
Interconti
nental
Exchange
CME
Group
Deutsch
e
Boerse
London
Stock
Exchange
Group
NASDAQ
Hong
Kong
Exchan
ge &
Clearing
B3
Japan
Exchang
e Group
Cboe
Global
Markets
ASX
Group
Euronext
NV
Singapore
Exchange
TMX
Group
BME
BMV
Group
Other
Intercontinental Exchange
CME Group
Deutsche BoerseLondon Stock Exchange Group
Nasdaq Inc.
B3
Cboe Global Markets
TMX GroupBMV GroupOther
Intercontinental Exchange
CME Group
Deutsche Boerse
London Stock Exchange
Group
Nasdaq Inc.Hong Kong Exchange & Clearing
Euronext NVBME
Other
CME GroupDeutsche BoerseNasdaq Inc.
Hong Kong
Exchange &
Clearing
Japan Exchange
Group
ASX Group
Singapore
Exchange
Intercontinental Exchange
CME Group
Nasdaq Inc.
B3
Cboe Global Markets
London Stock Exchange Group
TMX Group
Other
Deutsche Boerse
London Stock Exchange Group
Intercontinental Exchange
CME Group
Euronext NV
Nasdaq Inc.
BMEHong Kong Exchange & Clearing
Other
Hong Kong Exchange &
Clearing
Japan Exchange Group
ASX Group
Singapore Exchange
Nasdaq Inc.CME Group
Deutsche Boerse
Other
BMV Group
Deutsche Boerse
B3
Cboe Global Markets
London Stock Exchange

a division of TP ICAP10
© 2018 Burton-Taylor International Consulting | Confidential – Do Not Reproduce
Knowledge Inspires SM
• B3 and Cboe Global Markets posted the greatest YoY revenue increases both due to
acquisitions, while ICE posted the largest five-year CAGR due to its 2015 acquisition of IDC.
• Remaining entities clustered closer to the YoY industry average revenue growth of XX.X%.
Exchanges – Company Growth
Add: A
dvanced d
ecis
ion d
ata
TM
mark
et analy
sis
Burt
on-T
aylo
r In
tern
ational C
onsultin
g
Global Exchanges Growth Rates – By Company – 2013-17 Trending
USDm
See “References” section of this report for revenue definitions
-15.0%/-10.0%
5.0%
25.0%
45.0%
65.0%
85.0%
-1.0% 8.0% 17.0% 26.0% 35.0%
Five-year Compound Annual Growth Rate (CAGR)
Ye
ar-
on
-Ye
ar
Gro
wth
Rate
Exchange Name, $X,XXX.X
Exchange Name, $X,XXX.X
Exchange Name, $X,XXX.X
Exchange Name, $X,XXX.X
Exchange Name, $X,XXX.X
Exchange Name, $X,XXX.X
Exchange Name, $X,XXX.X
Exchange Name, $X,XXX.X
Exchange Name, $X,XXX.X
Exchange Name, $X,XXX.X
Exchange Name, $X,XXX.X
Exchange Name, $X,XXX.X
Exchange Name, $X,XXX.X
Exchange Name, $X,XXX.X
a division of TP ICAP11
© 2018 Burton-Taylor International Consulting | Confidential – Do Not Reproduce
Knowledge Inspires SM
• This report carries distribution rights within your organization only. Under standard
distribution, you may:• Distribute the full text of the report and any accompanying materials to up to 5 individuals within your
organization.
• Distribute limited extracts from the report, with due copyright attribution and noting of distribution
restrictions, to senior management within your organization and/or within its immediate parent entity.
• The following usage rights are NOT permitted without prior written authorization of Burton-
Taylor International Consulting and payment of additional distribution fees as agreed from
time to time:• Enterprise-wide internal distribution of the report or any accompanying materials, in whole or in part.
• External publication or dissemination of the report or any accompanying materials, in whole or in part,
in any form, including sharing of the report or any accompanying or extracted or derived material with
any external advisors, investors or consultants.
• To acquire enterprise, data sharing or external distribution rights to content in this report,
please contact [email protected].
• References to data in this report must be attributed to “Burton-Taylor International
Consulting”.
Distribution Rights

a division of TP ICAP12
© 2018 Burton-Taylor International Consulting | Confidential – Do Not Reproduce
Knowledge Inspires SM
• Burton-Taylor clients command an estimated 80% of global revenue share in the market
data space and include the world’s largest Exchange groups, key government organizations
and regulatory bodies on multiple continents, five of the six largest advisory firms serving the
industry, and more than 30 of the most active private equity and investment companies
around the world…all of which using Burton-Taylor data as their industry benchmark.
• While accomplished in the Americas, Europe and Asia, and with a strategic approach that
remains generalist, B-T has developed substantial expertise in the global information,
insurance, financial services and software industries, with deep focus in North America,
China, India and Asia.
• B-T’s Hourglass AnalysisTM process provides a proven, structured yet customizable,
business consulting approach that helps companies clearly target new opportunities, define
new strategy, and plan new actions to maximize growth.
• B-T completes custom research, varying in size from small single product or market detail
reports to large global industry and competitor sizing and profiles.
• To learn more about how Burton-Taylor International Consulting can help your company
improve performance through improved Market Intelligence, Strategic Planning and
Revenue Generation activities, please call +1 646 201-4152, email: questions@burton-
taylor.com or visit www.burton-taylor.com.
Burton-Taylor International Consulting

a division of TP ICAP13
© 2018 Burton-Taylor International Consulting | Confidential – Do Not Reproduce
Knowledge Inspires SM
• The following companies have purchased services or reports from Burton-Taylor International Consulting:• 3i Private Equity
• AT Kearney
• AdmitOne Security
• Advent International
• Agility PR Solutions
• Agência Estado
• AllianceBernstein
• Altman Vilandrie & Co.
• APAX Partners
• Ardian
• Argus Group
• Argus Media
• ARIX Business Intelligence GmbH
• Asset Control
• Autonomous Research
• Bain Capital
• Bain & Company
• Bank of America Merrill Lynch
• Baseline Management
• Battery Ventures
• Berenberg
• BGC Partners
• Boston Consulting Group (BCG)
• Brown Brothers Harriman
• Bureau van Dijk
• Camgian
• Capco
• Capital Group
• CapitalIQ
• CapMan
• ChinaScope
• Cision
• CITIC
• CME Group
• Cornerstone Partners
• Credit Agricole
• Credit-Suisse
• Dalian CE
• Dealogic
• DelphX
• Deloitte
• Department of the Treasury, US Government
• Deutsche Bank
• Deutsche Boerse
• Discern Financial Services
• Dow Jones
• Dun & Bradstreet
• DZH/Great Wisdom
• Ernst & Young
• Espirito Santo Investment Bank
• Eton Park Capital Management
Burton-Taylor International Consulting
• Euronext NV
• European Central Bank (ECB)
• Evercore
• FactSet Information Systems
• Fi360
• Fir Tree Partners
• First State Investment Advisors
• Fitch
• Franchise Partners
• Francisco Partners
• FSWire
• Gartner
• GMT Capital
• Gorkana
• Goldman Sachs
• Greenwich Associates
• Gulf Capital
• GTCR
• Hearst
• IBIS Capital Partners
• IEX
• INET BFA
• Info4c
• Infomedia
• Innodata
• ICE P&A + D (ICEID)
• IPC Information Systems
• iQ media
• IRESS
• iSentia
• JPMorgan
• Jeffries
• Kantar Media
• KKR
• KPMG
• Lazard
• Lehman Brothers
• LEK Consulting
• LexisNexis
• London Stock Exchange
• Lone Pine Capital
• M. Klein and Company
• Market News International
• Markit
• Maverick Capital
• McGraw-Hill
• McGregor BFA
• McKinsey & Company
• Medialogia
• Meltwater
• Morgan Stanley
• Morningstar
• MSCI
• Mubasher
• MyNewsDesk
• NASDAQ OMX
• Navarik
• NBC Universal
• News Corporation
• Nomura
• NSE India
• NYSE
• Oliver Wyman
• Options Industry Council (OIC)
• OTC Markets
• Paprico
• Paros Capital
• Platts
• Pacific Equity Partners
• Parthenon Group
• Point Carbon
• Precise Media
• Prenax
• Pressreader
• PricewaterhouseCoopers (PwC)
• Prime Research
• Quandrant.io
• Quick
• Regulatory DataCorp
• ResponseSource
• Rimes
• RMP Media Analysis
• RBS
• Sanborn Consulting
• Sansar Capital
• Scout Analytics
• Societe Generale Group (SocGen)
• Standard & Poor’s
• State Council Information Office, China (SCIO)
• SIX Financial Information
• State Street
• Steadfast Financial
• Strategy&
• Summit Partners
• Sumscope
• SunGard
• Taxware
• The New York Times
• Themarkets.com
• Thomson Reuters
• TMX Group
• Tsinghua University
• TrendKite
• TP ICAP
• UBS
• VantagePoint Venture Partners
• Vista Equity Partners
• Vuelio
• vwd
• Warburg Pincus
• Wipro
• WPP
• Xignite
• Zignal Labs
• Dozens of private equity, investment & consulting
firms from around the world, who have chosen to
remain anonymous
a division of TP ICAP14
© 2018 Burton-Taylor International Consulting | Confidential – Do Not Reproduce
Knowledge Inspires SM
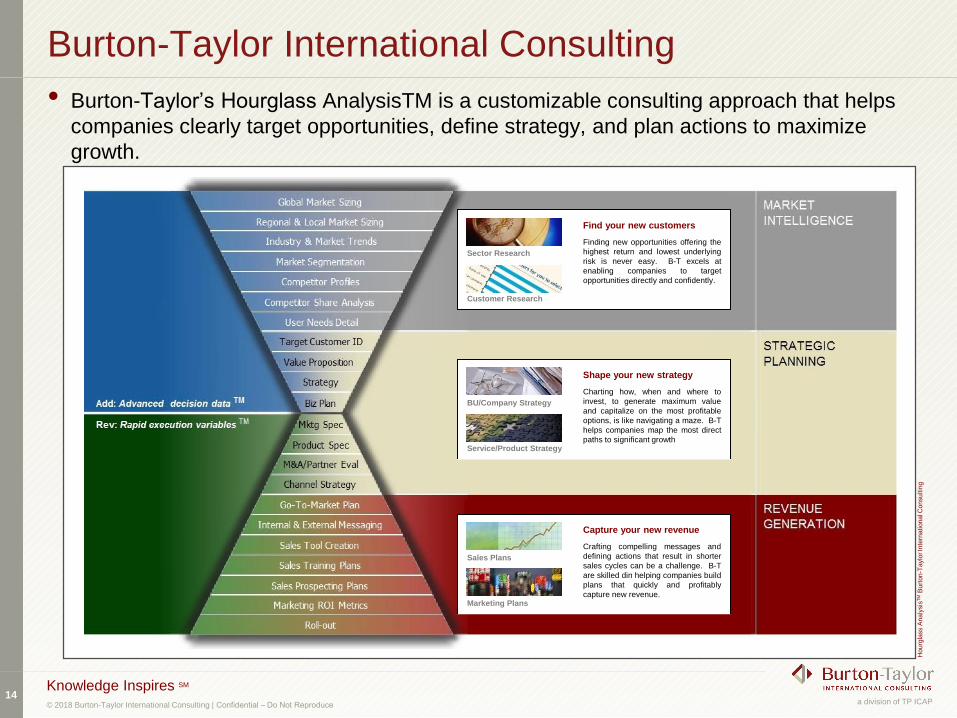
• Burton-Taylor’s Hourglass AnalysisTM is a customizable consulting approach that helps
companies clearly target opportunities, define strategy, and plan actions to maximize
growth.
Burton-Taylor International Consulting
Hourg
lass A
naly
sis
TM
Burt
on-T
aylo
r In
tern
ational C
onsultin
g
Sector Research
Find your new customers
Finding new opportunities offering the
highest return and lowest underlying
risk is never easy. B-T excels at
enabling companies to target
opportunities directly and confidently.
Customer Research
BU/Company Strategy
Shape your new strategy
Charting how, when and where to
invest, to generate maximum value
and capitalize on the most profitable
options, is like navigating a maze. B-T
helps companies map the most direct
paths to significant growthService/Product Strategy
Sales Plans
Capture your new revenue
Crafting compelling messages and
defining actions that result in shorter
sales cycles can be a challenge. B-T
are skilled din helping companies build
plans that quickly and profitably
capture new revenue.Marketing Plans

a division of TP ICAP15
© 2018 Burton-Taylor International Consulting | Confidential – Do Not Reproduce
Knowledge Inspires SM
• Available Burton-Taylor industry coverage: • Anti-Money Laundering (AML)/Know-Your-Customer (KYC) Market Data/Information Industry
› Burton-Taylor delivers the industry’s only comprehensive analyses of the Anti-Money Laundering
(AML)/Know-Your-Customer (KYC) data/information industry. View All AML/KYC Reports or Download
Sample Slides and the Information Kits
• Exchange Industry› Burton-Taylor delivers comprehensive analyses of global exchange market share, demand segmentation
and vendor demographics. View All Exchange Reports or Download Sample Slides and the Information Kits
• Financial Market Data/Analysis Industry› Burton-Taylor delivers comprehensive analyses of market data supplier share, demand segmentation,
vendor demographics, product segmentation, user segmentation and institutional buyer
segmentation. View All Financial Market Data/Analysis Reports or Download Sample Slides and the
Information Kits
• Media Intelligence and Public Relations Information & Software Industry› Burton-Taylor delivers comprehensive analyses of media intelligence and public relations information &
software supplier share, demand segmentation, vendor demographics and product buyer’s guides. View All
Media Intelligence/PR Reports or Download Sample Slides and the Information Kits
• For a list of all available Burton-Taylor reports, please visit the Research area of Burton-
Taylor.com.
Burton-Taylor International Consulting
Recommended