HAL Id: hal-00633806https://hal.archives-ouvertes.fr/hal-00633806
Submitted on 20 Oct 2011
HAL is a multi-disciplinary open accessarchive for the deposit and dissemination of sci-entific research documents, whether they are pub-lished or not. The documents may come fromteaching and research institutions in France orabroad, or from public or private research centers.
L’archive ouverte pluridisciplinaire HAL, estdestinée au dépôt et à la diffusion de documentsscientifiques de niveau recherche, publiés ou non,émanant des établissements d’enseignement et derecherche français ou étrangers, des laboratoirespublics ou privés.
Financial Constraints in China: the conditioning effectof FDI and State-Owned corporate sectorSandra Poncet, Walter Steingress, Hylke Vandenbussche
To cite this version:Sandra Poncet, Walter Steingress, Hylke Vandenbussche. Financial Constraints in China: the condi-tioning effect of FDI and State-Owned corporate sector. China Economic Review, Elsevier, 2010, 21(3), pp.411-422. <10.1016/j.chieco.2010.03.001>. <hal-00633806>
1
Financial Constraints in China: the conditioning effect of FDI and State-Owned corporate sector♠
Sandra Poncet1, Walter Steingress2 and Hylke Vandenbussche3
ABSTRACT
Using a unique micro-level data-set over the period 1998-2005 on Chinese firms, this
paper presents empirical findings on the presence of credit constraints. Our findings
are threefold. Firstly, private Chinese firms are credit constrained while State-owned
firms and foreign-owned firms in China are not; Secondly, the geographical and
sectoral presence of foreign capital alleviates credit constraints faced by private
Chinese firms. Thirdly, geographical and sectoral presence of state firms aggravates
financial constraints for private Chinese firms (“crowding out”).
JEL Classification: E22; G32 Keywords: Investment-cashflow sensitivity, China, firm level data, foreign direct investment
1. Introduction
There exits considerable evidence that financial constraints are an impediment to
investment and growth of firms (Stein, 2003; Hubbard, 1998). This is even more
important in developing countries, where the access to financial markets is a crucial
♠ We thank seminar participants at the Université catholique de Louvain doctoral workshop 2008, RIEF doctoral meetings 2008, EDP jamboree at the Paris School of Economics and at LICOS Katholieke Universiteit Leuven. We are grateful to Jérôme Héricourt and Jozef Konings for their comments and Veerle Slootmakers and John Hutchinson for help with the data. We gratefully acknowledge financial support of the Center of Excellence pole of the Katholieke Universiteit Leuven and for financial support from the Belgian French-speaking Community (convention ARC 09/14-019 on “Geographical Mobility of Factors”). 1Paris School of Economics (Université Paris 1) and CEPII, [email protected] 2Boston University, US, [email protected] 3Corresponding author, Université catholique de Louvain, CORE, B-1348 Louvain-la-neuve, Belgium; T :+321047 43 16 ; F : +3210 47 43 01 ; [email protected]
2
determinant for the growth and survival of firms. Financial constraints can arise from
various kinds of sources. The literature identifies informational asymmetries and
agency problems as the most important factors influencing the allocation process of
financial resources to firms.4
Capital market imperfections are believed to be very present in China. By law, the
largest Chinese banks, which were predominantly state banks, were until 1998
instructed not to lend to private firms. This was embedded in the political notion that
private firms do not rank high in terms of political status. This “political pecking
order” in the allocation of credit where private Chinese firms were disadvantaged
should in principle have been alleviated since 1998. But casual evidence suggests that
credit constraints for private firms are still present which may impede the growth of
the Chinese economy (Huang, 2003).5
Several macro studies have emphasized the prevalence of capital market
imperfections allocation in China6, with only a few studies at the micro-level.7 The
macro-level studies analyze the links between finance and growth in China and
characterize it as a counterexample to the positive relationship generally found
between finance and growth in the literature. Indeed, in spite of financial system
flaws, China has one of the fastest growing economies.
The analysis in this paper is a micro-level study that extends the literature in several
dimensions. First, it offers an explanation for the conundrum of firm growth in China
despite evidence of credit constraints. We look at the presence of foreign capital and
how it can mitigate the financial constraints experienced by Chinese private firms.
Our evidence suggests that foreign firms in China are not credit constrained
(Naughton, 2007). While we can not formally test the channels of credit, foreign firms
may be less dependent on the local financial system in China since they can rely on
outside sources to finance their growth. Either they can continue to have access to
capital markets abroad or rely on intra-firm financial transfers provided by affiliated
firms abroad. Our results suggest that the stronger the presence of foreign capital in a
sector or region, the lower the financial constraints faced by Chinese private firms
operating in the same region and sector. This indicates that the presence of foreign
capital somehow allows Chinese private firms to bypass both the financial and legal
4 See Stein (2003) and Hubbard (1998) for a review. 5 Capital market imperfections may respond with a lag to institutional and legal changes. 6 Allen (2005), Levin (2005), Guariglia and Poncet (2008).
3
obstacles that they face at home. This paper does not argue that the presence of
foreign firms can affect the lending policies of local banks.8 Instead, its findings are in
line with the hypothesis put forward by Huang (2003) that FDI mitigates the credit
constraints faced by Chinese private firms due to inefficiencies in the banking sector
for which only macro-level evidence existed so far (Guariglia and Poncet, 2008). Our
results for China differ from earlier findings in the literature. For instance Harrison
and McMillan (2003) for the Ivory Coast find that the presence of foreign firms
crowds local firms out of domestic capital markets. Our results suggest that for China
this is not the case. For China we find that the geographical presence of foreign firms
alleviates credit constraints of private Chinese firms. While our data do not permit us
to identify the channel of this spillover, one possibility is that foreign firms extend
more trade credit to local Chinese firms. Indeed when we introduce the amount of
trade credit of Chinese firms into the analysis we find that private firms with access to
trade credit are less contrained which appears consistent with that explanation.
In contrast, the presence of state firms in the local economy does appear to have
“crowding out” effects since we find that state firms’ presence aggravates the
financial constraints of private Chinese firms.
From a methodological point of view we follow Harrison et al. (2004). We
introduce external financing costs in the investment Euler equation to evaluate the
magnitude of financial constraints in China. Sensitivity of investment to cash flow is
associated with financial constraints. In perfect capital markets and in the absence of
credit constraints, cash flow should not affect future investment. If results show
otherwise this can be interpreted as an indication that capital markets are not perfect
and that credit constraints exist.
Our work is related to the existing literature on capital market imperfections and
firm investment in transition and developing economies (see Konings et al. (2003),
Lizal and Svejnar (2002) and Harrison and McMillan (2003)).
In the first part of the paper, we analyze whether different types of firm ownership
face a different degree of financial constraints. In the second part, we investigate how
Foreign Direct Investment (FDI) and the presence of state firms interact with the
credit constraints that appear to exist for Chinese private firms. More precisely we test
7 Héricourt and Poncet (2008), Guariglia, Liu and Song (2008). 8 This paper focuses on the role of FDI as an alternative source of funding to loans from the banking system. It does not make any attempt to study the various ways by which the presence of foreign firms
4
whether the geographical and sectoral presence of foreign investment in China plays
an important role in modulating private firms’ credit constraints and similarly for the
geographical and sectoral presence of state-owned firms.
Our analysis is carried out on Chinese firm-level data originating from the data set
ORIANA9 covering more than 20,000 Chinese firms over the period 1998-2005. We
should point out that our empirical strategy should not be interpreted as a direct test of
the political pecking order theory.10 Our findings merely confirm that private firms
face the highest degree of financial constraints, whereas State Owned Enterprises
(SOE) and foreign firms do not experience any financial constraints which is
consistent with the predictions from the political pecking order hypothesis. We find
that the sensitivity of private firms' investment to cash flow softens in a context of
abundant foreign investment. This suggests that the presence of foreign firms in China
improve the functioning of capital markets for private Chinese firms, which is good
for growth. In contrast, credit constraints for private Chinese firms are reinforced
when the presence of state-owned firms is strong. These results obtained over the
period 1998-2005 suggest that the ongoing restructuring of SOE may help to
circumvent credit constraints and can boost the investment and growth of private
firms.
At this point we should point out some of the limitations of our analysis. In our
empirical strategy we use firm-level cash flow as a regressor in an investment
equation. But cash flow is likely to be an endogenous variable. To account for this we
follow the literature in using an IV approach using lagged values of the endogenous
variable. Lagged values are however a-theoretical instruments and not ideal but due to
the lack of a good alternative set of instruments, most other studies have used lagged
values. An additional difficulty we face is that the panel dimension of our data is
relatively short. This limits the number of lags we can use as instruments in the IV
identification strategy that we pursue. These limitations have to be kept in mind in
considering our findings.
The remainder of this paper is organized as follows. Section 2 provides a
theoretical justification for our measure of financing constraints. Section 3 describes
can affect the lending policies of local banks. 9 This database contains detailed financial information on contact information, activities, ownership and financing. 10 To make definite statements on ‘the political pecking order’ one would need to compare the actual financing decisions of state-owned, foreign, and private firms, which this paper does not do.

5
the data. Section 4 presents estimation results of the baseline model which tests
whether firms face different credit constraints depending on their capital ownership
(private, foreign or State-owned status). Section 5 allows for provincial and industry
heterogeneity and tests whether direct foreign investment and state presence affects
the credit constraints faced by private firms. Section 6 concludes.
2. Theoretical background
The central idea of the literature on financing constraints is that investment should not
be determined by a firm’s net worth or internal funds but only by the firm’s expected
future profitability. The seminal work of Modigliani and Miller (1958) indeed
suggests that in perfect capital and credit markets the financing decision of a firm is
irrelevant for its investment behavior and vice-versa. However, in the presence of
capital market imperfections, financing constraints will be reflected in firms’
investment decisions. Empirically, financing constraints could be identified via the
sensitivity of investment to internal funds. A number of recent papers have called into
question the validity of using investment-cash flow correlations as proxies for
financing constraints (Kaplan and Zingales,1997; Gomes, 2003; Alti, 2003).
However, many authors still support the use of investment-cash flow sensitivity as an
indicator of credit constraints (Fazzari et al., 2000 and Allayannis and Muzomdar,
2004). While it is true that no theoretical consensus has been reached and that the
relationship between investment and cash flow sensitivities continues to be an
important empirical question, numerous recent results and survey evidence support
the intuition that investment-cash flow sensitivities are indeed a reflection of the
extent of financing constraints (Love, 2003 and Beck et al., 2005). As explained by
Harrison et al. (2004), most papers which question this methodology relate more
directly to the Q-model of investment rather than the Euler equation model (although
some of the criticisms apply to both models).
For this purpose we estimate a version of the Euler equation, combining insights
from Whited (1992), Bond and Meghir (1994) and Love (2003). The Euler equation
characterizes a firm’s optimal investment path and relates it to marginal adjustment
costs in adjacent periods. A credit constrained firm behaves as if it had a higher
discount rate for a given level of today’s adjustment costs. Ceteris paribus,
constrained firms will then substitute investment tomorrow for investment today. We
6
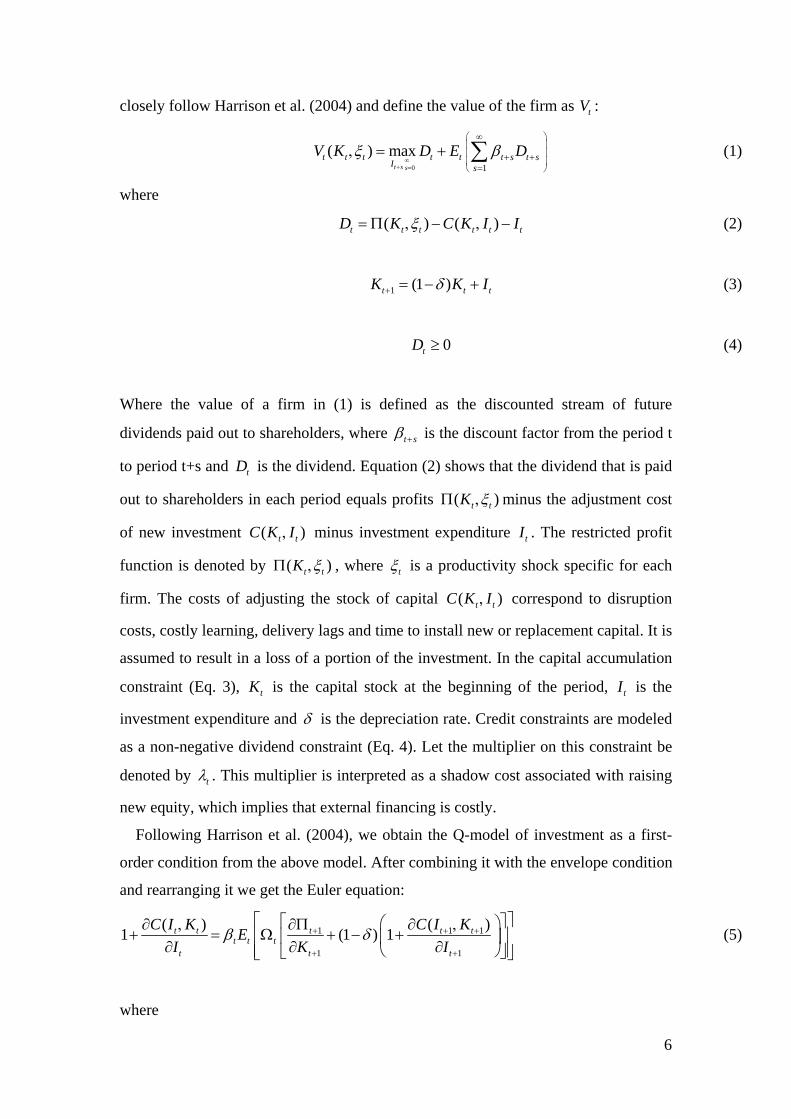
closely follow Harrison et al. (2004) and define the value of the firm as tV :
0 1
( ) maxt s s
t t t t t t s t sI s
V K D E Dξ β∞
+ =
∞⎛ ⎞⎜ ⎟⎜ ⎟+ +⎜ ⎟
=⎝ ⎠
, = + ∑ (1)
where
( ) ( )t t t t t tD K C K I Iξ= Π , − , − (2)
1 (1 )t t tK K Iδ+ = − + (3)
0tD ≥ (4)
Where the value of a firm in (1) is defined as the discounted stream of future
dividends paid out to shareholders, where t sβ + is the discount factor from the period t
to period t+s and tD is the dividend. Equation (2) shows that the dividend that is paid
out to shareholders in each period equals profits ( )t tK ξΠ , minus the adjustment cost
of new investment ( )t tC K I, minus investment expenditure tI . The restricted profit
function is denoted by ( )t tK ξΠ , , where tξ is a productivity shock specific for each
firm. The costs of adjusting the stock of capital ( )t tC K I, correspond to disruption
costs, costly learning, delivery lags and time to install new or replacement capital. It is
assumed to result in a loss of a portion of the investment. In the capital accumulation
constraint (Eq. 3), tK is the capital stock at the beginning of the period, tI is the
investment expenditure and δ is the depreciation rate. Credit constraints are modeled
as a non-negative dividend constraint (Eq. 4). Let the multiplier on this constraint be
denoted by tλ . This multiplier is interpreted as a shadow cost associated with raising
new equity, which implies that external financing is costly.
Following Harrison et al. (2004), we obtain the Q-model of investment as a first-
order condition from the above model. After combining it with the envelope condition
and rearranging it we get the Euler equation:
1 1 1
1 1
( ) ( )1 (1 ) 1t t t t tt t t
t t t
C I K C I KEI K I
β δ+ + +
+ +
⎡ ⎤⎡ ⎤⎛ ⎞∂ , ∂Π ∂ ,+ = Ω + − +⎢ ⎥⎢ ⎥⎜ ⎟∂ ∂ ∂⎢ ⎥⎝ ⎠⎣ ⎦⎣ ⎦
(5)
where
7
111
tt
t
λλ++
Ω =+
(6)
In (5), 1
1
t
tK+
+
∂Π∂ is the marginal profit of capital, i.e. the contribution of an extra unit of
capital to the firm’s profits. In the Euler equation the factor tΩ is the relative shadow
cost of external finance in periods t and t+1 and serves as a proxy for the degree of
financing constraints. If 1 0t tλ λ+ = = then tΩ =1, we are in a perfect capital market
and the external costs of financing is 111. If the shadow cost of external funds is
higher in period t than in period 1t + , so 1Ω < , then current funds are relatively
more expensive today than tomorrow. In this case we say that the firm is financial
constrained. If the shadow cost of current funds tλ is less expensive today than
tomorrow ( 1Ω > ), then the firm will invest today.12 Firms do not face financial
constraints if the shadow cost of investment 1 0t tλ λ+ = = for all time periods.
It is important to stress that there is no implicit assumption on the source of
external funds. The model is consistent with the Chinese specificity that private
domestic firms rely principally on informal sources of finance that are based on
reputation and relationships such as loans from family and friends and from private
(unofficial) credit agencies (Allen et al., 2005).13 Common to the literature is that
financial constraints are measured by the sensitivity of investment with respect to
internally generated funds. The sensitivity of investment to internal generated funds
such as cash flow, is a well reported fact in the literature (Fazzari et al., 1988;
Carpenter and Peterson, 2002). We assume that firms make their decision for period t
investment at the beginning of the year. Therefore the decisive value of cash flow is in
period 1t − since the firm gauges its previous cash flow to determine the current
investment decision.
In this paper we focus on institutional imperfections in Chinese credit markets and
the hypothesis that access to credit is based on ownership i.e. the political pecking
11 Another possibility would be if 1 0t tλ λ+ = ≠ , then current firms are constrained by the same factor in period
t and 1t + . Since the shadow cost depends also on the productivity shock tξ it is unlikely that 1t tλ λ+ = in all periods, although for some firms in some periods this is possible. Still we argue as in Love (2003) that in estimating ownership-wide constraints given firm specific investment opportunities such a situation is unlikely to occur. 12 We thank an anonymous referee for raising this issue.
8
order that leads to a gap between the costs of internal versus external financing. To
test for different ownership effects, we split our sample between private, state-owned
and foreign companies.
To derive the estimation equation, we assume a constant returns to scale production
function with quadratic adjustment costs of investment. Similar to the previous
literature, Harrison et al. (2004) and Love (2003), we include the lagged investment to
capital ratio , 1
1
i t
i t
IK
−
, −
⎛ ⎞⎜ ⎟⎜ ⎟⎝ ⎠
in the cost function to allow for a correlation between the
previous and current investment decision. We expect the labor to capital ratio ( L K/ )
to proxy for the marginal product of profits with respect to capital as it is conceivable
that higher investment leads to a higher capital to labor ratio. Moreover, if we assume
rational expectations, we can replace the future realizations of the variables with the
real terms together with a measurement error i tε , . Firm-specific investment
oppportunies are approximated by the change in turnover over capital ,
,
i t
i t
TUK
⎛ ⎞∆⎜ ⎟⎜ ⎟⎝ ⎠
. Our
main variable of interest is the cash-flow ratio , ,i pk tForeign_Firm whose sign and
significance is our measure of credit constraints. Given our assumptions, the empirical
equation that we seek to estimate has the following standard specification:
1 11 2 3 4
1 1
it it it it itk t i t
i t i t i t i t i t
I I L TU CFK K K K K
β β β β µ ε− −, ,
, , − , , , −
∆= + + + + + (7)
In the above equation, I denotes gross investment in fixed assets,14 L is the number
of employees, K is the level of the real capital stock (proxied by total assets), ∆TU
corresponds to the change in turnover and CF stands for cash flow. The subscripts i ,
k and t denote the firm, industry and time period, respectively; and k tµ , captures the
sector-time specific effects, i tε , is the error term. We expect that in (7) current
investment is negatively related to past investment and to the employment over assets
ratio. We further expect current investment to be positively related to favorable
business prospects captured by the current change in turnover over assets ratio. As we
14 It is defined as the change in the tangible fixed assets of firm i between time t-1 and time t plus the firm specific depreciation rate of capital. Almeida and Campello (2006) argue that excluding intangible assets (patents, copyrights, trademarks, etc) from the definition of investment reduces measurement errors of investment.
9
discussed above, we measure financing constraints by the sensitivity of investment to
cash flow. We argue that the larger this sensitivity, the more constrained the firm is
since it has to rely on its internal funds to finance its investment. If the political
pecking order holds, it would show up in the empirics as an insignificant coefficient
on the cash flow indicator ( 4β ) when the sample is restricted to state-owned or to
foreign firms, but a positive and significant coefficient when private firms are
considered since they supposedly have least access to external funds. While our
empirical strategy should not be interpreted as a direct test, our findings do appear to
be in line with what the political pecking order predicts.
To study the contingency of credit constraints for Chinese private firms, we include
variables measuring the presence of foreign investment and state-firms by province
and by province/sector and interact those with our proxies for credit constraints.
3. Data
The data that we use are firm-level data originating from the Oriana data set.15 This
database contains detailed financial information on contact information, activities, and
ownership of more than 20,000 Chinese firms in the time period of 1998 to 2005. Our
data were collected by local governments based on the Accounting Standards for
Business Enterprises (ASBE) system promulgated by the Ministry of Finance in 1992.
We distinguish among different types of legal ownership: State and Collective Owned
Enterprises, Foreign Invested Enterprises, and private Chinese companies. A firm is
classified by Oriana as a State Owned Enterprise (SOEs) if the ownership share of the
state (no matter whether direct or indirect) is more than 25 percent.16
The companies included in the database are either publicly listed or satisfy at least
one of the following size criteria: minimum number of employees is 150, or annual
turnover and total assets are at least 10 million and 20 million USD, respectively. For
the purpose of this study, we retrieved detailed information on 23,613 firms in the
People’s Republic of China. Although no data exist on the extent of informal sources
of financing and the types of financing (actions, bonds, loans…), one should note that
our methodology of eliciting credit constraints through the correlation of debt and
cash flows with investment would still be relevant.
15 Oriana dataset is made available by Bureau van Dijk. It is constructed from Huaxia credit. 16 See Huygebaert et al. (2006).
10
As far as data cleaning is concerned, firm-level data from transition and developing
economies often suffer from accounting deficiencies, and usually contain missing
values and outlier observations that may bias the estimated coefficients. After
eliminating the observations that were based on irregular reports or unreasonable data
values in the levels of variables (such as negative values for material costs), we have a
total of 22,311 observations from 14,967 firms.17
In our empirical estimations we pool SOEs with urban and rural collectively owned
enterprises (COEs). The collective-owned enterprize is an independent economic
organization and legal corporation with means of production and property belonging
to laboring masses and managed by local government. COEs should rank quite high in
the political pecking order and are expected to receive better access to external funds
than private firms which is why we consider them together with SOEs in the
analysis.18
Private firms in our sample refer to profit-making economic organizations, which
can either be sole proprietorships, partnerships, limited liability companies, or
shareholding cooperatives.19 Foreign firms or Foreign Invested Enterprises refer to
any enterprise domiciled in mainland China that has at least 25 percent of the total
equity stake of the firm owned by a foreign entity.
The construction of the sample used in our regressions is essentially driven by the
dynamic nature of our model (Eq. 7). Our sample is restricted to companies that report
in at least two consecutive years. Furthermore, we delete the upper and the lower one
percentile of the distribution of the dependent variable to get rid of outliers. We verify
that our results are robust to the deleting of the upper and the lower five percentile of
the distribution. Although this procedure excludes several hundred observations, it
does not significantly alter the main results.20
17 As far as the data coverage of our sample is concerned, a comparison of our data with the China Economic Census Yearbook 2004 reveals that the Oriana data covers 52 percent of total manufacturing sales of medium-size and large-size enterprises in China (Abraham et al., 2007). A closer look at the regional and sectoral composition of Oriana reveals that it is quite similar to the Census: 87 percent of the firms in Oriana are operating in the manufacturing sector compared to 93 percent in the Census. In the Oriana data set, as pointed out by Abraham et al. (2007), both the state sector and foreign firms are slightly over-represented: 16 percent of the firms in Oriana is owned by the state, versus 13 percent in the Census, and 36 percent (Oriana) versus 20 percent (Census) of firms are foreign-owned (including Hong Kong, Macau, and Taiwan). It is however hard to determine to which extent these differences could affect the reliability of our results. 18 Following an anonymous referee’s suggestion, we verified that findings of no credit constraints for state-owned firms were robust to the exclusion of the collective firms from the SOE category. Results are available upon request. 19 Another form of individual businesses, known as Getihu, are not included in the data set since they are by law not allowed to have more than eight employees and are thus too small to be included. 20 We thank an anonymous referee for this suggestion. Results of this alternative outlier correction procedure are
11
Table 1 reports the summary statistics of the firms used in our empirical work
according to their ownership structure. The values in column (1) represent the
statistical means together with the standard errors in (2), minimum (3) and maximum
values (4) over the sample period. In terms of ownership representation, 38% of the
total number of firms in our data are private firms, while 35% are foreign firms. State-
owned firms and collective firms represent 27% of our sample.
Insert Table 1 here
Overall, the summary statistics in Table 1 show amongst others that private
Chinese firms are smaller than SOEs, generate more internal funds and are typically
more efficient in investing their capital.
4. Investment Equation Estimates
Results for our baseline specification (7) are reported in Table 2. They are shown for
different types of ownership i.e. domestic private firms (col.1, 4 and 7), SOE firms
(col. 2, 5 and 8) and foreign firms (col. 3, 6 and 9). All regressions include sector-
level specific time dummies defined at the two-digit sector level (26 sectors) to
control for shifts in investment demand or expectations due to changes in industry-
level conditions (for example, industry-wide technology changes, industry demand
shocks, or the entry of new firms). Our main variable of interest is the coefficient on
the cash-flow. When investment significantly depends on a firm’s internally generated
cash flow, this can be regarded as an indication that the firm is credit constrained. We
estimate successively our model with OLS, IV and firm-fixed effects to check the
robustness of our results. We start by reporting OLS results in columns 1 to 3. As
conjectured, we find that private firms in China significantly rely on their cash flow to
finance their investments, which is evidence of credit constaints, while SOEs and
foreign firms do not. The results are robust to the inclusion of sector-time effects or
time effects only. However, the OLS estimates may be biased due to the endogeneity
of the cash flow, our proxy for internal finance. In columns 4 to 6 we apply an IV
technique to address this where we use the cash flow over assets in periods t-2 and t-3
as instruments.21 The results go through be it with a weaker significance of the
available upon request. 21 Javorcik and Spatareanu (2008) in addition to the cash-flow also instrument several other independent variables
12
positive coefficient on the private firms, suggesting that the endogeneity of the cash
flow is not too serious an issue. We systematically check the validity of our
instruments with Sargan’s J-test of overidentifying restrictions. Insignificant test
statistics indicate that the orthogonality of the instruments and the error terms cannot
be rejected, and thus that our choice of instruments is appropriate.22 In the case of
private firms (column 4), the overidentifying restrictions are accepted. By constrast
the Sargan test rejects the validity of our instruments for state and foreign firms, a
problem encountered also in previous work emphasizing the weakness of IV
instruments in this kind of estimations (Aghion et al. 2008). We also report the
cluster-robust F-stat form of the Cragg-Donald statistic; this statistic has been
suggested by Stock and Yogo (2002) as a global test for the presence of weak
instruments (i.e., it tests the null hypothesis that a given group of instruments is weak
against the alternative that it is strong). The test rejects if the computed statistic
exceeds the critical value. The results we obtain for weak identification tests are
overall quite satisfactory. Our instruments pass comfortably the Cragg-Donald test in
all cases since our first stage F-statistics are consistently above 10, in line with the
Staiger-Stock (1997) “rule of thumb”.
Another drawback of the OLS results presented in the first three columns of Table
2 is that some firm-level factors such as the user cost of capital are omitted.23 In
columns 7 to 9, we include firm fixed effects to control for all unobserved time-
invariant variables as in the related work of Bond and Meghir (1994) and Harrison
and McMillan (2003). It also controls for the possibility of a correlation between a
time-invariant component of the error term and the regressors which would make the
pooled OLS estimation inconsistent24. In addition we also include a squared cash-flow
term to allow for non-linearities in credit constraints. The motivation to include a
squared cash-flow term is to allow for non-linearity in the investment sensitivity to
using a GMM approach. However, due to the short time dimension of our panel we can not pursue the same approach. 22 Under the joint null hypothesis that instruments are valid instruments and that the excluded instruments are
correctly excluded from the estimated equation, the test statistic is distributed as 2χ in the number of other identifying restrictions. Significance is judged at the 10% level. 23 Another potential concern is the difficulty to properly account for firm-specific investment opportunity. So far they were approximated by the change in turnover over capital (between t-1 and t), which is likely to be a poor proxy. Firm fixed effects (together with time-varying sector level fixed effects) should mitigate the issue. In any case, we checked that our results were robust to the use of alternative proxies. We relied on the change in turnover over capital as well as the change in sales over capital over different periods (between t-1 and t as well as between t and t+1). Results available upon request confirm our main findings. 24 The inclusion of firm-level fixed effects together with a lagged dependent variable can render the coefficients biased and inconsistent. Nickell (1981) shows that the bias approaches 0 as the sample size tends to infinity.
13
cash flows.25 As uncovered by Hansen and Tarp (2001) in the context of the
conditional impact of aid on growth it is crucial to control for non-linearity (such as
decreasing returns) before investigating potential conditionality of the impact.26 The
significance of the interactive term in most specifications attests to the pertinence of
the quadratic specification compared to the linear specification.
The results with the firm-fixed effects in the last three columns of Table 2 show
that the coefficient on cash-flow again is positive (and highly significant) for private
firms. The negative and significant sign on the squared term suggests that a higher
cash flow moderates the extent of the credit constraint for private Chinese firms.
Conversely, public companies’ and foreign companies’ investments are not positively
affected by cash-flow. The specification in column 7 for Chinese private firms
suggests that holding other factors constant, a 10% increase in the cashflow ratio
CF K/ of private firms raises investment by about 0.7%. Using a standardized impact
approach, we can compute that a one standard deviation increase over the mean in the
cashflow ratio CF K/ of private firms (1.52=0.105/0.069, cf. Table 1) raises
investment by 10.5%. Since the average investment rate over our sample is 15%, this
would mean an additional 1.5 percentage point increase which is economically
significant.
Insert Table 2 here
In Table 3, we turn to alternative measures of internal finance as an additional
robustness check. Following Whited (1992), Harrison and McMillan (2003), we use
the ratio of “total liabilities over total assets” as a firm level measure of financial
distress. The “liability to asset” ratio can be interpreted as both a measure of the
firm’s lack of collateral and a measure of the firm’s current demand for borrowing
relative to its capacity to borrow. Similar to Harrison and McMillan (2003) and
Héricourt and Poncet (2008), we anticipate that credit constrained firms display a
25 Firms with a higher level of cash flow are supposed to depend more on their internal generated funds, which implies that the degree of financial constraints is increasing the size of the cash flow dependency. In the literature, non linearity in financial constraints is more often apprehended using the quadratic term of the lagged dependent variable in parallel to the lagged dependent variable (Harrison et al., 2004; Hubbard, 1998). In order to check that our results are robust to this alternative way of accounting for non-linearity in the cash-flow investment sensitivity we rerun our regression including both the cash flow squared and the lagged dependent variable. Our results (unreported but available upon request) attest to the robustness of our findings. 26 We claim that controlling for non-linearity in the cash-flow sensitivity strengthens the paper findings of significant conditional impact of cash flow sensitivity depending on SOE or Foreign presence.
14
negative sensitivity of investment to our proxy of financial distress.
As expected, we find the coefficient on “total liabilities to assets” to be negative (and
highly significant) only for private companies, meaning that high existing liabilities in
terms of total assets indeed reduce the firm’s capacity to invest.
The results with respect to the liability-asset ratio of private firms contrast strongly
with those on other type of firms where this ratio, our proxy for financial distress,
does not affect the public companies’ and foreign companies’ investment. Our
findings suggest that the documented abundance of alternative and informal financing
channels did not succeed to solve entirely private firms’ credit constraints.
For the SOE firms in China we interpret this as evidence in support of the notion of a
soft budget constraints (Qian and Roland, 1998) where irrespective of their
indebtedness, state-owned firms still find the financial means outside the firm to
engage in investment. For foreign firms, the irrelevance of firm-level indebtedness for
investment purposes may be related to intra-group financial means at their disposal.
Insert Table 3 here
Since private firms (and not state-owned firms) are the engine role of growth in the
Chinese economy, we move on to investigate whether there are some circumstances
(related to FDI and state presence) that may modulate the effectiveness of the credit
restrictions of private Chinese firms.
5. Contingency of the relationship between investment and cash flow
At the beginning of the 1980s, the Chinese government decided to gradually
liberalize its regime for inward FDI by creating several “special economic zones”
(SEZ) to attract foreign investment.27 In these zones foreign investment was
encouraged through lower tax rates, fewer and simplified administrative and customs
procedures and, most importantly, duty free import of components and suppliers
(Naughton, 2007). As suggested by Huang (2003) and Luo (2007), imperfections in
the banking sector in China may force private Chinese firms to look for foreign
investors. By establishing cross-border relationships with foreign firms, private
27 SEZs are entitled to set their own policies and allowed to have a more liberal economic law than the country’s
15
domestic firms can bypass both the credit maket imperfections that they face at home.
Hence, FDI can in fact be seen as a form of equity financing (Harrison et al., 2004). It
is also possible that on top of that direct “capital injection” effect, indirect
mechanisms are at work. More specifically, foreign firms present in China may
extend more lenient trade credit financing to local firms in an attempt to create local
customer networks, a phenomenon also described in other developing countries. This
may further reduce the credit constraints faced by the local firms. 28
Based on this we would expect that private Chinese firms face significantly lower
financing constraints in provinces with a greater intensity of foreign direct investment.
On the contrary, firms located in provinces where the FDI rates are low (like the
northern and western provinces) are expected to have a higher sensitivity of
investment to cash flow. This hypothesis should remain true even after controlling for
the access to an alternative financing source in the form of trade credits.
To see whether the presence of FDI alleviates financial constraints for private
Chinese firms in the same province, we use the basic specification of equation (7) and
include the ratio of “trade credit over total assets” and variables measuring the
importance of foreign investment, both as a main effect and interacted with our proxy
for credit constraints.
Along similar lines, it can be argued that state-presence in a province may
have the opposite effect and may aggravate credit constraints for private Chinese
firms caused amongst others by banks preference to lend to state-owned enterprises.
To evaluate whether foreign investment in China and state presence affect the
magnitude of credit constraints, we use three types of measurements.29 A first set of
indicators are traditional province-level indicators of the abundance of foreign capital
and of the relative size of the state corporate sector: the ratio of FDI over GDP and the
ratio of employment in state-owned firms over total employment respectively. Both
indicators are taken from the China Statistical Yearbooks. A second set of measures
rely on information of the fixed asset investment by source of financing. Typically the
source of financing is broken down into domestic loans, state budgetary
one. 28 We thank an anonymous referee for this remark. 29 Ideally we would need to have detailed information on ownership changes over time. However, the data limitation that we face is that we have information on ownership structure but only for the first year a firm enters the dataset.
16
appropriation, foreign investment, and self-raised funds.30 We use the “share of fixed
assets investment financed by foreign sources” as a proxy of foreign capital and the
“share of fixed assets investment financed by the state budget” as a proxy for state
presence.
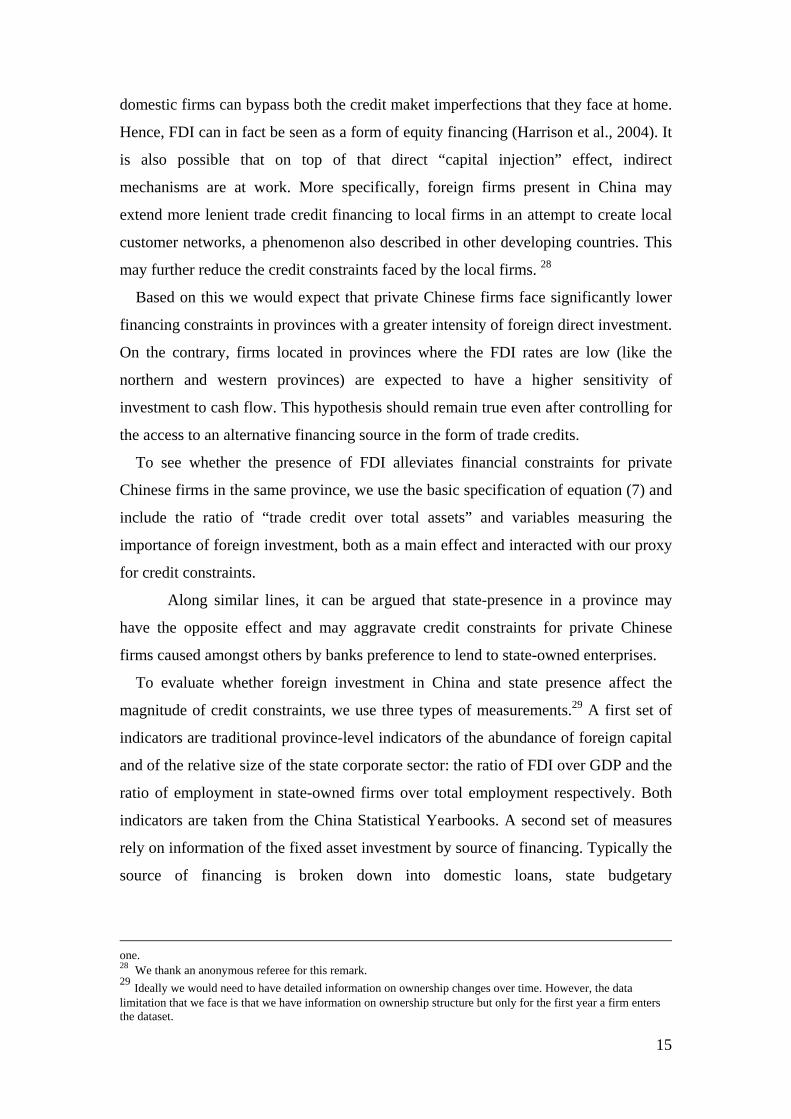
A third set of indicators relies on Oriana data to measure the importance of the
foreign and state sector. We use four alternative size measures by looking at tangible
assets, total assets, turnover and sales carried out by foreign firms versus state firms
respectively at the province p and sector (2-digit) k level as follows:
i pk t i pk tipk t
i pk ti
X Foreign_FirmFDI
X, , , ,
,, ,
∗= ∑
∑ (8)
where , ,i pk tForeign_Firm is a dummy that equals 1 when firm i is foreign and , ,i pk tX
denotes the different variables: tangible assets, total assets, turnover or sales.
Symmetrically, we measure the importance of state-owned corporate sector at the
province p and sector (2-digit) k level as:
i pk t i pk tipk t
i pk ti
X State_FirmState
X, , , ,
,, ,
∗= ∑
∑ (9)
where , ,i pk tState_Firm is a dummy that equals 1 when firm i is state-owned and , ,i pk tX
denotes the different variables: tangible assets, total assets, turnover or sales.
After defining the measures above, our purpose is to analyze their interactions with
the cashflow variable in our baseline specification in equation (7). Since our proxies
of foreign investment and state-presence are introduced in a our preferred
specification including firm-level fixed effects, their conditioning impact on credit
constraints will be identified through the time dimension of the data. We believe that
our estimates are unlikely to suffer from reverse causality as our indicators of foreign
30 Domestic loans include funds borrowed from domestic banks and non-bank financial institutions by local enterprises and institutions. State budgetary appropriation consists essentially of appropriation in the government budget earmarked for capital construction and infrastructure projects. Foreign investment refers to foreign funds in fixed assets, foreign funds borrowed and managed by the government or by individual units, as well as foreign funds in joint-ventures. Self-raised funds include funds raised by various types of enterprises through non-state channels such as bonds, stocks, venture capital, and retained earnings. These data come from the China Statistical Yearbooks.
17
investment and state importance are computed at the province p and sector (2-digit)
k level while the explained variable is firm specific. It is indeed unlikely that a firm
shock translates into a change in province-industry level of foreign or state presence.31
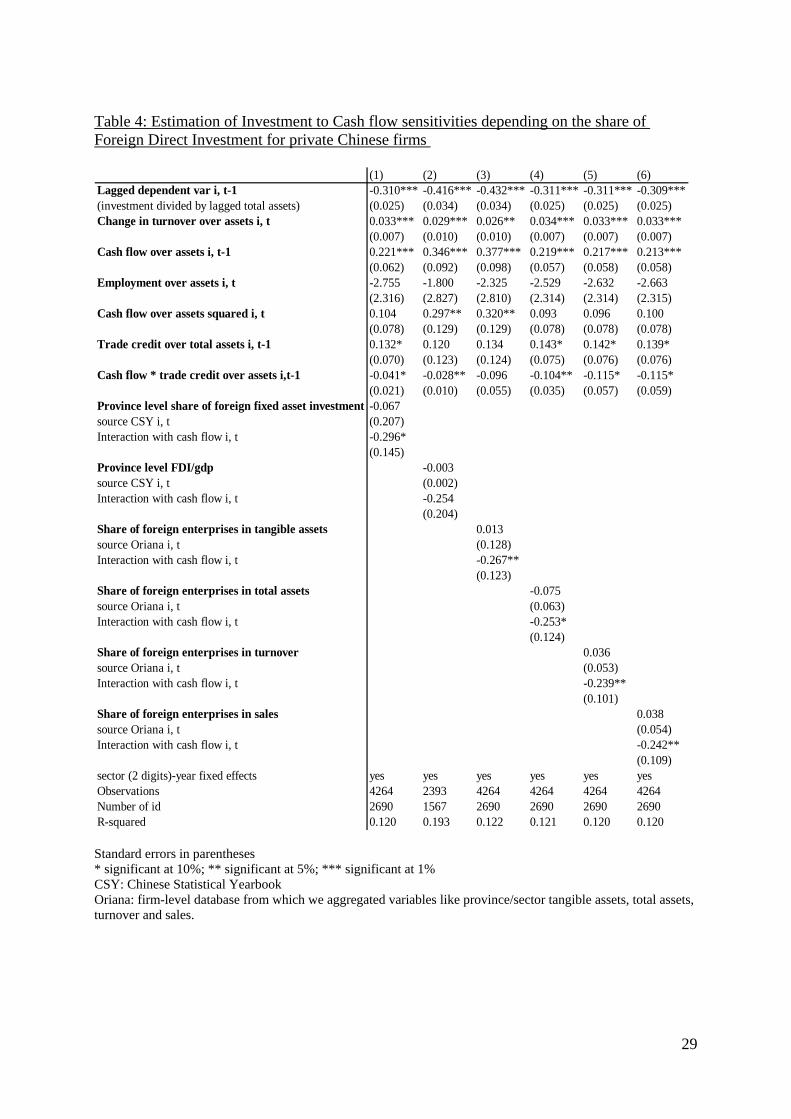
Table 4 reports results on all the separate indicators that proxy for the abundance of
foreign capital at the provincial and province/sector level.
Columns 1 to 6 introduce successively various indicators of province-level foreign
capital (share of fixed assets investment financed by foreign sources; ratio of FDI
over GDP; share of foreign enterprises in tangible assets; in total assets; in turnover
and in sales). Our wide set of indicators allows us to account for different aspects of
the foreign presence and to test the robustness of our results.
Insert Table 4 here
Almost all specifications in Table 4 suggest that FDI eases Chinese private firms’
credit constraints, as compared to estimates from the specification including only the
cash flow term ( CF K/ ), in Table 2 column (7). The coefficients on the interaction
terms, CF K/ times our proxies for foreign capital, are almost all negative and
significant for private firms. At the same time, firm’s cash flow sensitivity to
investment is decreasing significantly with a higher share of “trade credit over assets”.
Even though trade credit acts like an alternative financing source, the presence of
foreign firms is still reducing credit constraints for private firms.
Furthermore, it is unlikely that this FDI-mitigation of credit constraints is an artifact
due to the endogenous location choice process of foreign firms which localize
especially in regions where credit constraints are limited. Indeed empirical results on
the importance of local bank lending practices as determinants of FDI location
suggest that FDI mainly flows into regions characterized by imperfections in the
banking sector and state investment policies (Havrylchyk and Poncet, 2007).
Our findings that FDI inflows are positively related to the restricted access to external
funding by private enterprises, suggests there is no evidence of foreign capital
31 When the dependent variable is at the finest level possible, shocks in the error term will be less likely to affect the right-hand side variables. Moreover, if the explanatory variables are more aggregated, endogeneity is again less likely since shocks to individual variables affect regional variables only slightly.
18
crowding out private capital in China. This finding is in line with that of Harrison et
al. (2004) from a cross-country firm-level panel. They showed that FDI flows are
associated with a reduction in firm-level financing constraints. However it contrasts
with the results of Harrison and McMillan (2003) on the Ivory Coast data, where the
presence of foreign firms crowds local firms out of domestic capital markets. These
diverging results highlight differences in financial sector organization and practice
across countries. As suggested in Harrison and McMillan (2003), Côte d’Ivoire is
very peculiar in the sense that foreign firms borrow heavily on domestic credit
markets. The authors suggest that local banks found lending to foreign enterprises less
costly because they were generally considered less risky and more profitable than
domestic firms. Thus, financing constraints of domestic firms in Côte d’Ivoire were
exacerbated by the presence of foreign firms, which benefited from a preferential
treatment from domestic credit markets. In China the situation appears different.
While in our data there is no information available on how foreign firms and domestic
firms finance their operations in China, in the World Bank investment climate survey
(2003) the proportion of Chinese firms that declare to have a bank loan is about 22%
irrespective of the degree of foreign ownership of the Chinese firm. This suggests that
in China, as opposed to Côte d’Ivoire, foreign firms do not appear to borrow more
heavily on (domestic) credit markets. If anything, it seems that they rely to a greater
extent on foreign financing sources. Another question in the World Bank survey
involves “the share of a firm’s total borrowing (loans, accounts payable) denominated
in foreign currency”. The responses show that foreign ownership indeed has an
impact on the share of loans that is a denominated in foreign currency i.e. 18.6% for
100% foreign firms, 7.3% for firms with 50% foreign capital and 1.8% for firms with
0% foreign capital on average.32 These statistics indicate that while foreign firms in
China rely much less on domestic capital markets compared to domestic Chinese
firms. This is consistent with the fact that we do not observe any crowding-out effect
of foreign capital on domestic Chinese firms. The results rather indicate that
abundance of foreign capital alleviate existing financial distortions that may otherwise
constitute an impediment fo private firms economic activity.
In addition we also look at the presence of the state-owned corporate firms which
may also be a conditioning factor of the effectiveness of private firms’ credit
32 No information exists on the extent to which foreign firms are financed by means of their mother
19
constraints in China. Huang (2003) cites anecdotal evidence that the degree of the
pecking order for credit may differ among locations/industries. For example, the
political pecking order in the Garment industry, one of the few industries private
entrepreneurs can enter relatively freely, is argued to be characterized by stronger
credit constraints for private firms than in other industries. Also, if a private firm
competes directly with a state-owned firm in the same industry the chances to get a
loan diminish substantially. If the conjecture by Huang (2003) is correct, then one
should see that it is more difficult for private firms, to have access to credit in
provinces/sectors where the relative size of the State-owned corporate sector is high.
We thus expect that private firms have a higher sensitivity of investment to cash flow
i.e. are more financially constrained, in locations/industries where the state presence is
high.
Again we also include “trade credit to total assets” together with an interaction term
of trade credit and cash flow as additional control variables.
Table 5 confirms that the effect of the political pecking order of firms on external
finance costs of private firms is conditional on the relative size of the state-owned
corporate sector. In columns 1 through 6, a variable measuring the importance of state
presence is included to the baseline specification, both as a main effect and interacted
with our proxy for credit constraints. We use each of the 6 indicators presented earlier
to proxy for the size of the state sector at the provincial and province/sector level. In
columns 2 and 3, we use indicators built at the province level with data taken from the
China statistical yearbook measuring the “province-level share of employment in state
units” and the “share of investment financed by state budget over total investment”. In
columns 4 to 7, we rely on proxies computed from the Oriana dataset of the “state
share in tangible assets, total assets, turnover and sales” by province & sector.
Insert Table 5 here
Table 5 shows that in most cases (especially using proxies based on the Oriana
dataset), the interaction of cash flow and poxies for the presence of the state sector is
positive and significant. On the other hand, trade credit interacted with cash flow is
negative and significant in all specifications. This suggests that when trade credit is
company abroad.
20
present as an alternative financing source, it reduces financial constraints for private
firms. But at the same time a greater size of the state-owned corporate sector
amplifies credit constraints for private firms. Thus, the results confirm our prediction
that the severeness of credit constraints for private Chinese firms is worse in
industries with a high share of state-owned enterprises even though firms have access
to an alternative financing source in the form of trade credit.
This micro-level evidence is coherent with macro-level findings of Guariglia and
Poncet (2008) and Boyreau Debray and Wei (2005).
These results suggest that privatization and the further reduction of the state-owned
corporate sector in China is likely to boost the investment and growth of private firms.
6. Conclusion
This paper investigates both the magnitude and the conditioning factors of credit
allocation to Chinese firms by ownership type. To identify credit constraints we
follow the investment literature pioneered by Fazzari et al. (1988) by examining the
extent to which Chinese firms’ investment is affected by the availability of internal
finance.
The results over the period 1998-2005 suggest that private Chinese firms face severe
financial constraints while we find no such constraints for state-owned and foreign
enterprises. This finding is at odds with the observation that private Chinese firms are
the engine of growth in the Chinese economy.
We subsequently study the circumstances under which existing capital market
distortions in China may not represent an impediment to economic activity. We test
two conditioning factors of the severeness of private firms credit constraints: (1) the
geographical and industrial presence of FDI in China and (2) the size of the state-
owned corporate sector. We identify FDI as an important mechanism for private
Chinese firms to overcome financial constraints. Our results suggest that the presence
of FDI eases financing constraints and spurs growth and investment of private firms.
In contrast, the size of the state-owned corporate sector negatively affects the extent to
which private Chinese firms investment depends on internal finance. Financing
constraints are found to be increasing with the relative size of the state sector. Private
Chinese firms competing directly with numerous state-owned enterprises in the same
province/industry depend more strongly on their internal generated funds for their
investment and appear more credit constraint which impedes their growth.

21
Our findings allow us to predict the likely beneficial impact of the ongoing reforms
inducing further liberalization to foreign capital and state firms restructuring on the
economic dynamism of the Chinese economy. Existing capital market imperfections
in China for private firms are likely to be mitigated by the growing importance of
foreign firms in the Chinese economy as well as the ongoing decline of the state
economic predominance. Indeed, recent developments demonstrate a continuing shift
away from state ownership. The 2004 Economic Census in China indicates declines
of over 45 percent in each of the two most prominent forms of public ownership, i.e.
state-owned firms and collectives from 2000. In parallel, China has also experienced a
fundamental change with regard to the means of allocating financial resources with its
entry in the WTO in 2001 which involved amongst others a removal of restrictions on
the activities of foreign banks. For this reason we can anticipate rapid changes in the
Chinese allocation of credit in the future that reduce Chinese private firms’ credit
constraints.
22
References
Abraham F., J. Konings and V. Slootmaekers, (2007), “FDI Spillovers in the Chinese
Manufacturing Sector: Evidence of Firm Heterogeneity”, CEPR Discussion Paper No.
6573, forthcoming in The Economics of Transition.
Aghion P., P. Askenazy and N. Berman (2008),”Credit constraints and the cyclicality
of R&D investment: Evidence from France”, Harvard discussion paper.
Alti, A., (2003), “How Sensitive is Investment to Cash Flow When Financing is
Frictionless”, Journal of Finance, vol 58 (2), 707-722.
Allayannis, Y. and A. Muzomdar, (2004), “The Impact of negative cash-flows and
influential observations on Investment-Cash Flow Sensitivity estimates”, Journal of
Banking and Finance, 28, 901-930.
Allen, F., J. Qian, and M. Qian (2005), “Law, Finance and Economic Growth in
China,” Journal of Financial Economics, 77, pp. 57–116.
Allen F., J. Qian and M. Qian, 2007, Building China’s Financial System in the 21st
Century: Banks, Markets, and Beyond, in China's Economic Transition: Origins,
Mechanisms, and Consequences, edited by L. Brandt and T. Rawski.
Almeida, H., and M. Campello (2006), “Financial Constraints, Asset Tangibility and
Corporate Investment,” NBER Working Papers, 12087.
Arellano, M., and Bond. S. (1992), “Some tests of specification for panel data: Monte
Carlo evidence and an application to employment equations,” Review of Economic
Studies, 58, 277–297.
Asian-Development-Bank (2003), People’s Republic of China: The Development of
Private Enterprise. Asian Development Bank.
Beck, T., A. Demirguc-Kunt and V. Maksimovic, (2005), “Financial and Legal
Constraints to Firm Growth: Does Size Matter?”, The Journal of Finance, 60, 1 (02),
137-177.
Blundell, R., M. Bond, M. Devereux, and F. Schiantarelli (1992), “Investment and
Tobin’s Q: Evidence from Panel Data,” Journal of Econometrics, 51, 233–257.
Blundell, R., and S. Bond (1998), “Initial conditions and moment restrictions in
dynamic panel data models,” Journal of Econometrics, 87(1), 115–143.
Bond, S., A. J. Elston, J. Mairesse, and B. Mulkay (2003), “Financial Factors and
Investment in Belgium, France, Geramny and the United Kingdom,” The Review of
Economics and Statistics, 85(1), pp. 153–165.
23
Bond, S., and C. Meghir (1994), “Dynamic Investment Models and the Firm’s
Financing Policy,” Review of Economic Studies, 61(2), 197–222.
Boyreau-Debray, G. (2003), “Financial Intermediation and Growth: Chinese style,”
World Bank Policy Research Working Paper, 3027.
Boyreau-Debray G. and S.-J. Wei, 2005, “Pitfalls of a State-dominated Financial
System: The Case of China” NBER Working Paper 11214.
Carpenter, R. E., and B. Petersen (2002), “Is growth of small firms constrained by
internal finance?,” The Review of Economics and Statistics, 84(2), pp. 298–309.
Dwight H. Perkins and Thomas G. Rawski, 2007, "Forecasting China’s Economic
Growth to 2025" in China's Economic Transition: Origins, Mechanisms, and
Consequences, edited by Loren Brandt and Thomas Rawski. Cambridge University
Press.
Fazzari, S., G. Hubbard, and B. Petersen (1988a), “Financing constraints and
corporate Investment,” Brookings papers on Economic Activity, 19, pp. 141–195.
Fazzari, S., G. Hubbard, and B. Petersen (1988b), “Investment, financing decisions
and tax policy,” American Economic Review, 78, pp. 200–219.
Fazzari, S., G. Hubbard, and B. Petersen (2000), “Investment cash flow sensitivities
are useful: a comment on Kaplan and Zingales” Quarterly Journal of Economics,
115(2), pp. 695–712.
Gomes, J. F., (2001), “Financing Investment”, American Economic Review, 91 (5),
1263-85.
Griliches, Z., and J. Hausmann (1986), “Errors in Variables in Panel Data,” Journal of
Econometrics, 31, pp. 93–118.
Guariglia, A., X. Liu and L. Song (2008), “Is the growth of Chinese firms constrained
by internal finance”, mimeo.
Hadi, A. S., (1994) “A Modification of a Method for the Detection of Outliers in
Multivariate Samples”, Journal of the Royal Statistics Society 56:B, 393-396.
Hansen H. and F. Tarp, (2001), Aid and Growth regressions, Journal of development
Economics, 64, 2, 547-570.
Harrison, A., Love, and M. McMillan (2004), “Global capital flows and financing
constraints,” Journal of Development Economics, 75, pp. 269–301.
Harrison, A., and M. McMillan (2003), “Does direct foreign investment affect
domestic firm credit constraints?,” Journal of International Economics, 61(1), 73–100.
Havrylchyk O. and S. Poncet (2007), “Foreign Direct Investment in China: Reward or
24
Remedy?”,‘The World Economy, 30 (11), 1662-81.
Héricourt, J., and S. Poncet (2008), “FDI and Credit Constraints: firm level evidence
from China”, forthcoming Economic Systems.
Huang, Y. (2003), Selling China. Cambridge University Press, pp. 207.
Hubbard, G., and A. K. Kashyap (1995), “Internal finance and firm investment,”
Journal of Money, Credit & Banking, 27, 1–28.
Hubbard, R. G. (1998), “Capital Market Imperfections and Investment,” Journal of
Economic Literature, 36 (1), pp. 193–225.
Huyghebaert, N., Q. Quan, and L. Sun (2006), “Financing Decisions in Newly
Privatized Chinese Firms: Does a Stock Market Quotation Really Provide
Disciplining,” KUL Working paper.
Javorcik, B. and M. Spatareanu (2008),”Liquidity Constraints with Multinationals”,
LICOS discussion paper 225/2008, KUleuven.
Kaplan, S. and L. Zingales, (1997), “Do Investment-Cash Flow Sensitivities Provide
Useful Measures of Financing Constraints?”, Quarterly Journal of Economics, 112
(1), 169-215.
Konings, J., M. Rizov, and H. Vandenbussche (2003), “Investment Constraints in
Transition Countries,” Economic Letters, 78(2), pp. 253–258.
Konings, J., and H. Vandenbussche (2004), “The adjustment of Financial Ratios in
the presence of Soft Budget Constraints: evidence from Bulgaria,” European
Accounting Review, pp.1-16.
Lizal, L., and J. Svejnar (2002), “Investment, Credit rationing and the soft budget
constraint: Evidence from Czech panel data,” The Review of Economics and
Statistics, 84(2), pp. 353–370.
Love, I. (2003), “Financial development and financing constraints: international
evidence from the structural investment model,” Review of Financial Studies, 16, pp.
765–791.
Luo, C., (2007). FDI: a visible hand. Mimeograph. Center for European Studies &
China Center for Economic Studies. Fudan University, Shanghai, China.
Manova, K. (2007), “Credit Constraints, Heterogeneous Firms, and International
Trade,” Working Papers Standford University.
Modigliani, F. and M.H. Miller, (1958), “The cost of capital, corporation finance and
the theory of investment”, American Economic Review, 48 (3), 261-97.
Naughton, B. (2007), The Chinese Economy: Transition and Growth. MIT Press, pp.

25
332.
Nickell, S. (1981). “Biases in Dynamic Models with Fixed Effects.” Econometrica,
49, 1417-26.
OECD, 2005, OECD Economic Surveys China - Volume 2005 Issue 13, OECD
Publishing.
Park, A., Sehrt, K., (2001), Tests of financial intermediation and banking reforms in
China. Journal of Comparative Economics 29, 608-644.
Perkins D. and T. G. Rawski, (2007), "Forecasting China’s Economic Growth to
2025" in China's Economic Transition: Origins, Mechanisms, and Consequences,
edited by Loren Brandt and Thomas Rawski.
Rajan, R. G., and L. Zingales (1998), “Financial dependence and growth,” American
Economic Review, 88, pp. 559–586. 23
Qian Y. and G. Roland, 1998, “Federalism and the Soft Budget Constraint”,
American Economic Review, 88 (5), 1143-62.
Stock J. H. and M. Yogo, 2002, “Testing for weak instruments in linear IV
regression”, NBER technical working paper 284.
Whited, T., 1992, “Debt, Liquidity Constraints, and Corporate Investment: Evidence
from Panel Data”, Journal of Finance 47 (4), 1425-60.
26
Table 1: Summary statistics
(1) Private firms in our sample refer to 100 percent domestically owned profit-making economic organizations in accordance with the Company Law of the People’s Republic of China. The legal form of private Chinese firms can be private Limited Liabilities, Private Partnership, Private Share Holding or Private Sole Investment. (2) State Owned Enterprises (SOE) refers to 100 percent domestically owned firms where the state (no matter whether direct or indirect) has at least 25 percent of ownership stake. These arrangements can be either be fully State-owned or Jointly State-owned with another party. (3) Collective Owned Enterprises (COE) refers to 100 percent domestically owned corporation where the means of production and property belonging to labouring masses and are managed by local governments. (4) Foreign Invested Enterprise (FIE) groups firms with more than 25 percent of registered capital by a foreign party.
Variable
Mean
(1)
Standard deviation
(2) Minimum
(3) Maximum
(4) Private firms (1):5669
Investment over Capital 0.086 0.150 -0.487 1.605 Lagged investment over Capital 0.103 0.162 -0.483 1.600 Change in turnover over capital 0.290 1.061 -32.699 21.975 Cash flow over capital 0.069 0.105 -1.460 2.503 Employment over capital 0.006 0.013 0.000 0.454 Total employment 1829 3534 5 88547 Total assets 1273416 3746566 873 145000000
State Owned Enterprises (2): 2357 Investment over Capital 0.075 0.144 -0.442 1.159 Lagged investment over Capital 0.080 0.134 -0.442 1.217 Change in turnover over capital 0.158 0.411 -5.784 6.767 Cash flow over capital 0.051 0.076 -0.357 0.938 Employment over capital 0.004 0.005 0.000 0.082 Total employment 4623 21989 1 439220 Total assets 3461728 27800000 5571 778000000
Collective Owned Enterprises (3): 1640 Investment over Capital 0.076 0.151 -0.540 1.679 Lagged investment over Capital 0.091 0.157 -0.369 1.388 Change in turnover over capital 0.395 1.285 -13.295 23.060 Cash flow over capital 0.106 0.188 -1.435 4.602 Employment over capital 0.008 0.020 0.000 0.379 Total employment 1624 3918 6 99147 Total assets 749479 2203650 2396 42400000
Foreign Invested Enterprises (4): 5301 Investment over Capital 0.063 0.142 -0.834 1.642 Lagged investment over Capital 0.076 0.147 -0.670 1.624 Change in turnover over capital 0.264 0.952 -18.584 19.566 Cash flow over capital 0.109 0.175 -1.385 8.458 Employment over capital 0.009 0.020 0.000 0.441 Total employment 1367 3455 10 140000 Total assets 699955 2075153 1102 38900000
27
Table 2: OLS, IV technique and Firm-fixed effects to test for credit constraints across ownership types (1) (2) (3) (4) (5) (6) (7) (8) (9)
Dependent variable: Investment over lagged total assets Private SOE Foreign Private SOE Foreign Private SOE Foreign OLS OLS OLS IV IV IV FE FE FE Lag dependent (investment divided 0.095*** -0.009*** 0.100*** 0.125*** -0.048 0.114*** -0.365*** -0.623*** -0.528*** by lagged total assets) i, t-1 (0.014) (0.002) (0.019) (0.025) (0.039) (0.020) (0.016) (0.024) (0.018) Change in turnover over assets i, t 0.021*** 0.108** 0.012*** 0.027*** 0.070*** 0.013*** 0.038*** 0.062*** 0.010*** (0.004) (0.047) (0.003) (0.007) (0.025) (0.003) (0.003) (0.005) (0.003) Employment over assets i, t -0.357 -1.489** -0.247*** -3.219*** -7.320** -0.598 -6.906*** -14.646*** -5.827*** (0.251) (0.617) (0.094) (1.002) (3.342) (0.543) (1.423) (2.793) (1.779) Cash flow over assets i, t-1 0.121*** -0.088 0.028 0.109* 0.076 0.013 0.134*** 0.090 -0.019 (0.037) (0.159) (0.023) (0.058) (0.203) (0.019) (0.033) (0.087) (0.033) Cash flow squared over total assets i, t-1
-0.149*** (0.025)
-0.062*** (0.018)
0.016** (0.007)
Sector-year fixed effects yes yes yes yes yes yes yes yes yes Firm fixed effects no no no no no no yes yes yes Observations number 9229 5766 7316 4152 1607 1994 9229 5766 7316 R-squared 0.074 0.191 0.026 0.110 0.124 0.027 0.195 0.386 0.314 Cragg-Donald F statistic (weak identification test): 727 210 1605 Sargan statistic (overidentification test of all instruments): Chi-sq(1) P-val
0.084 (0.776)
5.956** (0.0147)
3.077* (0.0794)
Standard errors in parentheses. * significant at 10%; ** significant at 5%; *** significant at 1% In columns 4 to 6, Cash flow over assets i, t-1 is instrumented with Cash flow over assets i, t-2 and Cash flow over assets i, t-3.
28
Table 3: Robustness check: alternative proxy for credit constrains across ownership types
(1) (2) (3) (4) (5) (6) FE FE FE FE FE FE Dependent variable: Investment over lagged total assets Private SOE Foreign Private SOE Foreign Lag dependent (investment divided -0.370*** -0.630*** -0.545*** -0.366*** -0.624*** -0.530*** by lagged total assets) i, t-1 (0.015) (0.027) (0.017) (0.016) (0.024) (0.018) Change in turnover over assets i, t 0.033*** 0.051*** 0.012*** 0.039*** 0.062*** 0.010*** (0.002) (0.005) (0.003) (0.003) (0.005) (0.003) Employment over assets i, t -5.970*** -31.137*** -3.636*** -6.938*** -14.663*** -5.898*** (1.393) (0.877) (1.363) (1.422) (2.795) (1.780) Total liabilities over total assets i, t-1 -0.042*** -0.051 0.013 -0.032*** -0.007 0.017 (0.010) (0.032) (0.012) (0.011) (0.030) (0.013) Cash flow over assets i, t-1 0.110*** 0.089 -0.008 (0.033) (0.087) (0.034) Cash flow squared over assets i,t-1 -0.140*** -0.062*** 0.016** (0.025) (0.018) (0.007) Firm fixed effects yes yes yes yes yes yes Sector-year fixed effects yes yes yes yes yes yes R-squared 0.201 0.581 0.341 0.198 0.386 0.315 Observations number 9481 5996 7527 9229 5766 7316 Number of firms 5829 4264 5407 5669 4138 5301 Standard errors in parentheses. * significant at 10%; ** significant at 5%; *** significant at 1%.
29
Table 4: Estimation of Investment to Cash flow sensitivities depending on the share of Foreign Direct Investment for private Chinese firms
(1) (2) (3) (4) (5) (6)Lagged dependent var i, t-1 -0.310*** -0.416*** -0.432*** -0.311*** -0.311*** -0.309***(investment divided by lagged total assets) (0.025) (0.034) (0.034) (0.025) (0.025) (0.025)Change in turnover over assets i, t 0.033*** 0.029*** 0.026** 0.034*** 0.033*** 0.033***
(0.007) (0.010) (0.010) (0.007) (0.007) (0.007)Cash flow over assets i, t-1 0.221*** 0.346*** 0.377*** 0.219*** 0.217*** 0.213***
(0.062) (0.092) (0.098) (0.057) (0.058) (0.058)Employment over assets i, t -2.755 -1.800 -2.325 -2.529 -2.632 -2.663
(2.316) (2.827) (2.810) (2.314) (2.314) (2.315)Cash flow over assets squared i, t 0.104 0.297** 0.320** 0.093 0.096 0.100
(0.078) (0.129) (0.129) (0.078) (0.078) (0.078)Trade credit over total assets i, t-1 0.132* 0.120 0.134 0.143* 0.142* 0.139*
(0.070) (0.123) (0.124) (0.075) (0.076) (0.076)Cash flow * trade credit over assets i,t-1 -0.041* -0.028** -0.096 -0.104** -0.115* -0.115*
(0.021) (0.010) (0.055) (0.035) (0.057) (0.059)Province level share of foreign fixed asset investment -0.067source CSY i, t (0.207)Interaction with cash flow i, t -0.296*
(0.145)Province level FDI/gdp -0.003source CSY i, t (0.002)Interaction with cash flow i, t -0.254
(0.204)Share of foreign enterprises in tangible assets 0.013source Oriana i, t (0.128)Interaction with cash flow i, t -0.267**
(0.123)Share of foreign enterprises in total assets -0.075source Oriana i, t (0.063)Interaction with cash flow i, t -0.253*
(0.124)Share of foreign enterprises in turnover 0.036source Oriana i, t (0.053)Interaction with cash flow i, t -0.239**
(0.101)Share of foreign enterprises in sales 0.038source Oriana i, t (0.054)Interaction with cash flow i, t -0.242**
(0.109)sector (2 digits)-year fixed effects yes yes yes yes yes yesObservations 4264 2393 4264 4264 4264 4264Number of id 2690 1567 2690 2690 2690 2690R-squared 0.120 0.193 0.122 0.121 0.120 0.120 Standard errors in parentheses * significant at 10%; ** significant at 5%; *** significant at 1% CSY: Chinese Statistical Yearbook Oriana: firm-level database from which we aggregated variables like province/sector tangible assets, total assets, turnover and sales.

30
Table 5: Estimation of Investment to Cash flow sensitivities depending on the share of state-owned firms per industry for private Chinese firms .
(1) (2) (3) (4) (5) (6)Lag dependent i, t-1 -0.310*** -0.308*** -0.309*** -0.309*** -0.307*** -0.307***(investment divided by lagged total assets) (0.025) (0.025) (0.025) (0.025) (0.025) (0.025)change in turnover over assets i, t 0.032*** 0.032*** 0.033*** 0.033*** 0.034*** 0.034***
(0.007) (0.007) (0.007) (0.007) (0.007) (0.007)Cash flow over assets i, t-1 0.252*** 0.227*** 0.230*** 0.220*** 0.217*** 0.219***
(0.076) (0.064) (0.064) (0.063) (0.062) (0.062)Employment over assets i, t -3.365 -2.999 -2.753 -2.708 -2.683 -2.694
(2.296) (2.304) (2.298) (2.298) (2.297) (2.297)Cash flow over assets squared i, t 0.104 0.116 0.079 0.072 0.068 0.069
(0.080) (0.081) (0.080) (0.080) (0.080) (0.080)Trade credit over total assets i, t-1 0.005 -0.002 -0.023 -0.021 -0.022 -0.022
(0.075) (0.075) (0.075) (0.075) (0.075) (0.075)Cash flow * trade credit over assets i,t-1 -0.490* -0.541* -0.511* -0.573* -0.599* -0.586*
(0.240) (0.304) (0.314) (0.343) (0.343) (0.343)Province level state share of employment 0.218source CSY i, t (0.247)Interaction with cash flow i, t 0.118**
(0.059)Province level share of investment financed by state budget 0.365source CSY i, t (0.336)Interaction with cash flow i, t 0.157*
(0.087)Share of state enterprises in tangible assets 0.027source Oriana i, t (0.050)Interaction with cash flow i, t 0.063
(0.330)Share of state enterprises in total assets 0.034source Oriana i, t (0.055)Interaction with cash flow i, t 0.205***
(0.065)Share of state enterprises in turnover 0.071source Oriana i, t (0.057)Interaction with cash flow i, t 0.245***
(0.086)Share of state enterprises in sales 0.067source Oriana i, t (0.057)Interaction with cash flow i, t 0.274***
(0.087)sector (2 digits)-year fixed effects yes yes yes yes yes yesObservations 4309 4309 4309 4309 4309 4309Number of id 2717 2717 2717 2717 2717 2717R-squared 0.128 0.124 0.122 0.122 0.123 0.123
Standard errors in parentheses * significant at 10%; ** significant at 5%; *** significant at 1% CSY: Chinese Statistical Yearbook Oriana: firm-level database from which we aggregated variables like province/sector tangible assets, total assets, turnover and sales.
Recommended