Financial Constraints and the Effects of Alternative Financial System Design
Solomon Tadesse* University of Michigan
Abstract How does the design of a country’s financial system affect the relative performance of its firms or industries, particularly in supporting their innovative processes? Firms’ realization of technological innovations may critically depend on the degree of financial constraints they face. An appropriate design of the financial system may alleviate the financial constraints of otherwise innovative firms, contributing to overall economic performance. The paper examines the relation between financial system design and industrial technological innovations in the presence of financial constraints. We find that industrial sectors with relatively heavy external financial dependence by their small and young firms realize faster technological progress in bank-based financial systems. There is also a weak evidence of a general positive effect on technological progress associated with a market based financial system design regardless of industrial heterogeneity.
JEL Classification: G1, G21, G32, E44, O14, O3, O4 Key Words: Innovation, Financial Architecture, Bank-Based System, Market-Based System
* Corresponding author: Stephen M. Ross School of Business, Department of Finance, University of Michigan. Tele: (734) 763-5392; Fax: (734) 936-9282. E-mail: [email protected]. I thank Enisse Kharroubi and seminar participants at the European Central Bank Symposium on Capital Markets and Financial Integration for helpful comments.

1
The role of financial development for economic growth has been extensively explored in recent
years, with a growing concensus that financial development may, indeed, have a positive first-order impact
on economic growth. According to Levine (1997, pp. 688-89), ‘a growing body of work would push even
most skeptics toward the belief that the development of financial markets and institutions is a critical and
inextricable part of the growth process’. This consensus on the finance-growth link has once again pushed
the debate to the long-standing contentious issue of whether the configuration of a nation’s financial
system has any implication for its growth and welfare. Does financial architecture – i.e., the degree to
which the financial system is bank or market oriented – matter for long term firm performance,
particularly, in fostering innovations and technology? This historic debate1has become heated in recent
times because financial system configuration is at the core of reform policies in many transition and
emerging economies.
This paper explores empirically the relation between technological innovation and financial system
architecture, focusing on the role of financial system architecture in removing financial constraints of firms
that are otherwise of innate innovative capacity. Whether a bank-based system or a market-based system is
conducive for promoting technological innovation is not theoretically unambiguous. On the one hand, the
market-based view holds that banks have serious deficiencies but financial markets have comparative
advantages as financiers of technological innovation. For example, as creditors, banks are risk averse or
conservative, and have bias against financing innovation (e.g., Weinstein and Yafeh, 1998). In addition,
powerful banks reduce the firms’ incentive to undertake innovative projects by extracting informational
rents (e.g., Rajan, 1992). In contrast, financial markets, by allowing the financing of long-term projects by
savers with short-term liquidity needs, enable the adoption of innovative but long-gestation technologies
(Hicks, 1969; Bencivenga, Smith and Starr, 1995; and Saint-Paul, 1992).
Furthermore, the market- based view advances certain advantages of markets over banks. In
particular, it argues that markets may have attributes that intermediaries do not have that are advantageous
in fostering innovative technologies. Market-based systems facilitate innovation by allowing financing 1 Allen and Gale (1995) and Boot and Thakor (1997) provide excellent reviews of the history and literature on the merits of bank based versus market-based systems.

2
when diversity of opinion prevails (Allen, 1993; Allen and Gale, 1999; see also Boot and Thakor, 1997).
The argument is that assessment of new technologies is hard either because little information is available
about their potential returns or because the information itself is difficult to judge without some expertise,
indicating that there is often substantial diversity of opinion. Bank-based financing requires delegation of
the decision regarding financing to a relatively small number of decision makers. When there is no
disagreement, this delegation is effective and entails cost savings. It is, however, problematic if diversity of
opinion persists, because some of the providers of funds would disagree with the decisions of the delegated
monitor. Bank-based finance, therefore, would under-fund new technologies. Markets permit individuals to
agree to disagree, and therefore allow coalition of investors with similar views to join together to finance
projects. Hence, markets are very effective at financing new industries and technologies where no relevant
data is completely lacking.
On the other hand, the bank-based view holds that bank based systems promote innovation and
technology because of certain comparative advantages it attributes to such systems. First, bank-based
systems are more effective in funding new, innovative activities that require staged financing (Stulz
(2000)) because banks can credibly commit to making additional funding as the project develops. Second,
banks more effectively finance industrial expansion in underdeveloped economies (Gerschenkron (1962),
Boyd and Smith (1996, 1998)), since powerful banks can induce firms to reveal information better than
markets in such economies (Rajan and Zingales (1999a)). Also, bank-based systems do well when the
legal system is weak as banks depend less on the legal system (Rajan and Zingales (1999b). Third, bank-
based systems encourage innovation by facilitating the financing of long-term projects through reducing
liquidity risk (Greenwood and Jovanovic, 1990; and Bencivenga and Smith, 1991). Finally, financial
markets could lead to underinvestment in information, with a negative impact on identification of
innovative projects. Efficient markets reduce the incentives of investors to generate information about
firms because of free-rider problems to searching costs (Stiglitz, 1985). Banks reveal less information to
the public, resolving this problem (Boot, Greenbaum, and Thakor, 1993).

3
Available evidence on the role of financial architecture to innovation is both anecdotal and mixed.
Goldsmith (1969) provides a comparison of the financial systems of Germany and the U.K., and
Gerschenkron (1962) reports on the importance of the bank, Credit Mobilier, for the industrialization of
France, and that of the Great Banks for the development of Germany. Mayer (1990) reports how the
Japanese banking system contributed to its post-war development, and Cohen (1967) documents on the role
of such banks as Banca Commerciale Italiana for Italy. On the other hand, Bagehot (1873) and Hicks (1969)
emphasize the role of the mature securities markets in Great Britain as a precursor of the Industrial
Revolution. The arguments on both side of this historic debate are compelling. In this paper, I take a
neutral position on the issue to explore the consistency of each side of the debate with available data.
Following the long tradition in the growth economics literature starting with Solow (1957), I define
and measure technological innovation to be the component of productivity growth attributable to shifts in
the production or cost frontier as a representation of the underlying technology of the firm. Using industry-
level panel across a large cross-section of countries, I then examine the importance of financial architecture
in fostering technological innovation as defined above. I examine whether firms or industries that differ in
their needs for financing innovation fare relatively better or worse in market or bank based systems. Given
the opposing theoretical views, one would expect sectors that depend on external financing to realize their
innovative capacity to achieve higher rates of technological progress in either bank-based or market-based
systems. Exploiting industry-specific information about industrial innovative capacity and the variation in
dependence on external finance to actualize this capacity, I thus ask if financial architecture has a
heterogeneous impact across industrial sectors. The evidence shows that financial architecture, indeed, has
a heterogeneous effect on innovation, whereby specific firms or industries appear to benefit from market-
based systems while others from bank-based systems. In addition, I test also for the average effect of
whether, by and large, industries realize higher or lower rates of technological progress if they are
supported by market or bank-based systems. The evidence shows that market-based systems may have, on
average, a positive impact on innovation

4
The empirical tests are more precise: Corporate finance theory suggests that firms’ relative age
may affect their reliance on external finance. Rajan and Zingales (1998), for example, show that, in median
terms, U.S. firms raise a positive amount of external finance only up to the tenth year of their life, which
could be due to young and small firms’ desire to finance innovations. While critically constrained by lack
of internally generated finance, small and young firms are considered to have certain comparative
advantages for innovation (Mazzucato, 2000, pp.16; Nooteboom (1994), Acs and Audretsch (1991)). There
is strong evidence, at least in the U.S, that small firms contribute significantly to innovative activities (see,
e.g., Acs and Audretsch (1988, 1990, 1991) and Bound et al. (1984)). However, these firms’ ability to
pursue innovations appears to be constrained by lack of financial resources (see, e.g., Himmelberg and
Peterson (1994) and Hall (1990)). One would, therefore, expect to find stronger evidence of the effects of
financial architecture on innovation by focusing the analysis on the external financial needs of small and
younger firms, and ask if such firms realize faster rates of innovation in bank-based or market-based
systems. The results show strong evidence that industries, whose younger firms are especially dependent on
external finance, realize faster rates of innovation in countries with relatively bank-oriented financial
systems.
It is not critical that young firms be more or less innovative than large and mature firms. Both large
and small firms contribute to innovation and economic growth. The relative strength of small firms is
generally argued in terms of behavioral characteristics while those of large firms lie mostly in resources.
Small firms have certain attributes such as organizational flexibility and ability to attract scientists that are
conducive for innovations, as mature firms have other comparative advantages, including availability of
internally-generated funds to finance innovations (Mazzucato, 2000; Acs and Audretsch (1991)). While
lack of funds is a critical disadvantage for undertaking innovations for small and young firms, availability
of internally-generated funds is a critical advantage for large and mature firms. Thus, we focus on small
firms to examine the differential effects of market-based and bank-based financial architectures to the
realization of innovation via facilitating access to capital to financially-constrained firms with demand for
external finance for funding innovations. Mature firms are significantly less dependent on external finance

5
than younger firms. The lessened effect of capital market imperfections on large firms means that to the
extent that they raise capital externally, they would rely more on public markets than relationship financing
which could be prone to rent extraction by banks
The main results that market-based systems foster innovation on average and that bank-based
systems foster innovation by externally constrained small firms appear to be in contradiction. Yet, taken
together, they confirm the basic predictions of the market-based and bank-based views. Market-oriented
financial systems foster innovation by enabling the identification and financing of new technologies, and
industries where diversity of opinion persists (e.g., Allen, 1993) and correcting the excesses of banks in
extracting rents from their captive firms. On the other hand, markets are not viable options for all firms.
There are substantial fixed costs in issuing securities, making it a viable financing option mostly to large
and stable firms (Bolton and Freixas, 2000). This is also consistent with previous findings. Even in
advanced countries, small firms rely on bank financing more so than on markets (see, e.g., Petersen and
Rajan (1995) for the U.S.). Hence, bank-based systems especially support the innovative activities of
externally dependent small and young firms, broadly consistent with the key predictions of the bank-based
views that emphasize the advantages of banks in handling market imperfections.
The paper contributes to the emerging empirical literature on the financial architecture-growth
nexus. Levine (2002) examines the impact of financial architecture on per capita GDP growth, and Beck
and Levine (2002) explore whether the output growth of industries that differ in external financial
dependence depend on financial architecture. Both Levine (2002) and Beck and Levine (2002) find overall
financial development and not financial system architecture as important for growth. Tadesse (2002), by
contrast, finds that across financially underdeveloped countries, industry growth is faster in bank-based
systems than in market-based systems and vice versa across financially developed countries. Hence, as
Allen (2000) notes, the empirical evidence on the merits of bank-based and market-based systems is mixed.
In the context of this controversy, this paper is the first to empirically examine and provide evidence on the
role of financial architecture in spurring technological innovation as an engine of growth.
6
The results of the paper are robust to a number of checks, including alternative measures of the
focal variables of interest, alternative explanations of the results, omitted variables bias, and simultaneity
bias. In interpreting the results, however, the usual caveats related to possible weaknesses in the data and
the choice of a particular time period and country sample, as well as methodological issues, should apply.
The balance of the paper is organized as follows. Section I introduces the empirical
methodology and the data. Section II reports the main results. Section III provides robustness
tests, and Section IV concludes.
I. Methodology and Data
A. Empirical Model Specification I adopt the Rajan and Zingales (RZ 1998)’s “differences-in-differences” methodology to examine
the relation between financial architecture and technological innovations.2. In exploring the relation
between financial development and economic growth in a cross-industry cross-country setting, RZ make
use of the interaction term between financial development and industry’s external dependence. They
postulate that, if financial development matters, firms with larger ‘natural’ demand for external finance
should grow faster in financially developed countries. To test this, they need a measure of the ‘natural’
demand for external finance. RZ construct this measure based on the degree of external financing by U.S.
firms. They argue that the relative sophistication and efficiency of capital markets in the U.S. allows U.S.
firms to raise external capital to their desired level. Hence, there should be technological and economic
reasons why some industrial sectors depend more on external finance than others in the U.S., and that these
differences across industrial sectors should prevail in other countries as well. Thus, they use the external
dependence of U.S. industries as a proxy for technology-driven ‘natural’ degree of external dependence in
other countries, and show that industries that exhibit more external financial dependence grow faster in
financially developed countries.
2 Other studies that use the RZ methodology include, among others, Ceterolli and Gambera (2001) to study the impact of banking industry structure, and Claessens and Laeven (2003) to examine the role of property rights.
7
Similarly, I contend that industrial sectors that differ in their needs for financing innovation should
fare relatively better or worse in different financial architectures. I argue that firms may differ in their
endogenous innovative capacities unrelated to financing abilities; but some firms (e.g., small and young
firms) rely on external finance to realize their innovative capacities fully. To the extent that this financing
pattern varies across industrial sectors due to technological and market related reasons, one would expect to
find industrial sectors that especially depend on external finance for funding innovation, to realize faster
rates of innovation in either market or bank oriented financial systems. Specifically, I argue that industries
that differ in the financing patterns of their small and young firms may innovate relatively faster in either
bank or market oriented systems.
The reasoning is as follows. It is widely recognized that small and young firms are entrepreneurial
and contribute significantly to the process of innovation. For example, according to the U.S. Office of
Management and Budget, businesses employing less than 1000 employees accounted roughly half of the
nation’s innovations between 1953 and 1973 (Storey, 1983, p. 23). Acs and Audretsch (1990, 1991) also
report that small firms and independent inventors are disproportionately responsible for significant
innovations in the U.S. During the period 1945 through 1980, small firms, with fewer than 500 workers,
made 17-40% of innovations in the U.K. (Storey, 1983, p. 105), and small firms perform 22% of R&D in
Holland (Kleinknecht (1987)). And yet, the ability of small and young firms to unleash and realize their
innovative energies is critically dependent on their ability to raise the requisite financial resources. Lack of
finance becomes a binding constraint for such firms, determining their ability to pursue innovation.
There is a large literature on how firms’ rate of innovation relates to firm size and age (see, e.g.,
Cohen (1995) for review). Small firms are considered to possess certain advantages conducive for fostering
innovation, including their greater managerial control and flexibility, their motivation to foresee future
changes in technology, and their ability to attract scientists and entrepreneurs who are disillusioned by large
bureaucracy (Mazzucato, 2000; Acs and Audretsch (1991)). The empirical evidence also supports small
firms’ advantage in innovation. Bound et al. (1984), for example, find that R&D intensity is highest among
8
small firms. Based on a database of references on innovation, Acs and Audretsch (1988) conclude that
small firms disproportionately contribute to innovation.
However, it should be noted that much of this evidence is from the experiences of the U.S. The
evidence from developing countries is mixed. For example, Beck, et al. (2004) report that while a large
sector of Small and Medium Enterprises (SMEs) is an attribute of fast growing economies, SMEs may not
be an exogenous causal factor for growth and poverty alleviation. Instead, better business environment that
fosters both large and small firms contributes growth. Also, in developing countries, technology transfer
from abroad drives productivity, since there is very little R & D activity in these countries (e.g., Rosenberg,
1976), and technology transfers occur commonly through large exporting firms (e.g., Biggs et al. (1996)).
On the other hand, there is a growing policy-oriented literature that stresses the importance of small firms in
fostering economic growth. The World Bank (1994, 2002, 2004), for example, argues that small and
medium enterprises enhance innovation and competition more than do large firms, and have greater impact
in reducing unemployment. Subsequently, it has allocated over $10 billion over the last five years towards
promoting SMEs.
The rate of innovation could also be related to firms’ age in their life cycle. A number of
theoretical models predict that younger firms might be more effective in innovation. For example,
Holmstrom (1989) argues that the organizational structure of mature firms, which is designed around the
production and marketing of existing products, might compromise the incentive to innovate. Aron and
Lazear (1990) present a model where new firms are less risk-averse and, as a result, are more likely to
undertake risky R & D activity and introduce new products. The extant evidence appears to support these
views as well. In a study of the photolithographic industry, Henderson (1993) finds that established firms
were less successful in pursuing major technological opportunities. Prusa and Schmitz (1994) examines the
rate of innovation and its relation to firm age in the software industry, and finds that while established firms
appear to have comparative advantage in extending existing product lines, new firms are more effective in
creating new software categories.

9
In addition to firm size and age, limitations in financial resources could impose constraints on
firms’ ability to pursue innovations. In general, theory holds that informational problems surrounding R&D
projects make it difficult to raise external capital for their financing. Evidence also shows that financial
constraints might be important for innovation. For example, Himmelberg and Peterson (1994) report that
R&D investments are sensitive to firm cash flow in a panel of small firms, while Hall (1990) shows that
increases in leverage is associated with R & D spending.
In sum, the role of small and young firms in innovation cannot be overemphasized. It might,
nevertheless, be prudent to assume that innovative capacity might be random irrespective of firm size or
age. However, while (internally-generated) financing is the critical advantage for large and established
firms to innovate, (lack of) financing is the critical impediment for small and young firms to innovate
(Mazzucato, 2000, pp.16-7). The comparative advantages of small firms in innovation include their greater
managerial control and flexibility, their motivation to foresee future changes in technology, and their ability
to attract scientists and entrepreneurs who are disillusioned by large bureaucracy (Mazzucato, 2000, p. 17).
Yet, the ability of small and young firms to realize their innovative capacities is critically dependent on
their ability to obtain (external) finance. For example, RZ (1998) show that, in median terms, U.S. firms
raise a positive amount of external finance only in the first ten years since their formation, while the amount
is persistently close to zero for mature firms that are ten years and older. RZ also shows that this degree of
external dependence by young firms systematically vary across industrial sectors. Hence, evidence that
industrial sectors with externally dependent small and young firms realize faster rates of innovation in
market-based or bank-based systems provide a direct test of the market or bank based view of the role of
financial system configuration to innovation.
I use manufacturing industrial sectors as units of observation, and examine if industries that vary in
their external dependence for financing innovation fare better or worse in bank or market based systems.
The use of manufacturing industries reduces the dependence of the results on some country-factors that are
unique to a particular country, such as good climate or natural resource endowments. Another advantage is
that because manufacturing industries are well represented in most countries, they provide an ideal setting
10
to examine the effects of a commonly shared country-factor, such as financial architecture, on comparably
similar economic activities across countries. However, the focus on only manufacturing may raise
questions as to the applicability of the results to the entire economy. For example, manufacturing firms
have relatively higher collateral value, and it may be argued that the results may be driven by such
peculiarities that may not be generalized to other economic industries, such as the service sector. However,
because these peculiarities vary from one manufacturing industry to another, we could control for their
effects and gauge their likely contributions to explaining the observed variations in rates of innovation.
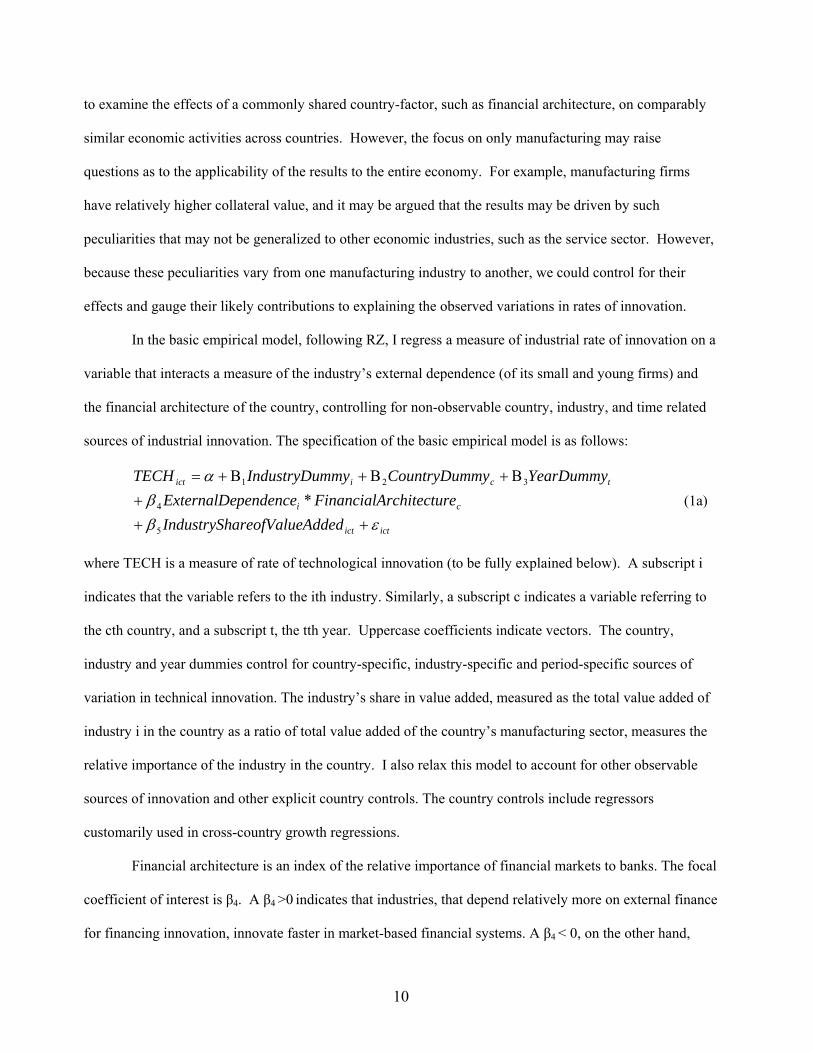
In the basic empirical model, following RZ, I regress a measure of industrial rate of innovation on a
variable that interacts a measure of the industry’s external dependence (of its small and young firms) and
the financial architecture of the country, controlling for non-observable country, industry, and time related
sources of industrial innovation. The specification of the basic empirical model is as follows:
ictict
ci
tciict
AddedareofValueIndustrySherchitecturFinancialApendenceExternalDe
YearDummymyCountryDummmyIndustryDuTECH
εββ
α
+++
Β+Β+Β+=
5
4
321
* (1a)
where TECH is a measure of rate of technological innovation (to be fully explained below). A subscript i
indicates that the variable refers to the ith industry. Similarly, a subscript c indicates a variable referring to
the cth country, and a subscript t, the tth year. Uppercase coefficients indicate vectors. The country,
industry and year dummies control for country-specific, industry-specific and period-specific sources of
variation in technical innovation. The industry’s share in value added, measured as the total value added of
industry i in the country as a ratio of total value added of the country’s manufacturing sector, measures the
relative importance of the industry in the country. I also relax this model to account for other observable
sources of innovation and other explicit country controls. The country controls include regressors
customarily used in cross-country growth regressions.
Financial architecture is an index of the relative importance of financial markets to banks. The focal
coefficient of interest is β4. A β4 >0 indicates that industries, that depend relatively more on external finance
for financing innovation, innovate faster in market-based financial systems. A β4 < 0, on the other hand,

11
citticcit νληαε +++=
would be consistent with the bank-based view. In addition, to isolate the total effect of financial
architecture, the country controls will include the variable ‘Financial Architecture’ separately. Again the
sign of the coefficient of this variable is a priori ambiguous.
The main advantage of this specification is that, by including country and industry dummies in the
regression, one derives the results from within-country/cross-industry variations of growth rates, and thus
avoid many of the country-specific “omitted variables” bias that pervades cross-country growth regressions.
Equation (1a) regresses a variable that varies across countries, industries and time (TECHcit) on
variables that are invariant across industry and time (e.g., FAc) or across country and time (e.g.,
ExternalDependencei). In addition to the common problem of omitted variables bias, such a setting may
raise concerns as to the independence of the error terms, in that observations may be correlated across years
for a given country (and industry) and/or across countries (and industries). To effectively address this
potential correlated-errors problem and the problem of omitted-variables bias, I alternatively estimate a
version of the model as a four-way random effects specification, in which the latent country-related,
industry-related and time-related sources of variation in technological change are specified as random
effects. Such a specification has two major advantages: (i) it accounts for intra-country, intra-industry and
intra-year correlations in the error terms by explicitly estimating the covariance structure of the error
matrix, and (ii) it enables the identification of the effects of country-factors, such as financial architecture,
or industry factors, such as external dependence more accurately, as it controls for all latent country-related,
industry-related and time-related sources of innovation. The model is of the following form:
ictn
i ii
ictciict
Z
AddedareofValueIndustrySherchitecturFinancialApendenceExternalDeTECH
εγ
γγα
+
+++=
∑ =6
54 *
(1b)
where: αc ∼ IID N (0, σα2) ; ηi ∼ IID N(0, ση2); λt ∼ IID N(0, σλ2); and νcit ∼ IID N(0, σν2)
αc, ηi, λt and νcit are independent from each other and also independent of the explicit
independent variables in equation (1b) above. αc is the unobservable time and industry invariant,
12
country specific effect; ηi is the unobservable country and time invariant, industry effect; λt
represents unobservable country and industry invariant, time effect; and, νcit is a random
disturbance term. The model is estimated using the method of Maximum likelihood.
B. Sample Selection
The sample is a panel of ten manufacturing industries across thirty-four countries over the period
1980 to 1995. The key variable of interest is the industry rate of technological progress over this period for
the random sample of the ten industries3. The sample period coincides with the period for which the index
of financial architecture is available, hence limiting the study period. The panel is incomplete on the time
dimension, covering a period that ranges from 4 years to 15 years for different industries. In combination
with control variables with some missing values, the incompleteness of the panel results in a total of 2177 to
2485 usable observations.
Panel C of Table 1 provides summary statistics. There is diversity in both industries and countries
in the sample, representing traditional (e.g., textile, iron and steel) and modern (e.g., pharmaceutical,
Electrical) sectors of manufacturing, as well as both developed and emerging countries in almost equal
proportion. I have complete data for thirty-five countries; however, following RZ, I use the U.S. as a
benchmark to identify externally dependent industries, and to minimize endogeneity, I exclude it from the
analysis.
C. Data
C.1. Data on Technological Innovation To measure the dependent variable, the rate of technological innovation, I estimate structured
production functions and identify technological progress as that portion of observed output growth
attributable to changes in the underlying production function as a representation of the technology. In so 3While Rajan and Zingales (1998) use the entire set of 36 manufacturing industries from the United Nations Industrial Database, the computation of rates of technological change) is based on randomly selected 10 industries. The variable in RZ (1998) is growth in value added which is readily available from the database, whereas the variable used in this paper is industry rate of technical change, the estimation of which is more involved (see Appendix B).
13
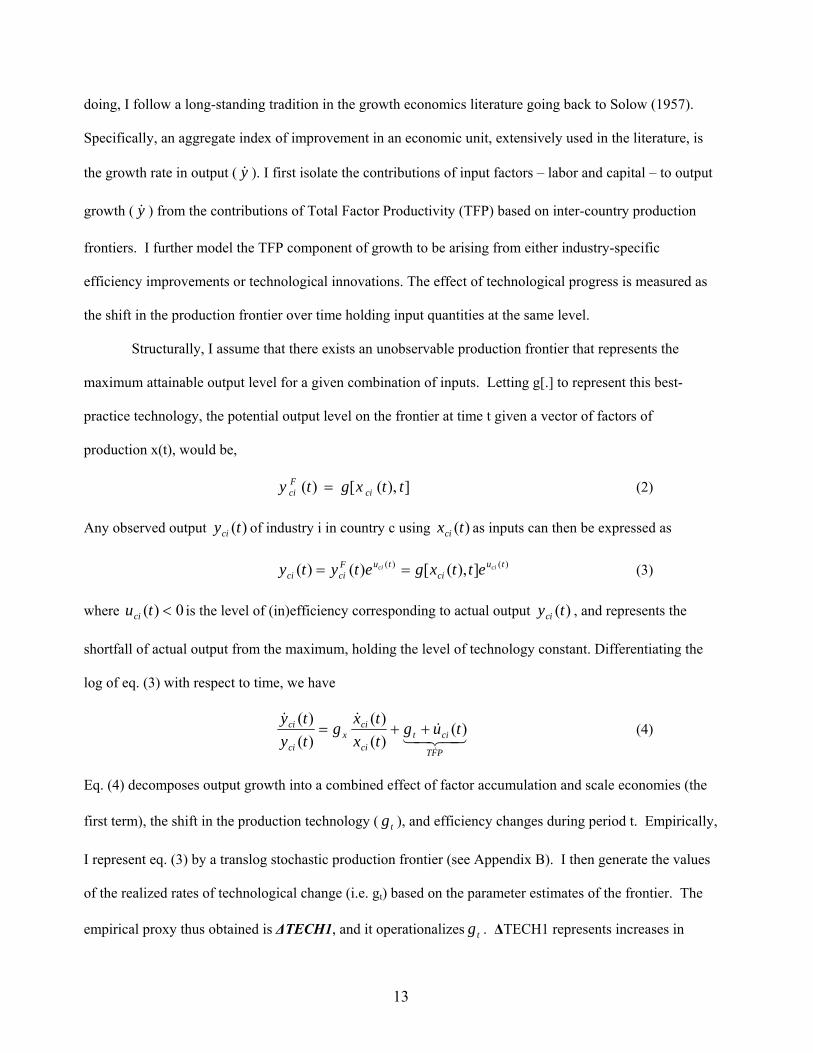
doing, I follow a long-standing tradition in the growth economics literature going back to Solow (1957).
Specifically, an aggregate index of improvement in an economic unit, extensively used in the literature, is
the growth rate in output ( y& ). I first isolate the contributions of input factors – labor and capital – to output
growth ( y& ) from the contributions of Total Factor Productivity (TFP) based on inter-country production
frontiers. I further model the TFP component of growth to be arising from either industry-specific
efficiency improvements or technological innovations. The effect of technological progress is measured as
the shift in the production frontier over time holding input quantities at the same level.
Structurally, I assume that there exists an unobservable production frontier that represents the
maximum attainable output level for a given combination of inputs. Letting g[.] to represent this best-
practice technology, the potential output level on the frontier at time t given a vector of factors of
production x(t), would be,
]),([)( ttxgty ciFci = (2)
Any observed output )(tyci of industry i in country c using )(txci as inputs can then be expressed as
)()( ]),([)()( tuci
tuFcici
cici ettxgetyty == (3)
where 0)( <tuci is the level of (in)efficiency corresponding to actual output )(tyci , and represents the
shortfall of actual output from the maximum, holding the level of technology constant. Differentiating the
log of eq. (3) with respect to time, we have
43421&
&&
&PFT
citci
cix
ci
ci tugtxtx
gtyty
)()()(
)()(
++= (4)
Eq. (4) decomposes output growth into a combined effect of factor accumulation and scale economies (the
first term), the shift in the production technology ( tg ), and efficiency changes during period t. Empirically,
I represent eq. (3) by a translog stochastic production frontier (see Appendix B). I then generate the values
of the realized rates of technological change (i.e. gt) based on the parameter estimates of the frontier. The
empirical proxy thus obtained is ∆TECH1, and it operationalizes tg . ∆TECH1 represents increases in

14
output due to shifts in the best-practice technology, g[.]. Alternatively, for testing the robustness of the
main results, I derive the corresponding measures of the rate of technical innovation based on a stochastic
cost frontier (see Section III (A) below).
The data for estimating the inter-country stochastic production and cost functions is obtained from
the United Nations Industrial Statistics database. The database, which contains manufacturing industry-
level data on production and cost characteristics, has been extensively used in the finance-growth literature
(see, e.g., Rajan and Zingales (1998)).
Table 1 provides stylized facts based on the data. There is a wide variation in economic
performance across countries (see Panel A). Realized rates of technological change ranges from –0.5 % per
annum in Sri Lanka to 3.6% in Japan. Technological progress is much faster in developed countries than in
developing economies. This may be a reflection of developed countries’ larger resource wherewithal to
fund research and development activities. On the other hand, overall productivity does not appear to be
significantly different between developed and developing countries (not reported). Realized productivity
growth in the U.S. (3.1% per annum) compares well with that of the Philippines (3.3%). There is also an
enormous variation across industries (see Panel B of Table 1), with the highest rate of technical progress
registered in Industrial Chemicals industry (2.6%) and the lowest in the Apparel industry (0.8 %). As
would be expected, traditional industries exhibit slower rates of technical progress than their younger
counterparts.
C.2. Financial Architecture There is no uniformly accepted empirical definition of whether a given country’s financial system is
market-based or bank-based. Previous studies use stylized facts based on a handful of countries such as
Germany as representatives of a bank-based system and the U.S. as the prototype of a market-based system. I
use a variety of financial architecture indicators that are based on aggregate cross-country data recently
compiled at the World Bank. The data set described in Beck, Demirguc-Kunt, and Levine (2000) contains
measures of the relative size, activity, and efficiency of the banking and the financial market sub-sectors of the

15
financial system for a broad cross-section of countries over the period 1980 to 1995. I use a continuous variable,
ARCHITECTURE, as a measure of financial architecture.
ARCHITECTURE is an index of the degree of stock market orientation of a financial system and is
based on three indices that measure the relative importance of the stock market compared to the banking sector
in an economy. The three indices are measures of the relative size, activity and efficiency of the stock market in
a given country vis-a-vis those of the banking sector. The variable ARCHITECTURE reflects the principal
component of these three variables: architecture-size, architecture-activity and architecture-efficiency. Higher
values of ARCHITECTURE indicate a more market-oriented financial system.
Architecture-Size measures the relative size of stock markets to that of banks in the financial system.
The size of the domestic stock markets is measured by the market capitalization of domestic stocks
relative to the GDP of the country. The size of the banking sector is measured by the bank credit ratio
defined as the claims of the banking sector against the private real sector as a percentage of GDP. This
excludes claims of non-bank intermediaries, and credits to the public sector. Architecture-Size
combines the two size measures as a ratio of the capitalization ratio to bank credit ratio. Larger values
indicate more market orientation in terms of relative size.
Architecture-Activity measures the activity of stock markets relative to that of banks. It is denoted by
the ratio of total value of stocks traded to bank credit ratio. Total value traded as a share of GDP
measures stock market activity relative to economic activity; bank credit ratio (defined above) indicates
the importance of banks in the economic activities of the private sector.
Architecture-Efficiency measures the relative efficiency of a country’s stock markets vis a vis that of its
banks. Efficiency of stock markets is measured by the total value traded ratio, which is defined to be the
share of total value of shares traded to GDP. Efficiency of banking is measured by bank overhead ratio,
defined to be the ratio of banking overhead costs to banking assets. Architecture-Efficiency is the
product of total value traded ratio and overhead ratio. Demirguc-Kunt, and Levine (2000) also present
measures using turnover ratio (instead of value traded) and find no different rankings.

16
I take the principal component of the three series (capitalization to bank credit ratio, value traded to
bank credit ratio, and the product of value traded and overhead ratios) and compute the composite measure
ARCHITECTURE. For robustness, I also use the construction of the variable as a means-removed simple
average of the series. In addition, I will use the three components – Architecture-size, Architecture Activity,
and Architecture-Efficiency – separately as a measure of the market-orientation of the financial system.
ARCHITECTURE provides a measure of the comparative role of banks and markets in the economy.
The underlying measures which reflect the degree of bank development and stock market liquidity are shown to
have effects on economic performance (see, Levine (1997) for review). High score on Architecture is associated
with stronger investor protection and high accounting standards (Demiguc-Kunt and Levine (2000)), indicating
that the measure of financial architecture reflects the legal and regulatory differences across countries. The
alternative measures are also closely related with each other. The main ARCHITECTURE measure is strongly
correlated with the Architecture-Size (coefficient, 0.954), Architecture-Activity (coefficient, 0.952) and
Architecture-Efficiency (coefficient, 0.639). It is also highly correlated with the measure of market orientation
independently constructed by Demiguc-Kunt and Levine (2000) as a means-removed average simple average of
the three series (correlation, 0.636), and the architecture measure by Beck and Levine (2002) as a principal
component of the series (correlation, 0.744). The Architecture variable makes the intuitively attractive
classification of the U.K., the U.S. (not in the sample), Canada and Singapore as more market-based systems,
and Germany, Austria and Portugal as more bank-based. ARCHITECTURE also identifies Japan as in between
because Japan has a large, active market. This ordering is similar to what is found in the literature (e.g., Beck
and Levine (2002)). ARCHITECTURE also displays correlations with other country factors, such as financial
development and measures of degree of property rights protection (see Table 2). This suggests the need to
carefully isolate the effects of ARCHITECTURE from the correlated country factors.
C.3. Data on Industry Characteristics I use the external financial dependence of small and young firms in industries as an industry-
attribute relevant for the degree of impact of the financial system on the industry’s technological

17
innovation. Rajan and Zingales (1998) construct a measure of the degree of external financing dependence
for manufacturing industries based on external financing in the U.S. arguing that “the dependence of U.S.
firms on external finance is a good proxy for the demand for external funds in other countries.” RZ (1998,
pp. 563). I use the external finance dependence of younger firms in the U.S. industries from RZ (1998) as a
measure of the industries’ need for external finance for innovation.
II. Results
Table 3 presents the main empirical results. The estimates of the fixed effects specification are in
Panel (a), and those using random effects in Panel (b). I begin with evaluating the impact of financial
architecture to the average industry, controlling, at the same time, for industrial heterogeneity. To do so, I
relax the specification of the basic model in eq. (1) by replacing the country dummies with explicit country-
specific variables, including ARCHITECTURE, in addition to the interaction effect. In column (1) of Table
3, financial architecture enters with a positive sign and is statistically significant, indicating that the average
industry realizes faster rate of technological progress in more market-based financial systems. It also
remains significant in the random effects specification in panel (b), though only at 5% significant level. The
result is consistent with the market-based views that markets have comparative advantages over banks in
identifying and funding innovations (Allen and Gale, 1999; Hicks, 1969; Bencivenga, Smith and Starr,
1995; and Saint-Paul, 1992). The coefficient of the interaction term is robustly negative in both the fixed
effects and the random effects specification, indicating that industries whose younger firms are more
dependent on external finance appear to do better in more bank-oriented financial systems.
This specification, however, is subject to omitted (country) variables bias, as it does not account for
variables that have been shown to be important for economic growth and, by implication, for innovations.
Examples of such variable that have been used in the growth literature include the level of PER CAPITA
GDP, HUMAN CAPITAL, PROPERTY RIGHTS, and measures of FINANCIAL DEVELOPMENT
(Romer (1990), Barro (1991), Claessens and Laeven (2003)). Levine and Zervos (1998) find that stock
market liquidity and overall bank development positively impact long-run growth. I use the STOCK

18
MARKET LIQUIDITY measured as the stock market turnover ratio, and BANK DEVELOPMENT
measured by domestic credit to the private sector to GDP ratio (following Levine and Zervos (1998), and
Cetorelli and Gambera (2001)) to control for effects of financial development, and expect the variables to
have positive effects. The importance of property rights protection for growth is increasingly recognized
(see, e.g., Claessens and Laeven (2003)). Stern et al. (2000) shows that the strength of a country’s
protection of intellectual property rights affects its innovative capacity. I use a broad index of property
rights from the International Country Risk Guide (ICRG) to measure property rights protection, and expect
it to be positively related to technological change. The level of HUMAN CAPITAL is measured as the
average of the number of years of schooling attained by the population over 25 years of age in 1995 (Barro
and Lee (2001)) and is expected to have a positive effect on growth and innovation. PER CAPITA GDP is
included to capture innovation-enhancing other institutional differences across countries. Developed
countries have the resource wherewithal to keep them on the technological edge, suggesting a positive
association between level of development and technical progress.
In the extended model shown in column (2), financial architecture enters again with a large
statistically significant positive coefficient in the fixed effects specification (without country dummies),
indicating that the market-orientation of the financial system has a positive impact on technological
progress. The average industry realizes faster rate of innovation in more market-based systems. This result
lends supports a theory that market-based systems foster technological innovations. Note, however, that as
is the case with cross-country regressions, many of the country variables have strong correlations with each
other and financial architecture (see Table 2), making the attribution of the coefficients difficult. To
alleviate this problem, we estimate the extended model as a random-effects specification (see, column (2) in
panel (b)), again with the result that financial architecture is positively (though at the margin) related to the
rate of industry technical progress. The other country controls have the expected relations with
technological progress. For example, innovation is faster in countries with better protection of property
rights. Consistent with previous studies (e.g., Levine and Zervos (1998)), financial development as
measured by stock market liquidity and bank development has significant positive impact. Hence, the level

19
of stock market and banking activities separately helps in explaining the pattern of innovation. More
importantly, the relative importance of banking to markets (as measured by financial architecture) matters
after controlling for the absolute importance of banks and markets. Human capital has a statistically
insignificant coefficient. This is comparable to Rajan and Zingales (1998)’s finding of similar effect on
industry growth. This may be a result of the poor quality of the human-capital data. The Barro-Lee measure
is too aggregate, and measures secondary schooling whose effects on industry innovation is not that certain.
In the robustness section below, I include interaction terms, showing some positive effects of human
capital. of As expected, industries in developed countries realize faster technical progress, as those
industries that are more important in the country as measured by share of industry’s value added to total
manufacturing value added.
I now turn to the focal relation of interest, namely, the differential effects of financial architecture
across industries that vary in their dependence on external finance for funding innovation. To examine this
particular channel, column (3) of Table 3 includes the interaction between external dependence and
financial architecture, where external dependence refers to that of the younger firms in the industry. I drop
the country controls including financial architecture. The model instead contains country and period
dummies, and external dependence as an industry characteristic. The result indicates that industries that
depend more on external finance by their younger firms realize relatively faster technological progress in
relatively bank-oriented countries. The interaction term is negative and statistically significant at one
percent level. External financial dependence alone does not explain industry rates of technical progress, as
the coefficient of external dependence is not different from zero. These results are replicated in column (3)
of panel (b) using the random effects specification.
Finally, in column (4) of panel (a) and (b), I estimate the regression that includes only the
interaction variable between financial architecture and external dependence, effectively controlling for all
country-related, industry-related and year-related sources of variations in the dependent variable either as
fixed effects (panel (a)) or as random variables (panel (b)). The coefficient estimates of the interaction terms
are robustly negative and significant at one percent level. It does not appear that one country or industry is
20
responsible for the results. The explanatory power of the regression goes up significantly, suggesting the
importance of omitted inter-country and inter-industry differences in explaining variations in the rates of
innovation.
The main result – i.e., that industries whose small and younger firms that are especially externally
dependent realize faster technological progress in countries with more bank-oriented financial systems – is
also economically significant. As an illustration, in the sample, the most externally dependent industry is
Plastic Products (ISIC 356) with external dependence ratio of 1.14 while Apparel (ISIC 322) is the least
externally dependent with a ratio of 0.27. Using the model estimates in column (4), the results predict that
the difference in the rate of technological progress between these industries would be about 0.365 % per
year higher in Germany (ARCHITECTURE, -0.173), which is more bank-oriented, than say in Malaysia,
which is much less bank-oriented (ARCHITECTURE, 1.287).
The two major findings so far – that market-based systems promote technological innovation and
bank-based systems promote innovation in industries that depend on external funding for innovation – may
appear in conflict. In fact, the combined results are consistent with existing theories. It suggests that
market-based systems have a positive effect on innovation but that the effect is pervasive across industries.
Market-oriented financial systems may enable the identification and financing of new technologies where
diversity of opinion persists, of which all sectors in the economy benefits (Allen, 1993, Allen and Gale
(1999)). On the other hand, introducing the relative degree of reliance on external finance by industries, we
find an industry-specific positive effect of bank-oriented (and negative effect of market-oriented) financial
system. This is consistent with a theory that banks have a comparative advantage in economizing
transactional and informational costs in funding innovations, which could be more important in sectors
whose innovative firms rely on external finance. As such, the finding is consistent with the bank-based
theories that rely on the advantages of banks in areas of information processing and monitoring (e.g., Boot,
Greenbaum and Thakor, 1993; and Rajan and Zingales, 1999b). Alternatively, markets are not viable
avenues for financing all types of firms. There are substantial fixed costs in issuing securities, making them
a viable financing option mostly for large and stable firms (Bolton and Freixas, 2000). The result is also

21
broadly consistent with previous findings. Even in advanced countries, small firms rely more heavily on
bank financing than markets (see, e.g., Petersen and Rajan, 1995). However, this does not mean that
markets do not provide financing to smaller firms. Private equity and venture capital financing, which are
relatively important sources of financing for high technology small firms, rely on the development of equity
markets for their viability.
The seemingly contradictory findings may also raise the question of which financial system design
is better in its total effect on economic growth. For example, is technological progress driven by
(presumably) large firms in market-based financial systems “better” for overall economic growth than the
progress driven by small firms in a bank-based system? First, it should be noted that technological
innovation is commonly considered the primal source of economic growth. By some counts, productivity
growth accounts for over 60 percent of cross-country variation in economic growth (see, Easterly and
Levine, 2001). Hence, the findings can also be interpreted as establishing the channel through which
financial system architecture influences economic growth – via fostering the rate of technical innovation.
Second, innovations in large and small firms are complementary in that each has a comparative advantage
at different types of innovation (see, e.g., Nooteboom, 1994). Large firms are better at the kind of
innovations that make use of economies of scale, or require large teams of specialists, such as fundamental
science innovations and large-scale applications (Cohen and Klepper, 1992). Small firms may likely be
relatively strong in innovations where effects of scale are not important, where they can make use of their
flexibility, such as in new products or product-market-combinations, modifications of existing products for
niche markets and small scale applications. Thus, to the extent that both types of innovations are useful to
an economy, the findings of this paper do not imply the desirability of one over the other.
III. Robustness Tests To ensure accurate inference and avoid mechanical explanations for the main results so far, this
section provides a series of sensitivity tests. Though the tests focus on the basic empirical model
specification, all the pertinent robustness tests have also been conducted on the first-order effects of
financial architecture, which is shown to be very robust.

22
A. Alternative Measures of Rate of Technological Innovations In the foregoing, I used, as a dependent variable, a measure of technological innovation derived
from the underlying production function as a representation of the technology as represented by g[.]. There
is another way to construct measures of technological change. Duality theory suggests that, under certain
regularity conditions4, if producers pursue cost minimizing objectives, the production function can be
uniquely represented by a cost function, and therefore one can infer the rate of technological progress from
the cost function. Letting h (.) be the best practice variable cost frontier, the minimum possible variable
cost for period t, given input price of w, the level of fixed input I, and output y is given by
)),(),(),(()( ttytItwhtC ciciciFci = (5)
Observed cost, )(tCci of industry i in country c for period t can then be expressed as:
)()( )),(),(),(()()( tcicici
tFcici
cici ettytItwhetCtC θθ == (6)
where 0)( ≥tciθ , represents the degree of economic efficiency and measures the excess of actual cost over
the minimum, holding the level of technology, input prices and output constant. Differentiating the log of
eq. (6) with respect to t, and noting that improvements in terms of costs mean cost diminution, we obtain:
⎭⎬⎫
⎩⎨⎧
++++−=− )()()(
)()(
)()(
)()(
thtyty
htItI
htwtw
htCtC
citci
ciy
ci
ciI
ci
ciw
ci
ci θ&&&&&
(7)
Eq. (7) decomposes the rate of cost diminution into share-weighted rate of growth in input prices (first
term), shadow values of fixed inputs (second term), output scale economies (third term), technological
progress (fourth term) and efficiency improvements. th represents the downward shift in the cost frontier
over time and is considered to be the cost effects of technological progress. Empirically, I represent eq. (6)
by a translog stochastic cost frontier (see Appendix B.2). I then generate the predicted values of realized
rates of real cost reduction based on the parameter estimates of the frontier. The proxy thus obtained is
∆TECH2, and is an empirical equivalent of th . 4To be a valid representation of the technology, a cost function should be a non-negative, non-decreasing function of output y; a non-negative, non-decreasing concave function in input prices; and twice differentiable with respect to input prices. Furthermore, a restricted (variable) cost function should be a non-positive and convex function of quasi-fixed input quantities.

23
Column (1) through (3) of Table 4 presents the main results using this alternative measurement of
the dependent variable. It clearly indicates that the main results are robust. Financial architecture has a
positive first-order effect (columns (1) and (2)) and a negative industry-specific second-order effect
(column (2) and (3)). Both effects are statistically highly significant and of the same order of magnitude as
those in Table 3. Although Table 4 presents only the results using the fixed effects specification, it should
be pointed out that the results hold robustly in the random effects setting5.
B. Alternative Measurement of Financial Architecture The measure of the market-orientation of the financial system, ARCHITECTURE, is constructed as
the first principal component of three separate indices that measure the relative importance of markets
versus banks in terms of their relative size, extent of activity and their relative efficiency. The variable
provides an intuitive classification of countries into bank and market based systems. The rank ordering is
also consistent with previous research (e.g., Demirguc-Kunt and Levine (2000), Beck and Levine (2002)).
To check for the robustness of the results to measurement issues related to the independent variable, I use
alternative measures in column (4) through (7) of Table 4. Column (4) uses a measure of financial
architecture constructed as a means-removed simple average of the measures of size, activity and
efficiency, and is taken from Demirguc-Kunt and Levine (2000). The result is robust to measuring
Architecture using this variable. Columns (5) through (7) use the component measures of Architecture-size,
Architecture-activity and Architecture-efficiency separately instead of the aggregate index. The result is
robust; the interaction term carries a negative coefficient that is both statistically significant and of the same
order of magnitude.
Another measurement issue involving the independent variables might have to do with the
unbalanced panel nature of the data. While the TECH is a variable that varies across countries, industries
and time, the explanatory variable, ARCHITECTURE is country level, time-invariant variable.
Throughout, we address the potential problems associated with unbalanced panel through random-effects
specification. However, as a further robustness check, columns (8) through (10) consider different
5 Results are not reported but are available from the author upon request.

24
specification of the data series. In column (8), we generate the country variables including
ARCHITECTURE as a time-series rather than as country averages and interact it with external
dependence. The result is robust. In Column (9) we perform the analysis on averages rather than on the
panel, so that average TECH for an industry (over the sample period) is regressed on the interaction of
external dependence and country-average ARCHITECTURE. To be even more consistent, column (10)
averages both the dependent variable (TECH), and the independent variables – industry external
dependence and Architecture - over the period 1980 through 1990. We also performed similar analysis on
averages taken over the 1990s (not reported). The results in all indicate that changing the design of the
empirical execution does not alter the findings.
C. Effects of Property Rights Protection The importance of property rights protection for fostering growth and innovation is increasingly
recognized (see Basley, 1995; Claessens and Laeven, 2003). Stern et al. (2000) provides strong evidence
that the degree of protection afforded to intellectual property rights affects countries’ innovative capacity.
It may be argued that, therefore, the financial architecture measure is simply a proxy for the degree of
property rights protection in the country and so the effects documented could be simply effects of better
property rights instead of financial architecture. I can check for this possibility by explicitly including
measures of property rights protection. I use six different measures of the degree to which countries protect
property rights from various sources. These are (1) a broad index of property rights from the International
Country Risk Guide (PROPERTY RIGHTS ICRG), (2) a rating of protection of property rights from the
index of economic freedom (PROPERTY FREEDOM), (3) a rating of protection of intellectual property
rights based on the “special 301” placements of the US Trade representative (INTELLECTUAL
PROPERTY), (4) a patent rights index by Ginarte and Park (1997) (PATENT RIGHTS), (5) an index of the
general legal protection of private property from the World Economic Forum (WEF), and (6) an index of
intellectual property rights from the World Economic Forum (INTELLECTUAL WEF). A detailed
definition of the variables is provided in Appendix A. These variables have been used in previous research.
25
For example, Claessens and Laeven (2003) find that property rights protection affects growth through
shaping firms’ asset allocation.
Table 4 shows that the main results are robust to inclusion of these alternative measures of property
rights. In columns (11) through (16), I include an interaction of each of the property rights variable with
external dependence in the model containing the interaction of external dependence with financial
architecture. The external dependence-financial architecture interaction is consistently negative and the
coefficients statistically significant at one-percent level. As would be expected, externally dependent
industries realize relatively faster rates of technological progress in countries with better property rights
protection6.
D. Potential Bias Due to Omitted Variables It may be argued that differences in other country specific comparative advantages (i.e., other than
financial architecture) or industry-specific characteristics (i.e., other than external dependence) may be
dictating the observed relations on industrial technological progress. However, these results cannot be
explained unless the dependence of the industry on that comparative advantage is correlated with external
financial dependence, and that financial architecture is a proxy of this unobserved country-specific
comparative advantage. I minimize the possibility of this type of omitted variable bias by focusing on only
manufacturing industries thereby reducing, for example, the influence of availability of natural resources. In
addition, however, I can directly test if financial architecture or external dependence stands for something
else.
D.1 Financial Development It could, for example, be argued that the results are simply a reflection of the well-known effects of
financial development (e.g., Rajan and Zingales (1998)). To check if this is the case, I include the
6 Claessens and Laeven (2003) include an interaction of property rights with a variable that measures the degree of intangible-assets-use in the industry in a model that contains the interaction between external dependence and financial development and find both interactions to be positive where the dependent variable is growth. I run the Claesens and Laeven (2003) type of regression with the interaction of intangible intensity against property rights included in the model that contains the external dependence-financial architecture interaction. The result is robust. The first interaction is significantly positive consistent with Claessens and Laeven (2003), and the external dependence-financial architecture interaction is significantly negative.

26
interactions of external financial dependence with measures of financial development in the basic
specification with the external-dependence-financial architecture interaction. A proxy for financial
development used in many studies (e.g., Cleassens and Laeven (2003), Cetorelli and Gambera (2001);
Rajan and Zingales (1998)) is BANK DEVELOPMENT, measured as the ratio of domestic credit to the
private sector to GDP. Rajan and Zingales (1998) also uses an aggregate measure of financial development
reflecting both the stock market and the banking sector. I construct an aggregate measure of FINANCIAL
DEVELOPMENT as a principal component of stock market capitalization, stock market turnover and bank
development. Columns (1) and (2) of Table 5 under panel (a) and panel (b) present the results. Consistent
with Rajan and Zingales (1998), externally dependent industries fare better in financially developed
countries. I highlight, however, that the main result that, externally dependent industries realize relatively
faster technological progress in bank-oriented systems, remains robust. Levine and Zervos (1998) report
that both bank development and stock market development, particularly market liquidity, independently
promote growth. Column (3) controls for STOCK MARKET LIQUIDITY measured by stock market
turnover ratio. The main result is robust. Liquid stock markets do not appear to enhance innovations by
externally dependent industries. However, secondary market turnover may not be a good proxy for the
development of stock markets particularly in developing countries, since in many countries, stock
exchanges are used primarily for new issues and have very little trading. As an alternative measure of stock
market development, I use the ratio of the number of initial public offerings to total population from La
Porta et al. (1997), the variable IPO, in columns (4). While the main results hold, consistent with previous
studies, externally dependent industries fare better in countries with more developed stock markets
measured in this way.
D.2 Human Capital It could also be argued that externally dependent industries could be dependent on human capital
as well. If financial architecture is correlated with human capital, the observed effect might be a proxy for
the interaction of the industry dependence on human capital and the availability of trained labor force in the
country. To test for this possibility, I include in columns (5) of Table 5 the interaction of HUMAN

27
CAPITAL and ARCHITECTURE in the basic model that contains the external dependence-financial
architecture interaction. The coefficient of the human capital-financial architecture interaction is not
significant while the interaction between external dependence and financial architecture is significantly
negative and is of same magnitude.
D.3 Growth Opportunities It might be argued that industry external dependence reflects industry growth opportunities. Fisman
and Love (2002) argue that external financial dependence may reflect the relative growth opportunities of
industries. Using U.S. industries’ sales growth as measures of sectoral growth opportunities, they find that
the interaction of this measure with financial development is robustly positive while the Rajan and Zingales
(1998)’ interaction between external dependence and financial development disappears.
If the argument is valid, for a given financial architecture, it is externally dependent industries that
realize faster technical progress and not those with better growth opportunities. If industrial growth
opportunities are systematically correlated with financial architecture, the reported relations between
technical progress and the interaction term will be spurious. To check for this possibility, columns (6) of
Table 5 include an interaction of a measure of industry growth opportunity and financial architecture in the
basic model that contains the interaction between external dependence and financial architecture. I use the
average growth rate in sales of U.S. industries from Fisman and Love (2002) as a measure of industrial
investment opportunities. The coefficient of the interaction between financial architecture and external
dependence is robustly negative, suggesting that financial dependence may not be a proxy for growth
opportunities. Moreover, the result replicates the positive effect of growth opportunities documented in
Fisman and Love (2002).
Another concern could be that financial architecture might be a proxy for the general countrywide
investment opportunities or for the general level of economic development. In that case, any relation
between technological change and the interaction term is spurious, because it may reflect differences in
growth opportunities rather than the differences in the comparative advantages of financial architectures in
funding industries’ innovation. The high correlation in Table 2 between the two variables provides us with
28
more concern. To check for this, I add in columns (7) the interaction of the log of per capita with external
dependence in the basic model that includes the interaction of financial architecture and external
dependence. The coefficient of the financial architecture interaction remains significantly negative.
Consistent with Rajan and Zingales (1998), the interaction with income is positive.
D.4 Technology Transfer through Foreign Investments We report so far that financial architecture with relatively stronger banking sector promotes
innovation in externally dependent industries by facilitating credit access to younger firms. However, in
many countries, innovation in manufacturing may also be driven by technology transfer via foreign
investment. Since there is little R&D activity in many developing countries, productivity growth is driven
by technological transfer from abroad (e.g., Rosenberg, 1976), and such transfers occur commonly through
large exporting firms (e.g., Biggs et al. (1996)). The concern is, therefore, whether this documented relation
between financial architecture and technological innovation is robust to accounting for the role of foreign
investments in innovation. To account for the role of technology transfer, I construct a measure of the
importance of foreign investment to a country as FDI inflows to the country as a percentage of GDP. The
variable is FDI INFLOWS, and represents the average of this ratio for each country over the sample period
of 1980 through 1995. I include, in columns (1) through (3) of Table 6, the interaction of external
dependence with FDI INFLOWS in the main regressions that contain the financial architecture-external
dependence interactions. I highlight the fact that the main findings remain significantly robust. In addition,
column (1) shows that external finance dependent firms realize faster innovation in countries with higher
FDI inflows, consistent with the idea of technology transfer from abroad as a channel of innovation.
Columns (2) document that this positive effect of FDI is in addition to the well-known effects of financial
development. As the extent of FDI inflows may reflect the overall business climate, columns (3) show that
the reported effects of FDI is also independent of or in addition to the effects of better investment climate as
measured by the broader index of property rights (PROPERTY RIGHTS ICRG), which in itself has a
positive impact on innovation. More importantly, externally dependent industries fare better in more bank-

29
oriented systems controlling for the effects of technology transfer from FDI inflows, financial development
or better investment climate.
D.5 Banking Industry Structure The main finding so far is that more bank-oriented financial architecture facilitates technological
innovation in external finance dependent industries. In addition to the relative strength of the banking
sector, its market structure or composition may have impacts on innovation. For example, a bank-oriented
country may have a relatively concentrated banking sector with one or few banks and no competition. One
would, therefore, like to check if the major findings about the effects of financial architecture are robust to
accounting for the effects of the banking industry structure. The role of banking industry structure in
fostering economic performance is unclear. Peterson and Rajan (1995) report that firms are less credit
constrained in more concentrated banking markets, and Cetorelli and Gambera (2001) find that bank
concentration promotes the growth of externally dependent firms. To account for the effects of banking
industry structure, I use a variable, BANK CONCENTRATION, which measures the share of assets of the
three largest banks in the country, or alternatively the share of the top five banks. The variables are
constructed as averages over the sample period of 1980 through 1995, based on data from BankScope.
I include the interaction of external dependence with the bank industry structure variables in the
main regressions that include the external dependence-financial architecture interactions in Columns (4) and
columns (5) of Table 6. The results indicate that externally dependent industries innovate faster in more
bank-oriented financial systems, controlling for the bank industry structures. Furthermore, externally
dependent industries realize faster innovation in concentrated banking. This is consistent with the extant
literature that emphasizes the value of close lending relationships to particularly small and younger firms
(e.g., Petersen and Rajan (1995), Cetorelli and Gambera (2001)).
D.6 Industry Characteristics In exploring the relation between architecture and innovation, we base our analysis on the
study of manufacturing industries. This is mainly driven by the fact that the UNIDO database

30
includes only industries in the manufacturing sector. In addition, there might be advantages in
relying on manufacturing industries including the fact that these are not dependent on specific
country endowments, such as favorable climate or natural resources, and that they are commonly
found in most countries. However, the focus on only manufacturing may raise questions as to the
applicability of the results to the entire economy. For example, manufacturing firms have relatively higher
collateral value, and it may be argued that the results may be driven by such peculiarities that may not be
generalized to other economic industries, such as the service sector. It is possible to check if the identified
channel is different from the effect of high collateral values of these industries. As there is wide variation in
the importance of collaterals across industries within the manufacturing sector itself, we could examine if
externally dependent industries fare well in more bank-based systems, accounting for the effects of financial
architecture on industries that vary in collaterals. To do so, I construct a measure of industry collateral
value as the ratio of tangible assets to total assets for U.S. industries based on data from the WorldScope
database. For each manufacturing firm, the ratio is computed annually and averaged over the sample period
of 1980 through 1995. The industry ratio is identified as the median of these firm averages. The variable is
TANGIBLE.
In columns (6), I include the interaction of TANGIBLE with ARCHITECTURE in the basic model
which contains the ARCHITECTURE-external dependence interactions. The results show first that the
finding that externally dependent industries innovate faster in more bank-oriented systems remain strongly
robust, showing that the identified channel is different or in addition to the effects of high collaterals. In
addition, industries high on collateral fare better in market-based systems; conversely industries with asset
composition high on intangibles prosper in more bank-oriented systems. This appears to be consistent with
the bank based views that emphasize the value of confidentiality (e.g., Yosha, 1995). Bank financing has
the advantage of maintaining the confidentiality of sensitive information while arms-length financing
naturally leads to leakage of proprietary information. Hence firms with soft, hard to monitor assets that are
prone for expropriation would be better off financing through banks than markets.
31
E. Endogeneity Issues The results from the basic regression so far do not explicitly control for the potential for endogeneity.
In examining the association between technological innovation and financial architecture, I measure the
latter using proxies that I assume to be exogenous and predetermined. It might be argued that the
configuration of the financial system adapts to the technological characteristics of the country, and hence,
financial architecture may simply be “a leading indicator rather than a causal factor”.
The cross-country cross-industry results are less susceptible than the cross-country regression
results. First, I present a reasonable explanation of the mechanism through which financial architecture
could lead to differential degree of technological progress among firms that differ in their need for external
finance for funding innovation. As an advantage over the traditional cross-country methodology, a finding
of within-country between-industry difference in technological progress based on their degree of external
dependence is, in the words of Rajan and Zingales (1998), “the smoking gun” in the debate about causality.
Second, by design, I use the U.S. industries’ external dependence to explain technological progress of
industries in other countries, thereby reducing a potential endogeneity problem if I include the U.S. in the
sample. Third, I explicitly account for potential omitted variables, such as property rights and others.
To address any remaining reverse causality concerns, however, I estimate the basic model using
instrumental variables methodology. The ideal instruments are variables that might affect financial
architecture but less likely to be affected by it. To select the appropriate instruments, I use theory and recent
empirical works. First, some identify the legal environment of countries as the critical factor that shapes its
institutions. La Porta et al (1998) argue that legal protections afforded to investors and country’s legal
origin determine financial development, and that these, in turn, are primarily determined by a country’s
colonial history. Rajan and Zingales (1998) and Levine and Zervos (1998), among many others, use these
variables as instruments for financial development. I include these variables as a potential set of
instruments. The second set is the geographic or environmental endowments of countries. The endowment
theory of economic development contends that the geographical/environmental endowment of countries has
left an indelible mark on long-lasting institutions (e.g., Acemoglu et al. (2001)). Institutions in many

32
countries’ were shaped by their experiences during European colonization. Early colonists encountered
varying climates around the world. Acemoglu et al. (2001) argue that current institutions reflect the
willingness of colonial powers to settle. In colonies with inhospitable climates (mostly the tropics), the
colonial powers avoided settlement, preferring to establish ‘extractive’ institutions; whereas, in colonies
with hospitable climates (mostly the temperate), they established settler institutions that support private
property and restrain the power of the State. Natural endowments, therefore, may influence a broad array of
institutions. I use the latitudinal distance of countries from the equator as a proxy for endowments.
Columns (7) of Table 6 present the instrumental variables (IV) results. The first stage regressions
reject the null hypothesis that the instruments do not explain any of the cross-country variation in financial
architecture. Columns (7) confirm the major finding from Table 4 and 5 that financial architecture has a
heterogonous impact on industrial technological progress. Specifically, the coefficient of the interaction
term between external dependence and financial architecture is strongly negative even when I estimate it
using instrumental variables. The exogenous components of financial architecture predetermined by the
extent of legal protection afforded to investors and the geographic /climate endowments of countries have a
statistically significant impact on technological progress. Hence, the relations between technological
innovation and financial architecture identified in this study are less likely to be explained by endogeneity.
IV. Conclusion Recent empirical research in finance and growth has established that financial development has a
positive impact on economic growth. The consensus on the finance-growth link has ignited a renewed
interest in the historic debate of whether the design of a country’s financial system matters to its long-run
economic growth, and in particular, in fostering innovations and technology. The theoretical debate on both
sides of the issue is strong, and the available evidence is both mixed and anecdotal.
The paper attempts to shade some light on this historic debate using industry-level data on a broad
cross-section of countries. The findings suggest a nontrivial impact of financial architecture on industrial
innovative activities. It documents evidence that financial architecture has a heterogeneous effect across
industries. In particular, industries whose small and young firms are relatively more dependent on external

33
finance fare better in bank based financial systems. This finding is consistent with theoretical models that
emphasize the comparative advantages of banks in resolving transactional and informational imperfections.
The study also documents evidence that market-based financial systems may have a weak positive effect on
technological progress. Regardless of their external financial dependence, this effect is common to all
sectors of the economy.
The findings indicate that the appropriate design of a country’s financial system matters for
its long-term growth, and that such a design is a source of value. The findings also suggest that the
appropriate design of financial systems is a function of the industrial structure of the county.
Moreover, given the financial architecture of the country, individual industries could attain
different rates of innovation. That is to say that the financial architecture of a country has
heterogeneous impacts on the technological progress and productivity of industries. Hence,
financial architecture plays an important role in shaping the industrial structure of the country as
well. These are the broad implications of the study. In interpreting these findings, however, the
usual caveats related to possible weaknesses in the data, the choice of the particular period of
study, as well as the choice of the specific country and industry samples, should apply.

34
Appendix A: Definition and Sources of Variables Variable Definition Sources Dependent Variables: Rates of Technological Progress
A measure of the change in real output attributable to technological innovation. It is measured as shift in the production frontier over time holding input factors and production efficiency constant, and represents increases in real output due to adoption of better technology. Annual over 1980 through 1995. Alternatively, it is measured as the rate of real cost reduction computed as the rate of downward shift in the cost function over time, holding output and cost efficiencies constant.
Constructed based on production and cost functions estimated using data form the UNIDO database.
Independent Variables: ARCHITECTURE External Dependence
An index of the degree of stock market orientation of a financial system, and is a aggregate of three indices of the market orientation based on (i) the relative size of stock market to that of banks, (ii) the relative intensity of activity in stock markets vis a vis the banking sector, and (iii) the relative efficiency of stock markets vis a vis the banking sector. The size, activity and efficiency indices are aggregated as principal component. Country averages over 1980 through 1995. A measure of the external financial needs of small firms in an industry that are less than ten years old. Measured as average over 180-90 as average for US industries.
Constructed based on data in Beck et al (2000) Rajan and Zingales (1998)
Control Variables: HUMAN CAPITAL PER CAPITA GDP SHARE STOCK MARKET CAPITALIZATION STOCK MARKET LIQUITDITY IPO BANK DEVELOPMENT FINANCIAL DEVELOPMENT FDI INFLOWS BANK CONCENTRATION PROPERTY FREEDOM INTELLECTUAL PROPERTY PATENT RIGHTS WEF INTELLECTUAL WEF PROPERTY RIGHTS ICRG U.S. industry Sales Growth LEGAL ORIGION LEGAL PROTECTION DISTANCE FROM EQUATOR
The average for 1995 of the years of schooling attained by the population over 25 years of age. The logarithm of real per capita GDP in 1980 Fraction of an industry’s real value added to the value added of the manufacturing sector. Annual. Value of listed shares of stock outstanding divided by GDP. Annual. Value of shares of stocks trades as a ratio of stock market capitalization. Annual. Ratio of the number of initial public offerings of equity in a country to its population (in million) for 1995 to 1996. Domestic credit to the private sector as a ratio of GDP. Annual The principal component of stock market capitalization, stock market liquidity and bank development The total inflows of FDI to a country as a ratio of GDP. The average FDI to GDP ratio over the period 1980 through 1995. The ratio of the assets of the top 3 or 5 largest banks to the total assets of all banks in the country. The average ratio over the sample period 1980 through 1995 are used. A rating of property rights protection (on a scale from 1 through 5), based on the degree of legal protection of private property and the likelihood of expropriation by the government. Median rating over 1995 through 1999. An index of intellectual property rights (scale 1 through 5), based on the ‘special 301’ placements of the Office of the U.S. Trade Representative (USTR). Special 301 requires the Office to identify those countries that deny adequate protection of intellectual property rights. Based on this rating, countries are categorized as Priority Foreign countries (i.e., countries with the least protection of intellectual rights), 306 monitoring, Priority Watch, Watch list and Not listed countries. Index of patent rights protection in 1980. An index of property right (scale 1 through 7) in 2001 from the World Economic Forum (WEF) An index of intellectual property rights protection (scale 1 through 7) in 2001 from the World Economic Forum (WEF) A broad index of property rights protection based on indices on the quality of bureaucracy, corruption, rule of law, risk of expropriation and risk of repudiation of contracts by the government from the International Country Risk Guide (ICRG) Real annual growth in sales of U.S. firms by industry averaged over the period 1980 through 1989. The origin of the legal tradition of the country. The origin could be English common law, French civil law, German civil law, and German civil law. Indices of the legal protection afforded to shareholders and creditors in each country The distance of the country from the equator, scaled between 0 and 1
Barro and Lee (2001) World Development Indicators Calculated from data in the UNIDO database Emerging Markets Database Emerging Markets Database La Porta et al. (1997) International Finance Series from the IMF Calculated from UNCTAD database Calculated based on data from BankScope Index of Economic Freedom, Heritage Foundation Claesssens and Laeven (2003) based on USTR Ginarte and Park (1997) Claesssens and Laeven (2003) originally from WEF Claesssens and Laeven (2003) originally from WEF Claesssens and Laeven (2003) originally from ICRG Fisman and Love (2002b) LLSV (1998) LLSV (1998) LLSV (1999)
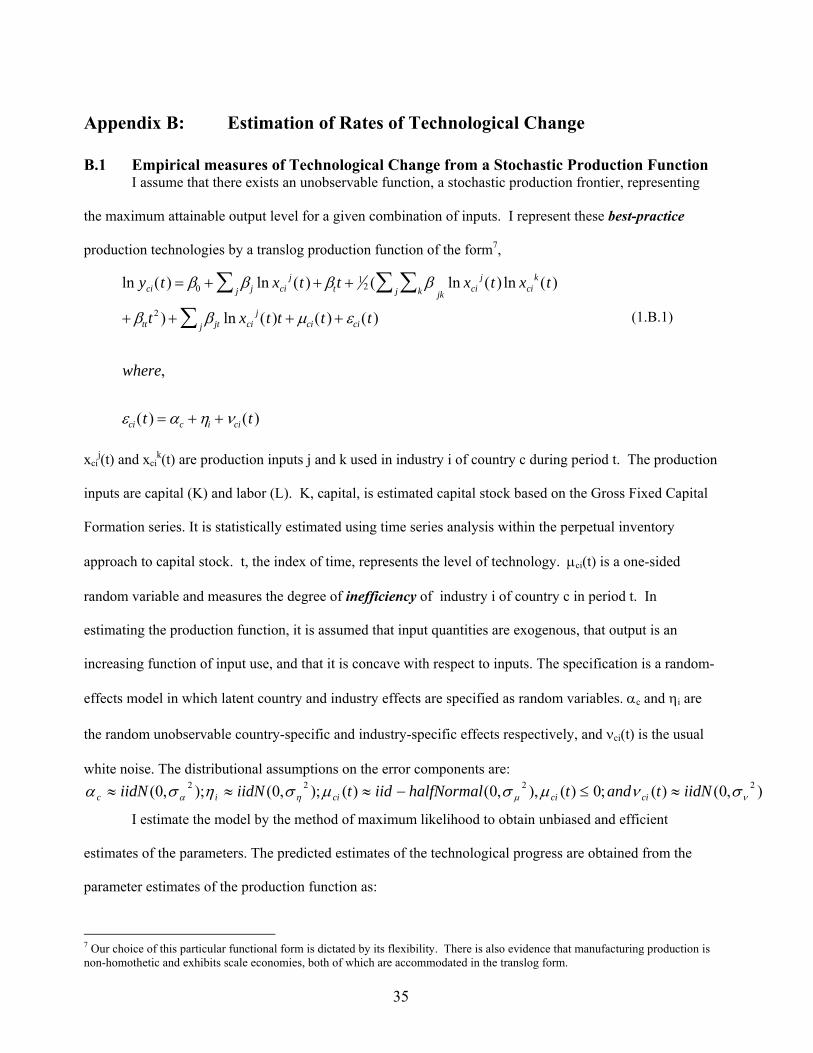
35
ln ( ) ln ( ) ( ln ( ) ln ( )
) ln ( ) ( ) ( )
,
( ) ( )
y t x t t x t x t
t x t t t t
where
t t
ci j cij
tj kj jk cij
cik
tt jt cij
cij ci
ci c i ci
= + + +
+ + + +
= + +
∑ ∑∑∑
β β β β
β β µ ε
ε α η ν
01
2
2
),0()(;0)(),,0()();,0();,0( 2222νµηα σνµσµσησα iidNtandthalfNormaliidtiidNiidN ciciciic ≈≤−≈≈≈
Appendix B: Estimation of Rates of Technological Change B.1 Empirical measures of Technological Change from a Stochastic Production Function I assume that there exists an unobservable function, a stochastic production frontier, representing
the maximum attainable output level for a given combination of inputs. I represent these best-practice
production technologies by a translog production function of the form7,
(1.B.1)
xcij(t) and xci
k(t) are production inputs j and k used in industry i of country c during period t. The production
inputs are capital (K) and labor (L). K, capital, is estimated capital stock based on the Gross Fixed Capital
Formation series. It is statistically estimated using time series analysis within the perpetual inventory
approach to capital stock. t, the index of time, represents the level of technology. µci(t) is a one-sided
random variable and measures the degree of inefficiency of industry i of country c in period t. In
estimating the production function, it is assumed that input quantities are exogenous, that output is an
increasing function of input use, and that it is concave with respect to inputs. The specification is a random-
effects model in which latent country and industry effects are specified as random variables. αc and ηi are
the random unobservable country-specific and industry-specific effects respectively, and νci(t) is the usual
white noise. The distributional assumptions on the error components are:
I estimate the model by the method of maximum likelihood to obtain unbiased and efficient
estimates of the parameters. The predicted estimates of the technological progress are obtained from the
parameter estimates of the production function as:
7 Our choice of this particular functional form is dictated by its flexibility. There is also evidence that manufacturing production is non-homothetic and exhibits scale economies, both of which are accommodated in the translog form.

36
ln ( ) ln ( ) ln ( )
{ (ln ( )) (ln ( )) } ln ( ) ln ( )
ln ( ) ln ( ) ( ) ( )
,( ) ( )
C t K t Y t t
k t Y t t K t Y t
k t t Y t t t t
wheret t
ci k ci y ci t
kk ci yy ci tt ky ci ci
kt ci yt ci ci ci
ci c i ci
= + + + +
+ + + +
+ + +
= + +
β β β β
β β β β
β β θ ε
ε α η ξ
0
2 2 212
ttxt
tyTECH ttj
jcijtt
cicit βββ
∂∂
++==∇ ∑ )(ln)(ln
1
ttYtKtTECH ttciytctkttci ββββ +++=∇ )(ln)(ln)(2
(2.B.1)
B.2 Empirical measures of Technological Change Based on Stochastic Cost Function Under certain regularity conditions, the underlying production technology can be uniquely
represented by a dual cost function. Employing this duality, I represent the underlying technology by a
restricted translog cost function of the form:
(1.B.2)
θci(t) is a one-sided random variable denoting the degree of economic inefficiency. αc and ηi are country
specific and industry specific error components. ξci(t) is the usual disturbance term with mean zero and
standard deviation σξ . The error components and the disturbance term follow the distributional assumptions
in eq. (1.B.1) above. Ln C is the log of costs. ln Y is the log of output and ln K is the log of capital stock.
Also note that, with imposition of homogeneity, the input price of labor becomes a numeraire, effectively
entering in the intercept term. An important assumption in estimating the cost function is that input prices
and the level of output are exogenous. But note that it does not assume that input prices are constant. Thus,
for example, increased labor and other costs over time due to increased regulations in some countries are
accommodated in the model. On the other hand, while structural changes that affect input prices or output
levels are easily reflected in the model, those that affect parameter shifts are not. Other assumptions include
that the cost function is a non-decreasing and concave function in input prices, and that it is a non-
decreasing function of output. The empirical measure of technological progress based on the cost function
represents the rate of cost reduction per year and is given by:
(2.B.2)

37
References
Acemoglu, D., S. Johnson and J. A. Robinson, 2001, “The Colonial Origins of Comparative Development: An Empirical Investigation,” American Economic Review 91, 1369-1401. Acs, Z. J., and D. Audretsch, 1988, “Innovation in Large and Small Firms: An Empirical Analysis,” American Economic Review 78, 678-690. Acs, Z.J. and Audretsch, D.B., 1990, Innovation and Small Firms, Cambridge: The MIT Press. Acs, Z.J. and Audretsch, D.B., 1991, “R&D, Firm Size and Innovative Activity”, in Z.J. Acs and D.B. Audretsch, Ed., Innovation and Technological Change, London: Harvester Wheatsheaf, pp39-59. Allen, F., 1993, “Stock Markets and Resource Allocation,” in:C. Mayer and X. Vives, Ed., Capital Markets and Financial Intermediation, Cambridge University Press, Cambridge. Allen, F., and D. Gale, 1995, “A Welfare Comparison of Intermediaries and Financial Markets in Germany and the U.S.” American Economic Review 39, 179-209. Allen, F., and D. Gale, 1999, “Diversity of Opinion and the Financing of New Technologies,” Journal of Financial Intermediation 8, 68-89. Aron, D., and E. Lazear, 1990, “The Introduction of New Products,” American Economic Review Papers and Proceedings 80, 421-426. Bagehot, W., 1873, Lombard Street, Homewood, Illionois: Irwin (1962 edition). Barro, R.J, 1991, “Economic Growth in a Cross Section of Countries,” Quarterly Journal of Economics 106, 407-443. Barro, R., and J. Lee, 2001, “International Data on Educational Attainment: Updates and Implications,” Oxford Economic Papers, 53,541-63. Beck, T., A. Demirguc-Kunt, and R. Levine, 2004, “SMEs, Growth, and Poverty: Cross Country Evidence,” World Bank Working Paper. Beck, T., A. Demirguc-Kunt, and R. Levine, 2000, “A New Database on Financial Development and Structure,” World Bank Economic Review 14, 597-605. Beck, T., and Levine, R., 2002, “Industry Growth and Capital Allocation: Does Having a Market-or Bank-Based System Matter?” Journal of Financial Economics 64, 147-80. Bencivenga, V. and B. Smith, 1991, “Financial Intermediation and Endogenous Growth,” Review of Economic Studies, 58, 195-209. Bencivenga, V., B. Smith, and R. M. Starr, 1995, “Transactions Costs, Technological Choice, and Endogenous Growth,” Journal of Economic Theory 67, 153-177. Besley, T., 1995, “Property Rights and Investment Incentives: Theory and Evidence from Ghana,” Journal of Political Economy 103, 903-937.

38
Biggs, T., M. Shah, and P. Srivastava, 1996, “Technological Capability and Learning in African Firms,” World Bank Technical Paper.
Bolton, P., and Freixas, X., 2000, “Equity, Bonds, and Bank Debt: Capital Structure and Financial Market Equilibrium under Asymmetric Information,” Journal of Political Economy 108, 324-51. Boot, A., and Thakor, A.V., 1997, “Financial Systems Architecture,” Review of Financial Studies 10, 693-733. Bound, J., C. Cummins, Z. Griliches, B. Hall, and A. Jaffe, 1984, “Who Does R &D and Who Patents?” in Z. Griliches, ed., R&D, Patents and Productivity, University of Chicago Press, Chicago. Boyd, J. and B. Smith, 1996, “The Co-Evolution of the Real and Financial Sectors in the Growth Process,” World Bank Economic Review 10, 371-96. Boyd, J. and B. Smith, 1998, “The Evolution of Debt and Equity Markets in Economic Development,” Economic Theory 12, 519-60. Ceterolli, N., and M. Gambera, 2001, “Banking Market Structure, Financial Dependence and Growth: International Evidence from Industry Data,” Journal of Finance 56, 617-648. Claessens, S. and L. Laeven, 2003, “Financial Development, Property Rights, and Growth,” Journal of Finance 58, 2401-36. Cohen, W., 1995, “Empirical Studies of Innovative Activity,” in P. Stoneman, ed., Handbook of the Economics of Innovation and Technological Change, Blackwell, Cambridge, MA. Cohen, W. and Klepper, S, 1992, “The Anatomy of R & D Intensity Distributions,” American Economic Review 82, 773-99. Demirguc-Kunt, A. and R. Levine, 2000, “Financial Structure Across Countries: Stylized Facts,” World Bank Policy Research Working Paper 2146. Fisman, R., and I. Love, 2002, Patterns of Industrial Development Revisited: The Role of Finance, Working Paper, Columbia University. Fok, R., Y. Chang and W. Lee, 2004, “Bank Relationships and Their Effects on Firm Performance around the Asian Financial Crisis: Evidence from Taiwan,” Financial Management 33,80-112. Gerschenkron, A. 1962, Economic Backwardness in Historical Perspective, A Book of Essays. Cambridge, MA: Harvard University Press. Ginarte, J., and W. Park, 1997, “Determinants of Patent Rights: A Cross-National Study,” Research Policy 26, 283-301. Greenwood, J. and B. Jovanovic, 1990, “Financial Development, Growth, and the Distribution of Income,” Journal of Political Economy 98, 1076-1107. Goldsmith, R.W., 1969, Financial Structure and Development. New Haven, CT: Yale University Press. Hall, B., 1990, “The Impact of Corporate Restructuring on Industrial Research and Revelopment,” Brookings Papers on Economic Activity 85-124.

39
Henderson, R., 1993, “Underinvestment and Incompetence as Responses to Radical Innovation: Evidence from the Photolithographic Alignment Equipment Industry,” Rand Journal of Economics 24, 248-270. Himmelberg, C. and B. Petersen, 1994, “R & D and Internal Finance: A Panel Study of Small Firms in High-tech Industries,” Review of Economics and Statistics 76, 38-51. Hicks, J.R., 1969, A Theory of Economic History, Oxford, U.K.: Clarendon Press. Holmstrom, B., 1989, “Agency Costs and Innovation,” Journal of Economic Behavior and Organization 12, 305-327. Kleinknecht, A., 1987, “Measuring R&D in Small Firms: How Much are We Missing?” Journal of Industrial Economics 36, 253-56. La Porta, R., Lopez-de-Silanes, F., Shleifer, A., Vishny, R., 1999, “The Quality of Government,” Journal of Law, Economics, and Organization 15, 222-279. La Porta, R., Lopez-de-Silanes, F., Shleifer A., Vishny R., 1998, “Law and Finance,” Journal of Political Economy 106, 1113-55. La Porta, R., F. Lopez-de-Silanes, A. Shleifer, and R. Vishny, 1997, “The Legal Determinants of External Finance,” Journal of Finance 52, 1131-50.
Levine, R., 1997, “Financial Development and Economic Growth: Views and Agenda,” Journal of Economic Literature 35, 688-726. Levine, Ross and S. Zervos, 1998, “Stock Markets, Banks, and Economic Growth,” American Economic Review 88, 537-559.
Levine, R., 2002, “Bank-Based or Market-Based Financial Systems: Which is Better?” Journal of Financial Intermediation 11, 398-428.
Mazzucuto, M., 2000, Firm Size, Innovation, and Market Structure, Northampton, MA: Edward Elgar Publishing, Inc. Nooteboom, B., 1994, “Innovation and Diffusion in Small Firms: Theory and Evidenc,” Small Business Economics, 6, 327-47. Petersen, M. and Rajan, R., 1995, “The effect of credit market competition on lending relationships,” Quarterly Journal of Economics 110, 407-443.
Prusa, T., and J. Schmitz, 1994, “Can Companies Maintain Their Initial Innovation Trust? A Study of the PC Software Industry,” Review of Economics and Statistics 76, 523-40. Rajan, R., 1992, “Insiders and Outsiders: The Choice Between Informed and Arms Length Debt,” Journal of Finance 47, 1367-1400.
Rajan, R. and L. Zingales, 1998, “Financial Dependence and Growth,” American Economic Review 88, 559-587.

40
Rajan, R. and L. Zingales, 1999a, “Financial Systems, Industrial Structure and Growth,” working paper, University of Chicago. Rajan, R. and L. Zingales, 1999b, “Which Capitalism? Lessons from the East Asian crisis,” Journal of Applied Corporate Finance 11, 40-48. Rosenberg, N., 1976, Perspectives on Technology, Cambridge: Cambridge University. Rothwell, R. and Dodgson, M., 1994, “Innovation and Size of Firm,” in M. Dodgson and R. Rothwell, Aldershot Hants, Ed., The Handbook of Industrial Innovation, Edward Elgar Publishing Inc. Saint-Paul, Gilles, 1992, “Technological Choice, Financial Markets and Economic Development,” European Economic Review 36, 763-81. Schumpeter, J.A., 1912, The Theory of Economic Development, Harvard University Press, Cambridge, MA. Stern, S., M. Porter, and J. Furman, 2000, “The determinants of national innovative capacity,” NBER working paper No. 7876. Solow, R., 1957, “Technical Change and the Aggregate Production Function,” Review of Economics and Statistics 39, 312-20. Stiglitz, J., 1985, “Credit Markets and the Control of Capital,” Journal of Money, Credit and Banking 17, 133-52. Storey, D., 1983, The Small Firm: An International Survey, Croom Helm, London/Canberra, and St. Martin’s Press, New York. Stulz, R., 2000, “Financial Structure, Corporate Finance, and Economic Growth,” International Review of Finance 1, 11-38. Tadesse, S., 2002, “Financial Architecture and Economic Performance: International Evidence,” Journal of Financial Intermediation 11, 429-54. Tadesse, S., 2006, “Innovation, Information, and Financial Architecture” Journal of Financial and Quantitative Analysis, forthcoming. Yosha, K., 1995, “Information Disclosure Costs and Choices of Financing Source,” Journal of Financial Intermediation 4, 429-54. Weinstein, D. and Y. Yafeh, 1998, “On the Costs of a Bank-Centered Financial System: Evidence from the Changing Main Bank Relations in Japan,” Journal of Financial Economics 532, 635-72. Wenger, E. and C. Kaserer, 1998, “The German System of Corporate Governance: A Model Which Should not be Lmitated” In Black, S. and M. Moersch, Ed., Competition and Convergence in Financial Markets: The German and Anglo-American Models, New York: North-Holland Press, pp. 41-78. World Bank, 1994, “Can Intervention Work? The Role of Government in SME Success.” Washington, DC. World Bank, 2002, SME. World Bank Group Review of Small Business Activities. Washington, DC.

41
World Bank, 2004, World Bank Group Support for Small Business. Washington, DC.

42
Table 1: Technological Progress and Financial Architecture: Averages over the period 1980-1995.
Growth in real value added is the annual compounded growth rate in real value added for each of the ten industries in each of the thirty-eight countries over the period 1980 to 1995. Technological Progress (∆TECH1) measures the shift in the production frontier over time, and represents increases in real output due to adoption of better technology. The alternative measure of technological progress (∆TECH2) measures the rate of downward shift in the cost function over time, holding output constant and represents the decrease in total cost due to better technologies. Industry Share in Manufacturing is calculated by dividing the real output of the industry in the country by the total real output of the manufacturing sector of the country. Financial architecture is a continuous variable that measures the degree of market orientation of a financial system and is a principal component of the size, activity, efficiency dimensions of financial architecture. ). Per Capita GDP is the logarithm of real GDP per capita in 1980.
Rate of Technological Progress (based on Stochastic Production Frontier) ( 1TECH∇ )
Rate of Technological Progress (based on Stochastic Cost Frontier) ( 2TECH∇ )
Industry Share in Manufacturing (SHARE)
Financial Architecture (ARCHITECTURE)
Log(Per Capita GDP)
Panel A: Averages by Countries Australia 0.023 0.030 0.043 0.938 9.704 Austria 0.023 0.027 0.038 -1.552 9.856 Belgium 0.027 0.031 0.032 0.205 9.791 Canada 0.024 0.029 0.029 0.951 9.899 Chile 0.012 0.022 0.026 0.198 6.086 Colombia 0.014 0.024 0.061 -0.314 7.711 Denmark 0.020 0.026 0.050 -0.037 7.096 Egypt 0.015 0.026 0.061 -1.104 10.085 Finland 0.020 0.024 0.042 -0.593 10.081 Germany 0.033 0.035 0.045 -0.173 9.963 Greece 0.017 0.023 0.054 -0.512 8.968 India 0.015 0.028 0.051 -2.604 5.780 Indonesia 0.007 0.021 0.040 -2.350 6.315 Israel 0.014 0.022 0.037 0.465 9.287 Italy 0.028 0.032 0.051 -0.486 9.757 Japan 0.036 0.036 0.046 0.676 9.966 Jordan 0.022 0.023 0.123 0.554 7.008 Korea 0.022 0.027 0.055 0.491 8.527 Malaysia 0.016 0.023 0.043 1.287 7.730 Mexico 0.016 0.023 0.055 0.768 7.975 Netherlands 0.025 0.028 0.057 0.454 9.786 New Zealand 0.015 0.023 0.068 0.651 9.444 Norway 0.021 0.027 0.043 -0.207 10.179 Pakistan 0.006 0.019 0.043 -0.260 5.794 Peru 0.019 0.026 0.051 0.433 7.524 Philippines 0.010 0.022 0.058 0.355 6.566 Portugal 0.022 0.028 0.048 -2.439 8.690 Singapore 0.013 0.021 0.037 1.295 9.422 Spain 0.025 0.029 0.045 -0.353 6.496 Sri Lanka -0.005 0.014 0.079 -0.290 9.344 Sweden 0.021 0.028 0.040 0.759 10.123 Turkey 0.018 0.025 0.046 0.711 7.880 U. K. 0.030 0.033 0.044 1.112 6.984 Venezuela 0.024 0.029 0.047 -0.434 9.949
Panel B: Averages by Industries Food Products (ISIC 311) 0.022 0.029 0.116 Beverages (ISIC 313) 0.023 0.028 0.041 Tobacco (ISIC 314) 0.019 0.024 0.028 Textiles (ISIC 321) 0.021 0.028 0.056 Wearing Apparel (ISIC 322) 0.008 0.010 0.029 Industrial Chemicals(ISIC351) 0.026 0.030 0.050 Rubber Products (ISIC355) 0.017 0.024 0.015 Plastic Products (ISIC 356) 0.014 0.023 0.021 Iron and Steel (ISIC 371) 0.026 0.031 0.041 Machinery, except Electrical (ISIC 382) 0.016 0.024 0.067
Panel C: All Observations No. of observations Mean Standard Dev. Minimum Maximum
2679
0.019 0.012 -0.019 0.056
2679
0.026 0.007 0.003 0.053
2626
0.044 0.041 0.002 0.326
34
-0.154 1.051 -2.604 1.295
34
8.627 1.380 5.780 10.179
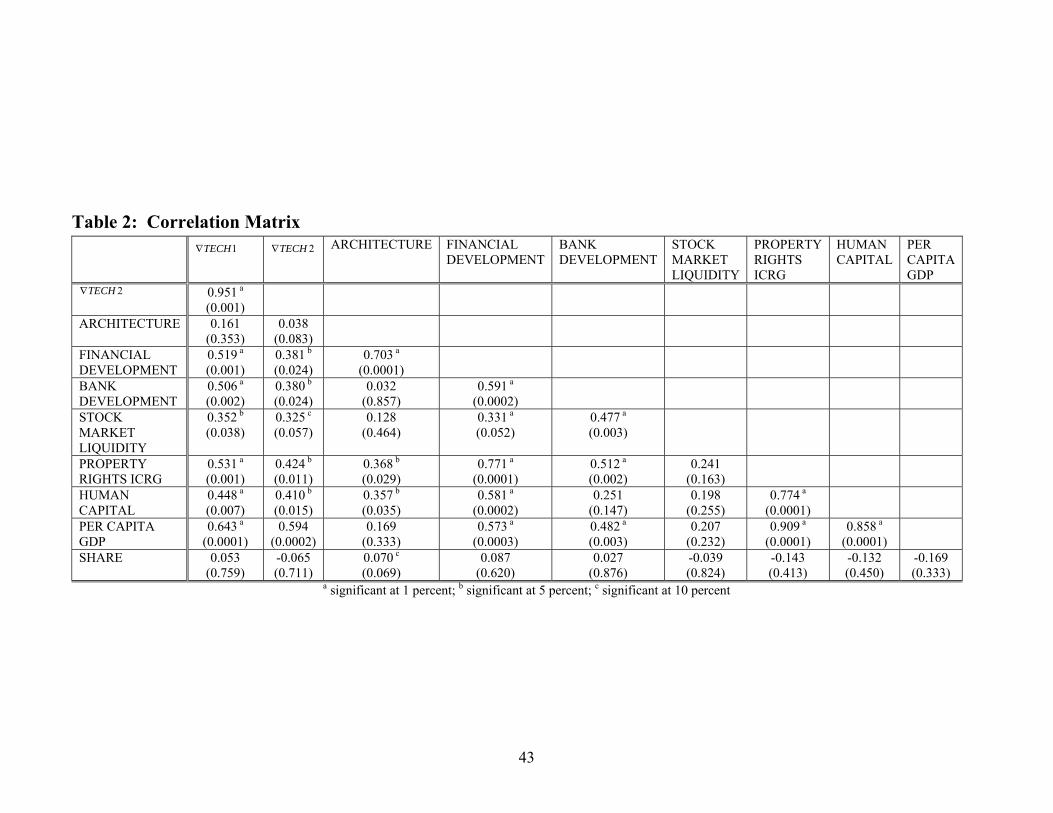
43
Table 2: Correlation Matrix 1TECH∇ 2TECH∇ ARCHITECTURE FINANCIAL
DEVELOPMENT BANK DEVELOPMENT
STOCK MARKET LIQUIDITY
PROPERTY RIGHTS ICRG
HUMAN CAPITAL
PER CAPITA GDP
2TECH∇ 0.951 a (0.001)
ARCHITECTURE 0.161 (0.353)
0.038 (0.083)
FINANCIAL DEVELOPMENT
0.519 a (0.001)
0.381 b (0.024)
0.703 a (0.0001)
BANK DEVELOPMENT
0.506 a (0.002)
0.380 b (0.024)
0.032 (0.857)
0.591 a (0.0002)
STOCK MARKET LIQUIDITY
0.352 b (0.038)
0.325 c (0.057)
0.128 (0.464)
0.331 a (0.052)
0.477 a (0.003)
PROPERTY RIGHTS ICRG
0.531 a (0.001)
0.424 b (0.011)
0.368 b (0.029)
0.771 a (0.0001)
0.512 a (0.002)
0.241 (0.163)
HUMAN CAPITAL
0.448 a (0.007)
0.410 b (0.015)
0.357 b (0.035)
0.581 a (0.0002)
0.251 (0.147)
0.198 (0.255)
0.774 a (0.0001)
PER CAPITA GDP
0.643 a (0.0001)
0.594 (0.0002)
0.169 (0.333)
0.573 a (0.0003)
0.482 a (0.003)
0.207 (0.232)
0.909 a (0.0001)
0.858 a (0.0001)
SHARE 0.053 (0.759)
-0.065 (0.711)
0.070 c (0.069)
0.087 (0.620)
0.027 (0.876)
-0.039 (0.824)
-0.143 (0.413)
-0.132 (0.450)
-0.169 (0.333)
a significant at 1 percent; b significant at 5 percent; c significant at 10 percent

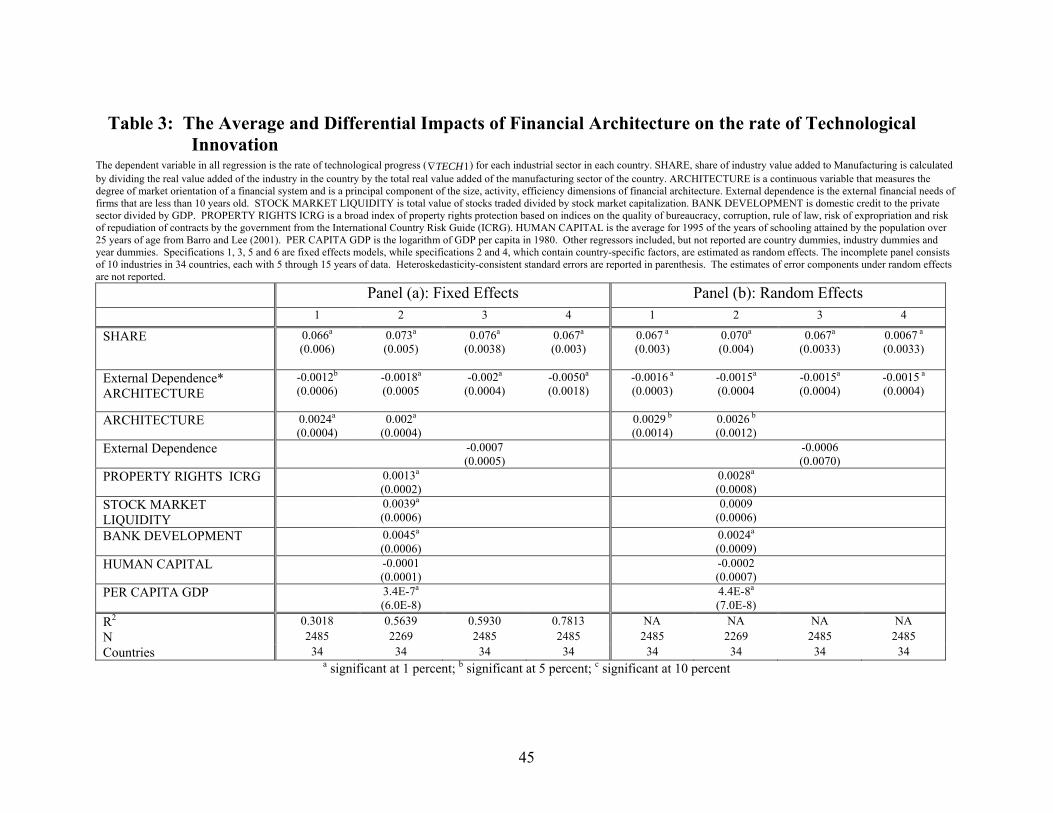
45
Table 3: The Average and Differential Impacts of Financial Architecture on the rate of Technological Innovation
The dependent variable in all regression is the rate of technological progress ( 1TECH∇ ) for each industrial sector in each country. SHARE, share of industry value added to Manufacturing is calculated by dividing the real value added of the industry in the country by the total real value added of the manufacturing sector of the country. ARCHITECTURE is a continuous variable that measures the degree of market orientation of a financial system and is a principal component of the size, activity, efficiency dimensions of financial architecture. External dependence is the external financial needs of firms that are less than 10 years old. STOCK MARKET LIQUIDITY is total value of stocks traded divided by stock market capitalization. BANK DEVELOPMENT is domestic credit to the private sector divided by GDP. PROPERTY RIGHTS ICRG is a broad index of property rights protection based on indices on the quality of bureaucracy, corruption, rule of law, risk of expropriation and risk of repudiation of contracts by the government from the International Country Risk Guide (ICRG). HUMAN CAPITAL is the average for 1995 of the years of schooling attained by the population over 25 years of age from Barro and Lee (2001). PER CAPITA GDP is the logarithm of GDP per capita in 1980. Other regressors included, but not reported are country dummies, industry dummies and year dummies. Specifications 1, 3, 5 and 6 are fixed effects models, while specifications 2 and 4, which contain country-specific factors, are estimated as random effects. The incomplete panel consists of 10 industries in 34 countries, each with 5 through 15 years of data. Heteroskedasticity-consistent standard errors are reported in parenthesis. The estimates of error components under random effects are not reported.
Panel (a): Fixed Effects Panel (b): Random Effects 1 2 3 4 1 2 3 4
SHARE 0.066a
(0.006) 0.073a
(0.005) 0.076a
(0.0038) 0.067a
(0.003) 0.067 a (0.003)
0.070a
(0.004) 0.067a
(0.0033) 0.0067 a (0.0033)
External Dependence* ARCHITECTURE
-0.0012b
(0.0006) -0.0018a
(0.0005 -0.002a
(0.0004) -0.0050a
(0.0018) -0.0016 a (0.0003)
-0.0015a
(0.0004 -0.0015a
(0.0004) -0.0015 a (0.0004)
ARCHITECTURE 0.0024a
(0.0004) 0.002a
(0.0004) 0.0029 b
(0.0014) 0.0026 b
(0.0012)
External Dependence -0.0007 (0.0005)
-0.0006 (0.0070)
PROPERTY RIGHTS ICRG 0.0013a
(0.0002) 0.0028a
(0.0008)
STOCK MARKET LIQUIDITY
0.0039a
(0.0006) 0.0009
(0.0006)
BANK DEVELOPMENT 0.0045a
(0.0006) 0.0024a
(0.0009)
HUMAN CAPITAL -0.0001
(0.0001) -0.0002
(0.0007)
PER CAPITA GDP 3.4E-7a
(6.0E-8) 4.4E-8a
(7.0E-8)
R2 0.3018 0.5639 0.5930 0.7813 NA NA NA NA N 2485 2269 2485 2485 2485 2269 2485 2485 Countries 34 34 34 34 34 34 34 34
a significant at 1 percent; b significant at 5 percent; c significant at 10 percent
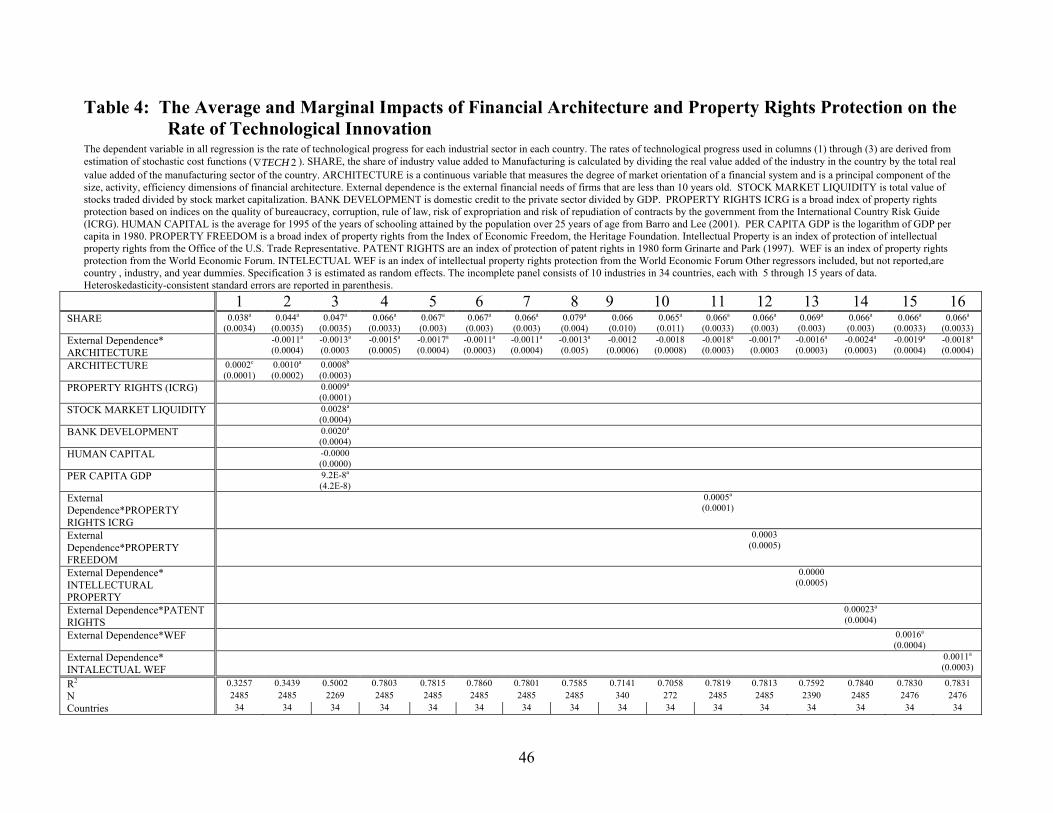
46
Table 4: The Average and Marginal Impacts of Financial Architecture and Property Rights Protection on the Rate of Technological Innovation
The dependent variable in all regression is the rate of technological progress for each industrial sector in each country. The rates of technological progress used in columns (1) through (3) are derived from estimation of stochastic cost functions ( 2TECH∇ ). SHARE, the share of industry value added to Manufacturing is calculated by dividing the real value added of the industry in the country by the total real value added of the manufacturing sector of the country. ARCHITECTURE is a continuous variable that measures the degree of market orientation of a financial system and is a principal component of the size, activity, efficiency dimensions of financial architecture. External dependence is the external financial needs of firms that are less than 10 years old. STOCK MARKET LIQUIDITY is total value of stocks traded divided by stock market capitalization. BANK DEVELOPMENT is domestic credit to the private sector divided by GDP. PROPERTY RIGHTS ICRG is a broad index of property rights protection based on indices on the quality of bureaucracy, corruption, rule of law, risk of expropriation and risk of repudiation of contracts by the government from the International Country Risk Guide (ICRG). HUMAN CAPITAL is the average for 1995 of the years of schooling attained by the population over 25 years of age from Barro and Lee (2001). PER CAPITA GDP is the logarithm of GDP per capita in 1980. PROPERTY FREEDOM is a broad index of property rights from the Index of Economic Freedom, the Heritage Foundation. Intellectual Property is an index of protection of intellectual property rights from the Office of the U.S. Trade Representative. PATENT RIGHTS are an index of protection of patent rights in 1980 form Grinarte and Park (1997). WEF is an index of property rights protection from the World Economic Forum. INTELECTUAL WEF is an index of intellectual property rights protection from the World Economic Forum Other regressors included, but not reported,are country , industry, and year dummies. Specification 3 is estimated as random effects. The incomplete panel consists of 10 industries in 34 countries, each with 5 through 15 years of data. Heteroskedasticity-consistent standard errors are reported in parenthesis.
1 2 3 4 5 6 7 8 9 10 11 12 13 14 15 16 SHARE 0.038a
(0.0034) 0.044a
(0.0035) 0.047a
(0.0035) 0.066a
(0.0033) 0.067a
(0.003) 0.067a
(0.003) 0.066a
(0.003) 0.079a
(0.004) 0.066
(0.010) 0.065a
(0.011) 0.066a
(0.0033) 0.066a
(0.003) 0.069a
(0.003) 0.066a
(0.003) 0.066a
(0.0033) 0.066a
(0.0033) External Dependence* ARCHITECTURE
-0.0011a
(0.0004) -0.0013a
(0.0003 -0.0015a
(0.0005) -0.0017a
(0.0004) -0.0011a
(0.0003) -0.0011a
(0.0004) -0.0013a
(0.005) -0.0012 (0.0006)
-0.0018 (0.0008)
-0.0018a
(0.0003) -0.0017a
(0.0003 -0.0016a
(0.0003) -0.0024a
(0.0003) -0.0019a
(0.0004) -0.0018a
(0.0004)
ARCHITECTURE 0.0002c
(0.0001) 0.0010a
(0.0002) 0.0008b
(0.0003)
PROPERTY RIGHTS (ICRG) 0.0009a
(0.0001)
STOCK MARKET LIQUIDITY 0.0028a
(0.0004)
BANK DEVELOPMENT 0.0020a
(0.0004)
HUMAN CAPITAL -0.0000
(0.0000)
PER CAPITA GDP 9.2E-8a
(4.2E-8)
External Dependence*PROPERTY RIGHTS ICRG
0.0005a
(0.0001)
External Dependence*PROPERTY FREEDOM
0.0003 (0.0005)
External Dependence* INTELLECTURAL PROPERTY
0.0000 (0.0005)
External Dependence*PATENT RIGHTS
0.00023a
(0.0004)
External Dependence*WEF 0.0016a
(0.0004)
External Dependence* INTALECTUAL WEF
0.0011a
(0.0003)
R2 0.3257 0.3439 0.5002 0.7803 0.7815 0.7860 0.7801 0.7585 0.7141 0.7058 0.7819 0.7813 0.7592 0.7840 0.7830 0.7831 N 2485 2485 2269 2485 2485 2485 2485 2485 340 272 2485 2485 2390 2485 2476 2476 Countries 34 34 34 34 34 34 34 34 34 34 34 34 34 34 34 34
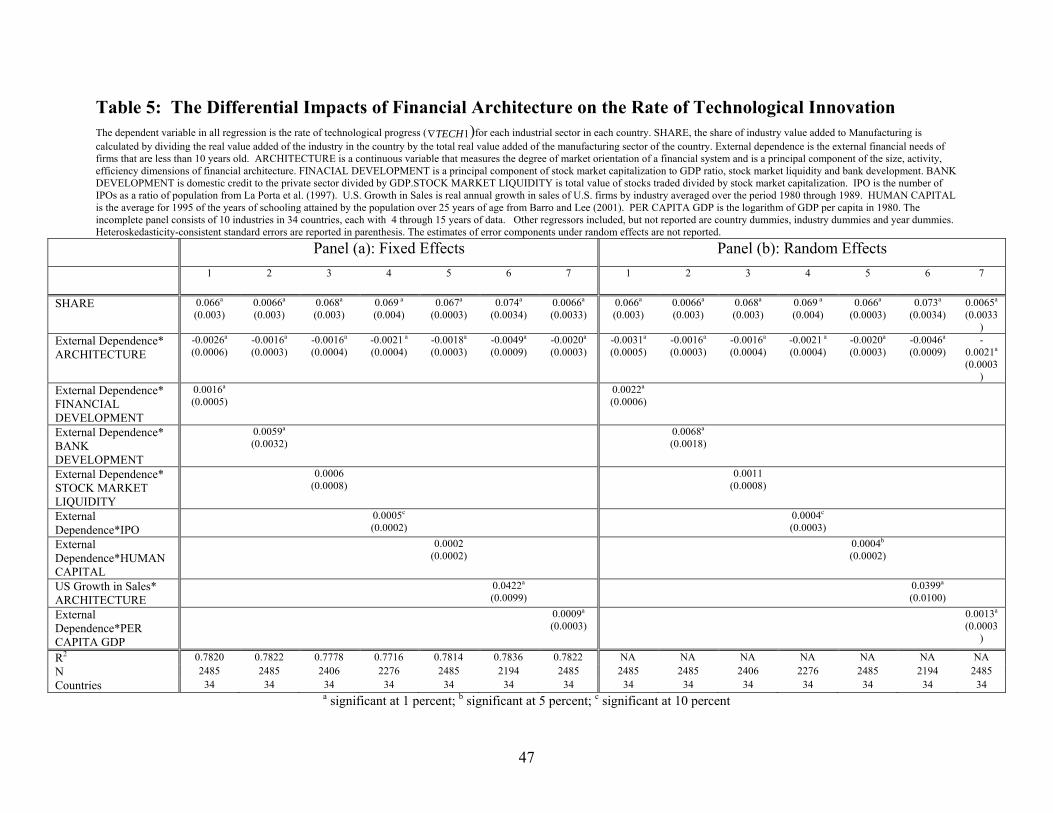
47
Table 5: The Differential Impacts of Financial Architecture on the Rate of Technological Innovation The dependent variable in all regression is the rate of technological progress ( 1TECH∇ )for each industrial sector in each country. SHARE, the share of industry value added to Manufacturing is calculated by dividing the real value added of the industry in the country by the total real value added of the manufacturing sector of the country. External dependence is the external financial needs of firms that are less than 10 years old. ARCHITECTURE is a continuous variable that measures the degree of market orientation of a financial system and is a principal component of the size, activity, efficiency dimensions of financial architecture. FINACIAL DEVELOPMENT is a principal component of stock market capitalization to GDP ratio, stock market liquidity and bank development. BANK DEVELOPMENT is domestic credit to the private sector divided by GDP.STOCK MARKET LIQUIDITY is total value of stocks traded divided by stock market capitalization. IPO is the number of IPOs as a ratio of population from La Porta et al. (1997). U.S. Growth in Sales is real annual growth in sales of U.S. firms by industry averaged over the period 1980 through 1989. HUMAN CAPITAL is the average for 1995 of the years of schooling attained by the population over 25 years of age from Barro and Lee (2001). PER CAPITA GDP is the logarithm of GDP per capita in 1980. The incomplete panel consists of 10 industries in 34 countries, each with 4 through 15 years of data. Other regressors included, but not reported are country dummies, industry dummies and year dummies. Heteroskedasticity-consistent standard errors are reported in parenthesis. The estimates of error components under random effects are not reported.
Panel (a): Fixed Effects Panel (b): Random Effects
1 2 3 4 5 6 7 1 2 3 4 5 6 7
SHARE 0.066a
(0.003) 0.0066a
(0.003) 0.068a
(0.003) 0.069 a (0.004)
0.067a
(0.0003) 0.074a
(0.0034) 0.0066a
(0.0033) 0.066a
(0.003) 0.0066a
(0.003) 0.068a
(0.003) 0.069 a (0.004)
0.066a
(0.0003) 0.073a
(0.0034) 0.0065a
(0.0033)
External Dependence* ARCHITECTURE
-0.0026a
(0.0006) -0.0016a
(0.0003) -0.0016a
(0.0004) -0.0021 a (0.0004)
-0.0018a
(0.0003) -0.0049a
(0.0009) -0.0020a
(0.0003) -0.0031a
(0.0005) -0.0016a
(0.0003) -0.0016a
(0.0004) -0.0021 a (0.0004)
-0.0020a
(0.0003) -0.0046a
(0.0009) -
0.0021a
(0.0003)
External Dependence* FINANCIAL DEVELOPMENT
0.0016a
(0.0005) 0.0022a
(0.0006)
External Dependence* BANK DEVELOPMENT
0.0059a
(0.0032) 0.0068a
(0.0018)
External Dependence* STOCK MARKET LIQUIDITY
0.0006 (0.0008)
0.0011 (0.0008)
External Dependence*IPO
0.0005c (0.0002)
0.0004c (0.0003)
External Dependence*HUMAN CAPITAL
0.0002 (0.0002)
0.0004b (0.0002)
US Growth in Sales* ARCHITECTURE
0.0422a
(0.0099) 0.0399a
(0.0100)
External Dependence*PER CAPITA GDP
0.0009a
(0.0003) 0.0013a
(0.0003)
R2 0.7820 0.7822 0.7778 0.7716 0.7814 0.7836 0.7822 NA NA NA NA NA NA NA N 2485 2485 2406 2276 2485 2194 2485 2485 2485 2406 2276 2485 2194 2485 Countries 34 34 34 34 34 34 34 34 34 34 34 34 34 34
a significant at 1 percent; b significant at 5 percent; c significant at 10 percent
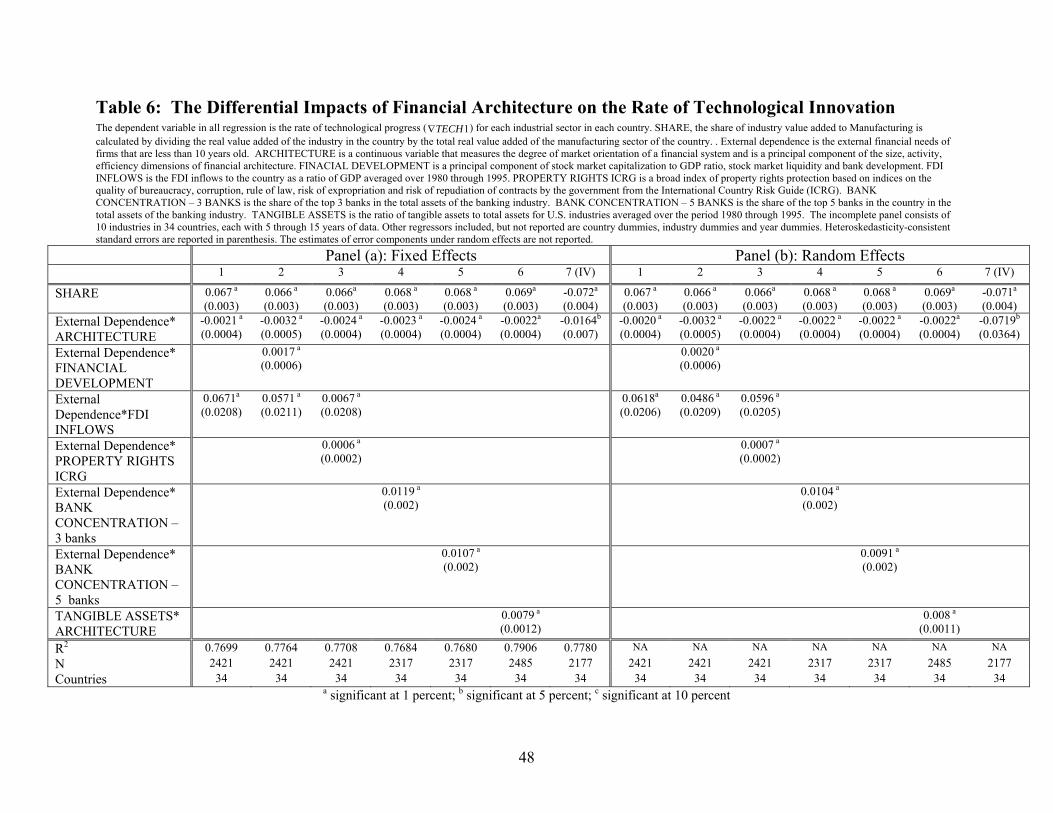
48
Table 6: The Differential Impacts of Financial Architecture on the Rate of Technological Innovation The dependent variable in all regression is the rate of technological progress ( 1TECH∇ ) for each industrial sector in each country. SHARE, the share of industry value added to Manufacturing is calculated by dividing the real value added of the industry in the country by the total real value added of the manufacturing sector of the country. . External dependence is the external financial needs of firms that are less than 10 years old. ARCHITECTURE is a continuous variable that measures the degree of market orientation of a financial system and is a principal component of the size, activity, efficiency dimensions of financial architecture. FINACIAL DEVELOPMENT is a principal component of stock market capitalization to GDP ratio, stock market liquidity and bank development. FDI INFLOWS is the FDI inflows to the country as a ratio of GDP averaged over 1980 through 1995. PROPERTY RIGHTS ICRG is a broad index of property rights protection based on indices on the quality of bureaucracy, corruption, rule of law, risk of expropriation and risk of repudiation of contracts by the government from the International Country Risk Guide (ICRG). BANK CONCENTRATION – 3 BANKS is the share of the top 3 banks in the total assets of the banking industry. BANK CONCENTRATION – 5 BANKS is the share of the top 5 banks in the country in the total assets of the banking industry. TANGIBLE ASSETS is the ratio of tangible assets to total assets for U.S. industries averaged over the period 1980 through 1995. The incomplete panel consists of 10 industries in 34 countries, each with 5 through 15 years of data. Other regressors included, but not reported are country dummies, industry dummies and year dummies. Heteroskedasticity-consistent standard errors are reported in parenthesis. The estimates of error components under random effects are not reported.
Panel (a): Fixed Effects Panel (b): Random Effects 1 2 3 4 5 6 7 (IV) 1 2 3 4 5 6 7 (IV)
SHARE 0.067 a (0.003)
0.066 a (0.003)
0.066a
(0.003) 0.068 a (0.003)
0.068 a (0.003)
0.069a
(0.003) -0.072a
(0.004) 0.067 a (0.003)
0.066 a (0.003)
0.066a
(0.003) 0.068 a (0.003)
0.068 a (0.003)
0.069a
(0.003) -0.071a
(0.004) External Dependence* ARCHITECTURE
-0.0021 a (0.0004)
-0.0032 a (0.0005)
-0.0024 a
(0.0004) -0.0023 a (0.0004)
-0.0024 a (0.0004)
-0.0022a
(0.0004) -0.0164b
(0.007) -0.0020 a (0.0004)
-0.0032 a (0.0005)
-0.0022 a
(0.0004) -0.0022 a (0.0004)
-0.0022 a (0.0004)
-0.0022a
(0.0004) -0.0719b
(0.0364) External Dependence* FINANCIAL DEVELOPMENT
0.0017 a (0.0006)
0.0020 a (0.0006)
External Dependence*FDI INFLOWS
0.0671a (0.0208)
0.0571 a (0.0211)
0.0067 a (0.0208)
0.0618a (0.0206)
0.0486 a (0.0209)
0.0596 a (0.0205)
External Dependence* PROPERTY RIGHTS ICRG
0.0006 a (0.0002)
0.0007 a (0.0002)
External Dependence* BANK CONCENTRATION – 3 banks
0.0119 a (0.002)
0.0104 a (0.002)
External Dependence* BANK CONCENTRATION – 5 banks
0.0107 a (0.002)
0.0091 a (0.002)
TANGIBLE ASSETS* ARCHITECTURE
0.0079 a (0.0012)
0.008 a (0.0011)
R2 0.7699 0.7764 0.7708 0.7684 0.7680 0.7906 0.7780 NA NA NA NA NA NA NA
N 2421 2421 2421 2317 2317 2485 2177 2421 2421 2421 2317 2317 2485 2177 Countries 34 34 34 34 34 34 34 34 34 34 34 34 34 34
a significant at 1 percent; b significant at 5 percent; c significant at 10 percent
Recommended