DEBT AND EQUITY
A project analyzing balance between
Interviewee-Mr. Mike McManus, Regional Bank Manager for Eastern Seaboard with 30 yrs’ experience
Presented by:
Daniel Richardson Daphne Guiping Chen Monica Fan Yi Manasvini Vimal Kumar Jungah Kim
Description of the Interviewee
Mr. Mike McManus is a regional bank manager for eastern seaboard, at National Bank of Canada. He reports to the Vice President, Personal Banking.
Job Responsibilities:
• Develop annual business plan for the region
• Manage execution ensuring earnings’ growth
• Implement customized strategies and initiatives
• Manage a team of branch managers
• Facilitate transition to a new distribution model
• Ensure commitment to policies and processes
Question : How should companies balance their financing objectives between debt and equity, in order to avoid associated risks?
Balancing depends on the following factors:
Specific amount of liquidity desiredFuture Financing Event (Adams, Harkness & Hill, 2002) Type of Industry Ability to pay backRate of ROI >WACC of companyIdeally D/E Ratio should decline over yearsConsider Business Specific Risk ScoreNet Worth of a company=TL-TA-an indicatorROR covers repayment schedule, provides operating costs & enough for dividends
Important Points –Company must haves: Operating Capital to cover daily expenses & project specific costs Opportunity capital to cover planned & unforeseen initiatives Negotiating Capital to keep firm financed through negotiating period Murphy Capital- to keep in mind “ Anything that can go wrong, will go wrong”
(Adams, Harkness & Hill, 2002)
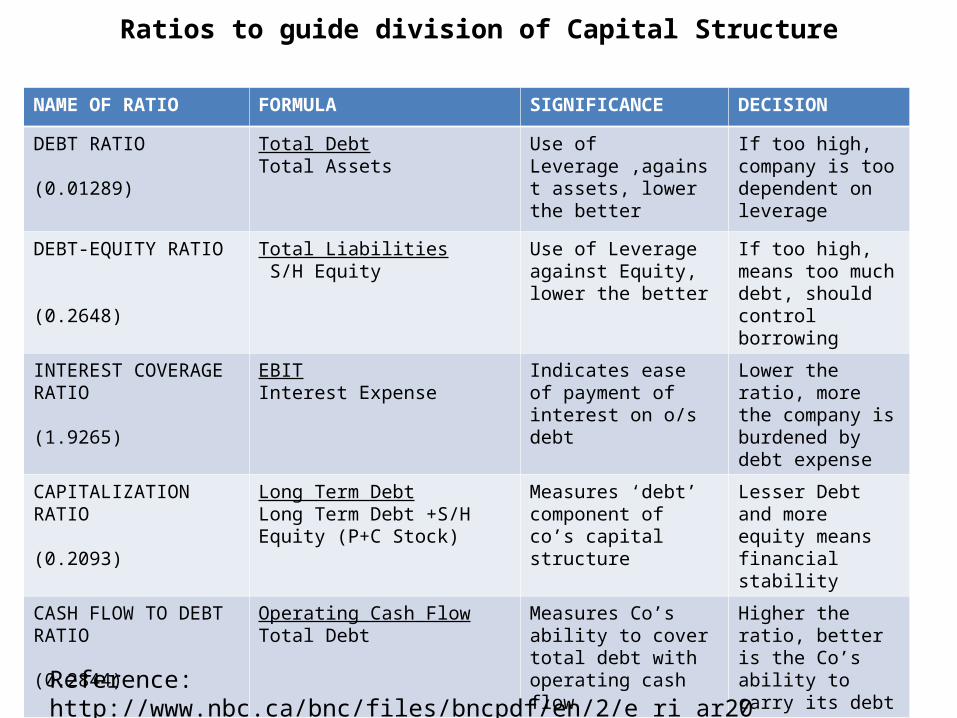
Ratios to guide division of Capital Structure
NAME OF RATIO FORMULA SIGNIFICANCE DECISION
DEBT RATIO
(0.01289)
Total DebtTotal Assets
Use of Leverage ,against assets, lower the better
If too high, company is too dependent on leverage
DEBT-EQUITY RATIO
(0.2648)
Total Liabilities S/H Equity
Use of Leverage against Equity, lower the better
If too high, means too much debt, should control borrowing
INTEREST COVERAGE RATIO
(1.9265)
EBITInterest Expense
Indicates ease of payment of interest on o/s debt
Lower the ratio, more the company is burdened by debt expense
CAPITALIZATION RATIO
(0.2093)
Long Term DebtLong Term Debt +S/H Equity (P+C Stock)
Measures ‘debt’ component of co’s capital structure
Lesser Debt and more equity means financial stability
CASH FLOW TO DEBT RATIO
(0.2844)
Operating Cash FlowTotal Debt
Measures Co’s ability to cover total debt with operating cash flow
Higher the ratio, better is the Co’s ability to carry its debt
Reference: http://www.nbc.ca/bnc/files/bncpdf/en/2/e_ri_ar2013.pdf
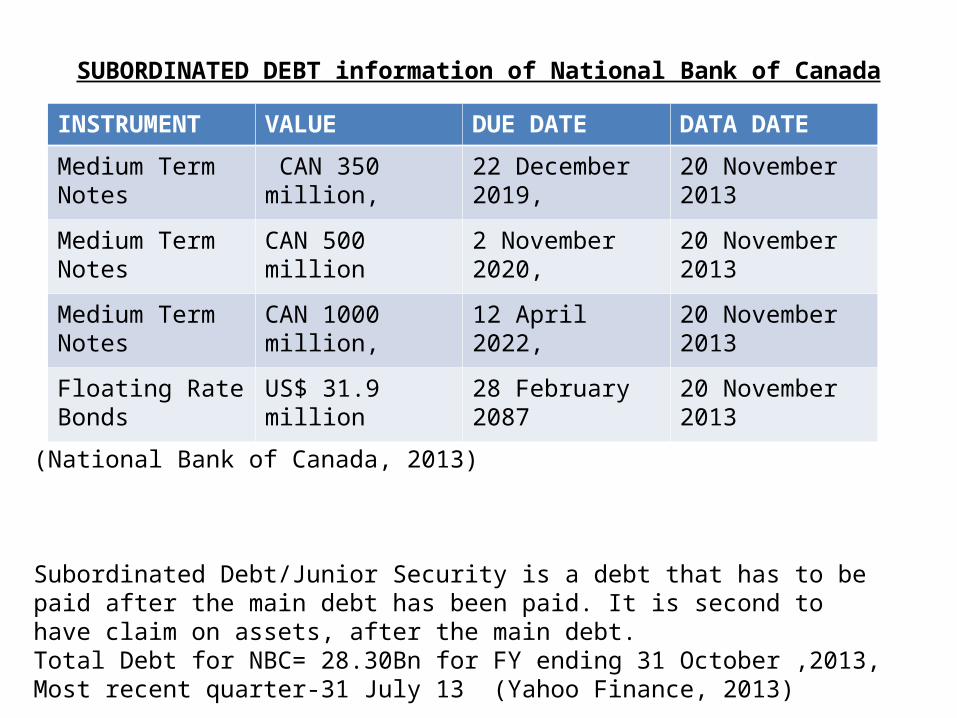
SUBORDINATED DEBT information of National Bank of Canada
INSTRUMENT VALUE DUE DATE DATA DATE
Medium Term Notes
CAN 350 million, 22 December 2019,
20 November 2013
Medium Term Notes
CAN 500 million 2 November 2020, 20 November 2013
Medium Term Notes
CAN 1000 million, 12 April 2022, 20 November 2013
Floating Rate Bonds
US$ 31.9 million 28 February 2087 20 November 2013
(National Bank of Canada, 2013)
Subordinated Debt/Junior Security is a debt that has to be paid after the main debt has been paid. It is second to have claim on assets, after the main debt. Total Debt for NBC= 28.30Bn for FY ending 31 October ,2013, Most recent quarter-31 July 13 (Yahoo Finance, 2013)
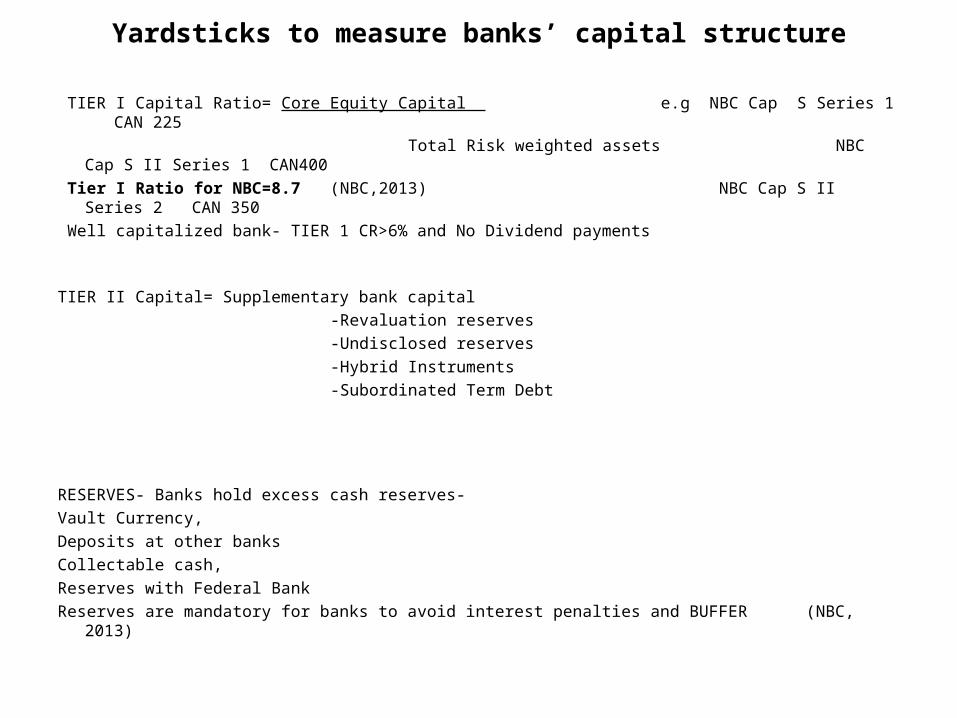
Yardsticks to measure banks’ capital structure
TIER I Capital Ratio= Core Equity Capital e.g NBC Cap S Series 1 CAN 225
Total Risk weighted assets NBC Cap S II Series 1 CAN400
Tier I Ratio for NBC=8.7 (NBC,2013) NBC Cap S II Series 2 CAN 350
Well capitalized bank- TIER 1 CR>6% and No Dividend payments
TIER II Capital= Supplementary bank capital
-Revaluation reserves
-Undisclosed reserves
-Hybrid Instruments
-Subordinated Term Debt
RESERVES- Banks hold excess cash reserves-
Vault Currency,
Deposits at other banks
Collectable cash,
Reserves with Federal Bank
Reserves are mandatory for banks to avoid interest penalties and BUFFER (NBC, 2013)
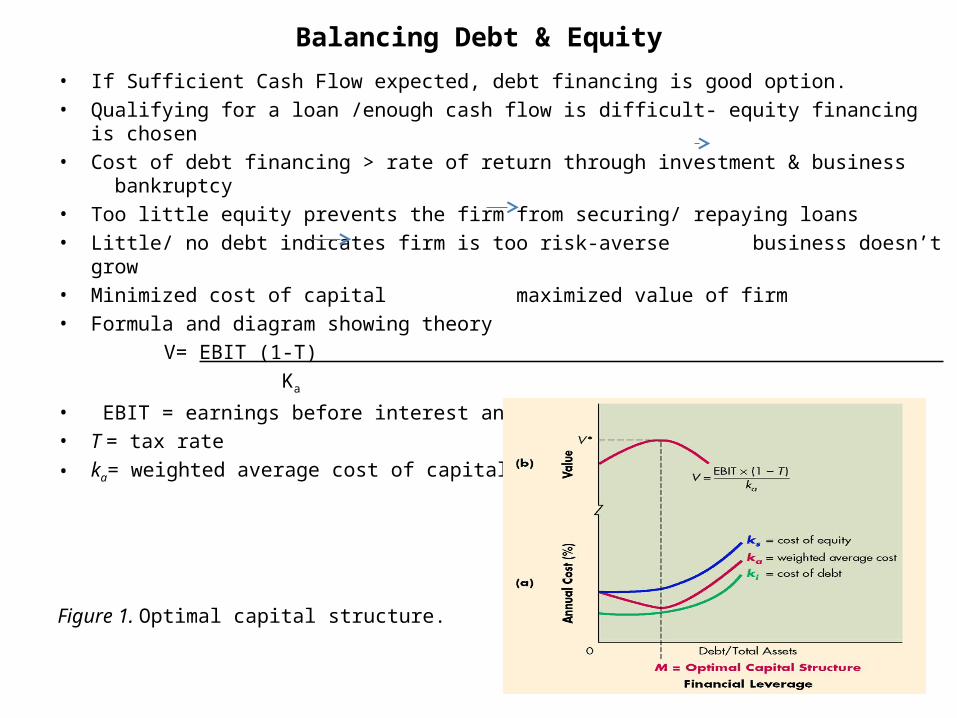
Balancing Debt & Equity
• If Sufficient Cash Flow expected, debt financing is good option.
• Qualifying for a loan /enough cash flow is difficult- equity financing is chosen
• Cost of debt financing > rate of return through investment & business bankruptcy
• Too little equity prevents the firm from securing/ repaying loans• Little/ no debt indicates firm is too risk-averse business doesn’t grow• Minimized cost of capital maximized value of firm • Formula and diagram showing theory V= EBIT (1-T) Ka
• EBIT = earnings before interest and taxes• T = tax rate • ka= weighted average cost of capital
Figure 1. Optimal capital structure.
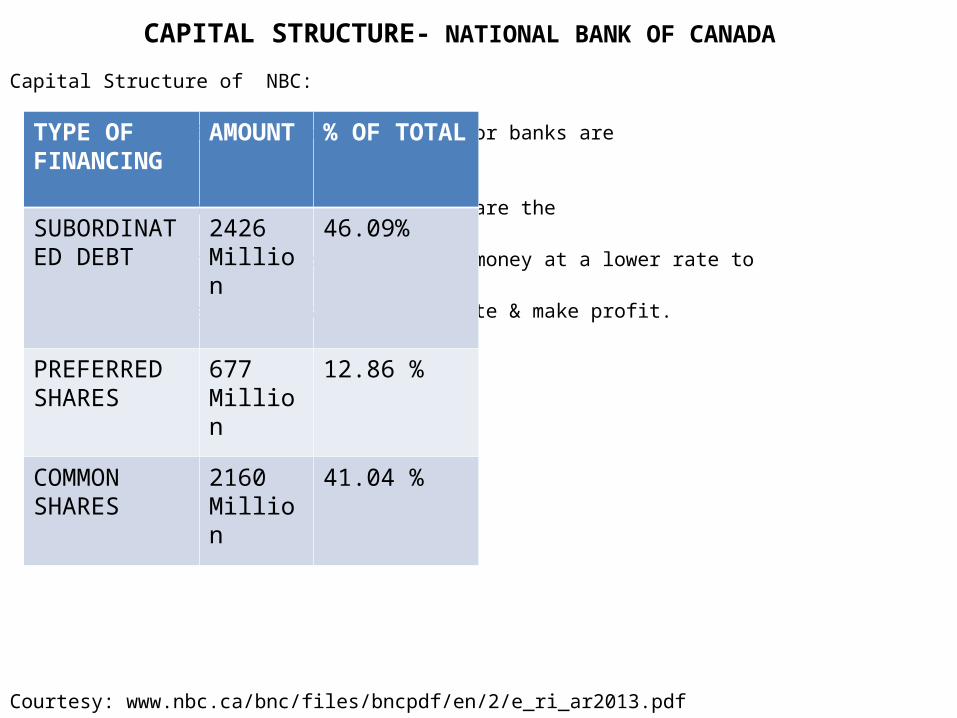
CAPITAL STRUCTURE- NATIONAL BANK OF CANADA
Capital Structure of NBC:
High Debt Equity Ratios for banks are
are not bad because they are the
institutions that borrow money at a lower rate to
lend money at a higher rate & make profit.
Courtesy: www.nbc.ca/bnc/files/bncpdf/en/2/e_ri_ar2013.pdf
TYPE OF FINANCING
AMOUNT % OF TOTAL
SUBORDINATED DEBT
2426Million
46.09%
PREFERRED SHARES
677 Million
12.86 %
COMMON SHARES
2160 Million
41.04 %
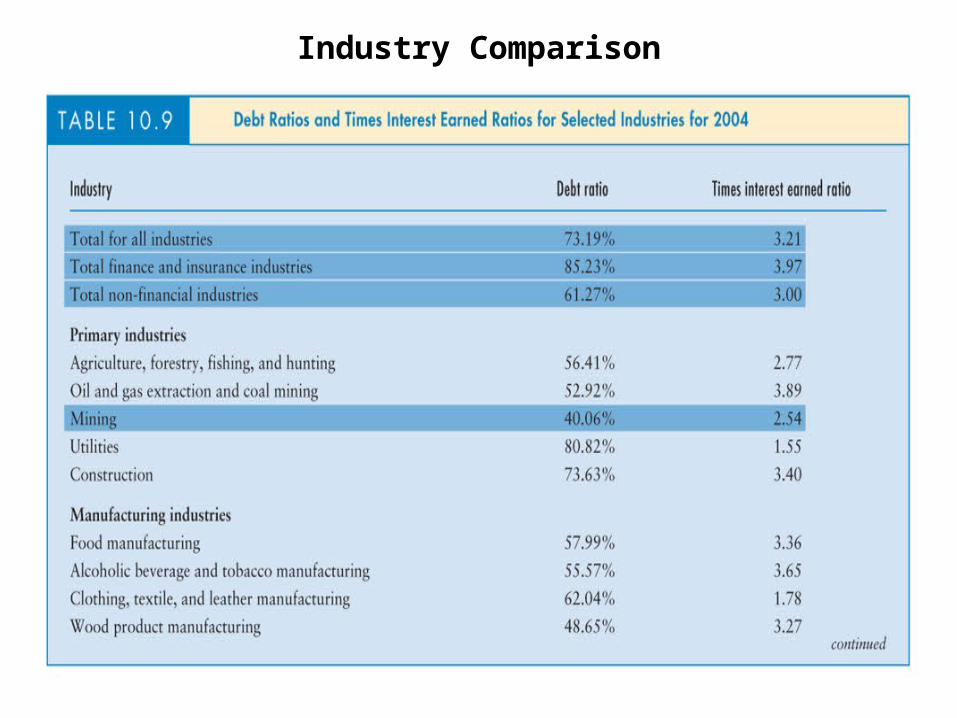
Industry Comparison
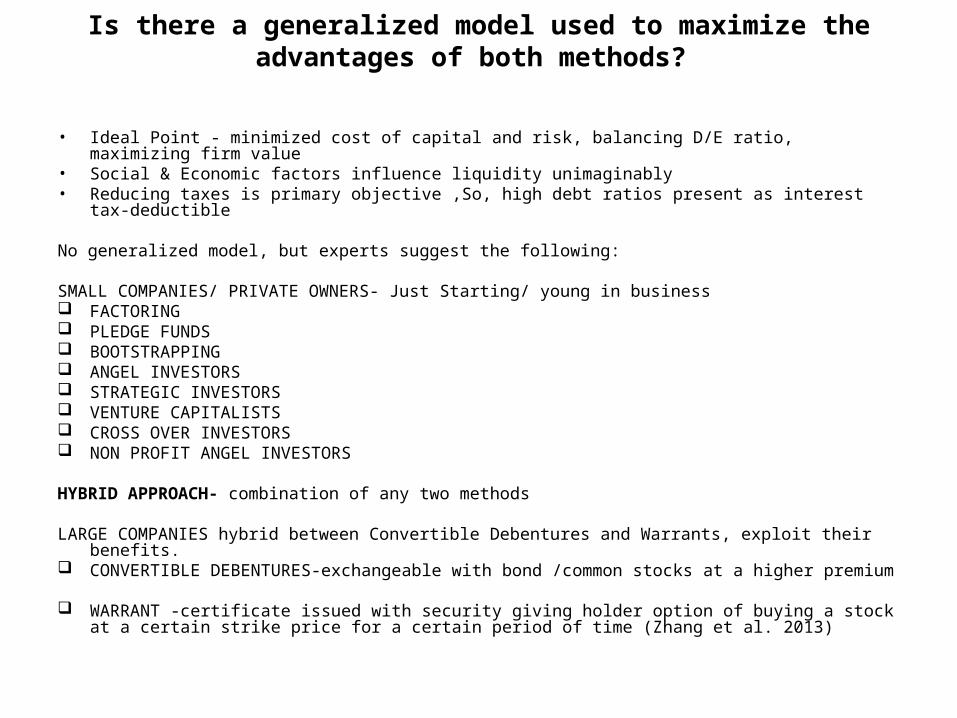
Is there a generalized model used to maximize the advantages of both methods?
• Ideal Point - minimized cost of capital and risk, balancing D/E ratio, maximizing firm value • Social & Economic factors influence liquidity unimaginably• Reducing taxes is primary objective ,So, high debt ratios present as interest tax-deductible
No generalized model, but experts suggest the following:
SMALL COMPANIES/ PRIVATE OWNERS- Just Starting/ young in business FACTORING PLEDGE FUNDS BOOTSTRAPPING ANGEL INVESTORS STRATEGIC INVESTORS VENTURE CAPITALISTS CROSS OVER INVESTORS NON PROFIT ANGEL INVESTORS
HYBRID APPROACH- combination of any two methods
LARGE COMPANIES hybrid between Convertible Debentures and Warrants, exploit their benefits. CONVERTIBLE DEBENTURES-exchangeable with bond /common stocks at a higher premium
WARRANT -certificate issued with security giving holder option of buying a stock at a certain strike price for a certain period of time (Zhang et al. 2013)
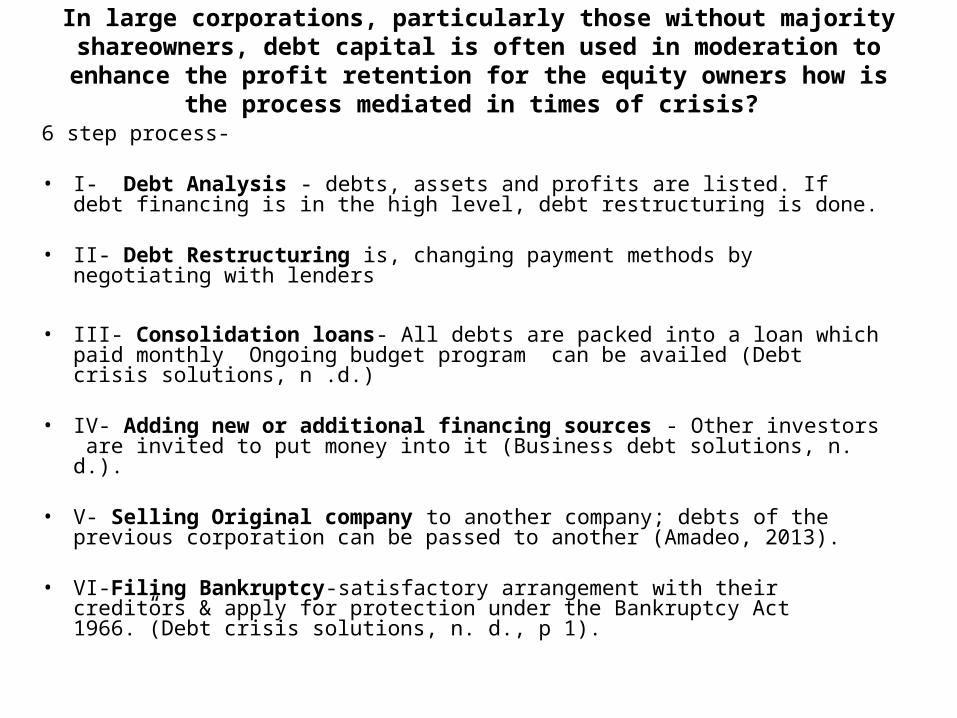
In large corporations, particularly those without majority shareowners, debt capital is often used in moderation to enhance the profit retention for the equity
owners how is the process mediated in times of crisis?
6 step process-
• I- Debt Analysis - debts, assets and profits are listed. If debt financing is in the high level, debt restructuring is done.
• II- Debt Restructuring is, changing payment methods by negotiating with lenders
• III- Consolidation loans- All debts are packed into a loan which paid monthly Ongoing budget program can be availed (Debt crisis solutions, n .d.)
• IV- Adding new or additional financing sources - Other investors are invited to put money into it (Business debt solutions, n. d.).
• V- Selling Original company to another company; debts of the previous corporation can be passed to another (Amadeo, 2013).
• VI-Filing Bankruptcy-satisfactory arrangement with their creditors & apply for protection under the Bankruptcy Act 1966.”(Debt crisis solutions, n. d., p 1).
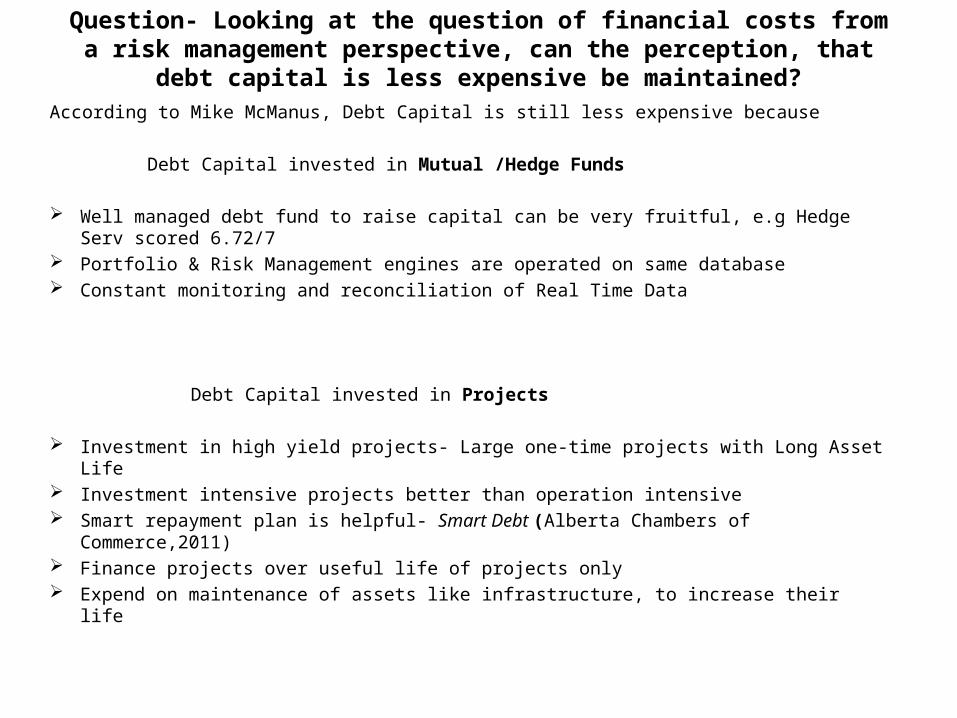
Question- Looking at the question of financial costs from a risk management perspective, can the perception, that debt capital is less expensive be maintained?
According to Mike McManus, Debt Capital is still less expensive because
Debt Capital invested in Mutual /Hedge Funds
Well managed debt fund to raise capital can be very fruitful, e.g Hedge Serv scored 6.72/7 Portfolio & Risk Management engines are operated on same database Constant monitoring and reconciliation of Real Time Data
Debt Capital invested in Projects
Investment in high yield projects- Large one-time projects with Long Asset Life Investment intensive projects better than operation intensive Smart repayment plan is helpful- Smart Debt (Alberta Chambers of Commerce,2011) Finance projects over useful life of projects only Expend on maintenance of assets like infrastructure, to increase their life
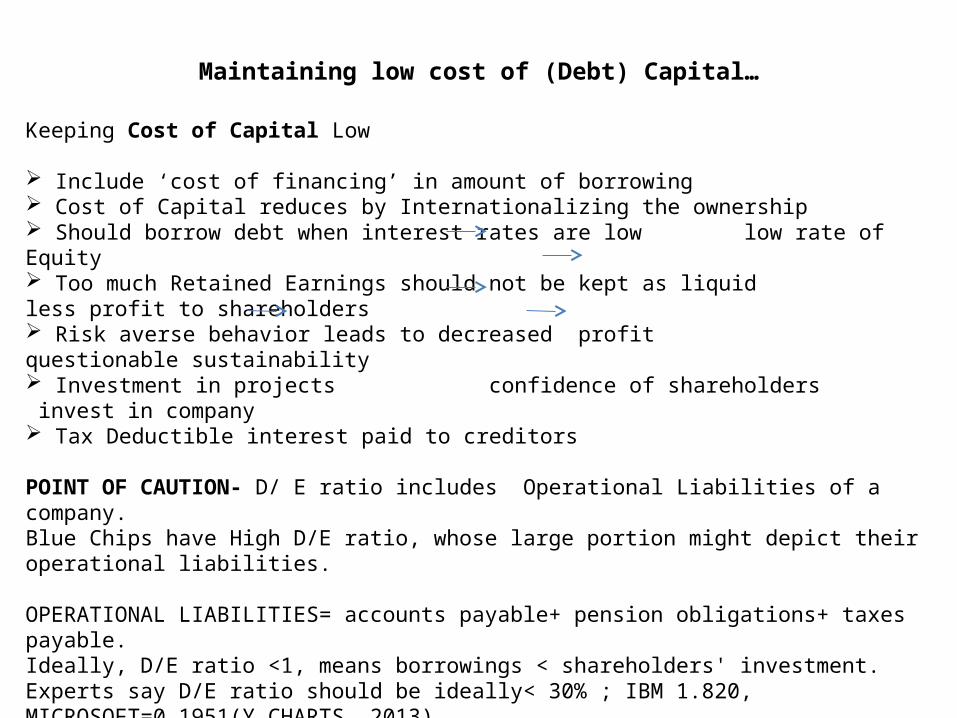
Maintaining low cost of (Debt) Capital…
Keeping Cost of Capital Low
Include ‘cost of financing’ in amount of borrowing Cost of Capital reduces by Internationalizing the ownership Should borrow debt when interest rates are low low rate of Equity Too much Retained Earnings should not be kept as liquid less profit to shareholders Risk averse behavior leads to decreased profit questionable sustainability Investment in projects confidence of shareholders invest in company Tax Deductible interest paid to creditors
POINT OF CAUTION- D/ E ratio includes Operational Liabilities of a company. Blue Chips have High D/E ratio, whose large portion might depict their operational liabilities.
OPERATIONAL LIABILITIES= accounts payable+ pension obligations+ taxes payable.Ideally, D/E ratio <1, means borrowings < shareholders' investment. Experts say D/E ratio should be ideally< 30% ; IBM 1.820, MICROSOFT=0.1951(Y CHARTS, 2013).
NBC CREDIT RATING:Moody’s Aa 3S&P A (NBC,Q4,2013)
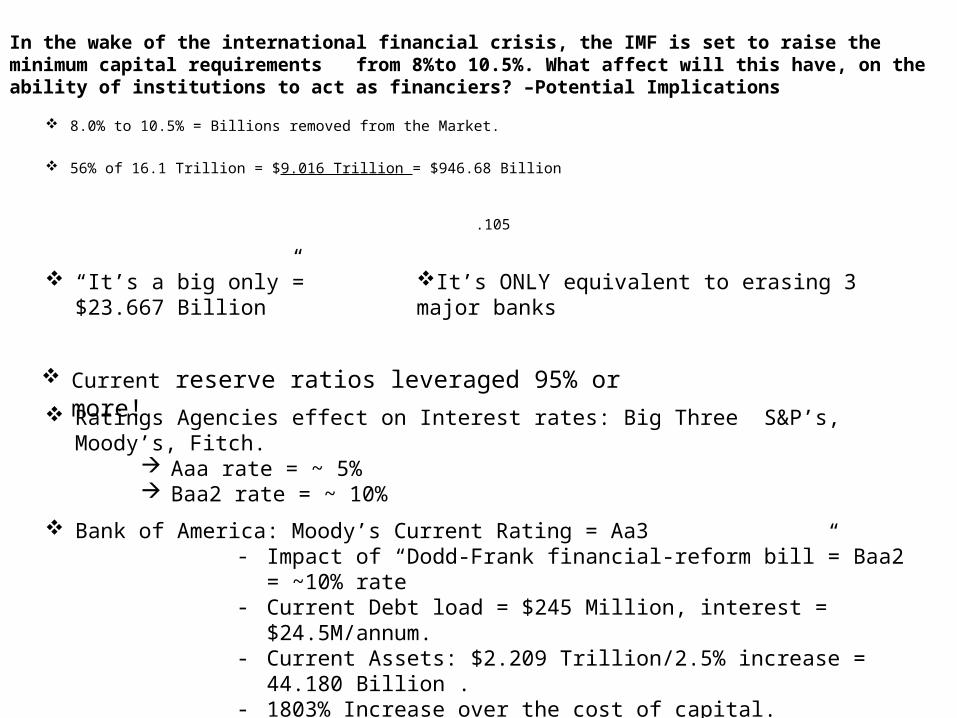
8.0% to 10.5% = Billions removed from the Market.
56% of 16.1 Trillion = $9.016 Trillion = $946.68 Billion
.105
“It’s a big only”= $23.667 Billion
Ratings Agencies effect on Interest rates: Big Three S&P’s, Moody’s, Fitch. Aaa rate = ~ 5% Baa2 rate = ~ 10%
Bank of America: Moody’s Current Rating = Aa3- Impact of “Dodd-Frank financial-reform bill”= Baa2 = ~10% rate- Current Debt load = $245 Million, interest = $24.5M/annum. - Current Assets: $2.209 Trillion/2.5% increase = 44.180 Billion .- 1803% Increase over the cost of capital.
In the wake of the international financial crisis, the IMF is set to raise the minimum capital requirements from 8%to 10.5%. What affect will this have, on the ability of institutions to act as financiers? –Potential Implications
It’s ONLY equivalent to erasing 3 major banks
Current reserve ratios leveraged 95% or more!
Effective circumstance:
• Adams, Harkness & Hill. (2002). Strategic Approaches to Raising Capital. Executive Briefing Series. Retrieved from:
http://globalsolve.com/Documents/Fund%20Raising/Strategic%20Approaches%20To U%20Raising%20Capital%20-%2001.pdf
• "Bank of America Financial Statements". MSN Money
• Daily Show- Greenspan on Cap Requirements, Self Regulation by Barry Ritholtz - October 22nd, 2013, 6:00am.
• http://www.ffiec.gov/nicpubweb/nicweb/top50form.aspx
• https://www.moodys.com/sites/products/AboutMoodysRatingsAttachments/MoodysRatingsSymbolsand%20Definitions.pdf
• http://webs.wichita.edu/longhofer/Fin340/Lectures/Fin340_IC6_Solutions.pdf
• http://img.en25.com/Web/StandardandPoors/SP_CreditRatingsGuide.pdf
• http://blogs.wsj.com/marketbeat/2011/06/02/banks-how-theyd-be-rated-without-government-
References
• Kennon, J.(2013). Long Term Debt and the Debt to Equity Ratio on the Balance Sheet. Investing Lesson 3- Analyzing a balance sheet. Retrieved from: http://beginnersinvest.about.com/od/analyzingabalancesheet/a/long-term-debt-to- equity- ratio.htm.
• National Bank of Canada. (2013). National Bank. Investor Relations. Retrieved from: http://www.bnc.ca/bnc/cda/productfamily/0,2664,divId-2_langId-1_navCode- 18393,00.html
• "National Economic Trends (Consumer Price Index)" (PDF). Federal Reserve Bank of St. Louis. October 1, 2013. p. 28. Retrieved December 5, 2013
• (2012). Mars-Building Canada's Next Generation of Growth Companies. Choosing between equity and debt. Retrieved from: http://www.marsdd.com/articles/financing-youridea-
choosing-between-equity-and-debt/
• Richard, B., Stewart, M., Franklin, A. (2011). Principles of corporate finance (10th ed.). New York, NY: McGraw-Hill/Irwin
• Rogers, Simon; Sedghi, Ami (April 15, 2011). "How Fitch, Moody's and S&P rate each country‘screditrating". The Guardian (London). Retrieved December 4,2013
References
• Sherman, A.J.(3rd Ed.). (2012). Raising Capital. New York American Management Association
• Vohwinkle , J.(2013).How to Calculate your Debt to Income Ratio: Determine whether you have too much debt. About.com Financial Planning. Retrieved from:
http://financialplan.about.com/od/personalfinance/a/Debt-to-Income.htm
• Xiao, W.L., Zhang, W.G., Yao, Z. & Wang, X.H (2013), The Impact of issuing warrant and debt on behavior of the

QUESTIONS?
Recommended