8/3/2019 FINAL Television Industry
http://slidepdf.com/reader/full/final-television-industry 1/44
A
PROJECT REPORT
ON
“CONSUMER BUYING BEHAVIOR FOR
COLOUR TELEVISIONS’’
MASTER OF BUSINESS ADMINISTRATION
Submitted By: Submitted To:
Nandhakumar.R Dr.R.Varadarajan
Roll No. A929027
Session 2009-2011
Madurai Kamaraj University
8/3/2019 FINAL Television Industry
http://slidepdf.com/reader/full/final-television-industry 2/44
INTRODUCTION
Two movies a week at the theatre, getting together with friends and relatives,
playing cards, listening to the radio and may be reading were the only
available outlets for the consumer to pass their time before the introduction of
television.
By the late 70’s consumer demands were becoming strident aspirations
and expectations began out growing available options The culmination of this was
in 1982(when the colour television was introduced and the network was partially
expended) and 1984 (with the one transmitter a day expansion) However these
changes perhaps were more the results of political considerations rather than
meeting the consumer demand for change.
The magazine boom of the mid 70’s had limited impact as it was catering
to more or less the homogeneous group of people dictated by language, style, and
content. But for the first time in country, TV a single medium was reaching out
nationally. Radio while the forerunner did not have the same impact.
The advantage of TV since 1984 was that it could be received through out
the country. It therefore operated as a catalyst in defining social moves of the
times. Being a truly mass medium it drew viewership from all stratas of thesociety. Each individual picked what he or she wanted from the medium.
8/3/2019 FINAL Television Industry
http://slidepdf.com/reader/full/final-television-industry 3/44
The advent of satellite and cable TV has now totally changed the situation. With
satellite programmes are beamed to many countries at the same time. Operating in
a protected economy Indian advertisers have a no market outside the borders of
India. But consumers have no such restrictions They are more happy to adopt the
latest entertainment media.
Consumers now demand quality as never before. The best available
internationally is preferred to Indian as economy liberalizes. An even more
suitable change is imminent. Consumers have begun to think international and
over time behave international.
Consumers and technology are marching hand in hand today. IT is thus
incumbent upon the marketers, manufacturers, advertisers, and agencies to
understand this new consumer and keep pace or face the alternative of being left
behind. To establish their standing in the market they have to be constantly on the
search for customers and have to find out what consumer buy , how much can they
pay and what is being made available to them by the competitors not only in India
but internationally too.
8/3/2019 FINAL Television Industry
http://slidepdf.com/reader/full/final-television-industry 4/44
COLOR TELEVISION INDUSTRY
Television has recorded a phenomenal growth in India. It has become an accepted
part of our daily life in very short span. Television is affecting customers,
domestic routines, educational techniques and entertainment pattern. In the recent
past television was luxury item meant for rich people only but now a days, it is
considered as necessity by most of the people. However the role of audio visual
media of communication for a country like India with large population, high
illiteracy and vast area assumes critical importance and television can be regarded
as harbinger of social, economic, and cultural development. Television combinesin it all the benefit of the radio, newspaper and cinema and therefore it is the most
popular media for education, information and entertainment. Before understanding
any market adventure, it is important to understand the industry. Therefore, it is
useful to study background of TV industry of India briefly.
The first demonstration of actual television was made in 1925-27 by J.Lbaird
and C.F Jenkins. The Black and White TV broadcast was introduced in UK in
1937. A color sequential system developed by Columbia Broadcasting service was
adopted in U.S.A. in 1950 for coloured T.V. transmission. After a great deal of
internal debate, the government of India decided to introduce television in the year
1959. Commercial production of T.V. sets was started in 1970. Later on
doordarshan stations was set up in Bombay(1972), Amritsar(1973),
Srinagar(1973), Calcutta(1975), Madras(1975) and Lucknow(1975).
8/3/2019 FINAL Television Industry
http://slidepdf.com/reader/full/final-television-industry 5/44
HISTORICAL DEVELOPMENT IN INDIA
The 80’s
The 80’s saw the industry growing at a fast rate of 30% per annum. The years
following the 1982 Asian games saw an exponential rise in growth, which
coincided with the setting up of Doordarshan kendras in many parts of the country.
Moreover, the government adopted a policy of encouraging the sector, which saw
the birth of many TV companies namely Weston, Dyanora and Televista. Even
state government owned companies like Uptron, Keltron and Meltron came up. By
1989, there were over 200 TV companies with sales of 5.2mn sets.
The 90’s
The early years of the 90’s decade saw TV sales falling to 4mn units due to a high
tax regime. However, with the onset of the liberalization era, the year 1993 saw a
reversal in fortunes for the industry with both import duties and excise duties
being slashed. Accompanying it was a rise in the general purchasing power of the
populace, a greater variety in TV software (with the coming in of foreign satellitechannels) and a strong rise in replacement demand. Sales touched almost 9mn
units in 1998. This period also saw the entry of MNC’s.
The years 1998 and 1999 have seen events like, the large pay-out to the
government staff through the implementation of the 5th Pay Commission, World
Cup 1999 and the success of the rabi crop. These events have changed the face of
the CTV industry, which realized a growth of 29-30% for the last two years. In
fact, for LG, (official sponsor of the World Cup 1999) this was the most successful
brand building exercise, as the company saw a 95% growth in 1999.
8/3/2019 FINAL Television Industry
http://slidepdf.com/reader/full/final-television-industry 6/44
THE PRESENT SCENARIO
CTV market has grown by around 30% to 5mn units . After an accelerated performance in the last two years, The Rs75bn the industry has seen a slow growth
of just 25% in this year (January-April2000).
While some players have seen a steady decline in sales, a few others have
performed exceptionally well. Brands like Philips, Sony, Aiwa have seen their
market shares dipping continuously, while the Korean multinationals, LG and
Samsung, are on a rampage, having shown a commendable performance, contrary
to the overall CTV industry performance. BPL has held its leadership in FY2000
by sacrificing margins with a 20.3% market share, despite the onslaught of
multinationals. BPL volume sales increased by 35% to 1.18mn units for FY2000
whereas net sales increased by 4% only. The company showed a jump in CTV
exports by 148%. However, the company did not perform well in the 1QFY2001
with its sales dipping by 25% to Rs. 3,720.5mn. Most of the players are slashing
prices and taking a re-look at their schemes. Prices are down by more than 20%
and industry majors predict a sharper fall by 8% in the next two years. However,
reduction in prices is not a viable option in the long run, and will definitely affect
the profit margins. Contrary to this, LG has priced its products 10% higher than
the market price and still managed to be the largest brand in consumer electronics
and white goods for April 2000 by achieving sales of Rs1.95bn
8/3/2019 FINAL Television Industry
http://slidepdf.com/reader/full/final-television-industry 7/44
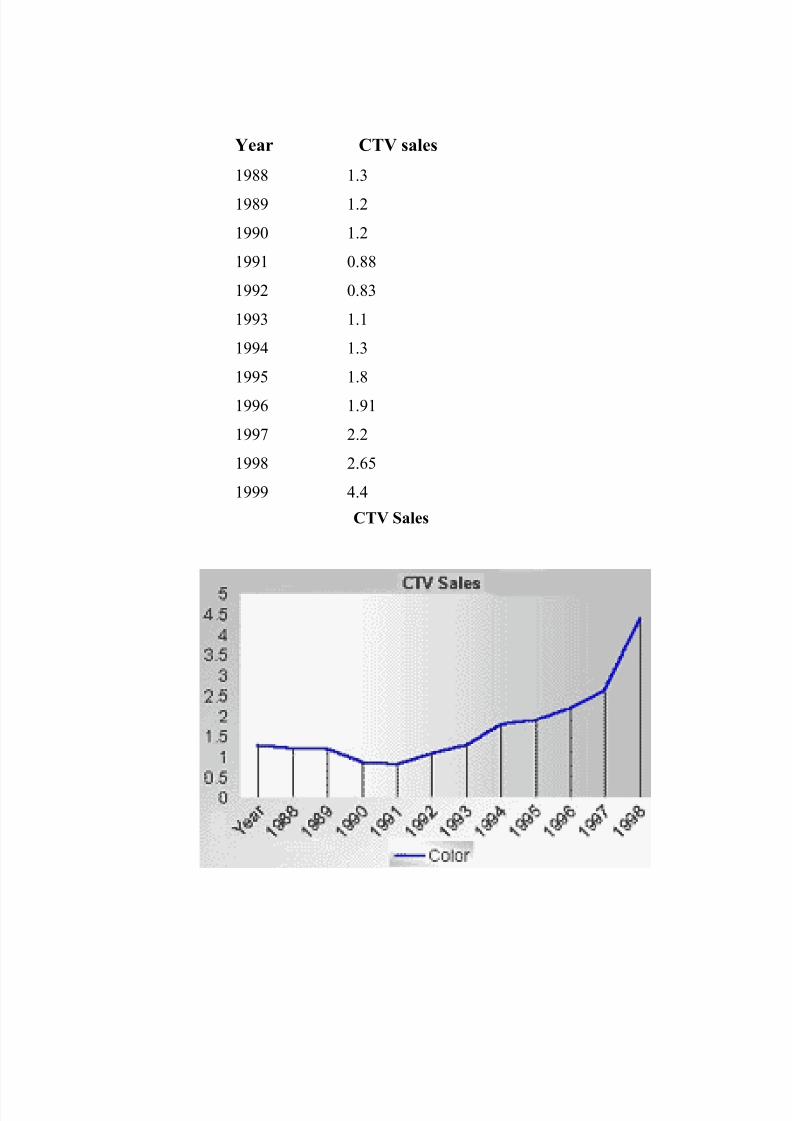
Year CTV sales
1988 1.3
1989 1.2
1990 1.2
1991 0.88
1992 0.83
1993 1.1
1994 1.3
1995 1.8
1996 1.91
1997 2.2
1998 2.65
1999 4.4
CTV Sales
8/3/2019 FINAL Television Industry
http://slidepdf.com/reader/full/final-television-industry 8/44
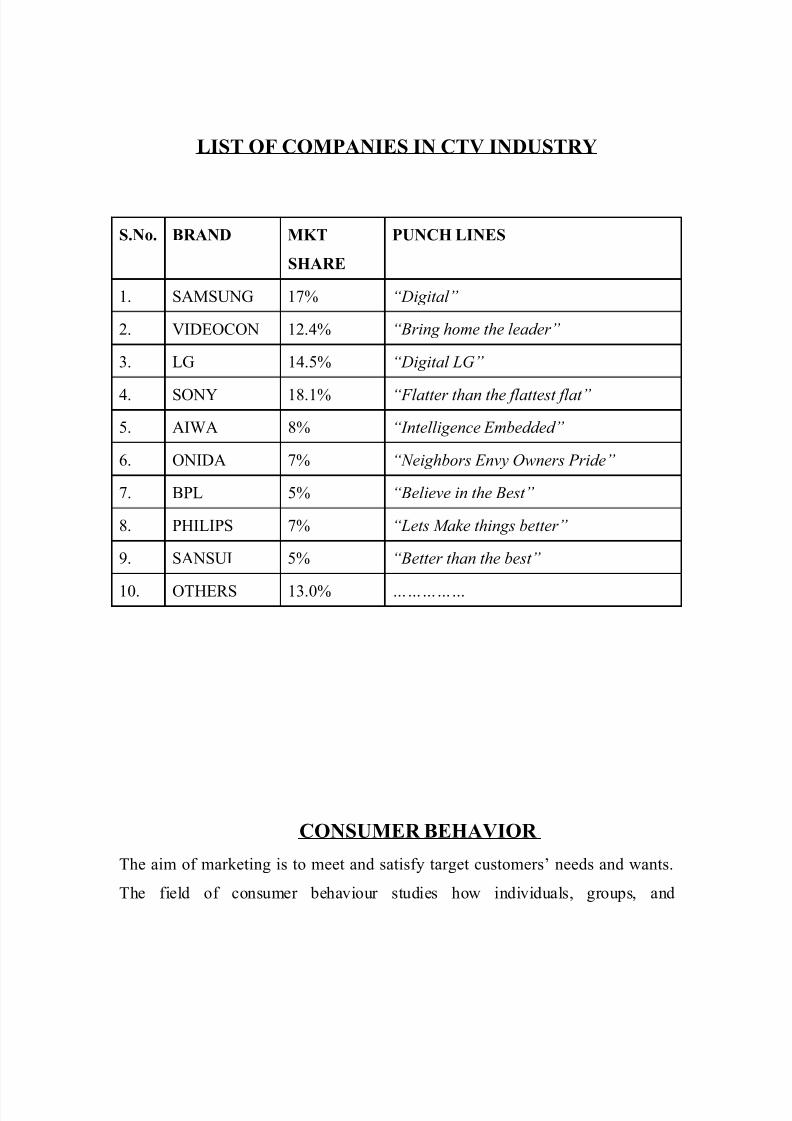
LIST OF COMPANIES IN CTV INDUSTRY
S.No. BRAND MKT
SHARE
PUNCH LINES
1. SAMSUNG 17% “Digital”
2. VIDEOCON 12.4% “Bring home the leader”
3. LG 14.5% “Digital LG”
4. SONY 18.1% “Flatter than the flattest flat”
5. AIWA 8% “Intelligence Embedded”
6. ONIDA 7% “Neighbors Envy Owners Pride”
7. BPL 5% “Believe in the Best”
8. PHILIPS 7% “Lets Make things better”
9. SANSUI 5% “Better than the best”
10. OTHERS 13.0% ……………
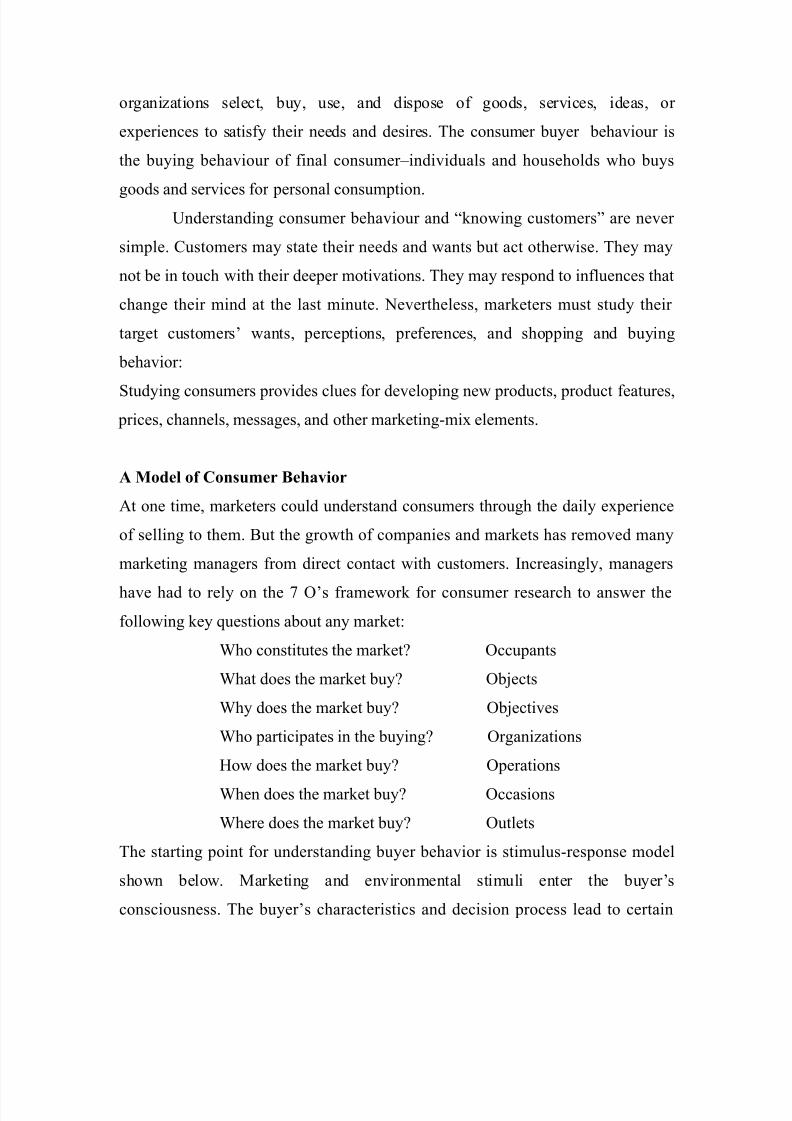
CONSUMER BEHAVIOR
The aim of marketing is to meet and satisfy target customers’ needs and wants.
The field of consumer behaviour studies how individuals, groups, and
8/3/2019 FINAL Television Industry
http://slidepdf.com/reader/full/final-television-industry 9/44
organizations select, buy, use, and dispose of goods, services, ideas, or
experiences to satisfy their needs and desires. The consumer buyer behaviour is
the buying behaviour of final consumer–individuals and households who buys
goods and services for personal consumption.Understanding consumer behaviour and “knowing customers” are never
simple. Customers may state their needs and wants but act otherwise. They may
not be in touch with their deeper motivations. They may respond to influences that
change their mind at the last minute. Nevertheless, marketers must study their
target customers’ wants, perceptions, preferences, and shopping and buying
behavior:
Studying consumers provides clues for developing new products, product features,
prices, channels, messages, and other marketing-mix elements.
A Model of Consumer Behavior
At one time, marketers could understand consumers through the daily experience
of selling to them. But the growth of companies and markets has removed many
marketing managers from direct contact with customers. Increasingly, managers
have had to rely on the 7 O’s framework for consumer research to answer the
following key questions about any market:
Who constitutes the market? Occupants
What does the market buy? Objects
Why does the market buy? Objectives
Who participates in the buying? Organizations
How does the market buy? Operations
When does the market buy? Occasions
Where does the market buy? Outlets
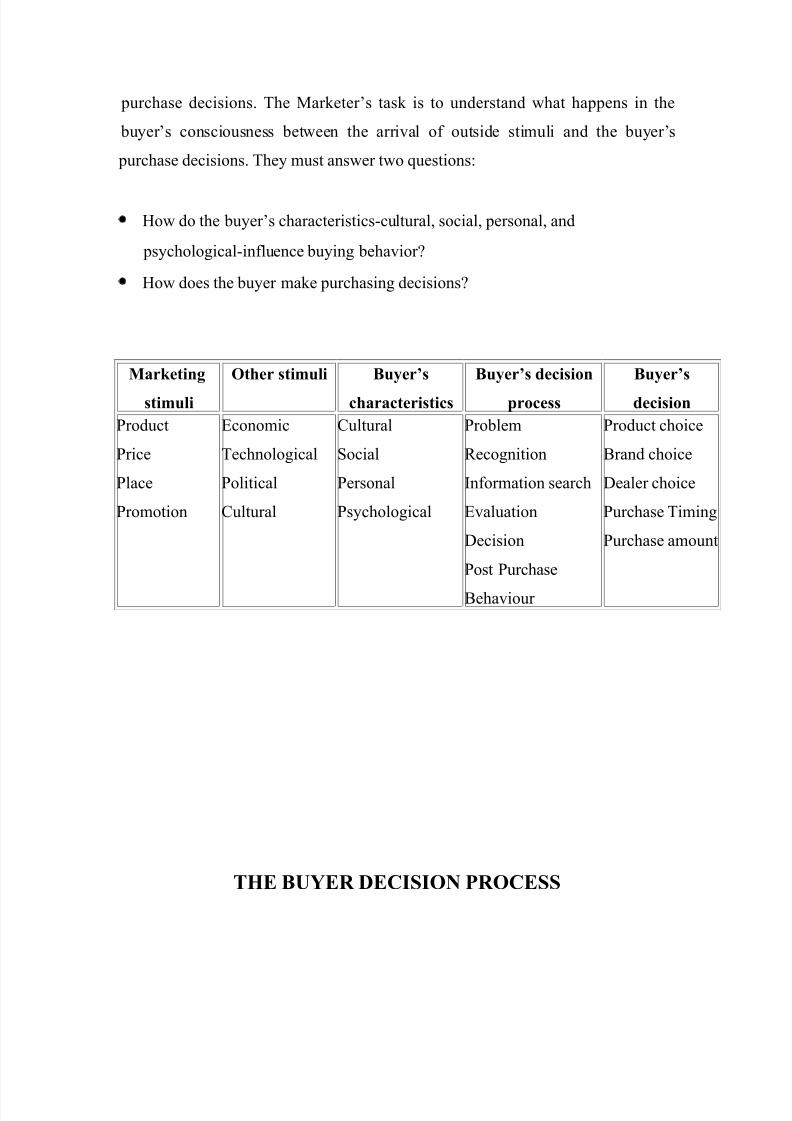
The starting point for understanding buyer behavior is stimulus-response model
shown below. Marketing and environmental stimuli enter the buyer’s
consciousness. The buyer’s characteristics and decision process lead to certain
8/3/2019 FINAL Television Industry
http://slidepdf.com/reader/full/final-television-industry 10/44
purchase decisions. The Marketer’s task is to understand what happens in the
buyer’s consciousness between the arrival of outside stimuli and the buyer’s
purchase decisions. They must answer two questions:
• How do the buyer’s characteristics-cultural, social, personal, and
psychological-influence buying behavior?
• How does the buyer make purchasing decisions?
Marketing
stimuli
Other stimuli Buyer’s
characteristics
Buyer’s decision
process
Buyer’s
decision
Product
Price
Place
Promotion
Economic
Technological
Political
Cultural
Cultural
Social
Personal
Psychological
Problem
Recognition
Information search
Evaluation
Decision
Post Purchase
Behaviour
Product choice
Brand choice
Dealer choice
Purchase Timing
Purchase amount
THE BUYER DECISION PROCESS
8/3/2019 FINAL Television Industry
http://slidepdf.com/reader/full/final-television-industry 11/44
The buyer decision process consist of Five Stages-: Need recognition,
information search, evaluation of alternatives, purchase decision, and post
purchase behaviour. Clearly the buying process starts long before actual purchase
and continues long after. Marketer need to focus on the entire buying processrather than on just the purchase decision.
1. NEED RECOGNITION- The first stage of the buyer decision process in
which the consumer recognizes a problem or need.
2. INFORMATION SEARCH- The stage of the buyer decision process in
which the consumer is aroused to search for more information; the
consumer may simply have heightened attention or may go into active
information search.
3. EVALUATION OF ALTERNATIVES - The stage of the buyer decision
process in which the consumer uses information to evaluate alternative
brands in the choice set.
4. PURCHASE DECISION- The stage of the buyer decision process in
which the consumer actually buys the product.
5. POST PURCHASE BEHAVIOUR -The stage of the buyer decision
process in which the consumer take further action after purchase based their
satisfaction or dissatisfaction.
FACTORS AFFECTING CONSUMER BEHAVIOR
8/3/2019 FINAL Television Industry
http://slidepdf.com/reader/full/final-television-industry 12/44
Consumer purchases are influenced strongly by cultural, social, personal, and
psychological characteristics. For most marketer cannot control such factors, but
they must take them into account.
(a) CULTURAL FACTORS
Cultural factors exert the broadest and deepest influence on the
consumer behavior the marketer needs to understand the role played by the
buyer’s culture, subculture, and social class.
(i) Culture- the set of basic values, perception, wants and behavior
learned by the member of the society from family and other important
institutions.
(ii) Subculture- a group of people with shared values system based on
common life experiences and situations.
(iii) Social class- relatively permanent and division in a society house
members share a similar values, interests, and behavior.
(b) SOCIAL FACTORS
A consumer’s behavior is influenced by social factors, such as the
consumer’s small group, family and social roles and status
(i) Group- Two or more people who interact to accomplish individual
l or mutual goals.
(ii) Family- The family members (husband, wife, children) can
strongly influence buyer behavior
(iii) Role and Status- Role consist of the activities people are expected
to perform according to the persons around them.
Status reflect the general esteem given to it by the society. People often
choose the products that show their status in the society.
(c) PERSONAL FACTOR
8/3/2019 FINAL Television Industry
http://slidepdf.com/reader/full/final-television-industry 13/44
A buyer decision also are influenced by personal characteristics such as
the buyer’s age life style, and life cycle stage, occupation ,economic situation ,
lifestyle , and personality and self concept.
(i) Age and Life cycle stage- People change the goods and services they buyover their lifetime. Tastes of the people undergo change with their age.
Family life cycle- the stages through which families might pass as they
mature over time.
(ii) Occupation – A person’s occupation also affect the goods and services
they bought
(iii) Life Style- A person’s pattern of living as expressed in his/her activities,
interest, and opinion.
(iv) Personality-A person’s distinguishing psychological characterstics that
lead to relatively consistent and lasting responses to his or her own
environment.
(d) PSYCHOLOGICAL FACTORS
A person’s buying choices are influenced by four major psychological
factors: motivation, perception, learning, and beliefs and attitudes.
(i) Motivation- A need that is sufficiently pressing to direct the person to seek
satisfaction of the need.
(ii) Perception- The process by which people select, organize, and interpret
information to form a meaningful picture of the world.
(iii) Learning- Changes in the individual’s behavior arising from experience.
(iv) Beliefs and Attitude- Belief is a descriptive thought a person hold about
something.
Attitude is a person’s consistently favorable or unfavorable
evaluation, feelings, and tendencies towards an object or idea.
RESEARCH METHODOLOGY
8/3/2019 FINAL Television Industry
http://slidepdf.com/reader/full/final-television-industry 14/44
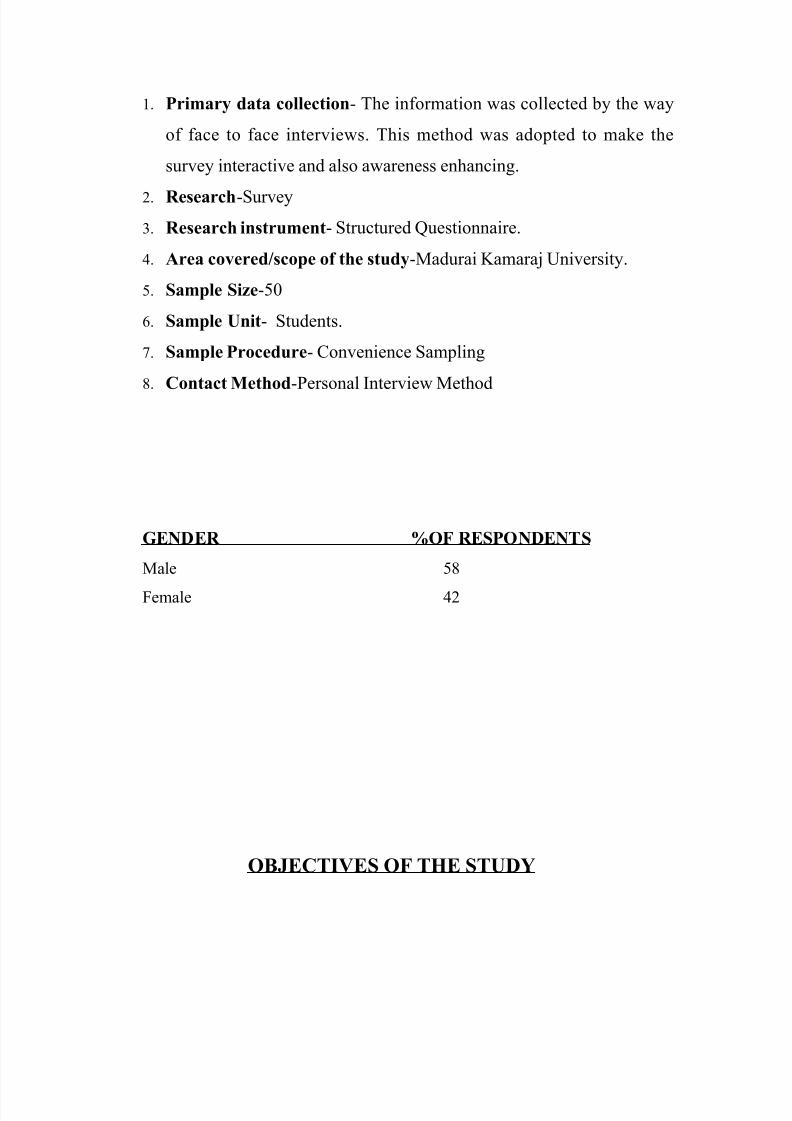
1. Primary data collection- The information was collected by the way
of face to face interviews. This method was adopted to make the
survey interactive and also awareness enhancing.
2. Research-Survey
3. Research instrument- Structured Questionnaire.
4. Area covered/scope of the study-Madurai Kamaraj University.
5. Sample Size-50
6. Sample Unit- Students.
7. Sample Procedure- Convenience Sampling
8. Contact Method-Personal Interview Method
GENDER %OF RESPONDENTS
Male 58
Female 42
OBJECTIVES OF THE STUDY
8/3/2019 FINAL Television Industry
http://slidepdf.com/reader/full/final-television-industry 15/44
The buying behavior of the consumer with regard to CTV is influenced by number
of external and internal factors and this study attempts to know about the
consumer buying behavior and at the same time what factors do the consumers
have in their mind before they make up their mind to purchase a CTV so the main
aim of my study was:-
1. To determine factors that influence the buying behavior of consumer.
2. To determine the most preferred brand.
3. To find out reasons and analysis for the most preferred brand.
4. To determine the most preferred features that the consumers look for while
the selection of any brand.
5. To have an idea about the future purchase plan of the consumers.
6. To determine the level of satisfaction with regard to services provided by the
retailers and brand already owned by the consumer.
7. To determine the promotional schemes that attracts the consumer the most.
8. To know whether CTV are bought on a particular occasion or purchases are
need driven.
8/3/2019 FINAL Television Industry
http://slidepdf.com/reader/full/final-television-industry 16/44
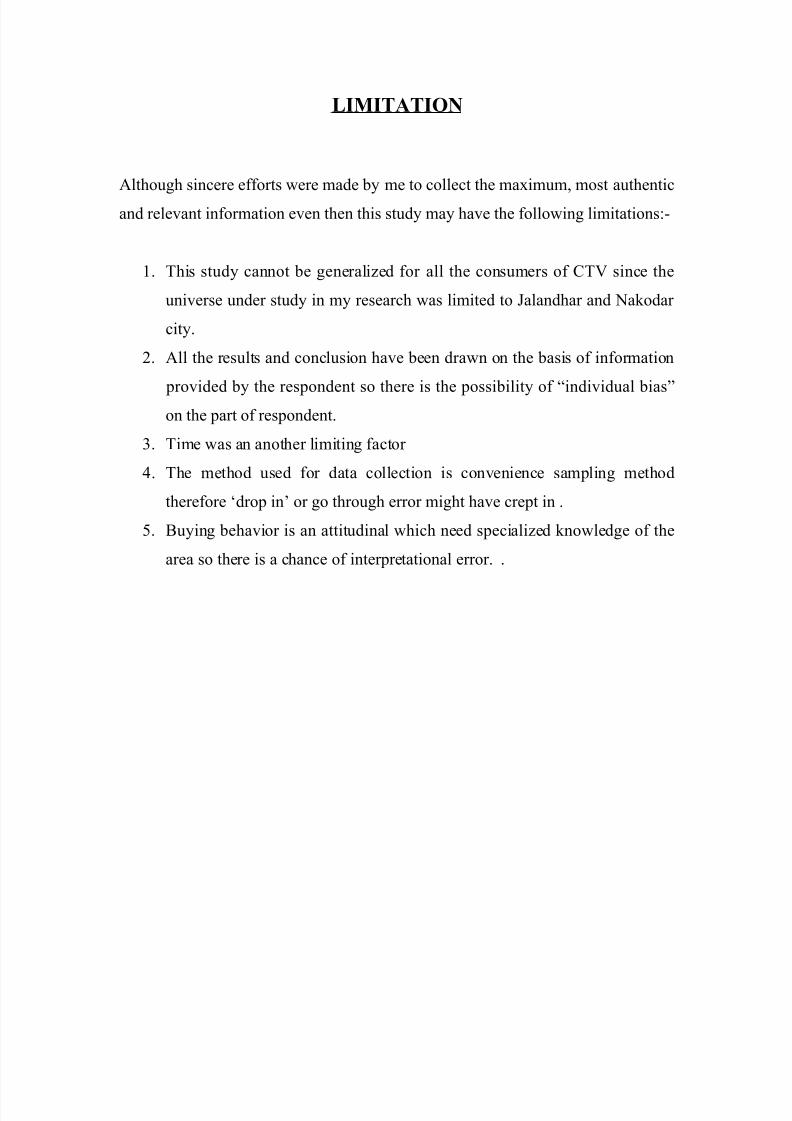
LIMITATION
Although sincere efforts were made by me to collect the maximum, most authentic
and relevant information even then this study may have the following limitations:-
1. This study cannot be generalized for all the consumers of CTV since the
universe under study in my research was limited to Jalandhar and Nakodar
city.
2. All the results and conclusion have been drawn on the basis of information
provided by the respondent so there is the possibility of “individual bias”on the part of respondent.
3. Time was an another limiting factor
4. The method used for data collection is convenience sampling method
therefore ‘drop in’ or go through error might have crept in .
5. Buying behavior is an attitudinal which need specialized knowledge of the
area so there is a chance of interpretational error. .
8/3/2019 FINAL Television Industry
http://slidepdf.com/reader/full/final-television-industry 17/44
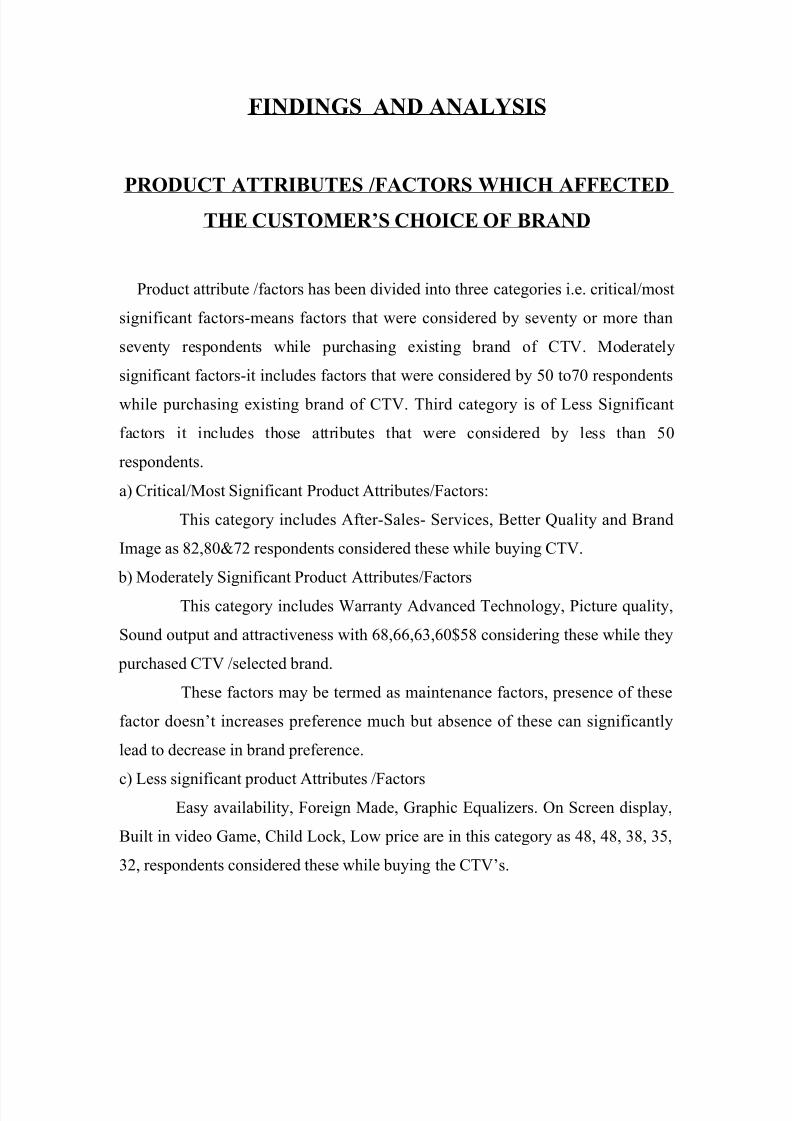
FINDINGS AND ANALYSIS
PRODUCT ATTRIBUTES /FACTORS WHICH AFFECTED
THE CUSTOMER’S CHOICE OF BRAND
Product attribute /factors has been divided into three categories i.e. critical/most
significant factors-means factors that were considered by seventy or more than
seventy respondents while purchasing existing brand of CTV. Moderately
significant factors-it includes factors that were considered by 50 to70 respondents
while purchasing existing brand of CTV. Third category is of Less Significant
factors it includes those attributes that were considered by less than 50
respondents.
a) Critical/Most Significant Product Attributes/Factors:
This category includes After-Sales- Services, Better Quality and Brand
Image as 82,80&72 respondents considered these while buying CTV.
b) Moderately Significant Product Attributes/Factors
This category includes Warranty Advanced Technology, Picture quality,
Sound output and attractiveness with 68,66,63,60$58 considering these while they
purchased CTV /selected brand.
These factors may be termed as maintenance factors, presence of these
factor doesn’t increases preference much but absence of these can significantly
lead to decrease in brand preference.
c) Less significant product Attributes /FactorsEasy availability, Foreign Made, Graphic Equalizers. On Screen display,
Built in video Game, Child Lock, Low price are in this category as 48, 48, 38, 35,
32, respondents considered these while buying the CTV’s.
8/3/2019 FINAL Television Industry
http://slidepdf.com/reader/full/final-television-industry 18/44
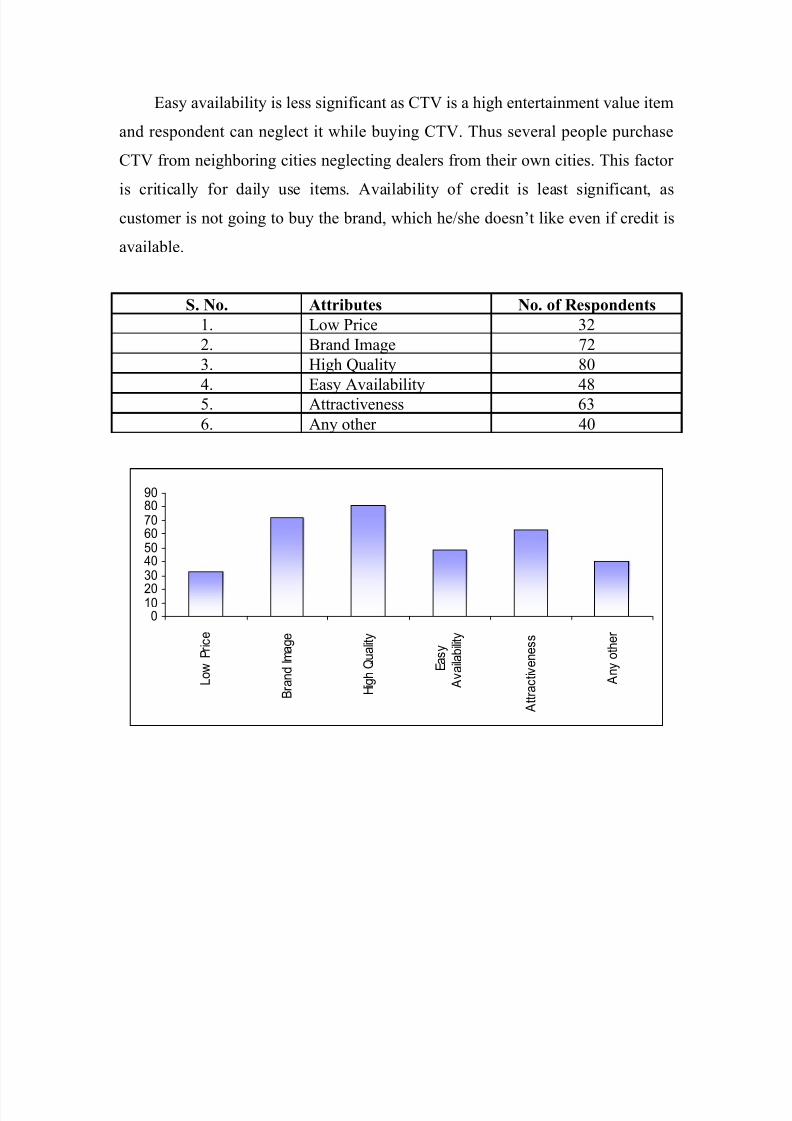
Easy availability is less significant as CTV is a high entertainment value item
and respondent can neglect it while buying CTV. Thus several people purchase
CTV from neighboring cities neglecting dealers from their own cities. This factor
is critically for daily use items. Availability of credit is least significant, ascustomer is not going to buy the brand, which he/she doesn’t like even if credit is
available.
S. No. Attributes No. of Respondents
1. Low Price 32
2. Brand Image 72
3. High Quality 80
4. Easy Availability 485. Attractiveness 63
6. Any other 40
01020
30405060708090
L o w P
r i c e
B r a n d I m a g e
H i g h Q u a l i t y
E a s y
A v a i l a b i l i t y
A t t r a c t i v e n e s s
A n y o t h e r
8/3/2019 FINAL Television Industry
http://slidepdf.com/reader/full/final-television-industry 19/44
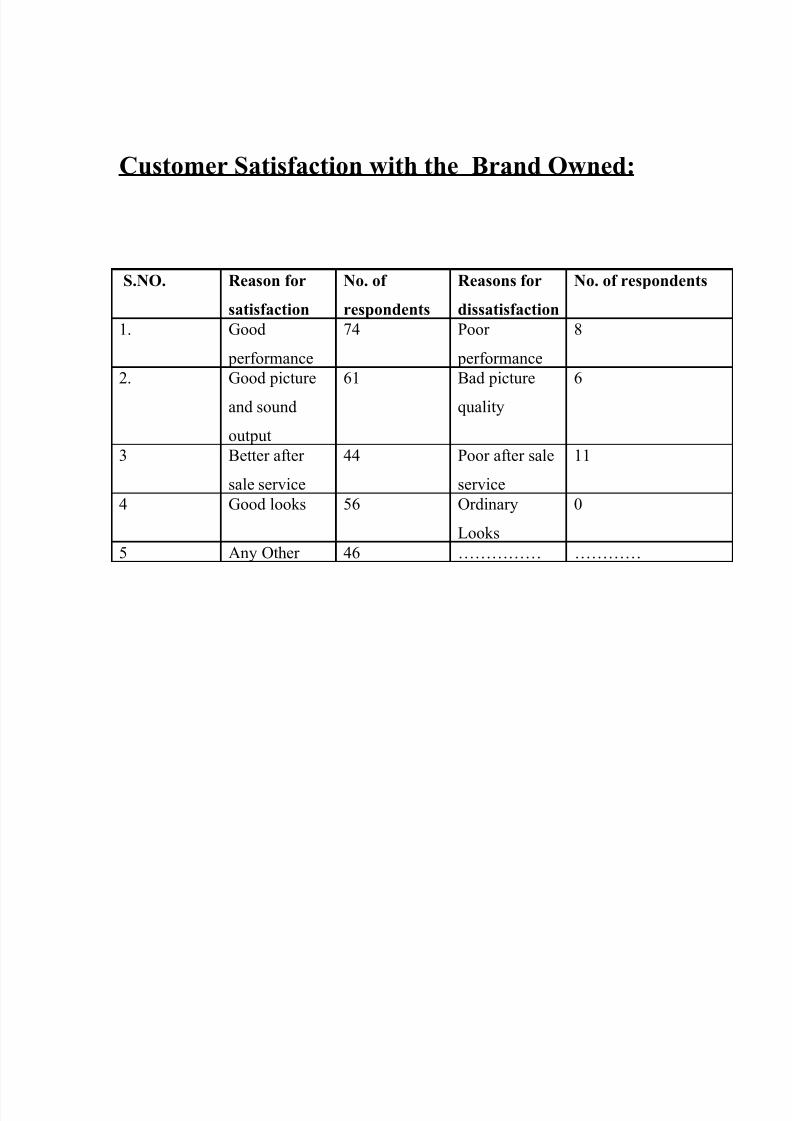
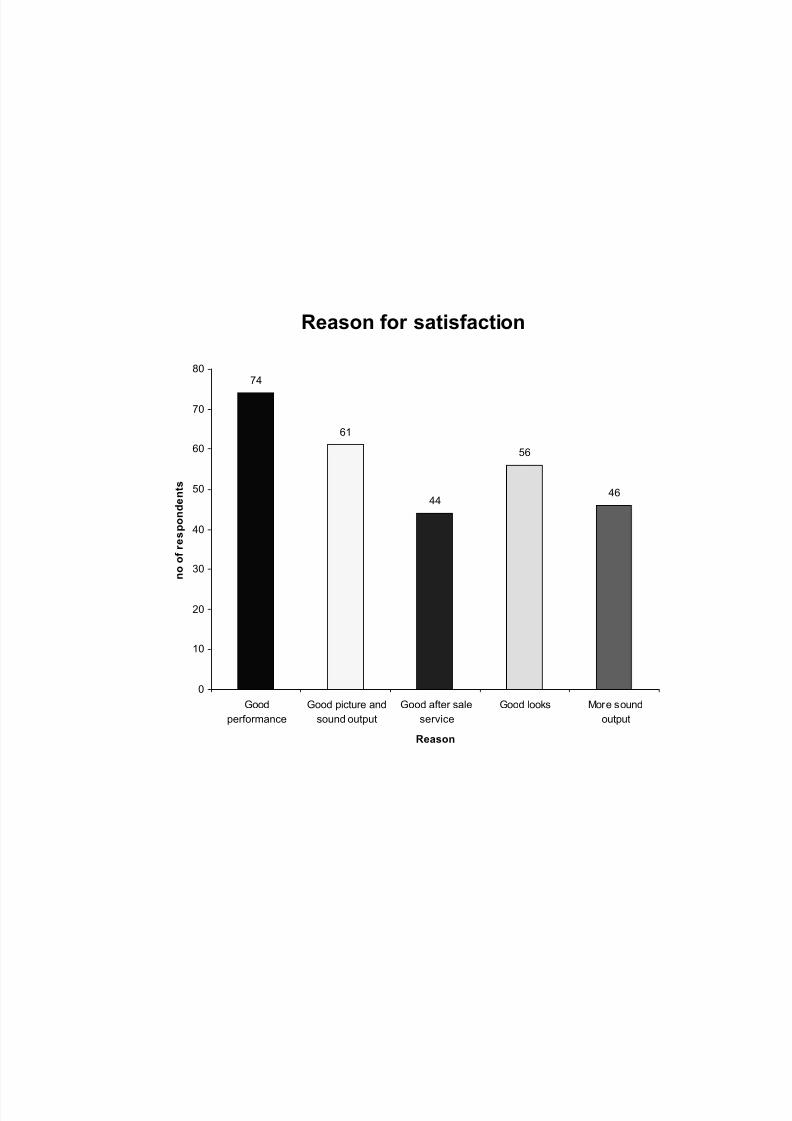
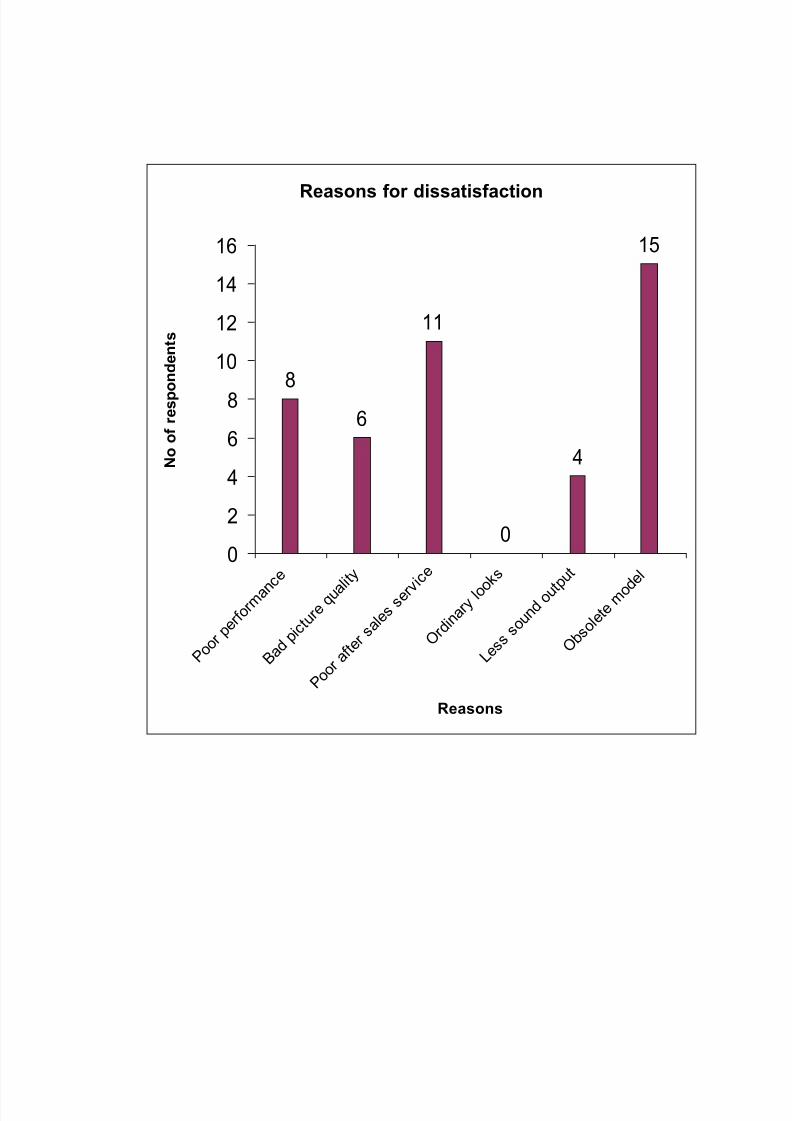
Customer Satisfaction with the Brand Owned:
S.NO. Reason for
satisfaction
No. of
respondents
Reasons for
dissatisfaction
No. of respondents
1. Good
performance
74 Poor
performance
8
2. Good picture
and sound
output
61 Bad picture
quality
6
3 Better after
sale service
44 Poor after sale
service
11
4 Good looks 56 Ordinary
Looks
0
5 Any Other 46 …………… …………
8/3/2019 FINAL Television Industry
http://slidepdf.com/reader/full/final-television-industry 20/44
Reason for satisfaction
74
61
44
56
46
0
10
20
30
40
50
60
70
80
Good
performance
Good picture and
sound output
Good after sale
service
Good looks More sound
output
Reason
n o o f r e s p o n d e n t s
8/3/2019 FINAL Television Industry
http://slidepdf.com/reader/full/final-television-industry 21/44
Reasons for dissatisfaction
8
6
11
0
4
15
0
2
4
6
8
10
12
14
16
P o o r
p e r f o
r m a n
c e
B a d p i c t u r e q u a l
i t y
P o o r
a f t e
r s a l e s
s e r v
i c e
O r d i n
a r y l o o
k s
L e s s
s o u
n d o u t p
u t
O b s
o l e t e m o d
e l
Reasons
N o o f r e s p o n d e n t s
8/3/2019 FINAL Television Industry
http://slidepdf.com/reader/full/final-television-industry 22/44
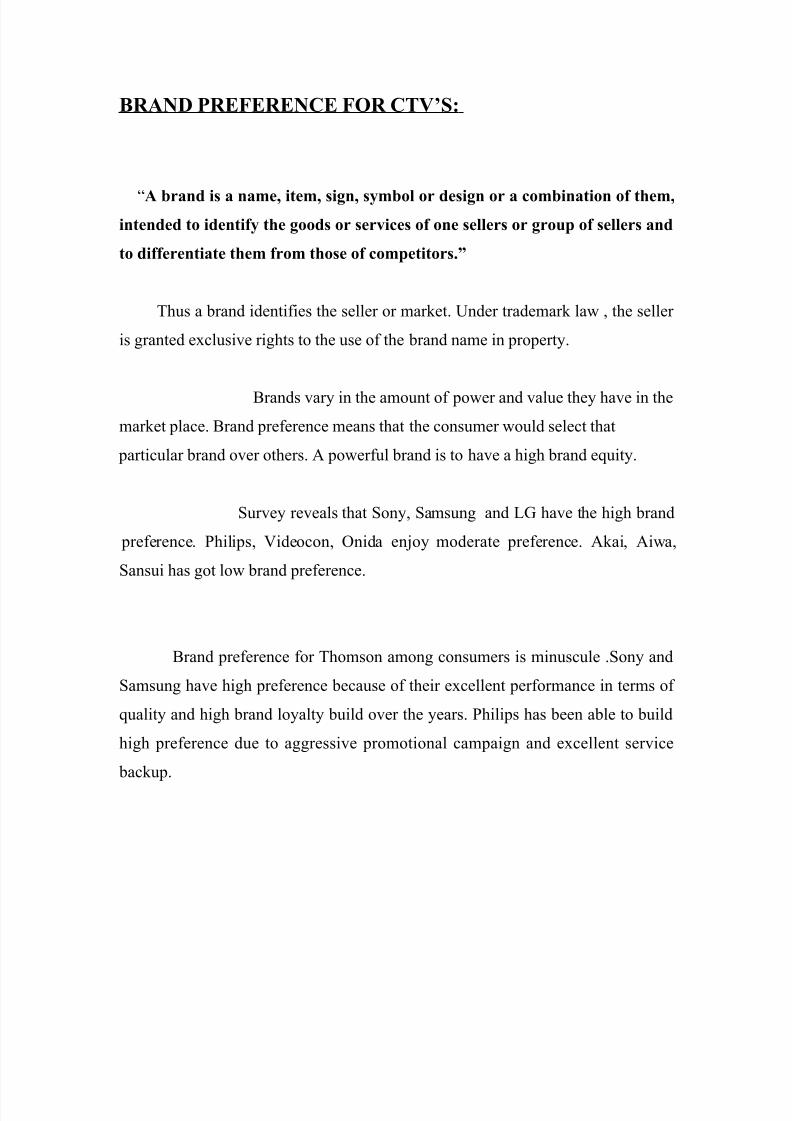
BRAND PREFERENCE FOR CTV’S:
“A brand is a name, item, sign, symbol or design or a combination of them,
intended to identify the goods or services of one sellers or group of sellers and
to differentiate them from those of competitors.”
Thus a brand identifies the seller or market. Under trademark law , the seller
is granted exclusive rights to the use of the brand name in property.
Brands vary in the amount of power and value they have in the
market place. Brand preference means that the consumer would select that
particular brand over others. A powerful brand is to have a high brand equity.
Survey reveals that Sony, Samsung and LG have the high brand
preference. Philips, Videocon, Onida enjoy moderate preference. Akai, Aiwa,
Sansui has got low brand preference.
Brand preference for Thomson among consumers is minuscule .Sony and
Samsung have high preference because of their excellent performance in terms of
quality and high brand loyalty build over the years. Philips has been able to build
high preference due to aggressive promotional campaign and excellent service
backup.
8/3/2019 FINAL Television Industry
http://slidepdf.com/reader/full/final-television-industry 23/44
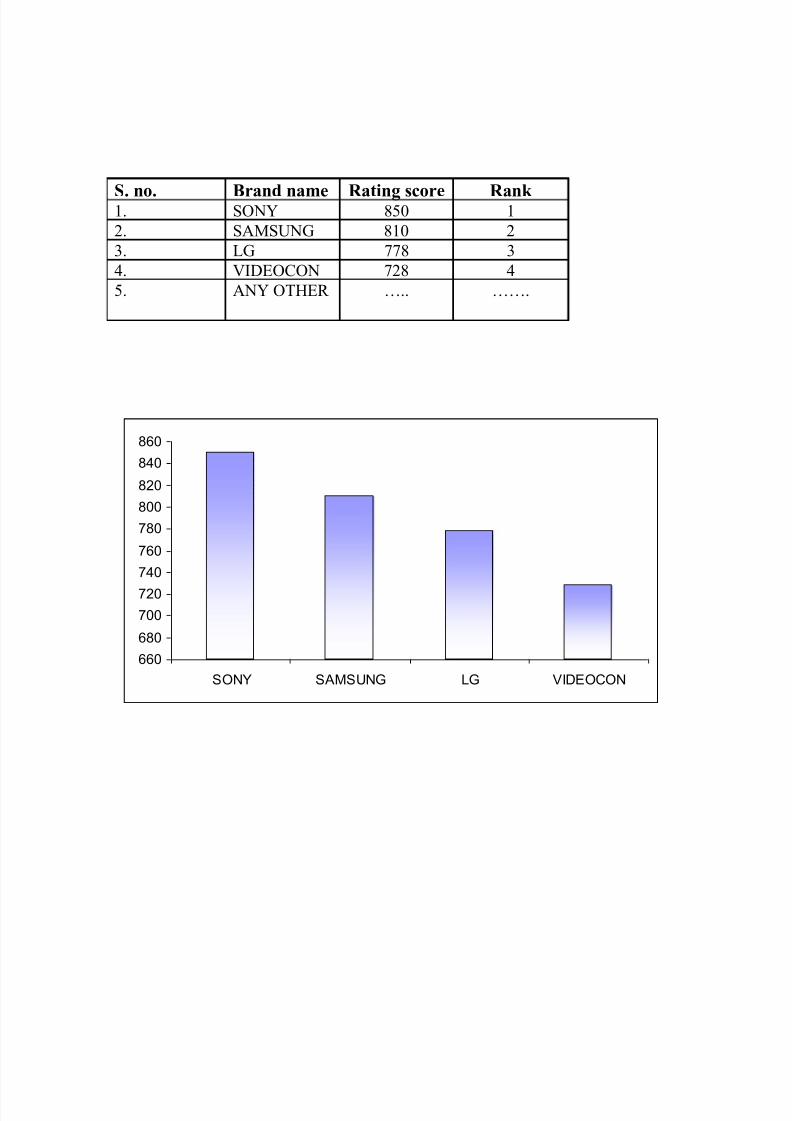
S. no. Brand name Rating score Rank 1. SONY 850 1
2. SAMSUNG 810 2
3. LG 778 3
4. VIDEOCON 728 4
5. ANY OTHER ….. …….
660
680
700
720
740
760
780
800
820
840
860
SONY SAMSUNG LG VIDEOCON
8/3/2019 FINAL Television Industry
http://slidepdf.com/reader/full/final-television-industry 24/44
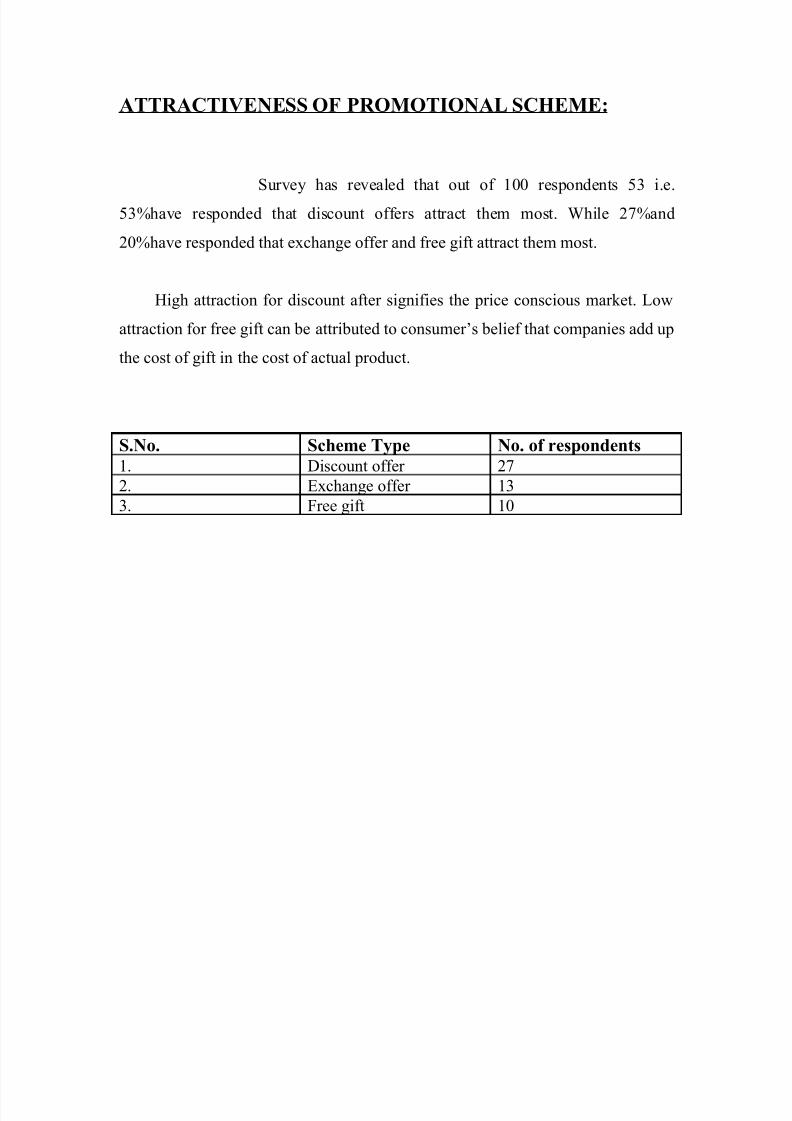
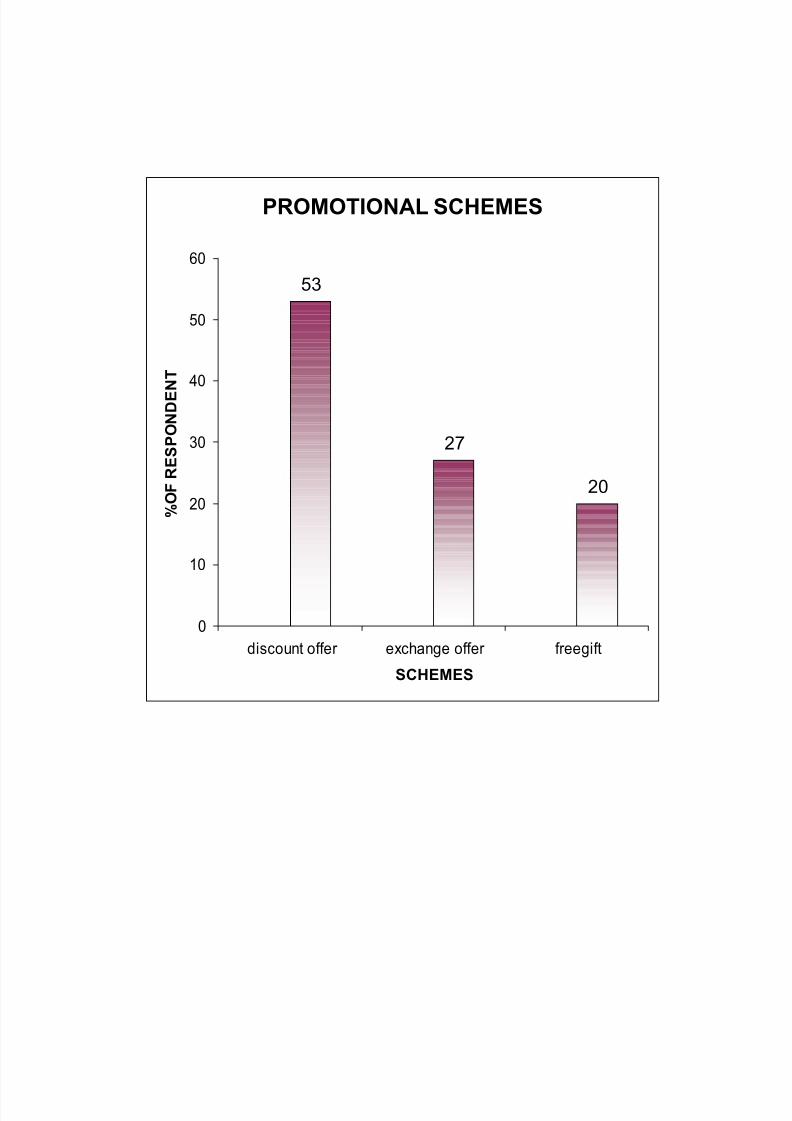
ATTRACTIVENESS OF PROMOTIONAL SCHEME:
Survey has revealed that out of 100 respondents 53 i.e.
53%have responded that discount offers attract them most. While 27%and
20%have responded that exchange offer and free gift attract them most.
High attraction for discount after signifies the price conscious market. Low
attraction for free gift can be attributed to consumer’s belief that companies add up
the cost of gift in the cost of actual product.
S.No. Scheme Type No. of respondents1. Discount offer 27
2. Exchange offer 13
3. Free gift 10
8/3/2019 FINAL Television Industry
http://slidepdf.com/reader/full/final-television-industry 25/44
PROMOTIONAL SCHEMES
53
27
20
0
10
20
30
40
50
60
discount offer exchange offer freegift
SCHEMES
% O F R E S P O N D E N T
8/3/2019 FINAL Television Industry
http://slidepdf.com/reader/full/final-television-industry 26/44
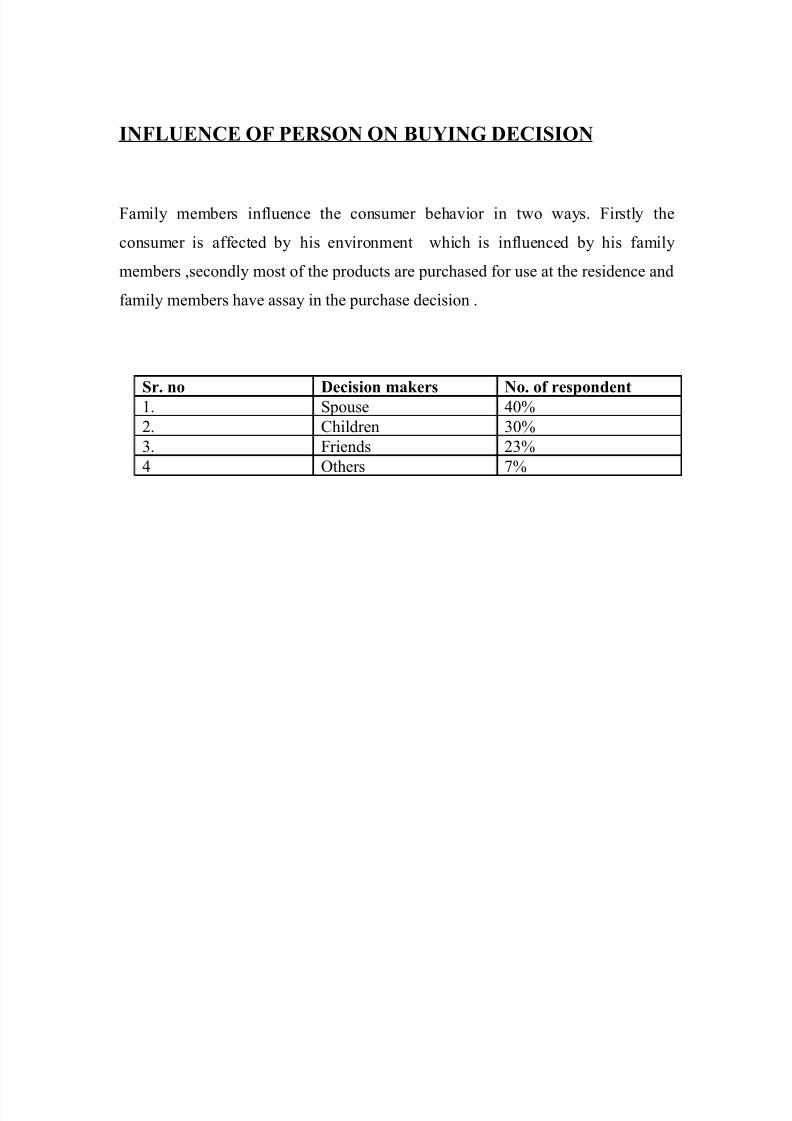
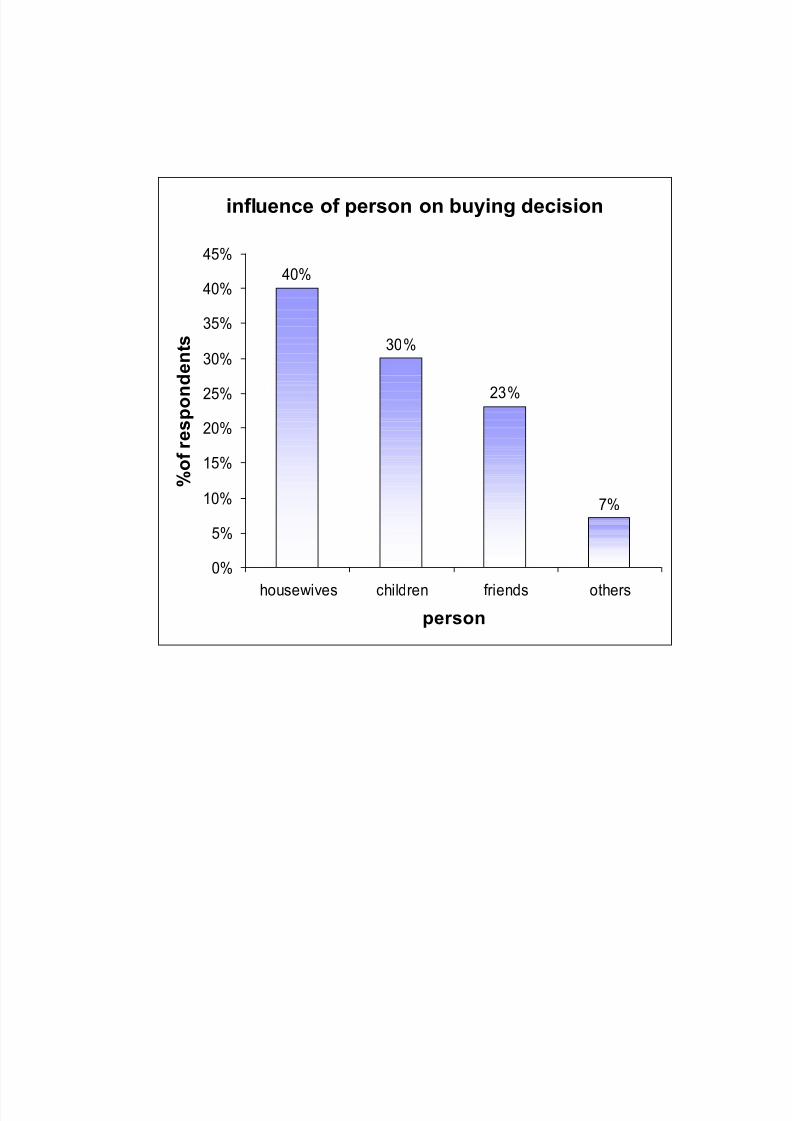
INFLUENCE OF PERSON ON BUYING DECISION
Family members influence the consumer behavior in two ways. Firstly the
consumer is affected by his environment which is influenced by his family
members ,secondly most of the products are purchased for use at the residence and
family members have assay in the purchase decision .
Sr. no Decision makers No. of respondent1. Spouse 40%
2. Children 30%
3. Friends 23%
4 Others 7%
8/3/2019 FINAL Television Industry
http://slidepdf.com/reader/full/final-television-industry 27/44
influence of person on buying decision
40%
30%
23%
7%
0%
5%
10%
15%
20%
25%
30%
35%
40%
45%
housewives children friends others
person
% o f r e s p o n
d e n t s
8/3/2019 FINAL Television Industry
http://slidepdf.com/reader/full/final-television-industry 28/44
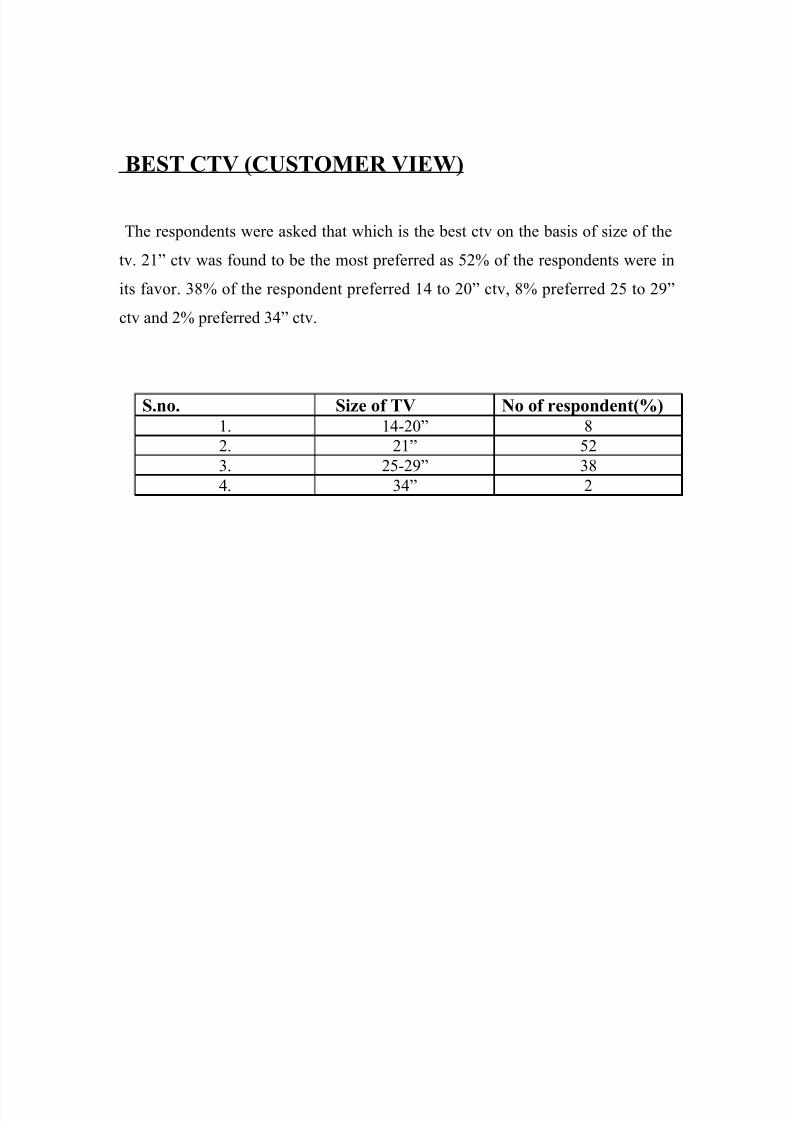
BEST CTV (CUSTOMER VIEW)
The respondents were asked that which is the best ctv on the basis of size of the
tv. 21” ctv was found to be the most preferred as 52% of the respondents were in
its favor. 38% of the respondent preferred 14 to 20” ctv, 8% preferred 25 to 29”
ctv and 2% preferred 34” ctv.
S.no. Size of TV No of respondent(%)1. 14-20” 8
2. 21” 52
3. 25-29” 38
4. 34” 2
8/3/2019 FINAL Television Industry
http://slidepdf.com/reader/full/final-television-industry 29/44
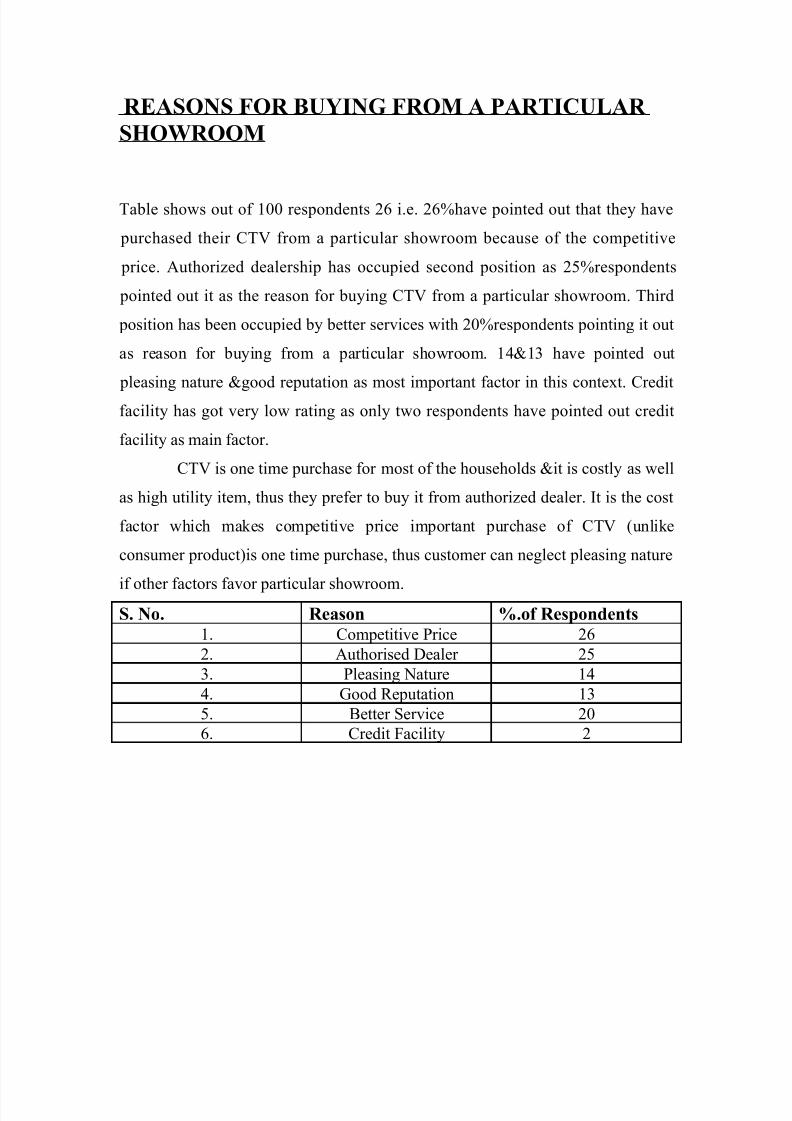
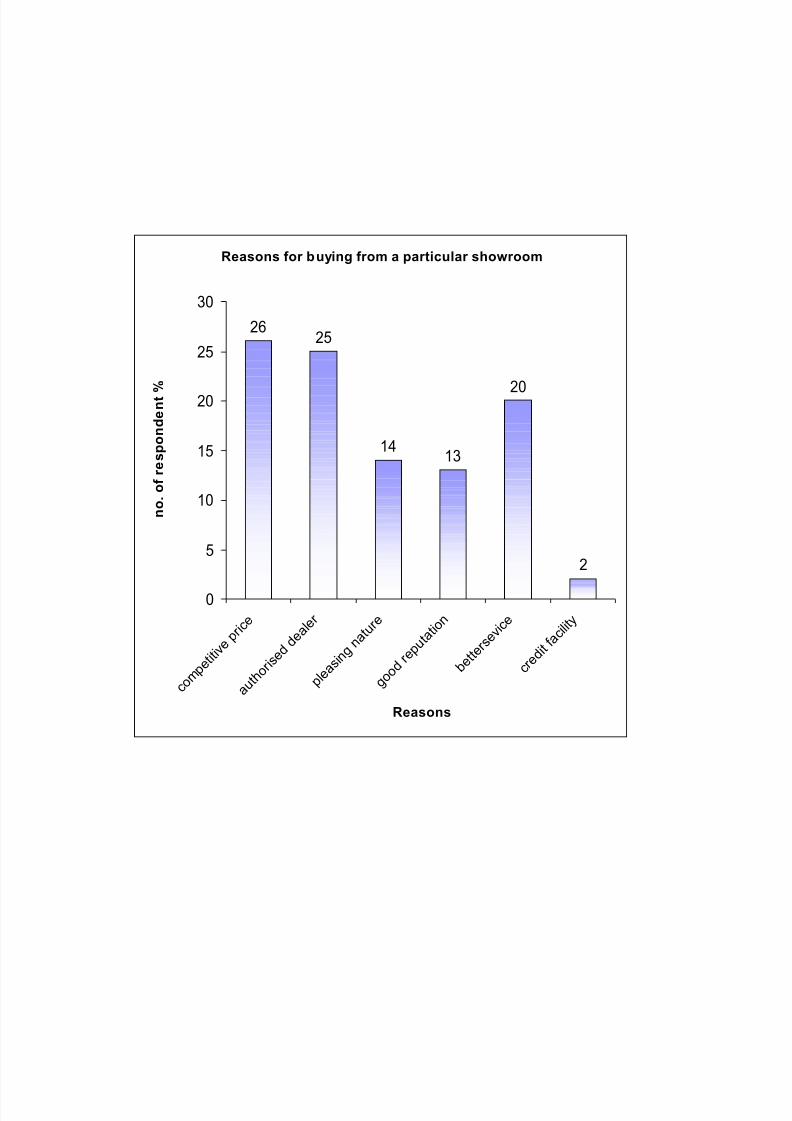
REASONS FOR BUYING FROM A PARTICULAR
SHOWROOM
Table shows out of 100 respondents 26 i.e. 26%have pointed out that they have
purchased their CTV from a particular showroom because of the competitive
price. Authorized dealership has occupied second position as 25%respondents
pointed out it as the reason for buying CTV from a particular showroom. Third
position has been occupied by better services with 20%respondents pointing it out
as reason for buying from a particular showroom. 14&13 have pointed out
pleasing nature &good reputation as most important factor in this context. Credit
facility has got very low rating as only two respondents have pointed out credit
facility as main factor.
CTV is one time purchase for most of the households &it is costly as well
as high utility item, thus they prefer to buy it from authorized dealer. It is the cost
factor which makes competitive price important purchase of CTV (unlike
consumer product)is one time purchase, thus customer can neglect pleasing nature
if other factors favor particular showroom.S. No. Reason %.of Respondents
1. Competitive Price 26
2. Authorised Dealer 25
3. Pleasing Nature 14
4. Good Reputation 13
5. Better Service 20
6. Credit Facility 2
8/3/2019 FINAL Television Industry
http://slidepdf.com/reader/full/final-television-industry 30/44
Reasons for buying from a particular showroom
2625
1413
20
2
0
5
10
15
20
25
30
c o m p e t i t i v e p r i c e
a u t h
o r i s e d
d e a l e
r
p l e a
s i n g n a t u
r e
g o o d
r e p u t a t i o
n
b e t t e
r s e v i c e
c r e d i t f a
c i l i t y
Reasons
n o . o f r e s p o n d e n t %
8/3/2019 FINAL Television Industry
http://slidepdf.com/reader/full/final-television-industry 31/44
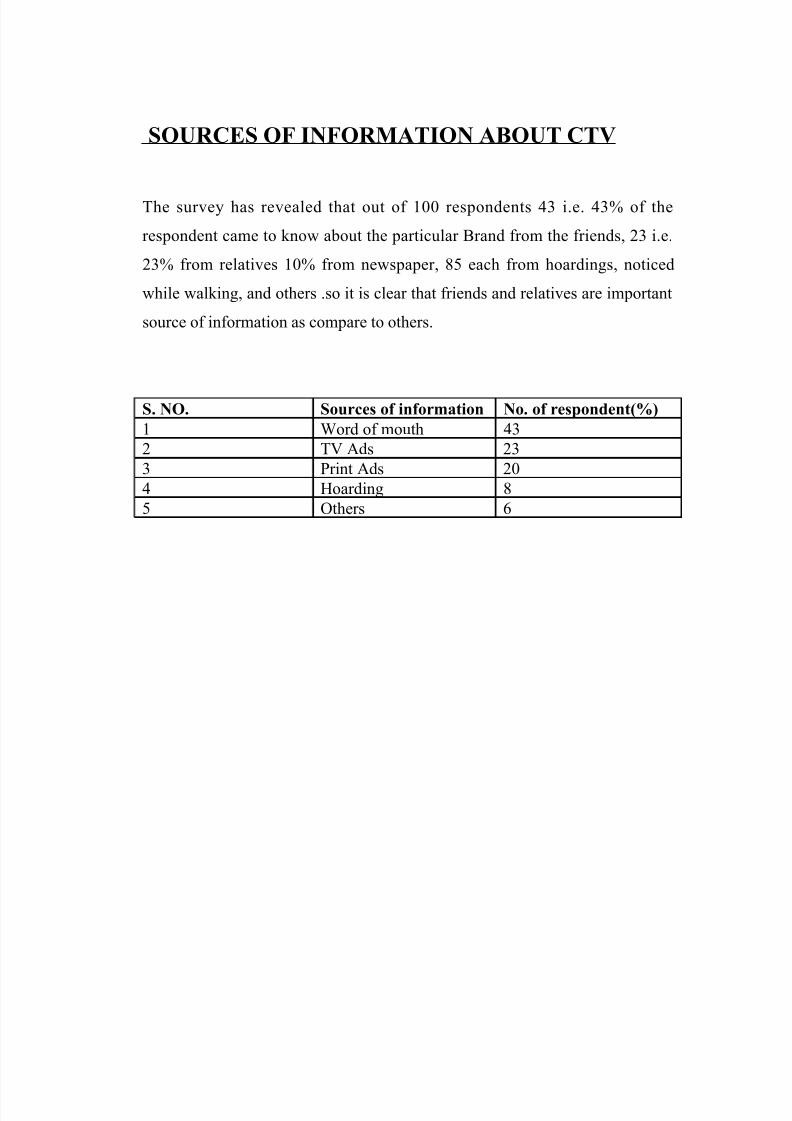
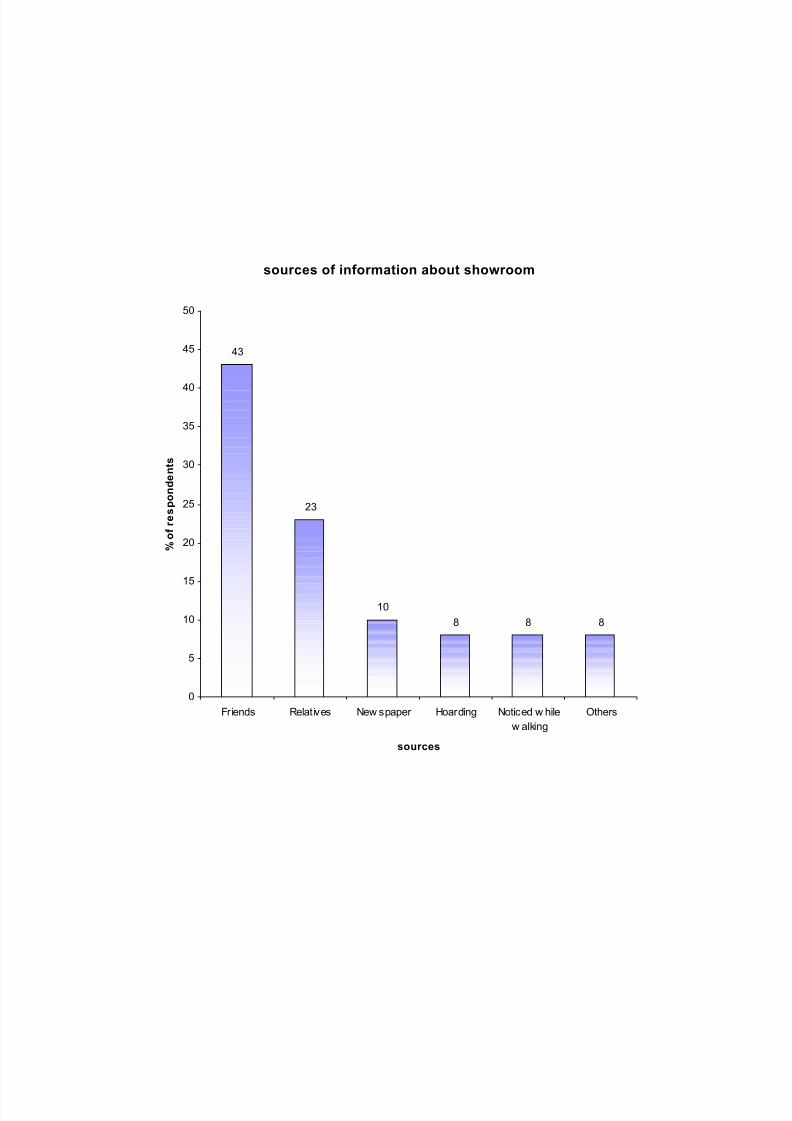
SOURCES OF INFORMATION ABOUT CTV
The survey has revealed that out of 100 respondents 43 i.e. 43% of the
respondent came to know about the particular Brand from the friends, 23 i.e.
23% from relatives 10% from newspaper, 85 each from hoardings, noticed
while walking, and others .so it is clear that friends and relatives are important
source of information as compare to others.
S. NO. Sources of information No. of respondent(%)
1 Word of mouth 43
2 TV Ads 23
3 Print Ads 20
4 Hoarding 8
5 Others 6
8/3/2019 FINAL Television Industry
http://slidepdf.com/reader/full/final-television-industry 32/44
sources of information about showroom
43
23
10
8 8 8
0
5
10
15
20
25
30
35
40
45
50
Friends Relatives New spaper Hoarding Noticed w hile
w alking
Others
sources
%
o f r e s p o n d e n t s
8/3/2019 FINAL Television Industry
http://slidepdf.com/reader/full/final-television-industry 33/44
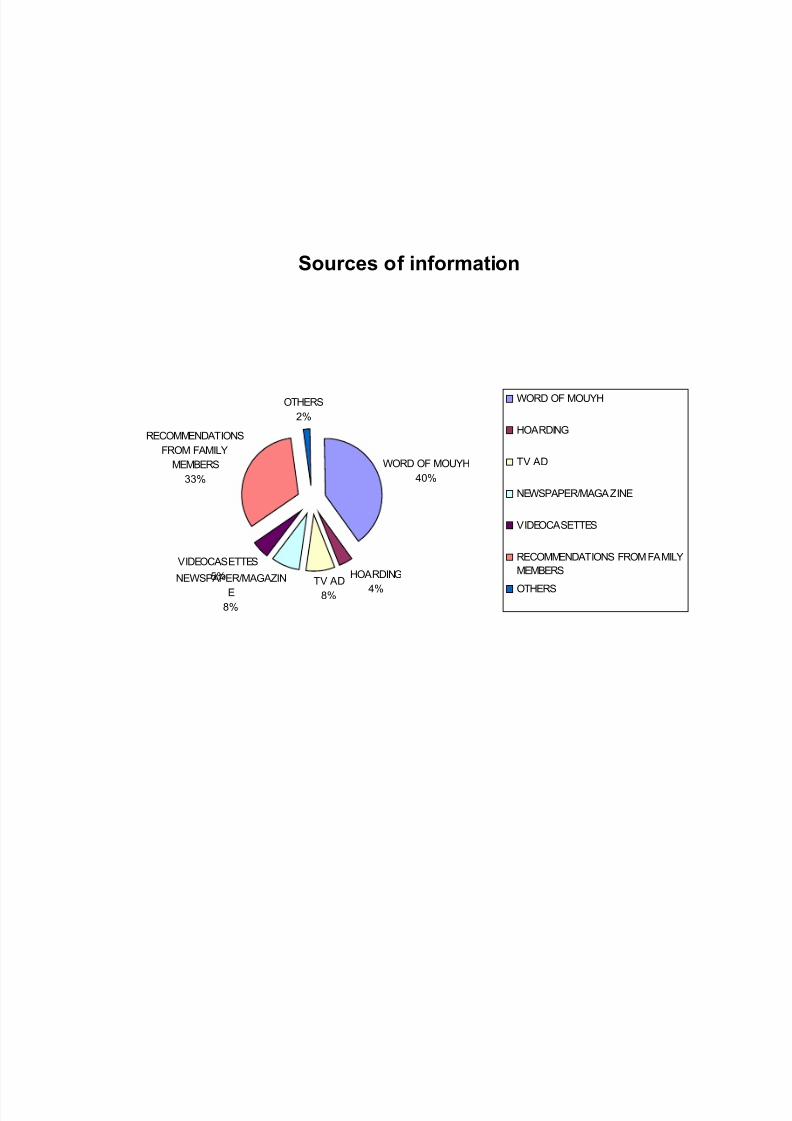
SOURCES OF INFORMATION ABOUT BRAND
Brand selection is one of the most important decision for
the customer tv is generally one time purchase item so consumer will like to
select the brand after taking in view the recommendation of others as different
brands have different positioning in the mind of the consumer so he/she will
like to go for a brand which will be recommended by others in order to reduce
the chances of post-purchase dissonance.
Word of mouth is the most crucial factor in brand
selection, recommendations from family members come at second, tv
advertisement and news paper occupies fourth position and hoardings are at
fourth position
S.NO. Source of information No of respondent(%)
1 Word of mouth 402 Hoarding 4
3 Tv advertisement 8
4 Print Ads 8
5 Others 5
8/3/2019 FINAL Television Industry
http://slidepdf.com/reader/full/final-television-industry 34/44
Sources of information
WORD OF MOUYH
40%
HOARDING
4%TV AD
8%
NEWSPAPER/MAGAZIN
E
8%
VIDEOCASETTES
5%
RECOMMENDATIONS
FROM FAMILY
MEMBERS
33%
OTHERS
2%
WORD OF MOUYH
HOARDING
TV AD
NEWSPAPER/MAGAZINE
VIDEOCASETTES
RECOMMENDATIONS FROM FAMILY
MEMBERS
OTHERS
8/3/2019 FINAL Television Industry
http://slidepdf.com/reader/full/final-television-industry 35/44
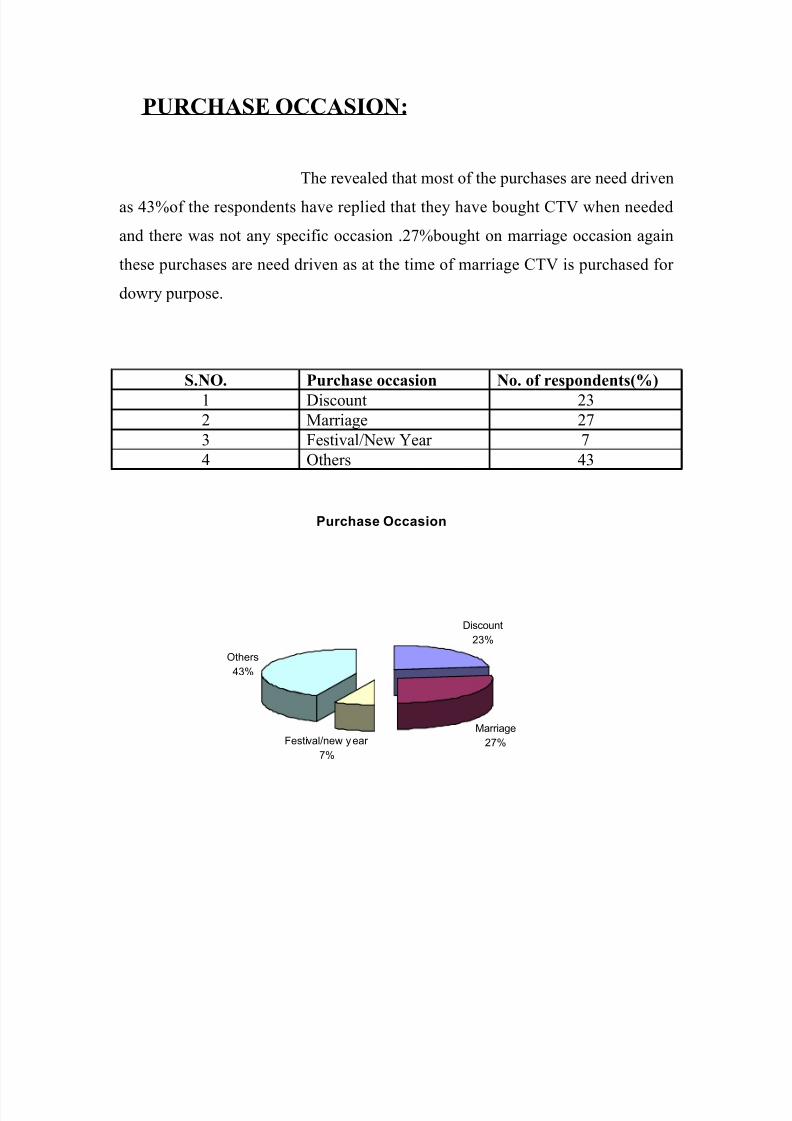
PURCHASE OCCASION:
The revealed that most of the purchases are need driven
as 43%of the respondents have replied that they have bought CTV when needed
and there was not any specific occasion .27%bought on marriage occasion again
these purchases are need driven as at the time of marriage CTV is purchased for
dowry purpose.
S.NO. Purchase occasion No. of respondents(%)
1 Discount 23
2 Marriage 27
3 Festival/New Year 7
4 Others 43
Purchase Occasion
Discount
23%
Marriage
27%Festival/new year
7%
Others
43%
8/3/2019 FINAL Television Industry
http://slidepdf.com/reader/full/final-television-industry 36/44
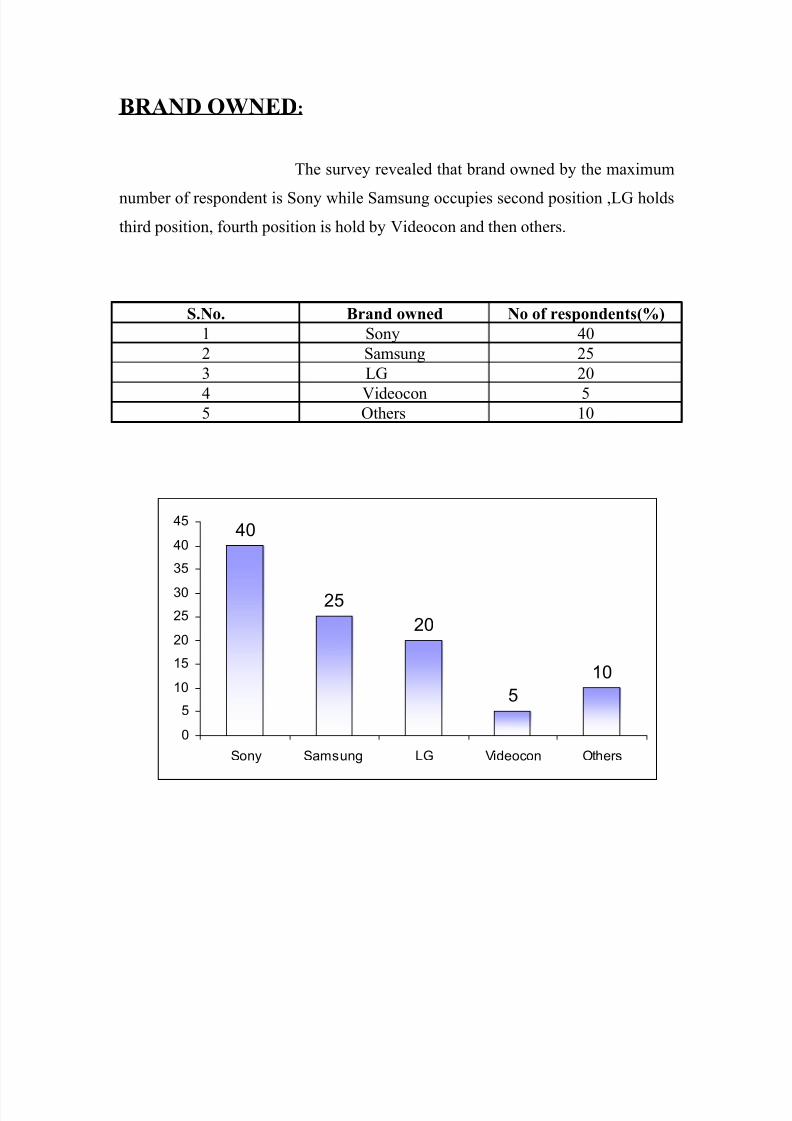
BRAND OWNED :
The survey revealed that brand owned by the maximum
number of respondent is Sony while Samsung occupies second position ,LG holds
third position, fourth position is hold by Videocon and then others.
S.No. Brand owned No of respondents(%)
1 Sony 40
2 Samsung 25
3 LG 20
4 Videocon 55 Others 10
40
25
20
5
10
0
5
10
15
20
25
30
35
40
45
Sony Samsung LG Videocon Others
8/3/2019 FINAL Television Industry
http://slidepdf.com/reader/full/final-television-industry 37/44
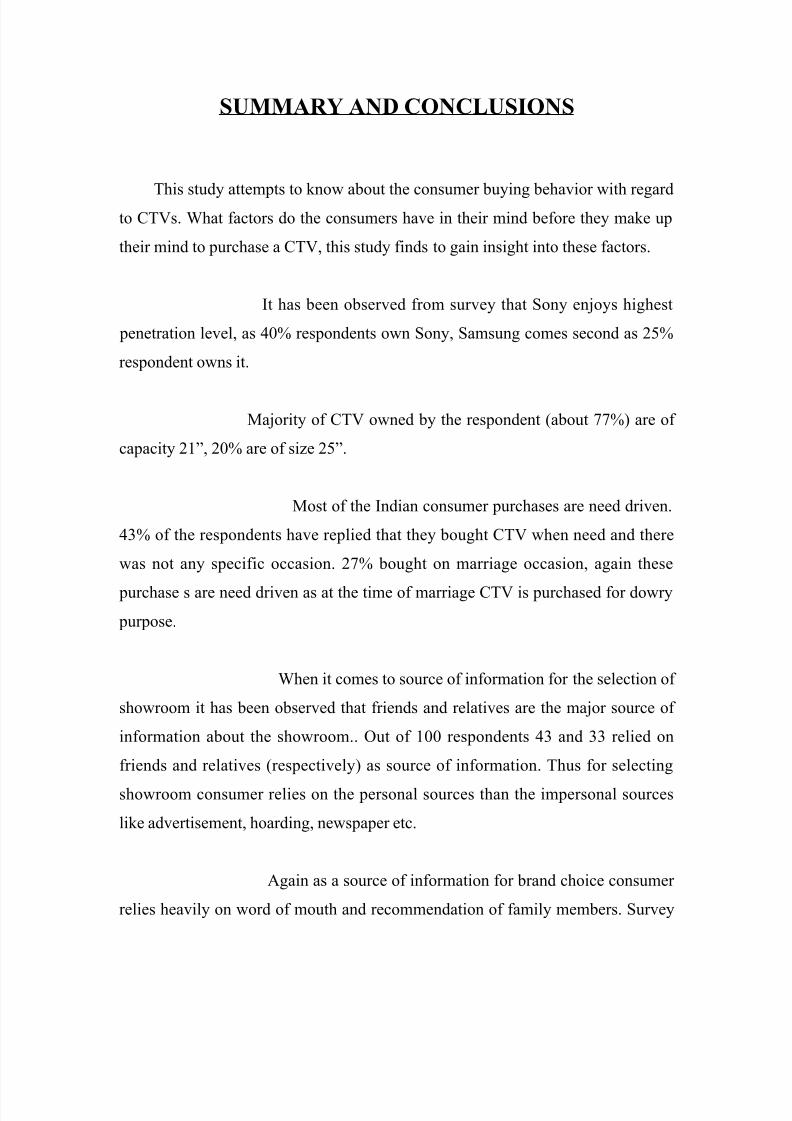
SUMMARY AND CONCLUSIONS
This study attempts to know about the consumer buying behavior with regardto CTVs. What factors do the consumers have in their mind before they make up
their mind to purchase a CTV, this study finds to gain insight into these factors.
It has been observed from survey that Sony enjoys highest
penetration level, as 40% respondents own Sony, Samsung comes second as 25%
respondent owns it.
Majority of CTV owned by the respondent (about 77%) are of
capacity 21”, 20% are of size 25”.
Most of the Indian consumer purchases are need driven.
43% of the respondents have replied that they bought CTV when need and there
was not any specific occasion. 27% bought on marriage occasion, again these
purchase s are need driven as at the time of marriage CTV is purchased for dowry
purpose.
When it comes to source of information for the selection of
showroom it has been observed that friends and relatives are the major source of
information about the showroom.. Out of 100 respondents 43 and 33 relied on
friends and relatives (respectively) as source of information. Thus for selecting
showroom consumer relies on the personal sources than the impersonal sources
like advertisement, hoarding, newspaper etc.
Again as a source of information for brand choice consumer
relies heavily on word of mouth and recommendation of family members. Survey
8/3/2019 FINAL Television Industry
http://slidepdf.com/reader/full/final-television-industry 38/44
has revealed that 40% of respondents relied on word of mouth and 33%on
recommendations of family members. Spouse has been found to be most
influential during purchase decision of CTVs.
Majority of respondents have pointed out that they bought
CTV from particular showroom because of competitive prices and authorized
dealership. This has been confirmed from the rating of factors affecting choice of
showroom/retailer as authorized dealer and competitive price are two top factors.
When it comes to the selection of showroom after sales service is less important
than above two factors as it (after sale service) is considered to be the
responsibility of company. After sale service is usually provided by the company.
After sale service, high quality, brand image, child lock are the
most significant factors influencing choice of brands with rating score more than
700.
Attractiveness of model, picture quality, advanced technology, warranty and
looks have been found to be the moderately significant with rating score between
500-700.
Availability of credit, easy availability, low price, foreign make and
graphic equalizers are less important factors with rating score less than 500. This
pattern has been confirmed from the analysis of factor that influenced the
respondents while buying their existing brand of CTV. Child lock, video games
which lies in less significant category according to the analysis of factors which
influenced customers while selecting their existing brands comes to most
significant category from of attributes. This can be attributed to the fact that most
of the existing CTVs (about 88%) have been purchased after (1991), before that
only 12%had purchased CTVs.
8/3/2019 FINAL Television Industry
http://slidepdf.com/reader/full/final-television-industry 39/44
It has been clearly depicted from the study that level of
satisfaction among consumer is very high. Out of 100 respondents 83 i.e. 83%are
satisfied from the service of the showroom. So far as the satisfaction from the
brand /model owned 81 i.e.81%are satisfied. Good performance, picture qualityand good after sale service are the most important reasons for the high level of
satisfaction among the consumer. 15 out of 19 are dissatisfied consumers pointed
out that obsolete model as a reason for their dissatisfaction. From this we can
interpret that taste for more features is growing among consumers.
Sony and Samsung are found to be the most preferred brands,
Whereas preference for Videocon is minuscule. LG and Philips enjoy moderate
preference. Aiwa and Akai are less preferred brands.
In terms of popularity (brand recall test) Sony has been found to be most
popular brand with weighted mean of (first, second, third)20.66 Samsung and LG
comes second and third respectively in popularity with weighted average 15.66
and 13.66 respectively. Thus Sony and Samsung can be attributed to these fact that
these two are very old and reliable in CTV market. Popularity of Samsung is high
because of the aggressive advertisement campaign by the company.
8/3/2019 FINAL Television Industry
http://slidepdf.com/reader/full/final-television-industry 40/44
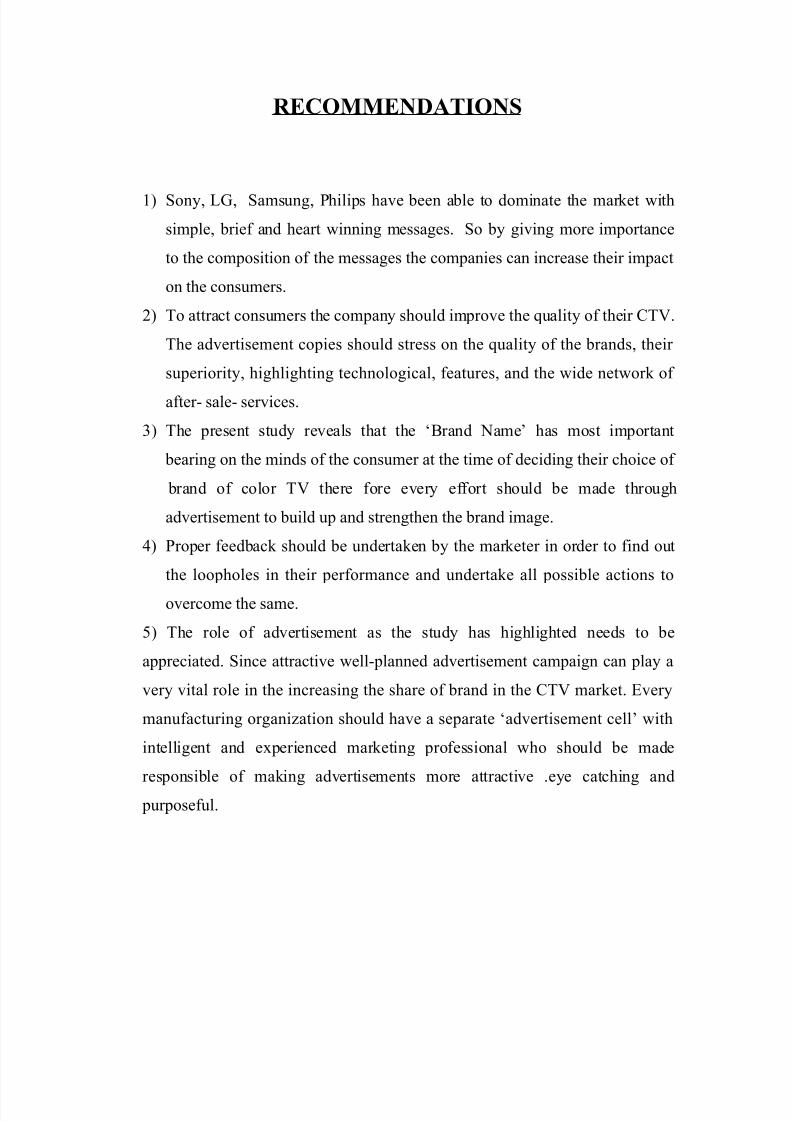
RECOMMENDATIONS
1) Sony, LG, Samsung, Philips have been able to dominate the market with
simple, brief and heart winning messages. So by giving more importance
to the composition of the messages the companies can increase their impact
on the consumers.
2) To attract consumers the company should improve the quality of their CTV.
The advertisement copies should stress on the quality of the brands, their
superiority, highlighting technological, features, and the wide network of
after- sale- services.
3) The present study reveals that the ‘Brand Name’ has most important
bearing on the minds of the consumer at the time of deciding their choice of
brand of color TV there fore every effort should be made through
advertisement to build up and strengthen the brand image.
4) Proper feedback should be undertaken by the marketer in order to find out
the loopholes in their performance and undertake all possible actions to
overcome the same.
5) The role of advertisement as the study has highlighted needs to be
appreciated. Since attractive well-planned advertisement campaign can play a
very vital role in the increasing the share of brand in the CTV market. Every
manufacturing organization should have a separate ‘advertisement cell’ with
intelligent and experienced marketing professional who should be made
responsible of making advertisements more attractive .eye catching and
purposeful.
8/3/2019 FINAL Television Industry
http://slidepdf.com/reader/full/final-television-industry 41/44
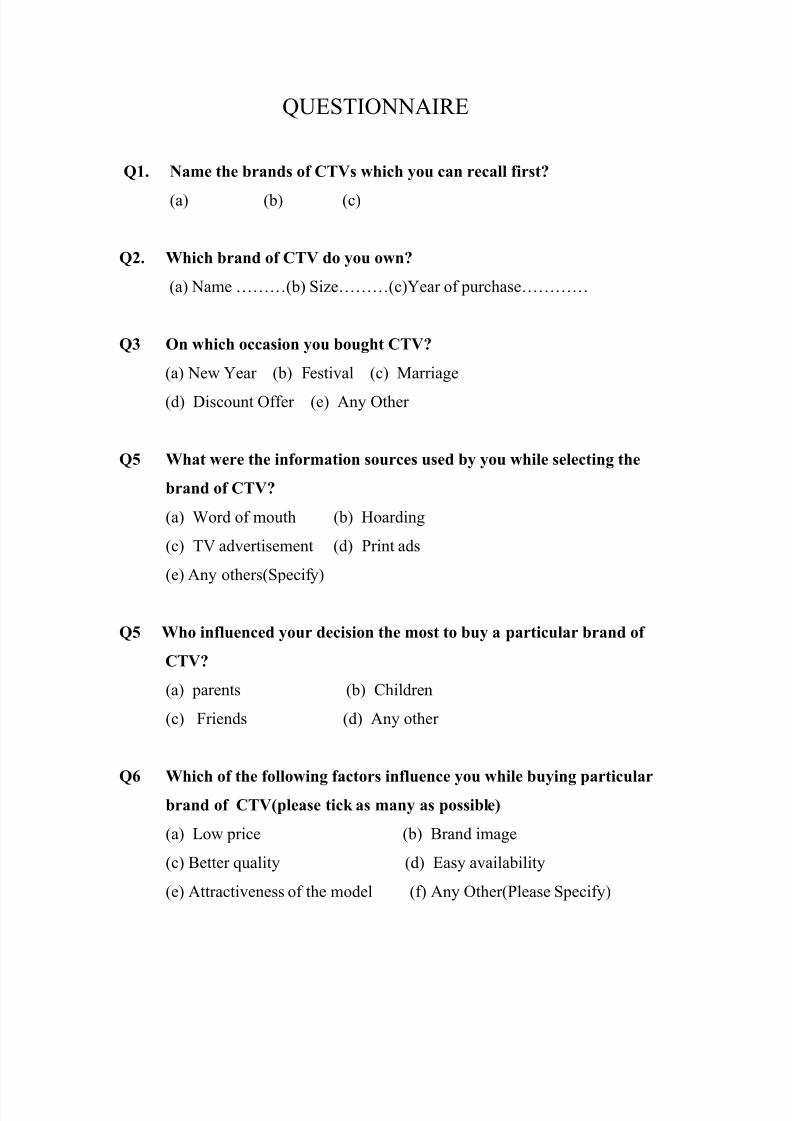
QUESTIONNAIRE
Q1. Name the brands of CTVs which you can recall first?
(a) (b) (c)
Q2. Which brand of CTV do you own?
(a) Name ………(b) Size………(c)Year of purchase…………
Q3 On which occasion you bought CTV?
(a) New Year (b) Festival (c) Marriage
(d) Discount Offer (e) Any Other
Q5 What were the information sources used by you while selecting the
brand of CTV?
(a) Word of mouth (b) Hoarding
(c) TV advertisement (d) Print ads
(e) Any others(Specify)
Q5 Who influenced your decision the most to buy a particular brand of
CTV?
(a) parents (b) Children
(c) Friends (d) Any other
Q6 Which of the following factors influence you while buying particular
brand of CTV(please tick as many as possible)
(a) Low price (b) Brand image
(c) Better quality (d) Easy availability
(e) Attractiveness of the model (f) Any Other(Please Specify)
8/3/2019 FINAL Television Industry
http://slidepdf.com/reader/full/final-television-industry 42/44
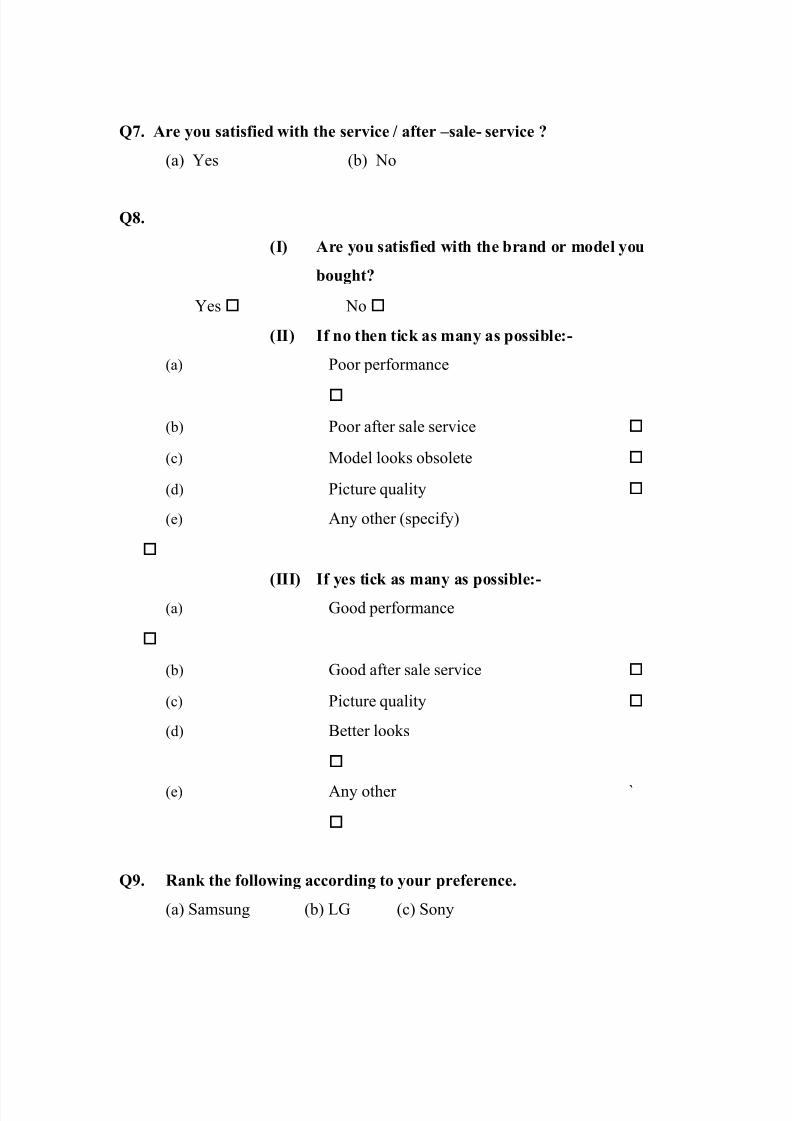
Q7. Are you satisfied with the service / after –sale- service ?
(a) Yes (b) No
Q8.
(I) Are you satisfied with the brand or model you
bought?
Yes No
(II) If no then tick as many as possible:-
(a) Poor performance
(b) Poor after sale service
(c) Model looks obsolete
(d) Picture quality
(e) Any other (specify)
(III) If yes tick as many as possible:-
(a) Good performance
(b) Good after sale service
(c) Picture quality
(d) Better looks
(e) Any other `
Q9. Rank the following according to your preference.
(a) Samsung (b) LG (c) Sony

8/3/2019 FINAL Television Industry
http://slidepdf.com/reader/full/final-television-industry 43/44
(d) Videocon (e) Any other
Q10. What attracts you more?
(a) Free gifts (b) Discount factor (c) Exchange offer

8/3/2019 FINAL Television Industry
http://slidepdf.com/reader/full/final-television-industry 44/44
Recommended