1
I. FOREST STATUS
1.1 Ecoregion of Indonesia
Geographically Indonesia archipelago situated in two difference ecoregions,
Indo-Malay and Australasia ecoregion which is separated by invisible line. The
line/border created by the existence of a deep-sea shelf that cuts between Bali
and Lombok, and Borneo and Sulawesi. It was Alfred Russel Wallace who
published the finding on Zoological Geography of the Malay Archipelago in 1859.
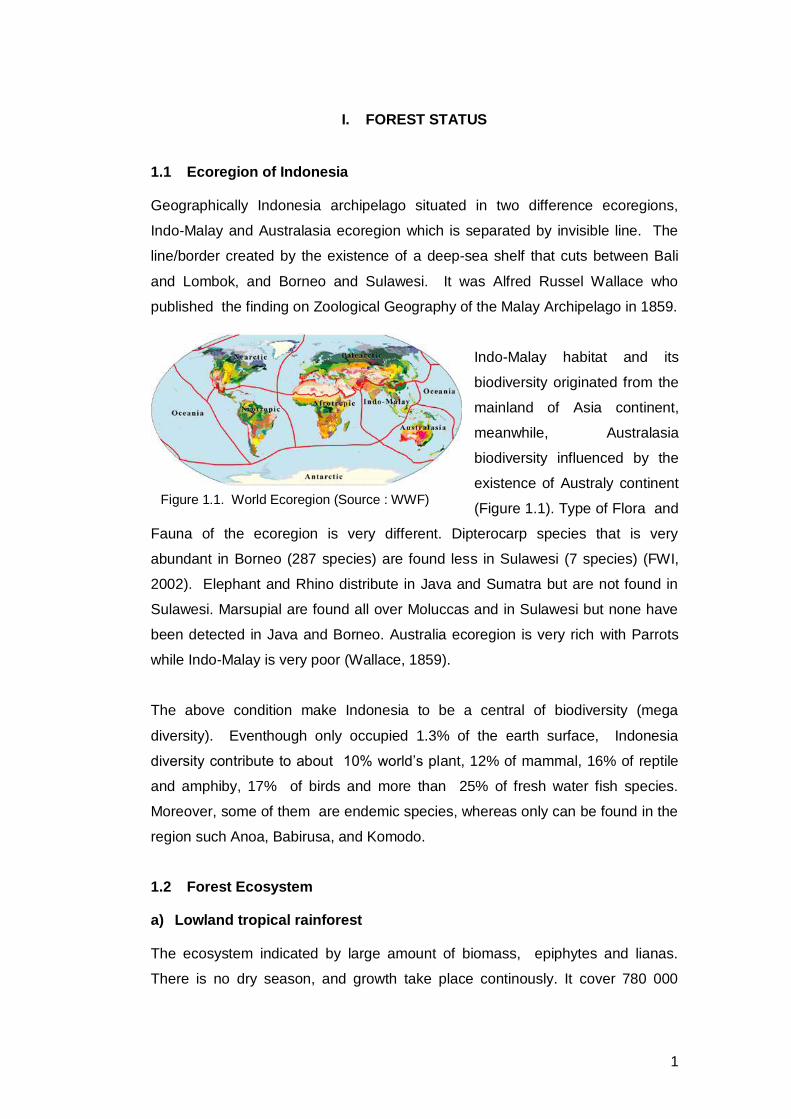
Indo-Malay habitat and its
biodiversity originated from the
mainland of Asia continent,
meanwhile, Australasia
biodiversity influenced by the
existence of Australy continent
(Figure 1.1). Type of Flora and
Fauna of the ecoregion is very different. Dipterocarp species that is very
abundant in Borneo (287 species) are found less in Sulawesi (7 species) (FWI,
2002). Elephant and Rhino distribute in Java and Sumatra but are not found in
Sulawesi. Marsupial are found all over Moluccas and in Sulawesi but none have
been detected in Java and Borneo. Australia ecoregion is very rich with Parrots
while Indo-Malay is very poor (Wallace, 1859).
The above condition make Indonesia to be a central of biodiversity (mega
diversity). Eventhough only occupied 1.3% of the earth surface, Indonesia
diversity contribute to about 10% world’s plant, 12% of mammal, 16% of reptile
and amphiby, 17% of birds and more than 25% of fresh water fish species.
Moreover, some of them are endemic species, whereas only can be found in the
region such Anoa, Babirusa, and Komodo.
1.2 Forest Ecosystem
a) Lowland tropical rainforest
The ecosystem indicated by large amount of biomass, epiphytes and lianas.
There is no dry season, and growth take place continously. It cover 780 000
Figure 1.1. World Ecoregion (Source : WWF)
2
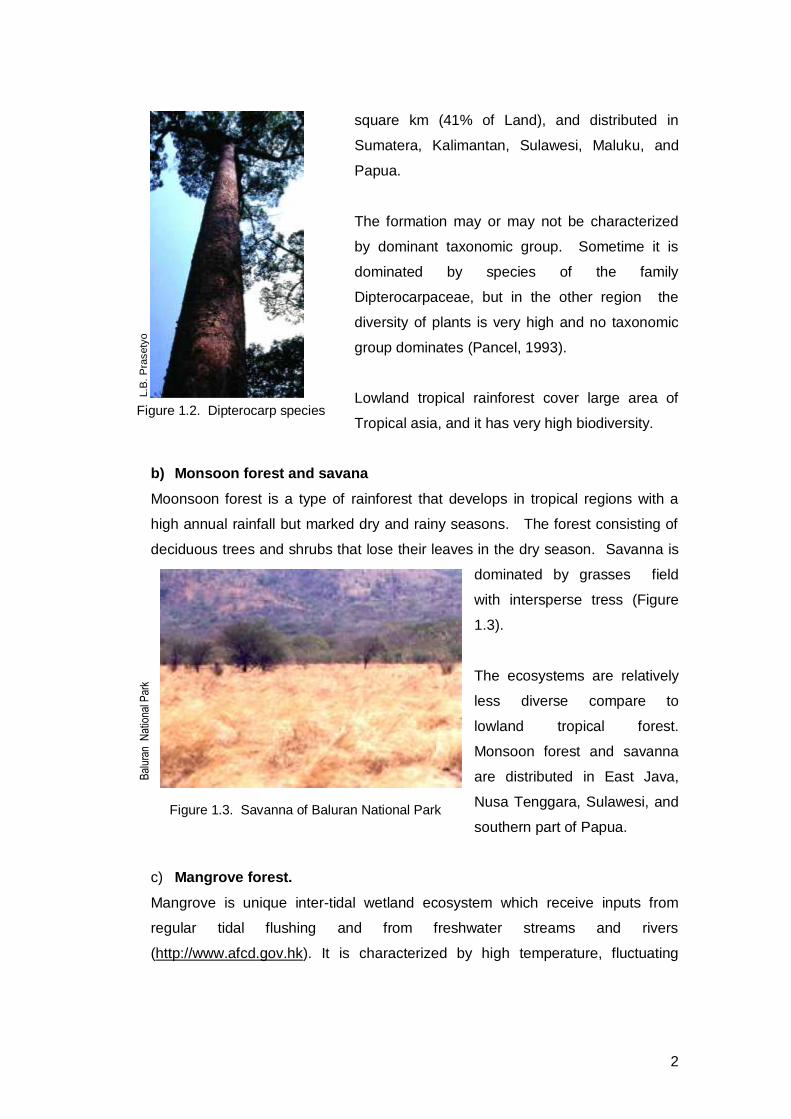
square km (41% of Land), and distributed in
Sumatera, Kalimantan, Sulawesi, Maluku, and
Papua.
The formation may or may not be characterized
by dominant taxonomic group. Sometime it is
dominated by species of the family
Dipterocarpaceae, but in the other region the
diversity of plants is very high and no taxonomic
group dominates (Pancel, 1993).
Lowland tropical rainforest cover large area of
Tropical asia, and it has very high biodiversity.
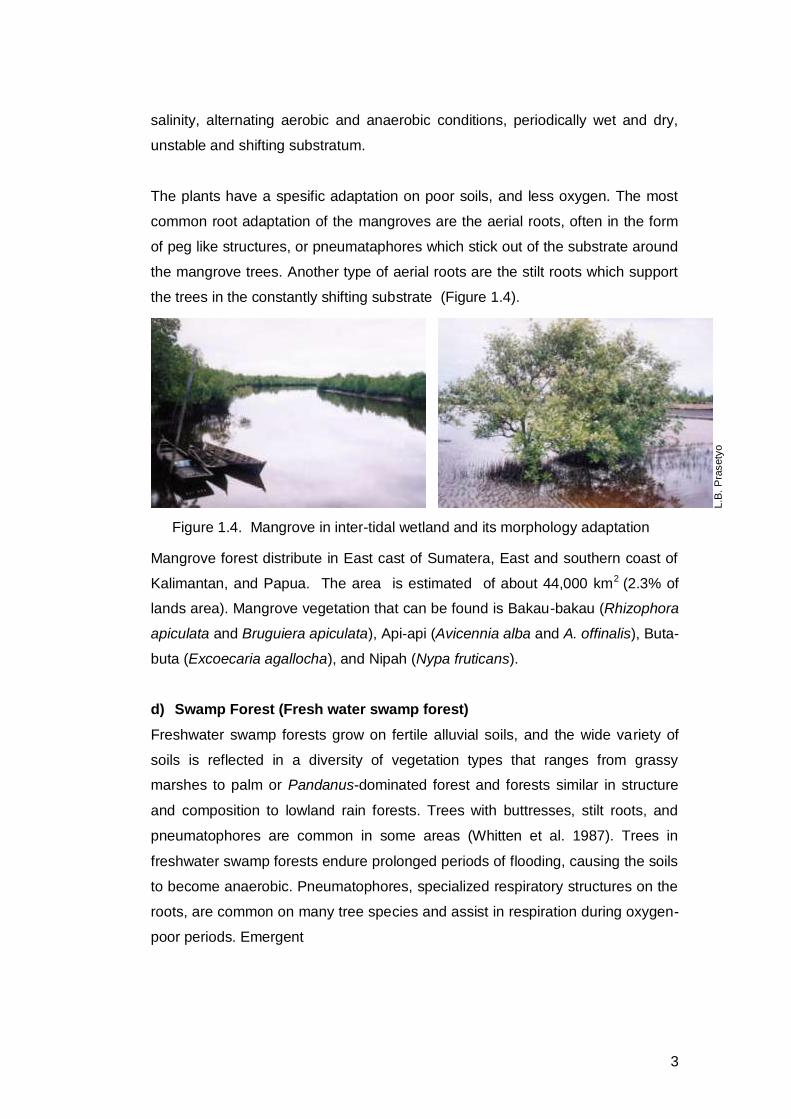
b) Monsoon forest and savana
Moonsoon forest is a type of rainforest that develops in tropical regions with a
high annual rainfall but marked dry and rainy seasons. The forest consisting of
deciduous trees and shrubs that lose their leaves in the dry season. Savanna is
dominated by grasses field
with intersperse tress (Figure
1.3).
The ecosystems are relatively
less diverse compare to
lowland tropical forest.
Monsoon forest and savanna
are distributed in East Java,
Nusa Tenggara, Sulawesi, and
southern part of Papua.
c) Mangrove forest.
Mangrove is unique inter-tidal wetland ecosystem which receive inputs from
regular tidal flushing and from freshwater streams and rivers
(http://www.afcd.gov.hk). It is characterized by high temperature, fluctuating
Figure 1.2. Dipterocarp species
L.B
. P
rasety
o
Figure 1.3. Savanna of Baluran National Park
Bal
uran
Nat
iona
l Par
k
3
salinity, alternating aerobic and anaerobic conditions, periodically wet and dry,
unstable and shifting substratum.
The plants have a spesific adaptation on poor soils, and less oxygen. The most
common root adaptation of the mangroves are the aerial roots, often in the form
of peg like structures, or pneumataphores which stick out of the substrate around
the mangrove trees. Another type of aerial roots are the stilt roots which support
the trees in the constantly shifting substrate (Figure 1.4).
Mangrove forest distribute in East cast of Sumatera, East and southern coast of
Kalimantan, and Papua. The area is estimated of about 44,000 km2 (2.3% of
lands area). Mangrove vegetation that can be found is Bakau-bakau (Rhizophora
apiculata and Bruguiera apiculata), Api-api (Avicennia alba and A. offinalis), Buta-
buta (Excoecaria agallocha), and Nipah (Nypa fruticans).
d) Swamp Forest (Fresh water swamp forest)
Freshwater swamp forests grow on fertile alluvial soils, and the wide variety of
soils is reflected in a diversity of vegetation types that ranges from grassy
marshes to palm or Pandanus-dominated forest and forests similar in structure
and composition to lowland rain forests. Trees with buttresses, stilt roots, and
pneumatophores are common in some areas (Whitten et al. 1987). Trees in
freshwater swamp forests endure prolonged periods of flooding, causing the soils
to become anaerobic. Pneumatophores, specialized respiratory structures on the
roots, are common on many tree species and assist in respiration during oxygen-
poor periods. Emergent
L.B
. P
rasety
o
Figure 1.4. Mangrove in inter-tidal wetland and its morphology adaptation
4
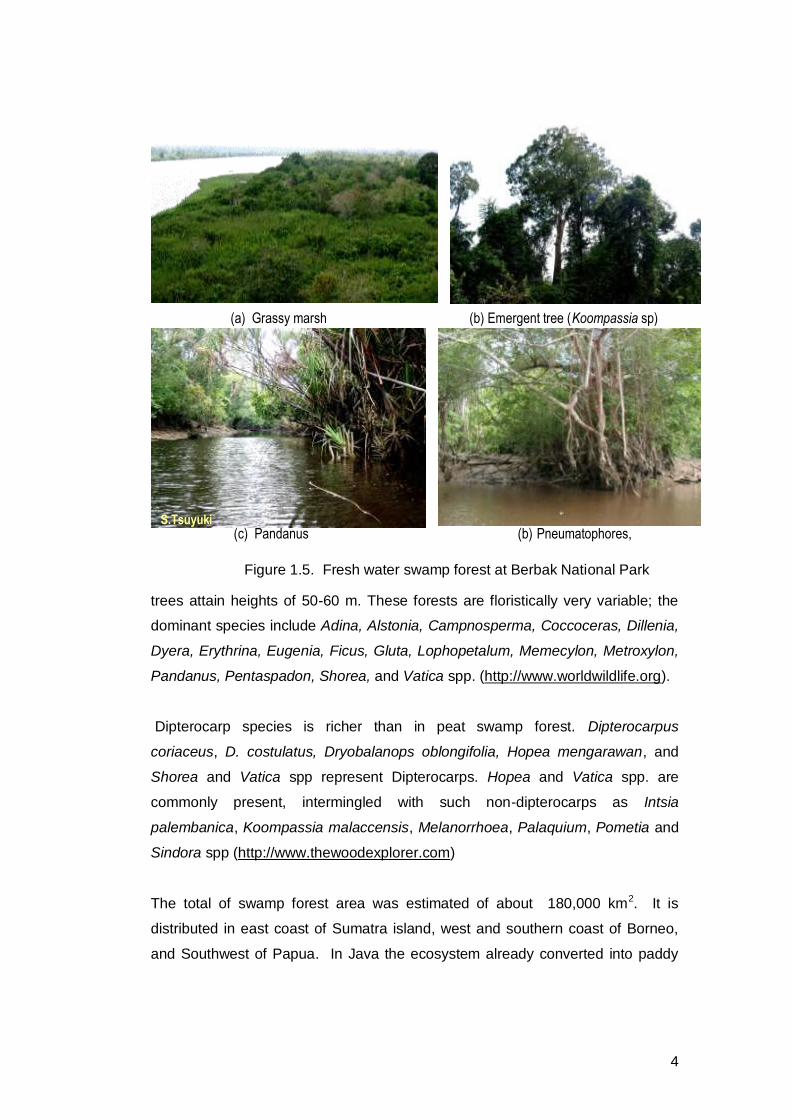
trees attain heights of 50-60 m. These forests are floristically very variable; the
dominant species include Adina, Alstonia, Campnosperma, Coccoceras, Dillenia,
Dyera, Erythrina, Eugenia, Ficus, Gluta, Lophopetalum, Memecylon, Metroxylon,
Pandanus, Pentaspadon, Shorea, and Vatica spp. (http://www.worldwildlife.org).
Dipterocarp species is richer than in peat swamp forest. Dipterocarpus
coriaceus, D. costulatus, Dryobalanops oblongifolia, Hopea mengarawan, and
Shorea and Vatica spp represent Dipterocarps. Hopea and Vatica spp. are
commonly present, intermingled with such non-dipterocarps as Intsia
palembanica, Koompassia malaccensis, Melanorrhoea, Palaquium, Pometia and
Sindora spp (http://www.thewoodexplorer.com)
The total of swamp forest area was estimated of about 180,000 km2. It is
distributed in east coast of Sumatra island, west and southern coast of Borneo,
and Southwest of Papua. In Java the ecosystem already converted into paddy
S.T
suyu
ki
(a) Grassy marsh (b) Emergent tree (Koompassia sp)
(c) Pandanus (b) Pneumatophores,
Figure 1.5. Fresh water swamp forest at Berbak National Park
S.Tsuyuki
5
field, due to its fertility and accesible. It only remain in Rawa Danau Protected
forest, Banten.
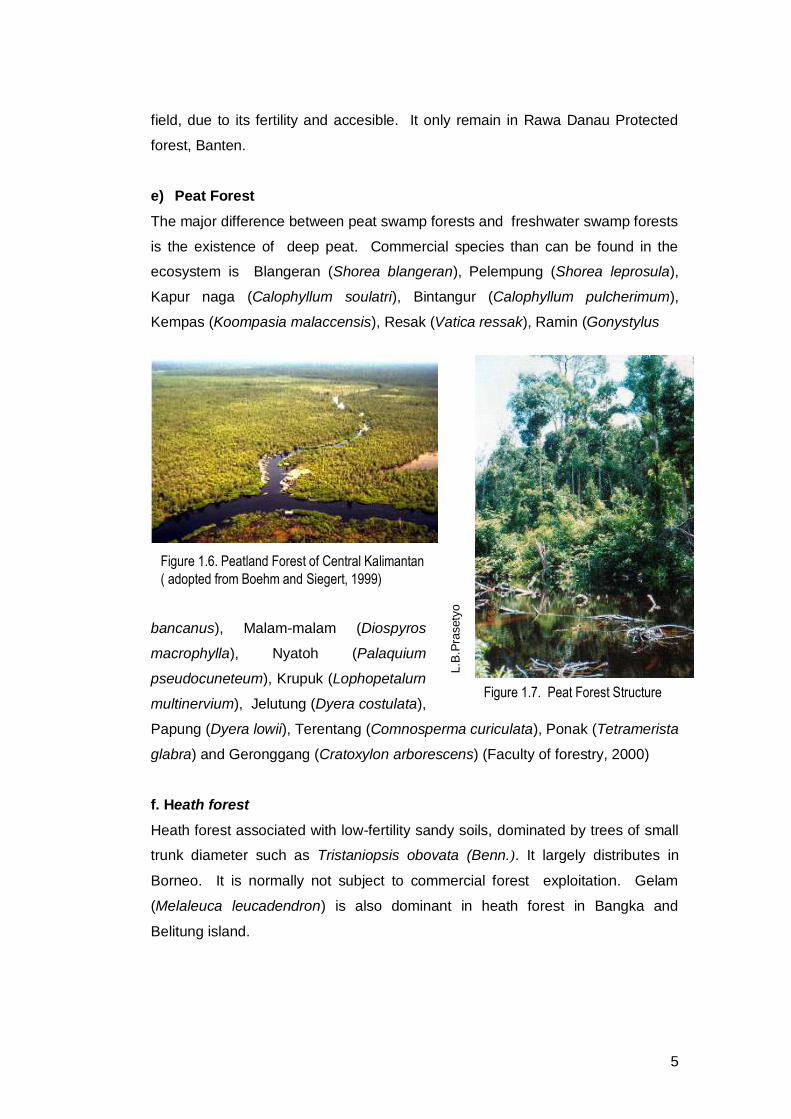
e) Peat Forest
The major difference between peat swamp forests and freshwater swamp forests
is the existence of deep peat. Commercial species than can be found in the
ecosystem is Blangeran (Shorea blangeran), Pelempung (Shorea leprosula),
Kapur naga (Calophyllum soulatri), Bintangur (Calophyllum pulcherimum),
Kempas (Koompasia malaccensis), Resak (Vatica ressak), Ramin (Gonystylus
bancanus), Malam-malam (Diospyros
macrophylla), Nyatoh (Palaquium
pseudocuneteum), Krupuk (Lophopetalurn
multinervium), Jelutung (Dyera costulata),
Papung (Dyera lowii), Terentang (Comnosperma curiculata), Ponak (Tetramerista
glabra) and Geronggang (Cratoxylon arborescens) (Faculty of forestry, 2000)
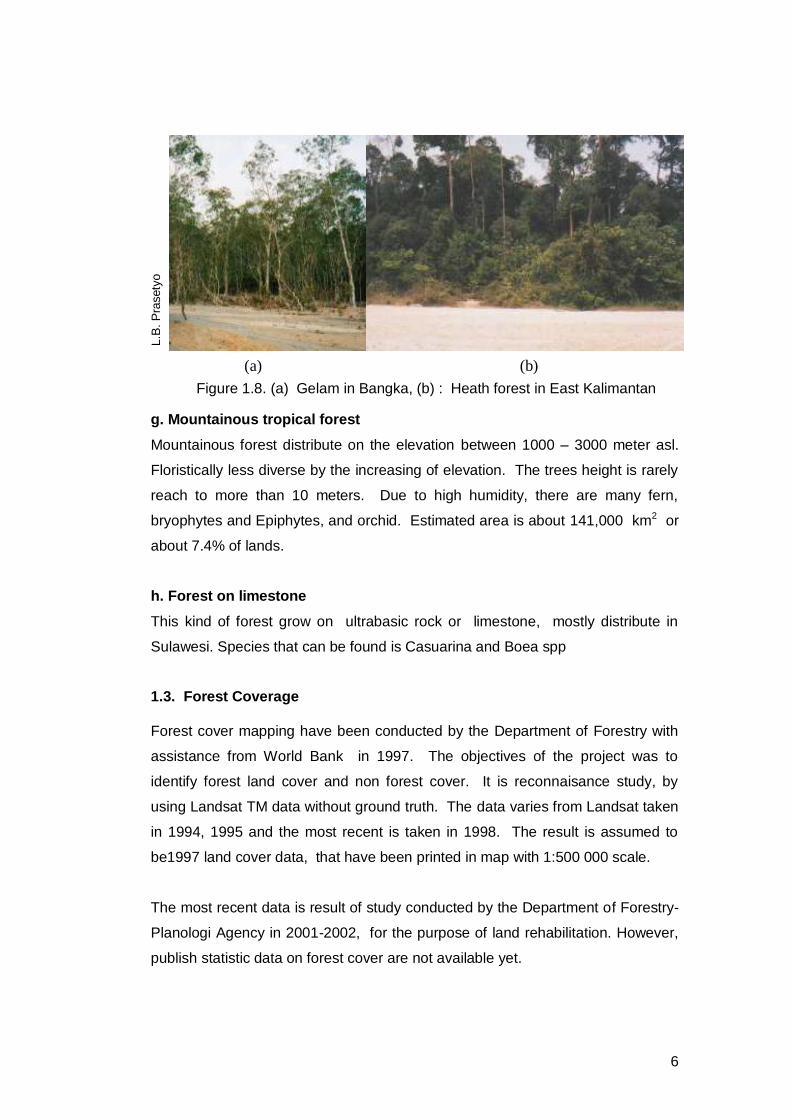
f. Heath forest
Heath forest associated with low-fertility sandy soils, dominated by trees of small
trunk diameter such as Tristaniopsis obovata (Benn.). It largely distributes in
Borneo. It is normally not subject to commercial forest exploitation. Gelam
(Melaleuca leucadendron) is also dominant in heath forest in Bangka and
Belitung island.
Figure 1.6. Peatland Forest of Central Kalimantan
( adopted from Boehm and Siegert, 1999)
Figure 1.7. Peat Forest Structure
L.B
.Pra
sety
o
6
g. Mountainous tropical forest
Mountainous forest distribute on the elevation between 1000 – 3000 meter asl.
Floristically less diverse by the increasing of elevation. The trees height is rarely
reach to more than 10 meters. Due to high humidity, there are many fern,
bryophytes and Epiphytes, and orchid. Estimated area is about 141,000 km2 or
about 7.4% of lands.
h. Forest on limestone
This kind of forest grow on ultrabasic rock or limestone, mostly distribute in
Sulawesi. Species that can be found is Casuarina and Boea spp
1.3. Forest Coverage
Forest cover mapping have been conducted by the Department of Forestry with
assistance from World Bank in 1997. The objectives of the project was to
identify forest land cover and non forest cover. It is reconnaisance study, by
using Landsat TM data without ground truth. The data varies from Landsat taken
in 1994, 1995 and the most recent is taken in 1998. The result is assumed to
be1997 land cover data, that have been printed in map with 1:500 000 scale.
The most recent data is result of study conducted by the Department of Forestry-
Planologi Agency in 2001-2002, for the purpose of land rehabilitation. However,
publish statistic data on forest cover are not available yet.
(a) (b)
L.B
. P
rasety
o
Figure 1.8. (a) Gelam in Bangka, (b) : Heath forest in East Kalimantan
7
Based on 1997 data, Forest still occupied 54.25% of land, in which Irian-Maluku
are having largest forest cover (87.2%), followed by Kalimantan (55.88 %) ,
Sulawesi (43.81%) and Bali and Nusa Tenggara (Table 1.1 and Table Appendix
1)
Table 1.1. Forest and non forest area in 1997
No.
Land cover
Province Forest Non Forest Others
Ha % Ha % Ha %
1 Sumatera 16.632.143 35,34 28.328.360 60,20 2.098.912 4,46
2 Kalimantan 29.616.787 55,88 20.255.656 38,22 3.131.561 5,91
3 Sulawesi 8.089.157 43,81 7.721.250 41,82 2.651.945 14,36
4
Bali & Nusa Tenggara 2.149.003 29,37 5.166.845 70,63 10 0,00
5 Maluku & Irian 42.440.296 87,22 6.021.331 12,37 195.897 0,40
6 Jawa 2.916.100 22,01 10.293.200 77,70 38.301 0,29
Total 101.843.486 54,25 77.786.642 41,43 8.116.626 4,32
Source : Forestry Planning Agency
(a) Forest Cover of Sumatra
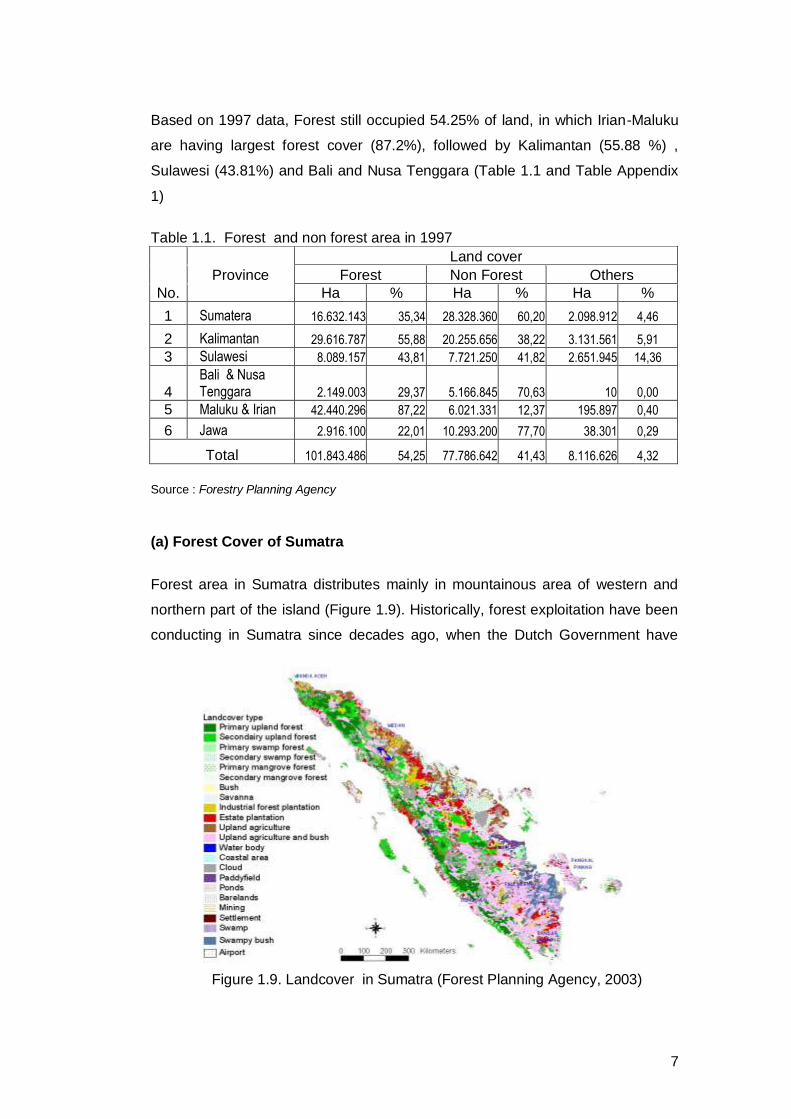
Forest area in Sumatra distributes mainly in mountainous area of western and
northern part of the island (Figure 1.9). Historically, forest exploitation have been
conducting in Sumatra since decades ago, when the Dutch Government have
Figure 1.9. Landcover in Sumatra (Forest Planning Agency, 2003)
8
introduced cash crops plantation such as rubber, coffeea and oilpalm in the form
of Government Estatate Plantation. After proving the success, the local people
have adopted the technique to plant the cashcrops and adapt to their cultivation
system. As a result, these cash crops have been spreading to the whole lowland
Sumatra islands, especially lowland of east coast area.
Lowland area of Sumatra island also have been subject to the forest concession,
forest plantation and transmigration, since early 1970s. Some transmigration
area in South Sumatra and Lampung were developed before 1960s
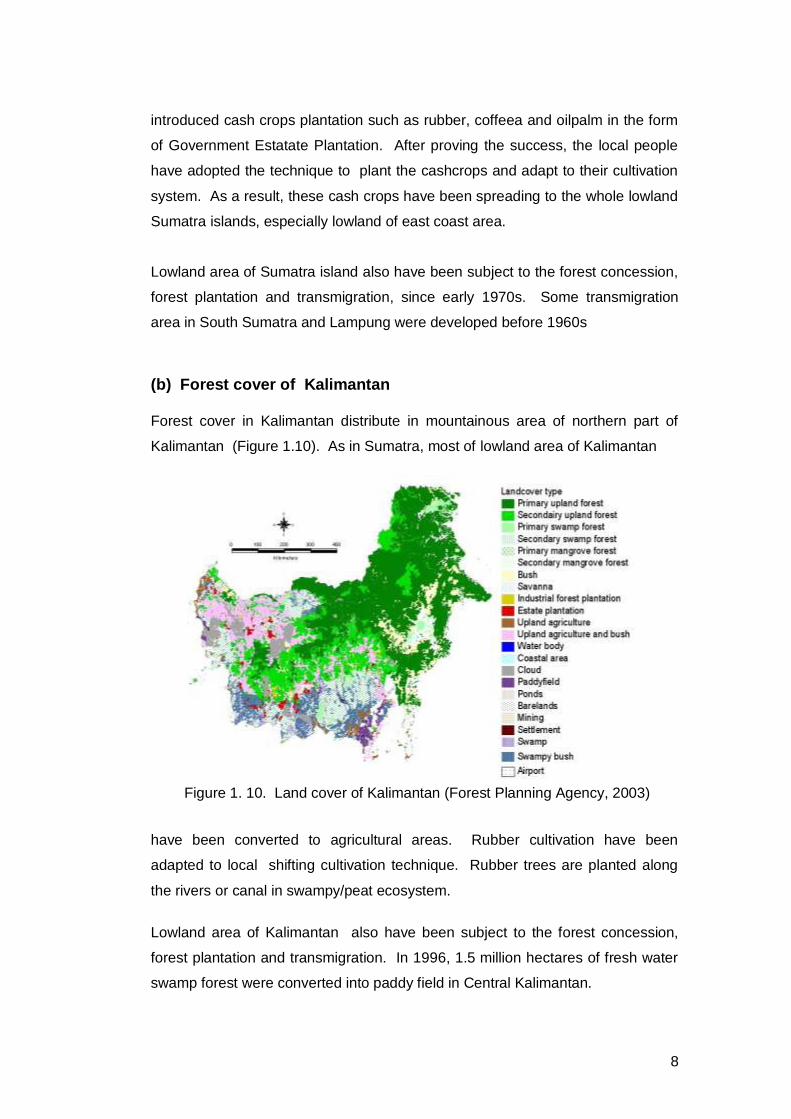
(b) Forest cover of Kalimantan Forest cover in Kalimantan distribute in mountainous area of northern part of
Kalimantan (Figure 1.10). As in Sumatra, most of lowland area of Kalimantan
have been converted to agricultural areas. Rubber cultivation have been
adapted to local shifting cultivation technique. Rubber trees are planted along
the rivers or canal in swampy/peat ecosystem.
Lowland area of Kalimantan also have been subject to the forest concession,
forest plantation and transmigration. In 1996, 1.5 million hectares of fresh water
swamp forest were converted into paddy field in Central Kalimantan.
Figure 1. 10. Land cover of Kalimantan (Forest Planning Agency, 2003)
9
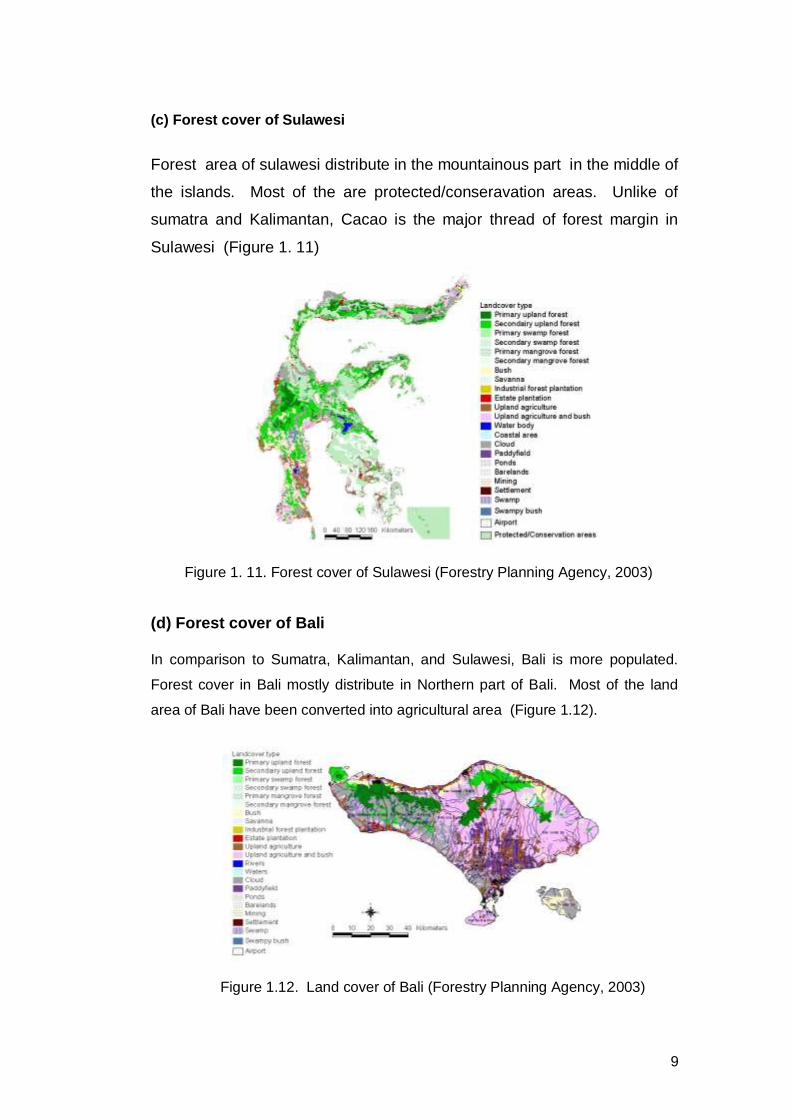
(c) Forest cover of Sulawesi
Forest area of sulawesi distribute in the mountainous part in the middle of
the islands. Most of the are protected/conseravation areas. Unlike of
sumatra and Kalimantan, Cacao is the major thread of forest margin in
Sulawesi (Figure 1. 11)
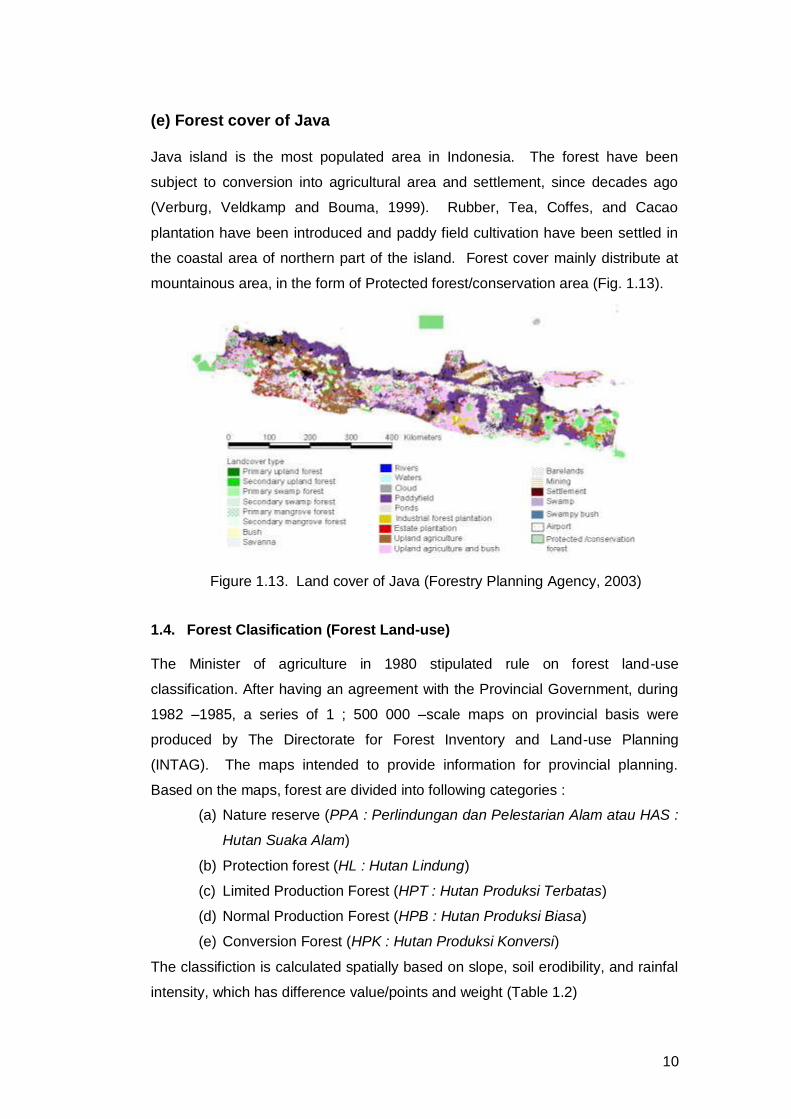
(d) Forest cover of Bali In comparison to Sumatra, Kalimantan, and Sulawesi, Bali is more populated.
Forest cover in Bali mostly distribute in Northern part of Bali. Most of the land
area of Bali have been converted into agricultural area (Figure 1.12).
Figure 1. 11. Forest cover of Sulawesi (Forestry Planning Agency, 2003)
Figure 1.12. Land cover of Bali (Forestry Planning Agency, 2003)
10
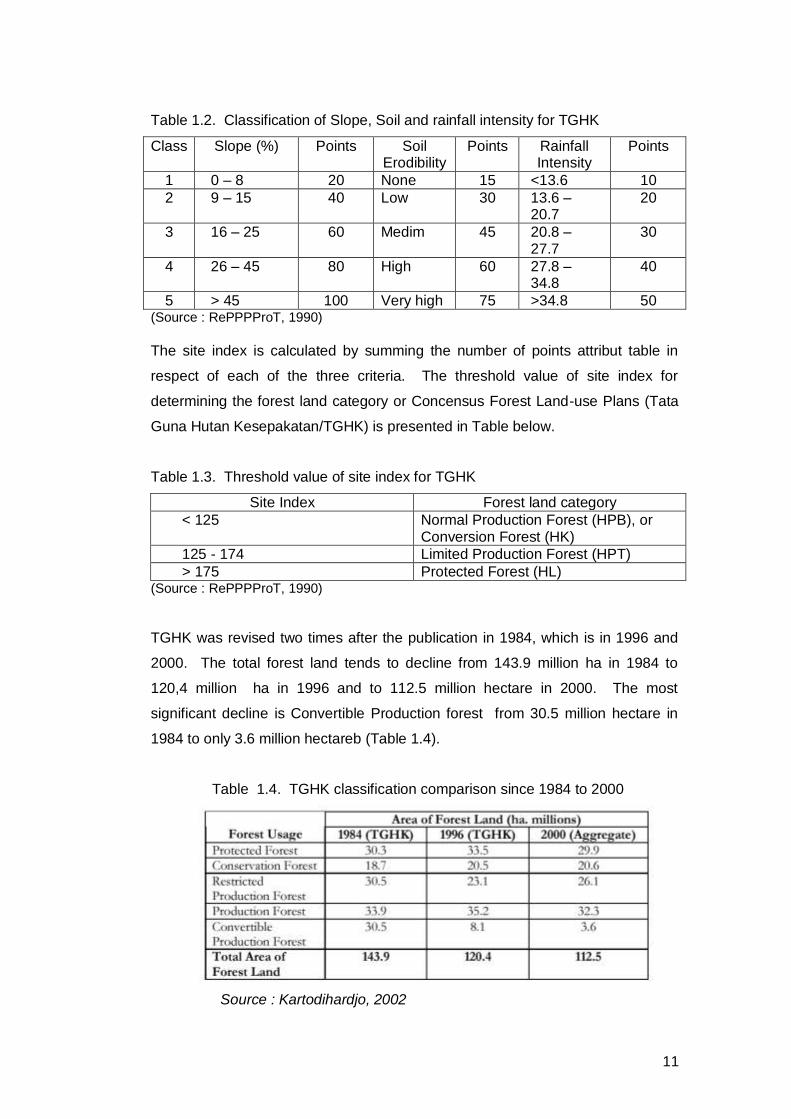
(e) Forest cover of Java Java island is the most populated area in Indonesia. The forest have been
subject to conversion into agricultural area and settlement, since decades ago
(Verburg, Veldkamp and Bouma, 1999). Rubber, Tea, Coffes, and Cacao
plantation have been introduced and paddy field cultivation have been settled in
the coastal area of northern part of the island. Forest cover mainly distribute at
mountainous area, in the form of Protected forest/conservation area (Fig. 1.13).
1.4. Forest Clasification (Forest Land-use)
The Minister of agriculture in 1980 stipulated rule on forest land-use
classification. After having an agreement with the Provincial Government, during
1982 –1985, a series of 1 ; 500 000 –scale maps on provincial basis were
produced by The Directorate for Forest Inventory and Land-use Planning
(INTAG). The maps intended to provide information for provincial planning.
Based on the maps, forest are divided into following categories :
(a) Nature reserve (PPA : Perlindungan dan Pelestarian Alam atau HAS :
Hutan Suaka Alam)
(b) Protection forest (HL : Hutan Lindung)
(c) Limited Production Forest (HPT : Hutan Produksi Terbatas)
(d) Normal Production Forest (HPB : Hutan Produksi Biasa)
(e) Conversion Forest (HPK : Hutan Produksi Konversi)
The classifiction is calculated spatially based on slope, soil erodibility, and rainfal
intensity, which has difference value/points and weight (Table 1.2)
Figure 1.13. Land cover of Java (Forestry Planning Agency, 2003)
11
Table 1.2. Classification of Slope, Soil and rainfall intensity for TGHK
Class Slope (%) Points Soil Erodibility
Points Rainfall Intensity
Points
1 0 – 8 20 None 15 <13.6 10
2 9 – 15 40 Low 30 13.6 – 20.7
20
3 16 – 25 60 Medim 45 20.8 – 27.7
30
4 26 – 45 80 High 60 27.8 – 34.8
40
5 > 45 100 Very high 75 >34.8 50 (Source : RePPPProT, 1990)
The site index is calculated by summing the number of points attribut table in
respect of each of the three criteria. The threshold value of site index for
determining the forest land category or Concensus Forest Land-use Plans (Tata
Guna Hutan Kesepakatan/TGHK) is presented in Table below.
Table 1.3. Threshold value of site index for TGHK
Site Index Forest land category
< 125 Normal Production Forest (HPB), or Conversion Forest (HK)
125 - 174 Limited Production Forest (HPT)
> 175 Protected Forest (HL) (Source : RePPPProT, 1990)
TGHK was revised two times after the publication in 1984, which is in 1996 and
2000. The total forest land tends to decline from 143.9 million ha in 1984 to
120,4 million ha in 1996 and to 112.5 million hectare in 2000. The most
significant decline is Convertible Production forest from 30.5 million hectare in
1984 to only 3.6 million hectareb (Table 1.4).
Table 1.4. TGHK classification comparison since 1984 to 2000
Source : Kartodihardjo, 2002
12
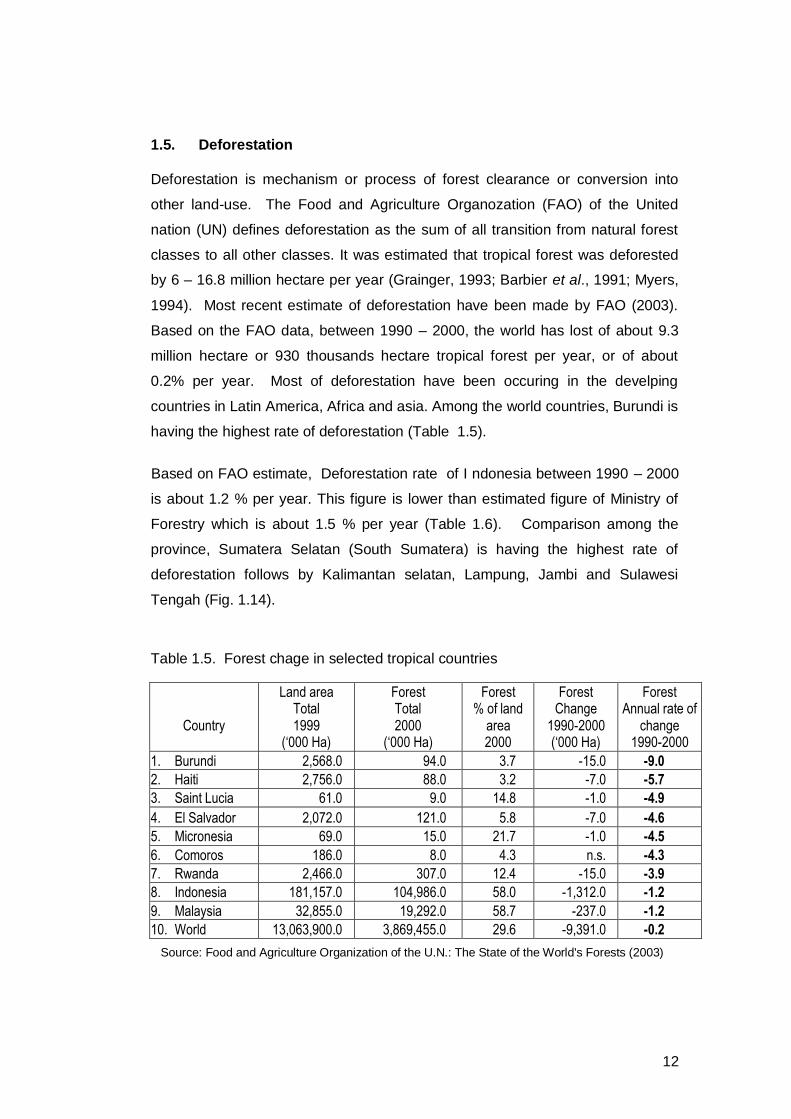
1.5. Deforestation
Deforestation is mechanism or process of forest clearance or conversion into
other land-use. The Food and Agriculture Organozation (FAO) of the United
nation (UN) defines deforestation as the sum of all transition from natural forest
classes to all other classes. It was estimated that tropical forest was deforested
by 6 – 16.8 million hectare per year (Grainger, 1993; Barbier et al., 1991; Myers,
1994). Most recent estimate of deforestation have been made by FAO (2003).
Based on the FAO data, between 1990 – 2000, the world has lost of about 9.3
million hectare or 930 thousands hectare tropical forest per year, or of about
0.2% per year. Most of deforestation have been occuring in the develping
countries in Latin America, Africa and asia. Among the world countries, Burundi is
having the highest rate of deforestation (Table 1.5).
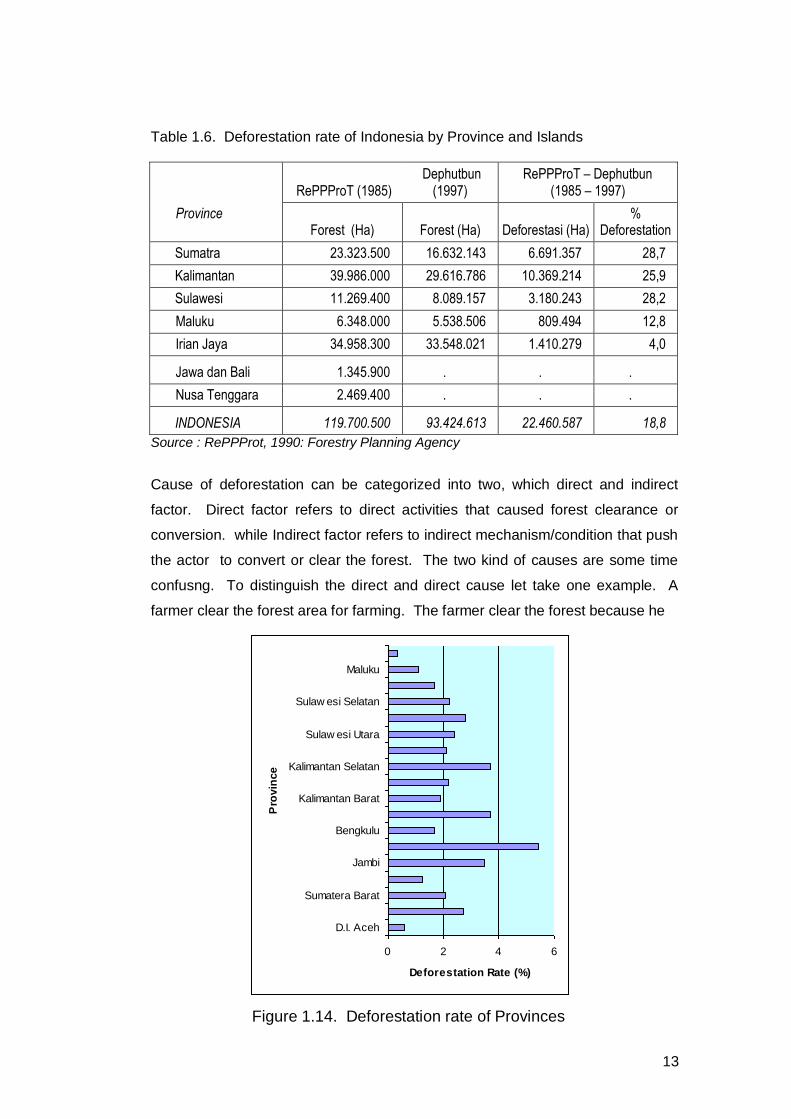
Based on FAO estimate, Deforestation rate of I ndonesia between 1990 – 2000
is about 1.2 % per year. This figure is lower than estimated figure of Ministry of
Forestry which is about 1.5 % per year (Table 1.6). Comparison among the
province, Sumatera Selatan (South Sumatera) is having the highest rate of
deforestation follows by Kalimantan selatan, Lampung, Jambi and Sulawesi
Tengah (Fig. 1.14).
Table 1.5. Forest chage in selected tropical countries
Country
Land area Total 1999
(‘000 Ha)
Forest Total 2000
(‘000 Ha)
Forest % of land
area 2000
Forest Change
1990-2000 (‘000 Ha)
Forest Annual rate of
change 1990-2000
1. Burundi 2,568.0 94.0 3.7 -15.0 -9.0
2. Haiti 2,756.0 88.0 3.2 -7.0 -5.7
3. Saint Lucia 61.0 9.0 14.8 -1.0 -4.9
4. El Salvador 2,072.0 121.0 5.8 -7.0 -4.6
5. Micronesia 69.0 15.0 21.7 -1.0 -4.5
6. Comoros 186.0 8.0 4.3 n.s. -4.3
7. Rwanda 2,466.0 307.0 12.4 -15.0 -3.9
8. Indonesia 181,157.0 104,986.0 58.0 -1,312.0 -1.2
9. Malaysia 32,855.0 19,292.0 58.7 -237.0 -1.2
10. World 13,063,900.0 3,869,455.0 29.6 -9,391.0 -0.2
Source: Food and Agriculture Organization of the U.N.: The State of the World's Forests (2003)
13
Table 1.6. Deforestation rate of Indonesia by Province and Islands
Province
RePPProT (1985) Dephutbun
(1997) RePPProT – Dephutbun
(1985 – 1997)
Forest (Ha) Forest (Ha) Deforestasi (Ha) %
Deforestation
Sumatra 23.323.500 16.632.143 6.691.357 28,7
Kalimantan 39.986.000 29.616.786 10.369.214 25,9
Sulawesi 11.269.400 8.089.157 3.180.243 28,2
Maluku 6.348.000 5.538.506 809.494 12,8
Irian Jaya 34.958.300 33.548.021 1.410.279 4,0
Jawa dan Bali 1.345.900 . . .
Nusa Tenggara 2.469.400 . . .
INDONESIA 119.700.500 93.424.613 22.460.587 18,8
Source : RePPProt, 1990: Forestry Planning Agency
Cause of deforestation can be categorized into two, which direct and indirect
factor. Direct factor refers to direct activities that caused forest clearance or
conversion. while Indirect factor refers to indirect mechanism/condition that push
the actor to convert or clear the forest. The two kind of causes are some time
confusng. To distinguish the direct and direct cause let take one example. A
farmer clear the forest area for farming. The farmer clear the forest because he
Figure 1.14. Deforestation rate of Provinces
0 2 4 6
D.I. Aceh
Sumatera Barat
Jambi
Bengkulu
Kalimantan Barat
Kalimantan Selatan
Sulaw esi Utara
Sulaw esi Selatan
Maluku
Pro
vin
ce
Deforestation Rate (%)
14
does not have a agricultural land. He does not have a land since he does not
have a money to buy a piece of land. Thus, in this theoritical example, there is a
causation chain that starts with poverty, finaly forest conversion. In this case
conversion of forest for agricultural land is direct cause, farmer as an agent and
poverty is indirect causes.
(a) Agent and Direct cause of deforestation
(1) Forest Pioneer – Shifting Cultivation
Forest pioneers are defined as people who may utilize slashing and burning of
the existing vegetation but with primry attention of establishing permanent or
semi- permanent agricultural production. Forest pioneer also planted subsistence
foodcrops and cash crops. The land is not fallowed but is used continously untill
the fertility have declined, and they do not have a plan to return to the same site
(Sunderlin and Resosudarmo, 1996). These kind of activities is sometime
confusing with the shifting cultivation. Under shifting cultivation system, after
one – two years foodcrops cultivation, the land will be let in a fallow period untill
the fertility and vegetation recoverd again. Under low population density, shifting
cultivation may not cause deforestation, however, RePPProT (1990) stated that
shifting cultivation has large role on deforestation. They found that in Sumatra,
Kalimantan and Irian there are 14 million ha, 11 million ha and 2 million ha of
shiftind cultivation practice, respectively.
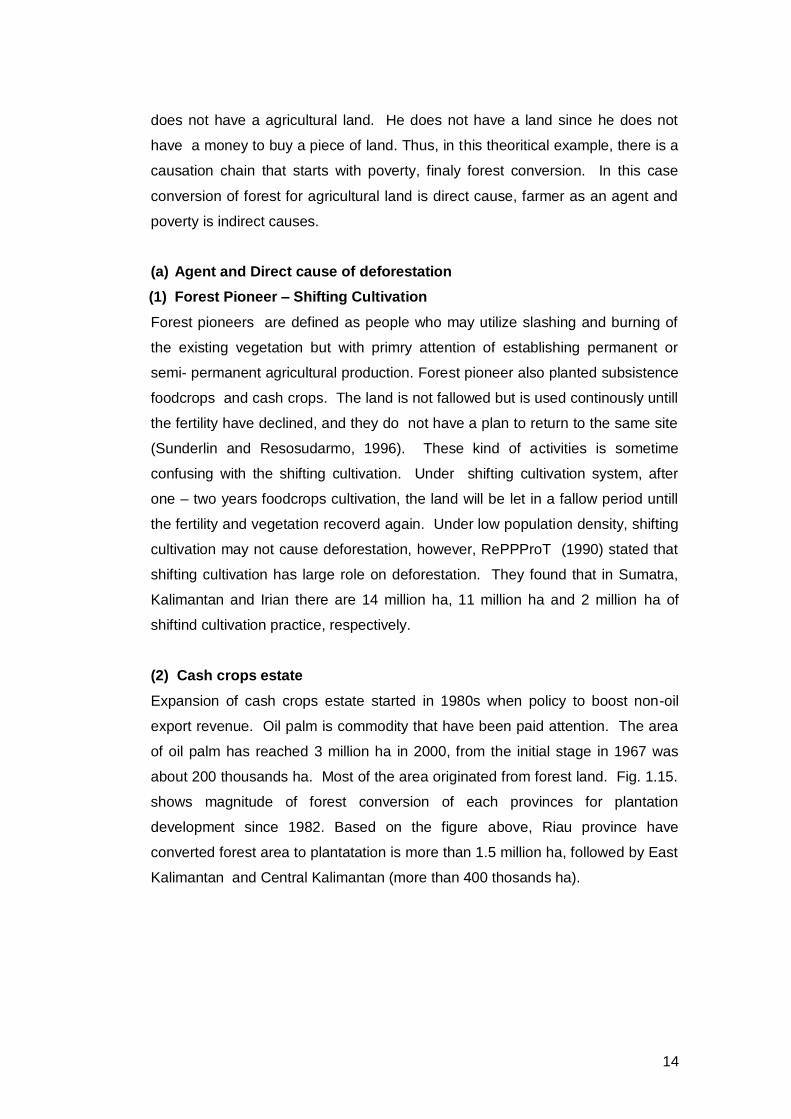
(2) Cash crops estate
Expansion of cash crops estate started in 1980s when policy to boost non-oil
export revenue. Oil palm is commodity that have been paid attention. The area
of oil palm has reached 3 million ha in 2000, from the initial stage in 1967 was
about 200 thousands ha. Most of the area originated from forest land. Fig. 1.15.
shows magnitude of forest conversion of each provinces for plantation
development since 1982. Based on the figure above, Riau province have
converted forest area to plantatation is more than 1.5 million ha, followed by East
Kalimantan and Central Kalimantan (more than 400 thosands ha).
15
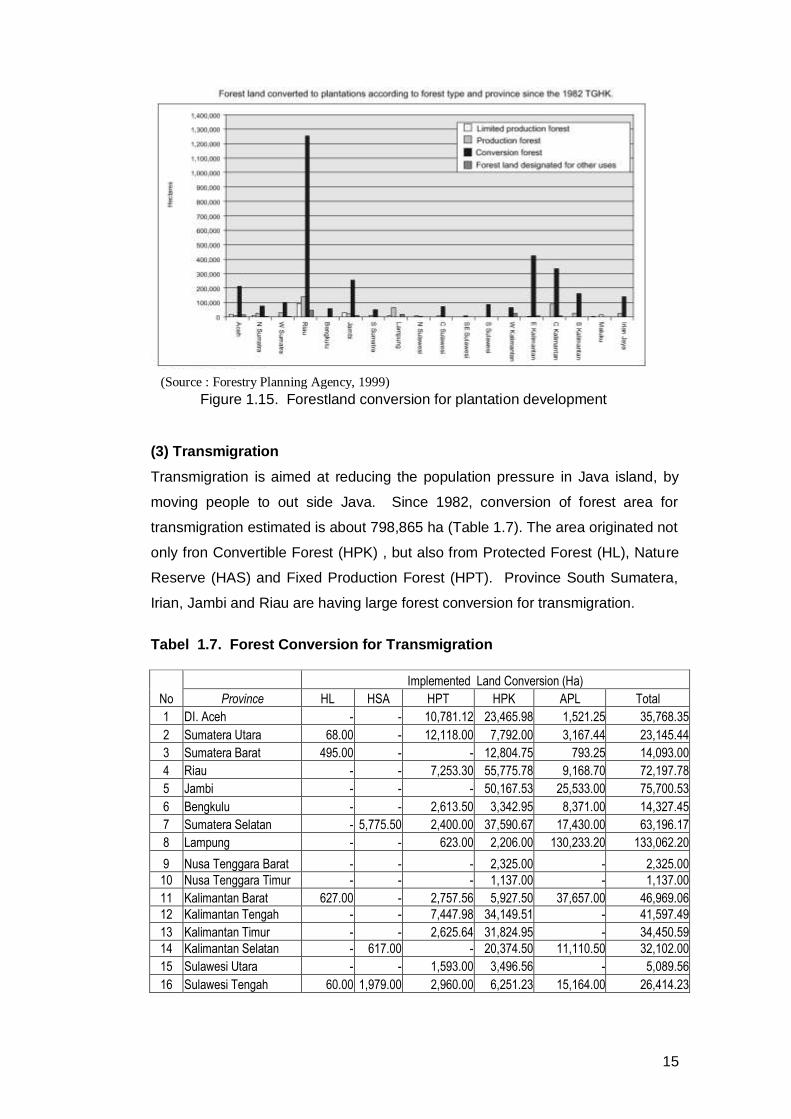
(3) Transmigration
Transmigration is aimed at reducing the population pressure in Java island, by
moving people to out side Java. Since 1982, conversion of forest area for
transmigration estimated is about 798,865 ha (Table 1.7). The area originated not
only fron Convertible Forest (HPK) , but also from Protected Forest (HL), Nature
Reserve (HAS) and Fixed Production Forest (HPT). Province South Sumatera,
Irian, Jambi and Riau are having large forest conversion for transmigration.
Tabel 1.7. Forest Conversion for Transmigration
No
Implemented Land Conversion (Ha)
Province HL HSA HPT HPK APL Total
1 DI. Aceh - - 10,781.12 23,465.98 1,521.25 35,768.35
2 Sumatera Utara 68.00 - 12,118.00 7,792.00 3,167.44 23,145.44
3 Sumatera Barat 495.00 - - 12,804.75 793.25 14,093.00
4 Riau - - 7,253.30 55,775.78 9,168.70 72,197.78
5 Jambi - - - 50,167.53 25,533.00 75,700.53
6 Bengkulu - - 2,613.50 3,342.95 8,371.00 14,327.45
7 Sumatera Selatan - 5,775.50 2,400.00 37,590.67 17,430.00 63,196.17
8 Lampung - - 623.00 2,206.00 130,233.20 133,062.20
9 Nusa Tenggara Barat - - - 2,325.00 - 2,325.00
10 Nusa Tenggara Timur - - - 1,137.00 - 1,137.00
11 Kalimantan Barat 627.00 - 2,757.56 5,927.50 37,657.00 46,969.06
12 Kalimantan Tengah - - 7,447.98 34,149.51 - 41,597.49
13 Kalimantan Timur - - 2,625.64 31,824.95 - 34,450.59
14 Kalimantan Selatan - 617.00 - 20,374.50 11,110.50 32,102.00
15 Sulawesi Utara - - 1,593.00 3,496.56 - 5,089.56
16 Sulawesi Tengah 60.00 1,979.00 2,960.00 6,251.23 15,164.00 26,414.23
Figure 1.15. Forestland conversion for plantation development
(Source : Forestry Planning Agency, 1999)
16
No
Implemented Land Conversion (Ha)
Province HL HSA HPT HPK APL Total
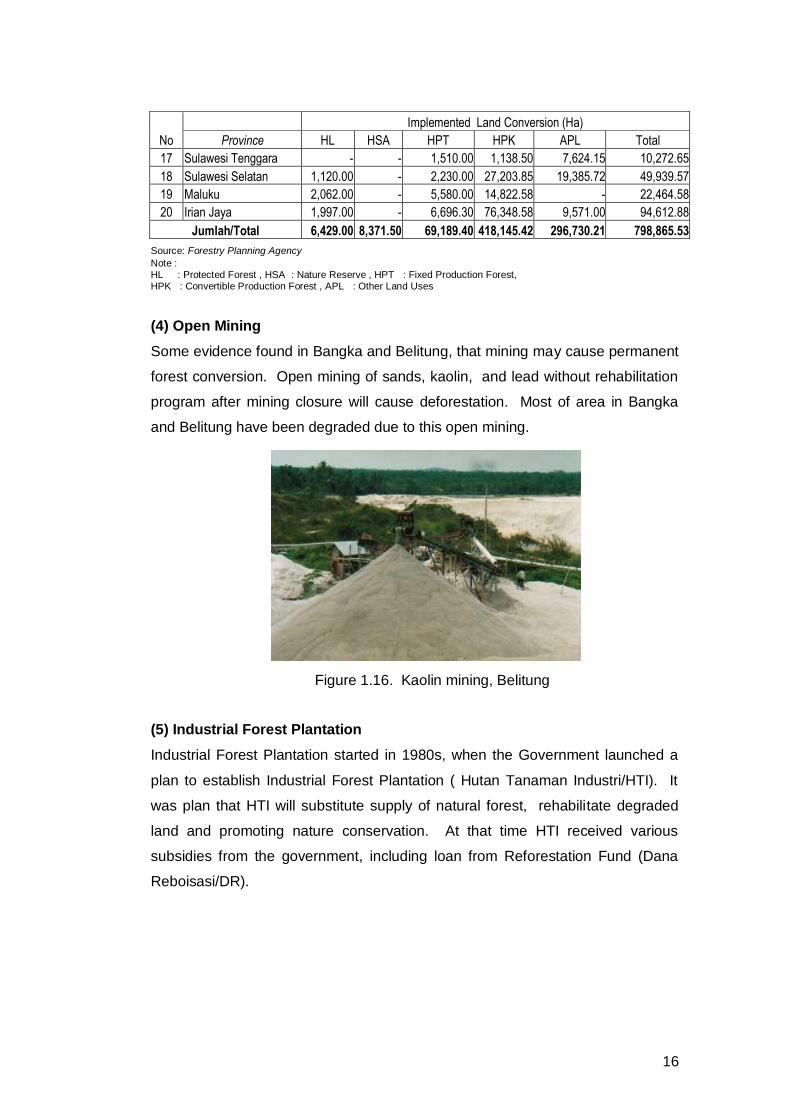
17 Sulawesi Tenggara - - 1,510.00 1,138.50 7,624.15 10,272.65
18 Sulawesi Selatan 1,120.00 - 2,230.00 27,203.85 19,385.72 49,939.57
19 Maluku 2,062.00 - 5,580.00 14,822.58 - 22,464.58
20 Irian Jaya 1,997.00 - 6,696.30 76,348.58 9,571.00 94,612.88
Jumlah/Total 6,429.00 8,371.50 69,189.40 418,145.42 296,730.21 798,865.53
Source: Forestry Planning Agency
Note : HL : Protected Forest , HSA : Nature Reserve , HPT : Fixed Production Forest, HPK : Convertible Production Forest , APL : Other Land Uses
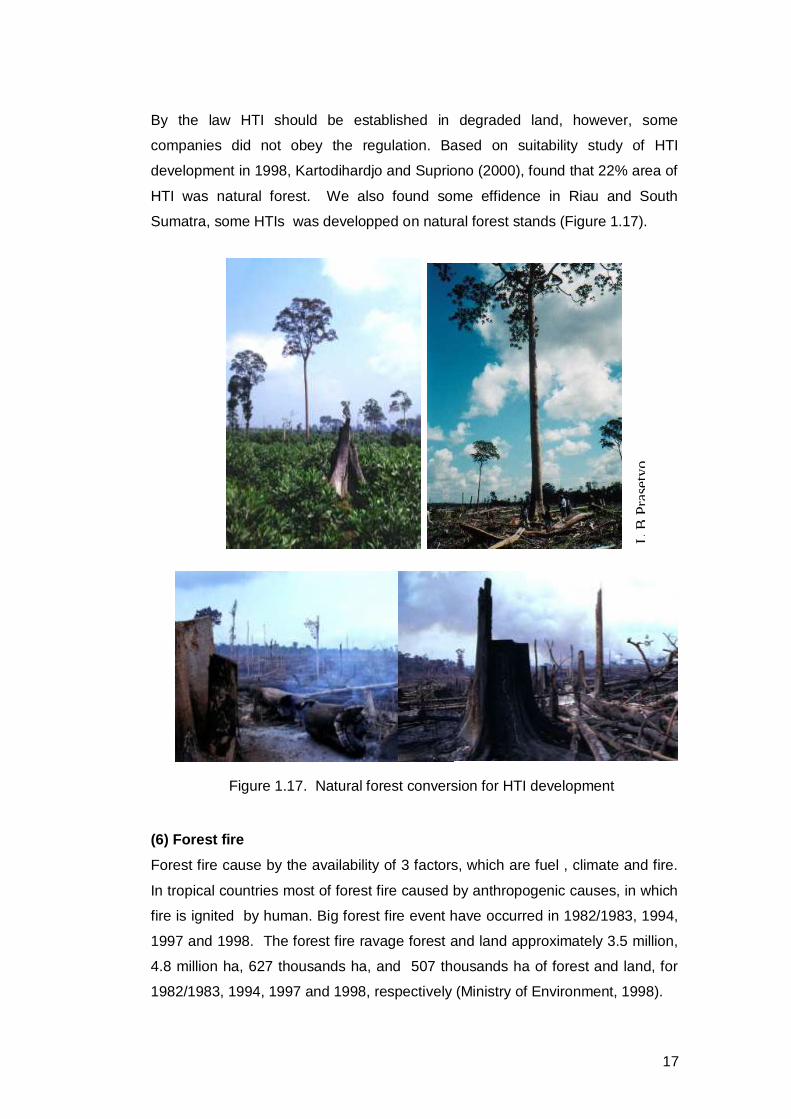
(4) Open Mining
Some evidence found in Bangka and Belitung, that mining may cause permanent
forest conversion. Open mining of sands, kaolin, and lead without rehabilitation
program after mining closure will cause deforestation. Most of area in Bangka
and Belitung have been degraded due to this open mining.
(5) Industrial Forest Plantation
Industrial Forest Plantation started in 1980s, when the Government launched a
plan to establish Industrial Forest Plantation ( Hutan Tanaman Industri/HTI). It
was plan that HTI will substitute supply of natural forest, rehabilitate degraded
land and promoting nature conservation. At that time HTI received various
subsidies from the government, including loan from Reforestation Fund (Dana
Reboisasi/DR).
Figure 1.16. Kaolin mining, Belitung
17
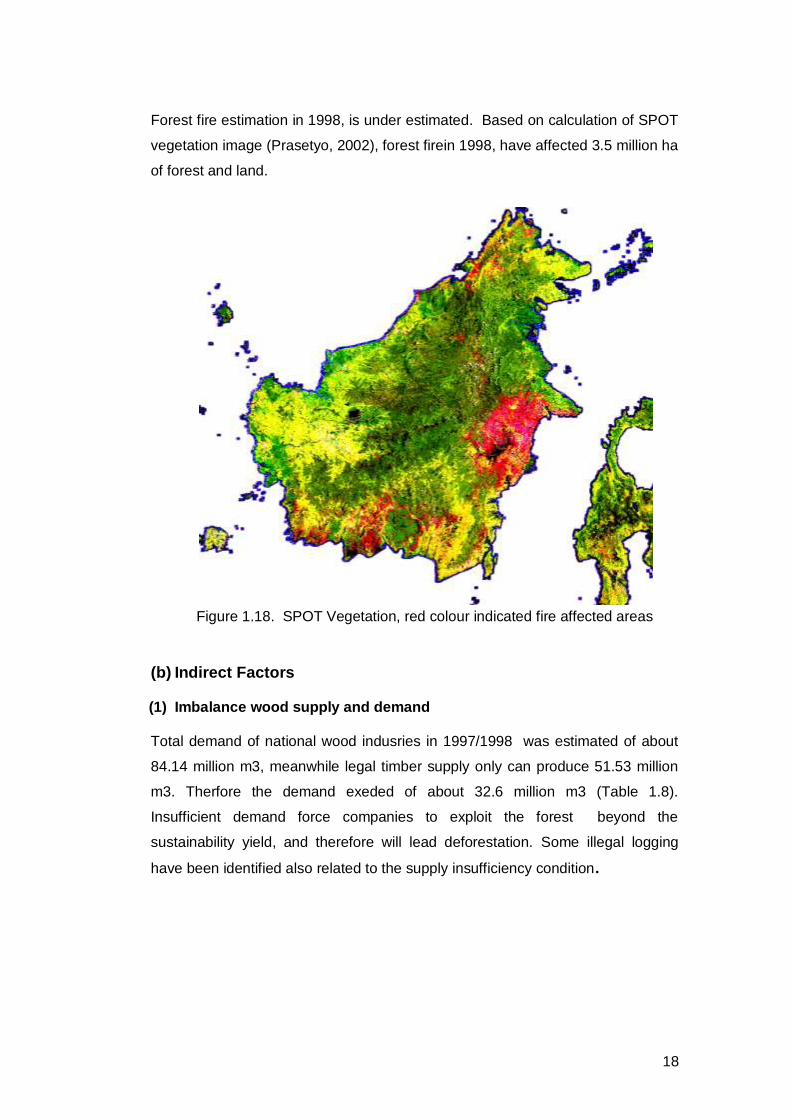
By the law HTI should be established in degraded land, however, some
companies did not obey the regulation. Based on suitability study of HTI
development in 1998, Kartodihardjo and Supriono (2000), found that 22% area of
HTI was natural forest. We also found some effidence in Riau and South
Sumatra, some HTIs was developped on natural forest stands (Figure 1.17).
(6) Forest fire
Forest fire cause by the availability of 3 factors, which are fuel , climate and fire.
In tropical countries most of forest fire caused by anthropogenic causes, in which
fire is ignited by human. Big forest fire event have occurred in 1982/1983, 1994,
1997 and 1998. The forest fire ravage forest and land approximately 3.5 million,
4.8 million ha, 627 thousands ha, and 507 thousands ha of forest and land, for
1982/1983, 1994, 1997 and 1998, respectively (Ministry of Environment, 1998).
Figure 1.17. Natural forest conversion for HTI development
L.B
.Pra
sety
o
18
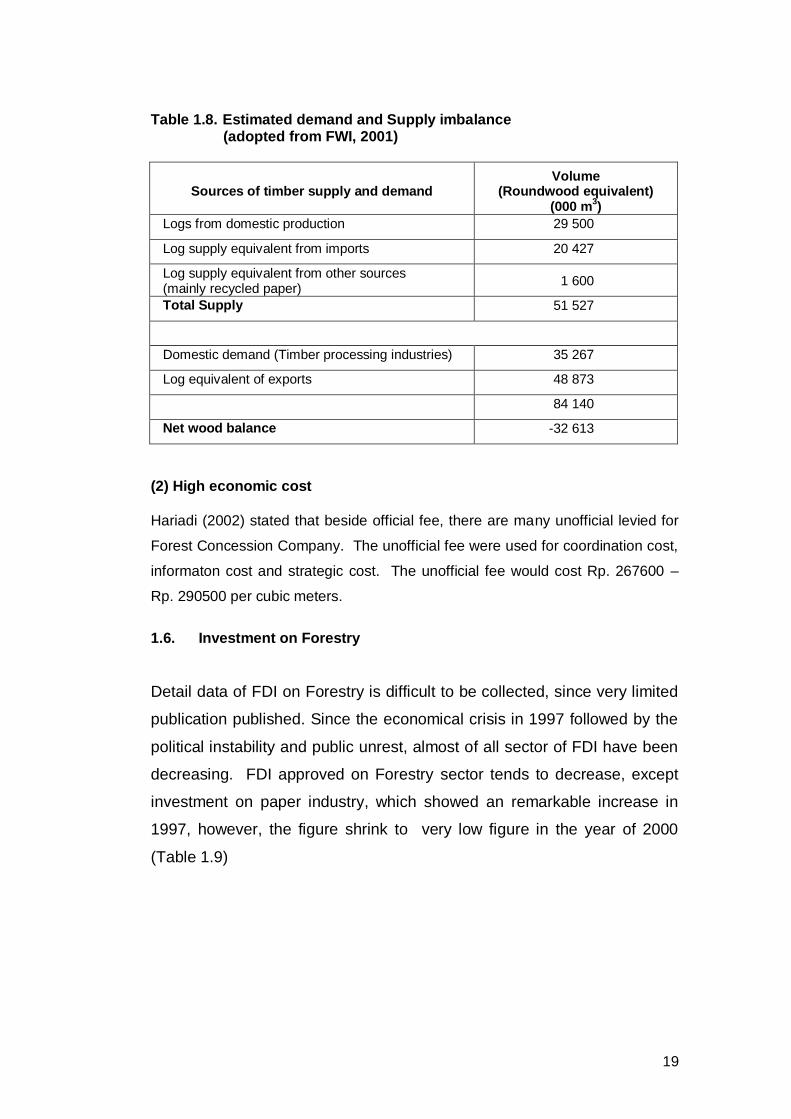
Forest fire estimation in 1998, is under estimated. Based on calculation of SPOT
vegetation image (Prasetyo, 2002), forest firein 1998, have affected 3.5 million ha
of forest and land.
(b) Indirect Factors (1) Imbalance wood supply and demand
Total demand of national wood indusries in 1997/1998 was estimated of about
84.14 million m3, meanwhile legal timber supply only can produce 51.53 million
m3. Therfore the demand exeded of about 32.6 million m3 (Table 1.8).
Insufficient demand force companies to exploit the forest beyond the
sustainability yield, and therefore will lead deforestation. Some illegal logging
have been identified also related to the supply insufficiency condition.
Figure 1.18. SPOT Vegetation, red colour indicated fire affected areas
19
Table 1.8. Estimated demand and Supply imbalance (adopted from FWI, 2001)
Sources of timber supply and demand
Volume (Roundwood equivalent)
(000 m3)
Logs from domestic production 29 500
Log supply equivalent from imports 20 427
Log supply equivalent from other sources (mainly recycled paper)
1 600
Total Supply 51 527
Domestic demand (Timber processing industries) 35 267
Log equivalent of exports 48 873
84 140
Net wood balance -32 613
(2) High economic cost
Hariadi (2002) stated that beside official fee, there are many unofficial levied for
Forest Concession Company. The unofficial fee were used for coordination cost,
informaton cost and strategic cost. The unofficial fee would cost Rp. 267600 –
Rp. 290500 per cubic meters.
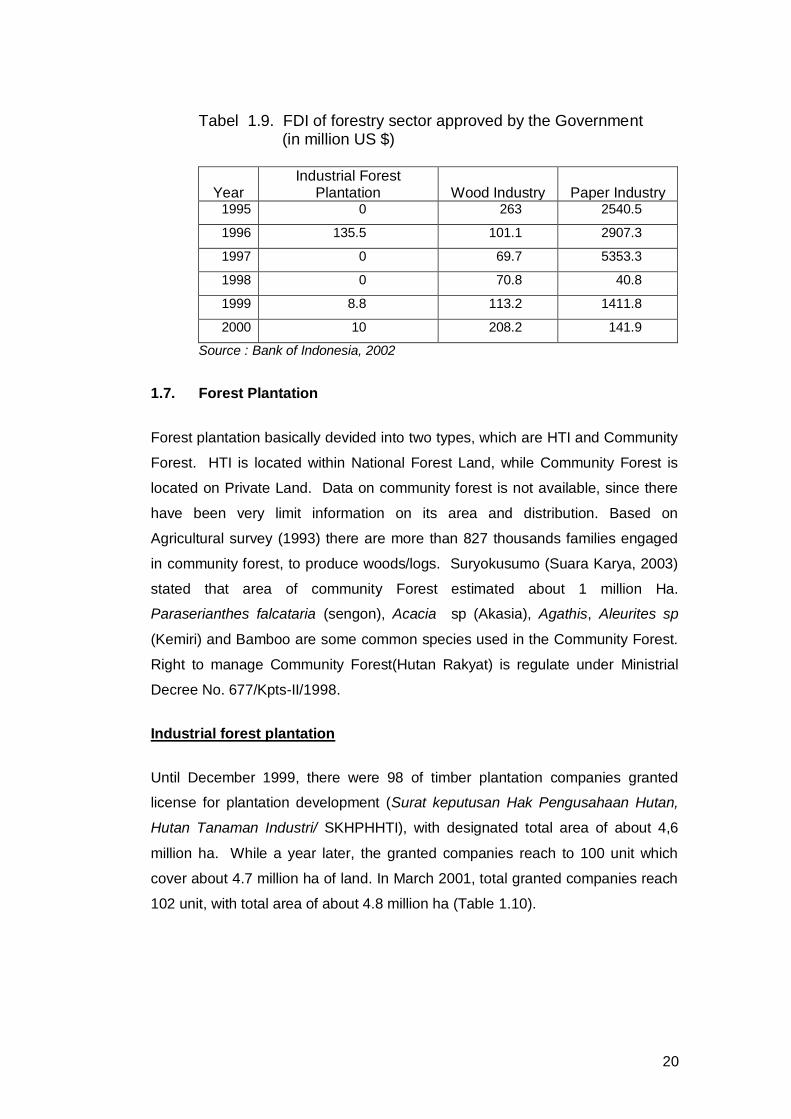
1.6. Investment on Forestry
Detail data of FDI on Forestry is difficult to be collected, since very limited
publication published. Since the economical crisis in 1997 followed by the
political instability and public unrest, almost of all sector of FDI have been
decreasing. FDI approved on Forestry sector tends to decrease, except
investment on paper industry, which showed an remarkable increase in
1997, however, the figure shrink to very low figure in the year of 2000
(Table 1.9)
20
Tabel 1.9. FDI of forestry sector approved by the Government (in million US $)
Year Industrial Forest
Plantation Wood Industry Paper Industry 1995 0 263 2540.5
1996 135.5 101.1 2907.3
1997 0 69.7 5353.3
1998 0 70.8 40.8
1999 8.8 113.2 1411.8
2000 10 208.2 141.9
Source : Bank of Indonesia, 2002
1.7. Forest Plantation
Forest plantation basically devided into two types, which are HTI and Community
Forest. HTI is located within National Forest Land, while Community Forest is
located on Private Land. Data on community forest is not available, since there
have been very limit information on its area and distribution. Based on
Agricultural survey (1993) there are more than 827 thousands families engaged
in community forest, to produce woods/logs. Suryokusumo (Suara Karya, 2003)
stated that area of community Forest estimated about 1 million Ha.
Paraserianthes falcataria (sengon), Acacia sp (Akasia), Agathis, Aleurites sp
(Kemiri) and Bamboo are some common species used in the Community Forest.
Right to manage Community Forest(Hutan Rakyat) is regulate under Ministrial
Decree No. 677/Kpts-II/1998.
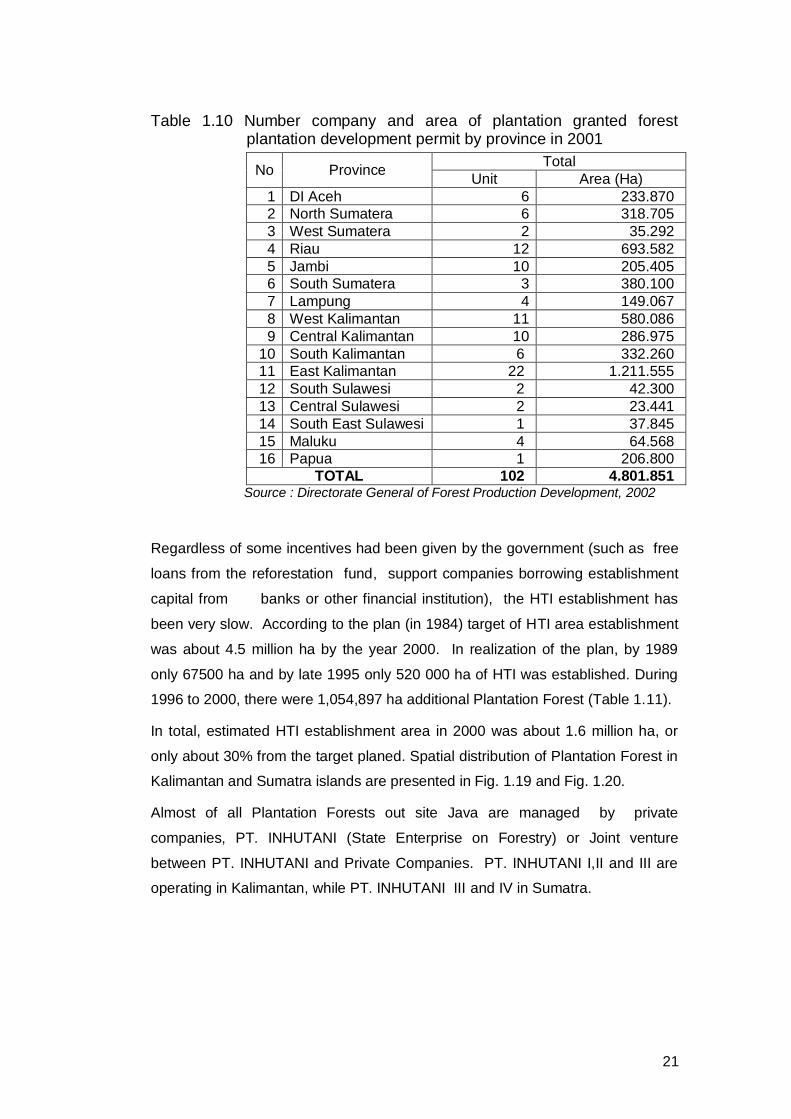
Industrial forest plantation
Until December 1999, there were 98 of timber plantation companies granted
license for plantation development (Surat keputusan Hak Pengusahaan Hutan,
Hutan Tanaman Industri/ SKHPHHTI), with designated total area of about 4,6
million ha. While a year later, the granted companies reach to 100 unit which
cover about 4.7 million ha of land. In March 2001, total granted companies reach
102 unit, with total area of about 4.8 million ha (Table 1.10).
21
Table 1.10 Number company and area of plantation granted forest plantation development permit by province in 2001
No Province Total
Unit Area (Ha)
1 DI Aceh 6 233.870
2 North Sumatera 6 318.705
3 West Sumatera 2 35.292
4 Riau 12 693.582
5 Jambi 10 205.405
6 South Sumatera 3 380.100
7 Lampung 4 149.067
8 West Kalimantan 11 580.086
9 Central Kalimantan 10 286.975
10 South Kalimantan 6 332.260
11 East Kalimantan 22 1.211.555
12 South Sulawesi 2 42.300
13 Central Sulawesi 2 23.441
14 South East Sulawesi 1 37.845
15 Maluku 4 64.568
16 Papua 1 206.800
TOTAL 102 4.801.851 Source : Directorate General of Forest Production Development, 2002
Regardless of some incentives had been given by the government (such as free
loans from the reforestation fund, support companies borrowing establishment
capital from banks or other financial institution), the HTI establishment has
been very slow. According to the plan (in 1984) target of HTI area establishment
was about 4.5 million ha by the year 2000. In realization of the plan, by 1989
only 67500 ha and by late 1995 only 520 000 ha of HTI was established. During
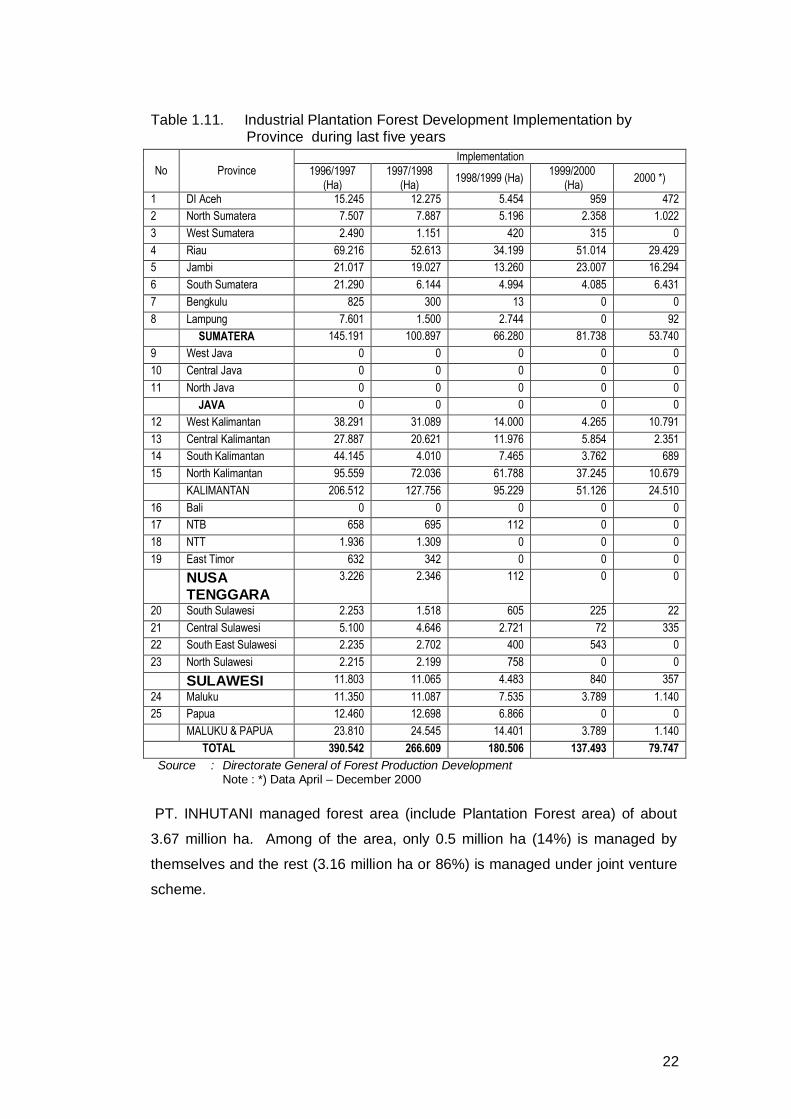
1996 to 2000, there were 1,054,897 ha additional Plantation Forest (Table 1.11).
In total, estimated HTI establishment area in 2000 was about 1.6 million ha, or
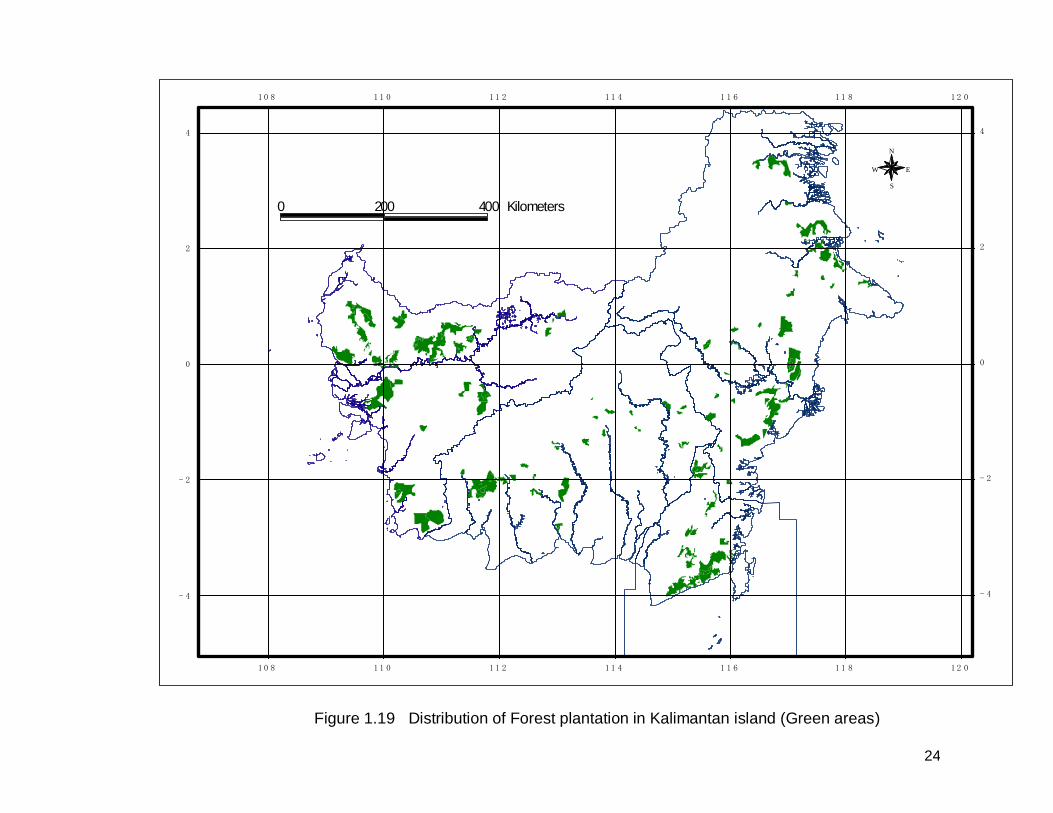
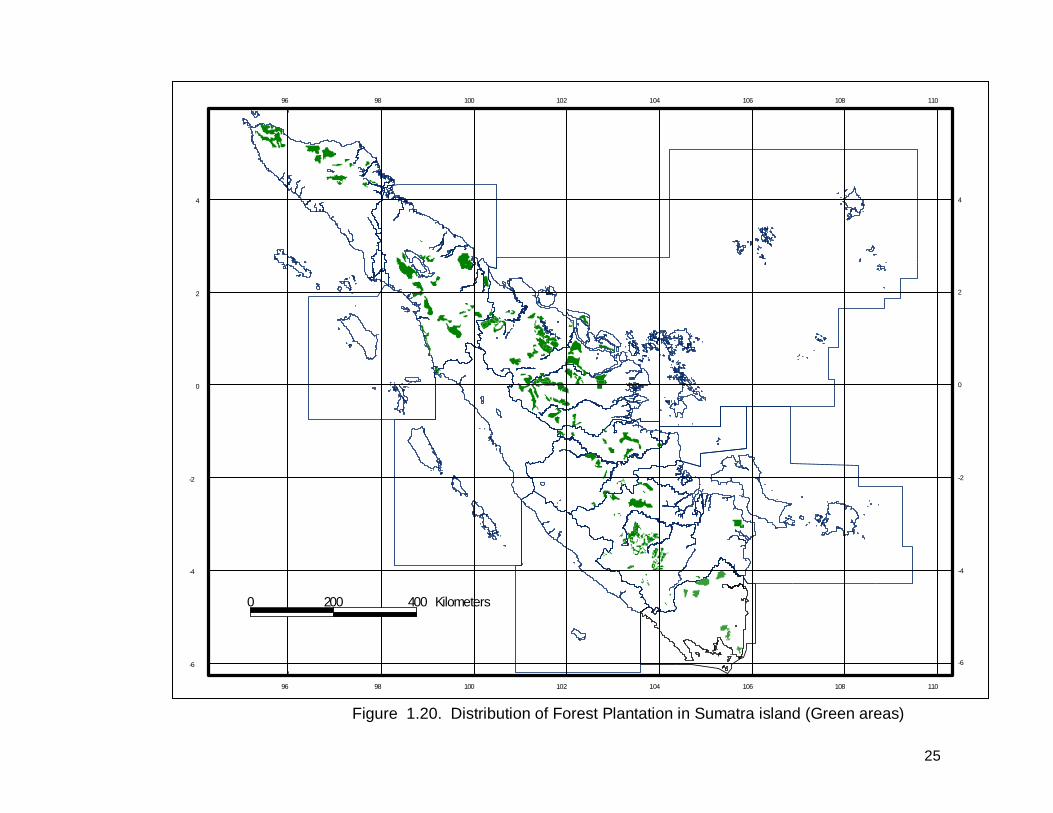
only about 30% from the target planed. Spatial distribution of Plantation Forest in
Kalimantan and Sumatra islands are presented in Fig. 1.19 and Fig. 1.20.
Almost of all Plantation Forests out site Java are managed by private
companies, PT. INHUTANI (State Enterprise on Forestry) or Joint venture
between PT. INHUTANI and Private Companies. PT. INHUTANI I,II and III are
operating in Kalimantan, while PT. INHUTANI III and IV in Sumatra.
22
Table 1.11. Industrial Plantation Forest Development Implementation by Province during last five years
No Province Implementation
1996/1997 (Ha)
1997/1998 (Ha)
1998/1999 (Ha) 1999/2000
(Ha) 2000 *)
1 DI Aceh 15.245 12.275 5.454 959 472
2 North Sumatera 7.507 7.887 5.196 2.358 1.022
3 West Sumatera 2.490 1.151 420 315 0
4 Riau 69.216 52.613 34.199 51.014 29.429
5 Jambi 21.017 19.027 13.260 23.007 16.294
6 South Sumatera 21.290 6.144 4.994 4.085 6.431
7 Bengkulu 825 300 13 0 0
8 Lampung 7.601 1.500 2.744 0 92
SUMATERA 145.191 100.897 66.280 81.738 53.740
9 West Java 0 0 0 0 0
10 Central Java 0 0 0 0 0
11 North Java 0 0 0 0 0
JAVA 0 0 0 0 0
12 West Kalimantan 38.291 31.089 14.000 4.265 10.791
13 Central Kalimantan 27.887 20.621 11.976 5.854 2.351
14 South Kalimantan 44.145 4.010 7.465 3.762 689
15 North Kalimantan 95.559 72.036 61.788 37.245 10.679
KALIMANTAN 206.512 127.756 95.229 51.126 24.510
16 Bali 0 0 0 0 0
17 NTB 658 695 112 0 0
18 NTT 1.936 1.309 0 0 0
19 East Timor 632 342 0 0 0
NUSA TENGGARA
3.226 2.346 112 0 0
20 South Sulawesi 2.253 1.518 605 225 22
21 Central Sulawesi 5.100 4.646 2.721 72 335
22 South East Sulawesi 2.235 2.702 400 543 0
23 North Sulawesi 2.215 2.199 758 0 0
SULAWESI 11.803 11.065 4.483 840 357
24 Maluku 11.350 11.087 7.535 3.789 1.140
25 Papua 12.460 12.698 6.866 0 0
MALUKU & PAPUA 23.810 24.545 14.401 3.789 1.140
TOTAL 390.542 266.609 180.506 137.493 79.747
Source : Directorate General of Forest Production Development Note : *) Data April – December 2000
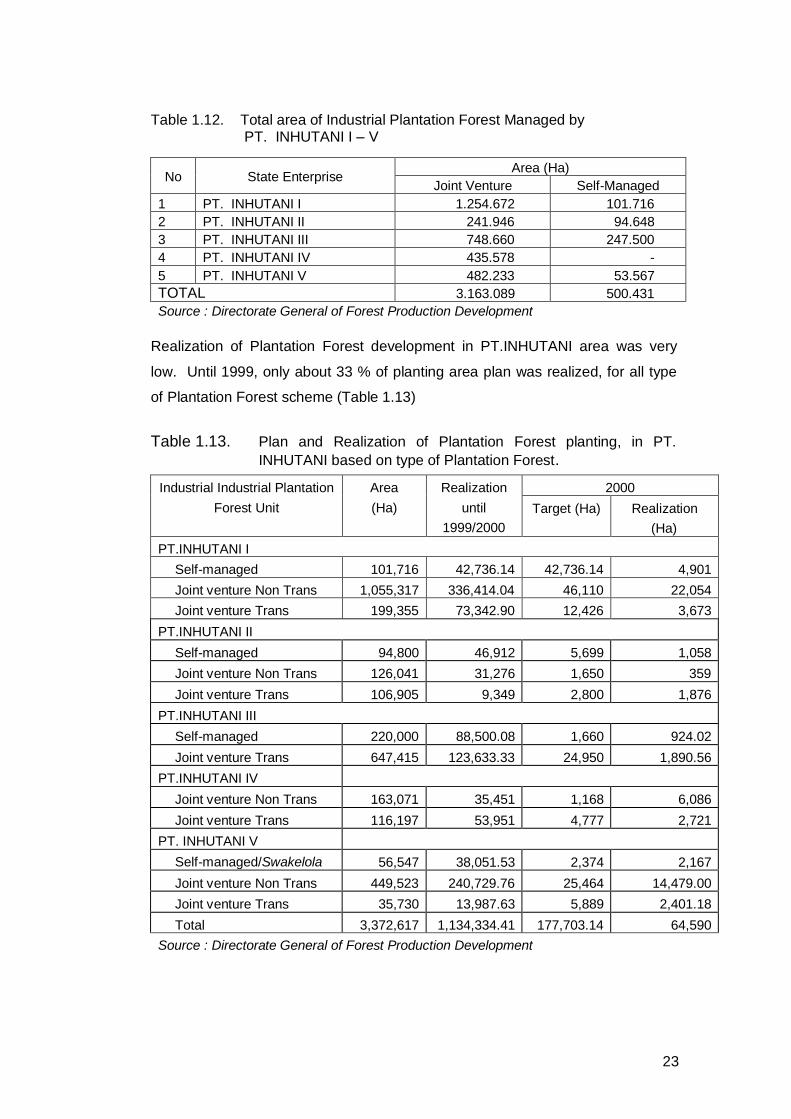
PT. INHUTANI managed forest area (include Plantation Forest area) of about
3.67 million ha. Among of the area, only 0.5 million ha (14%) is managed by
themselves and the rest (3.16 million ha or 86%) is managed under joint venture
scheme.
23
Table 1.12. Total area of Industrial Plantation Forest Managed by PT. INHUTANI I – V
No State Enterprise Area (Ha)
Joint Venture Self-Managed
1 PT. INHUTANI I 1.254.672 101.716
2 PT. INHUTANI II 241.946 94.648
3 PT. INHUTANI III 748.660 247.500
4 PT. INHUTANI IV 435.578 -
5 PT. INHUTANI V 482.233 53.567
TOTAL 3.163.089 500.431
Source : Directorate General of Forest Production Development
Realization of Plantation Forest development in PT.INHUTANI area was very
low. Until 1999, only about 33 % of planting area plan was realized, for all type
of Plantation Forest scheme (Table 1.13)
Table 1.13. Plan and Realization of Plantation Forest planting, in PT.
INHUTANI based on type of Plantation Forest.
Industrial Industrial Plantation
Forest Unit
Area
(Ha)
Realization
until
1999/2000
2000
Target (Ha) Realization
(Ha)
PT.INHUTANI I
Self-managed 101,716 42,736.14 42,736.14 4,901
Joint venture Non Trans 1,055,317 336,414.04 46,110 22,054
Joint venture Trans 199,355 73,342.90 12,426 3,673
PT.INHUTANI II
Self-managed 94,800 46,912 5,699 1,058
Joint venture Non Trans 126,041 31,276 1,650 359
Joint venture Trans 106,905 9,349 2,800 1,876
PT.INHUTANI III
Self-managed 220,000 88,500.08 1,660 924.02
Joint venture Trans 647,415 123,633.33 24,950 1,890.56
PT.INHUTANI IV
Joint venture Non Trans 163,071 35,451 1,168 6,086
Joint venture Trans 116,197 53,951 4,777 2,721
PT. INHUTANI V
Self-managed/Swakelola 56,547 38,051.53 2,374 2,167
Joint venture Non Trans 449,523 240,729.76 25,464 14,479.00
Joint venture Trans 35,730 13,987.63 5,889 2,401.18
Total 3,372,617 1,134,334.41 177,703.14 64,590
Source : Directorate General of Forest Production Development
24
1 0 8
1 0 8
1 1 0
1 1 0
1 1 2
1 1 2
1 1 4
1 1 4
1 1 6
1 1 6
1 1 8
1 1 8
1 2 0
1 2 0
- 4 - 4
- 2 - 2
0 0
2 2
4 4
0 2 0 0 4 0 0 K i l o m e t e r s
N E W
S
Figure 1.19 Distribution of Forest plantation in Kalimantan island (Green areas)
25
9 6
9 6
9 8
9 8
1 0 0
1 0 0
1 0 2
1 0 2
1 0 4
1 0 4
1 0 6
1 0 6
1 0 8
1 0 8
1 1 0
1 1 0 - 6 - 6
- 4 - 4
- 2 - 2
0 0
2 2
4 4
0 2 0 0 4 0 0 K i l o m e t e r s
Figure 1.20. Distribution of Forest Plantation in Sumatra island (Green areas)
26
1.8. Land Degradation
Unsustainable forest exploitation resulted in land degradation. In 2003 Forest Planning
agency conducted a study to identify degraded land in National forest Land and Non
National Forest Land. The study classified the degree of degrdation into 3 priorities.
- First Priority Land : barelands, upland farming, and mixed between upland and
bush
- Second priority : secondairy upland forest, secondairy swamp forest and secondairy
mangrove forest.
- Third pririty : Savanna, mining, settlement, and paddy field
First priority land that need to be rehabilited is 43.6 million hectare, second and third
priority is 36.3 million hectare, and 16.4 million hectare, respectively. Detail of degraded
land of each province based on watershed priority is describbed in Table Appendix 2.
Recommended