NREL is a national laboratory of the U.S. Department of Energy, Office of Energy Efficiency and Renewable Energy, operated by the Alliance for Sustainable Energy, LLC.
Field-to-fuel Performance Testing of Various Biomass
Feedstocks
Daniel Carpenter Tyler Westover (INL)
Dan Howe (PNNL)
September 4, 2014
Production and catalytic upgrading of bio-oil to refinery blendstocks
NREL/PR-5100-62897

2
Stuart Black
Earl Christensen
Mark Davis
Steve Deutch
Robert Evans (MicroChem)
Rick French
Whitney Jablonski
Kellene McKinney
Michele Myers
Jess Olstad
Anne Starace
Intra-lab collaboration…
Rachel Emerson
Tyler Westover
Corinne Drennan
Dan Howe
Susanne Jones
Igor Kutnyakov
Craig Lukins
Daniel Santosa
Alan Zacher
Bio-oil/vapor • Yield • Quality/comp. • Contaminants
Upgrading • Catalyst
development • Process
conditions (T, P) • H2 consumption
In/ex-situ • Catalyst
development • Process
conditions (T, P) • Hot gas filtering
TEA • Model
assumptions • Correlations • Wastewater
treatment
Liquid fuels Biomass Bio-oil
Feedstock Systems
Assembly Characterization
(INL)
Direct Liquefaction (NREL/PNNL)
Upgrading (PNNL/NREL)

3
Outline
• Background and Motivation
• Formulated Feedstocks
• Feedstock/Conversion Interface
• Bench-Scale Experiments
• Results
• Conclusions and Future Work

4
Motivation: EISA 2007
o Reduce greenhouse gas emissions and dependence on foreign fuels
o Sustainably produce 36 billion gallons of infrastructure-compatible, renewable fuels by 2022
o Minimum fuel selling price: $3.00/gallon gasoline equivalent (gge), competitive with ~$95/barrel oil
From: Replacing the Whole Barrel (BETO, July 2013)

5
U.S. Biomass Resource Assessment
• BT2: updated August 2011 • Developed jointly by DOE and USDA • Included supply-cost projections, county level estimates, sustainability
Could offset ~30% of U.S. petroleum demand

6
Example resources to meet RFS2
From BETO multi-year program plan, May 2013

7
Location, location, location
•Need to expand the pool of available biomass •What about quality? •Formulated feedstocks? •Seasonality?

8
Supply-cost curves for key feedstocks (BT2)
Carpenter, Westover, Jablonski, Czernik, Green Chem., 2014, 16, 384, adapted from BT2
DOE design base case ($80/ton)

9
TEA design case for FP+HT (one of several pathways)
• Wood Pyrolysis + Hydrotreating → HC fuels • Allows sensitivity analysis of technical and
market assumptions • Assumes 64% oil yield and 44% HT product
yield (dry basis) • Yield = 84 gal/ton (gasoline+diesel
blendstock) • MFSP = $3.39/gge (nth plant) • Biomass feedstock is projected to be the
largest cost component (~40%) and is known to be one of the largest risk factors for biorefinery commercialization
• Need to understand feedstock effects on conversion process
• Ash (total and elemental) • What about blends?
10
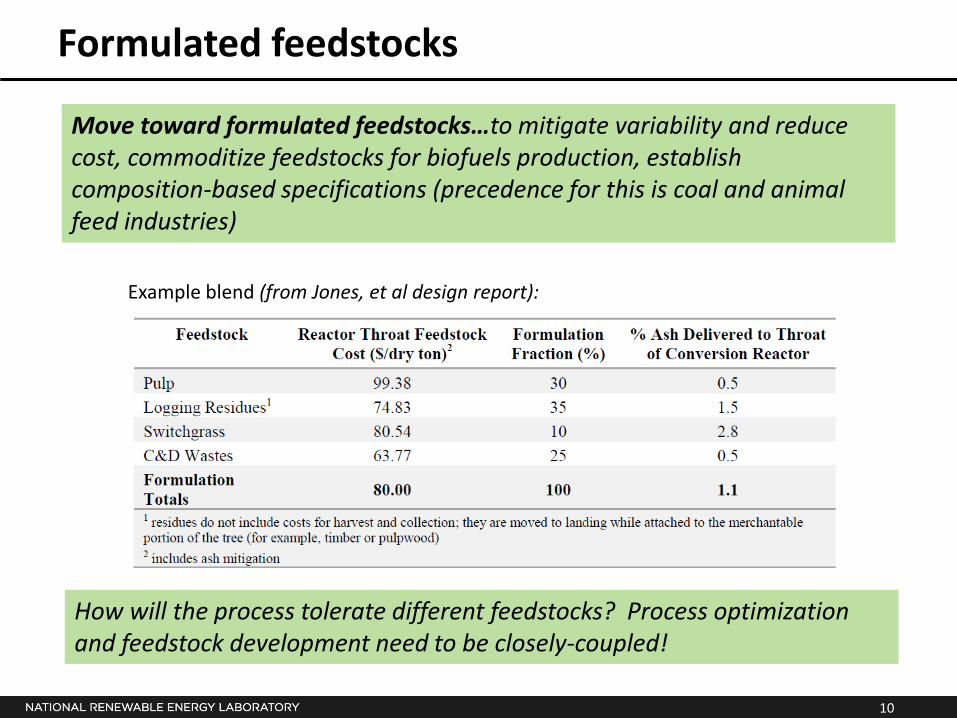
Formulated feedstocks
Move toward formulated feedstocks…to mitigate variability and reduce cost, commoditize feedstocks for biofuels production, establish composition-based specifications (precedence for this is coal and animal feed industries)
How will the process tolerate different feedstocks? Process optimization and feedstock development need to be closely-coupled!
Example blend (from Jones, et al design report):

11
Joint feedstock-process interface project
Wood, Corn stover, Switchgrass
Advanced Feedstocks
Agriculture & Forest Crops
•Goals: minimize cost of delivered feedstock, improve value and consistency of fuel intermediates, establish composition-based specifications
Research Focus/Roles: • Identify, procure, and
characterize feedstock specifications (INL)
• Evaluate TC conversion performance (NREL)
• Input and link data in Biomass Resource Library (INL)
• Develop rapid analysis screening tools (NREL/INL)
Gasoline Jet Fuel Diesel
Products
Feedstock Interface
Pyrolysis
Fuel
Synthesis
Bio oil
Stabilization & Upgrading
supply
conversion
Process requirements impact feedstock choice ↔ feedstock properties drive R&D decisions

12
Experimental: feedstocks used
• Could be blended at a projected cost of $80/ton
• Available at ~50 million
tons/year combined
• “Commercial-type” materials used (i.e. harvested & ground in amounts of >1000 kg)
• Blend #1 = 1:1:1 TP:SG:WP • Blend #2 = 1:1:1 CP:HP:WP
Ash% Al Ca Fe Mg Mn P K Si Na S Ti Cl. Pine 0.73 199 942 290 265 68 75 758 1,557 51 68 13 Wh. Pine 0.74 184 1,096 415 291 72 93 756 1,300 54 73 9 Hy. Poplar 0.86 76 1,702 143 377 7 252 1,956 523 79 107 7 Tu. Poplar 0.47 39 944 62 261 35 70 822 568 23 70 3 Sw. Grass 4.29 59 2,312 537 2,579 66 831 6,097 10,843 506 466 5 Cn. Stover 4.24 63 2,815 356 1,601 33 551 9,338 10,055 25 387 3 Blend #1 0.62 107 1,162 144 295 48 134 1,137 673 49 79 6 Blend #2 1.66 90 1,366 383 934 58 319 2,505 3,632 182 181 6
Proximate (% dry basis) Ultimate (% dry basis)
Sample Moi
stur
e
Vola
tile
Ash
Fixe
d Ca
rbon
HHV
(MJ/
kg)
H C N Oa Cl. Pine 2.16 79.3 0.7 17.9 8428 5.9 49.6 0.2 44.4 Wh. Pine 1.99 78.4 0.7 18.9 8883 5.9 50.2 0.2 43.4 Hy. Poplar 3.73 79.8 0.9 15.6 8250 6.0 48.1 0.2 45.0 Tu. Poplar 3.79 80.9 0.4 14.9 8202 6.0 47.4 0.2 46.4 Sw. Grass 3.84 73.5 4.0 18.6 7768 5.9 45.4 0.5 44.7 Cn. Stover 5.38 73.0 4.0 17.6 7567 6.0 46.1 0.7 43.5 Blend #1 3.64 77.7 1.7 17.0 8179 6.0 47.5 0.3 45.1 Blend #2 3.73 77.8 0.6 17.9 8551 6.1 48.5 0.2 45.4
Ash composition (ppm in whole biomass, dry basis)
13
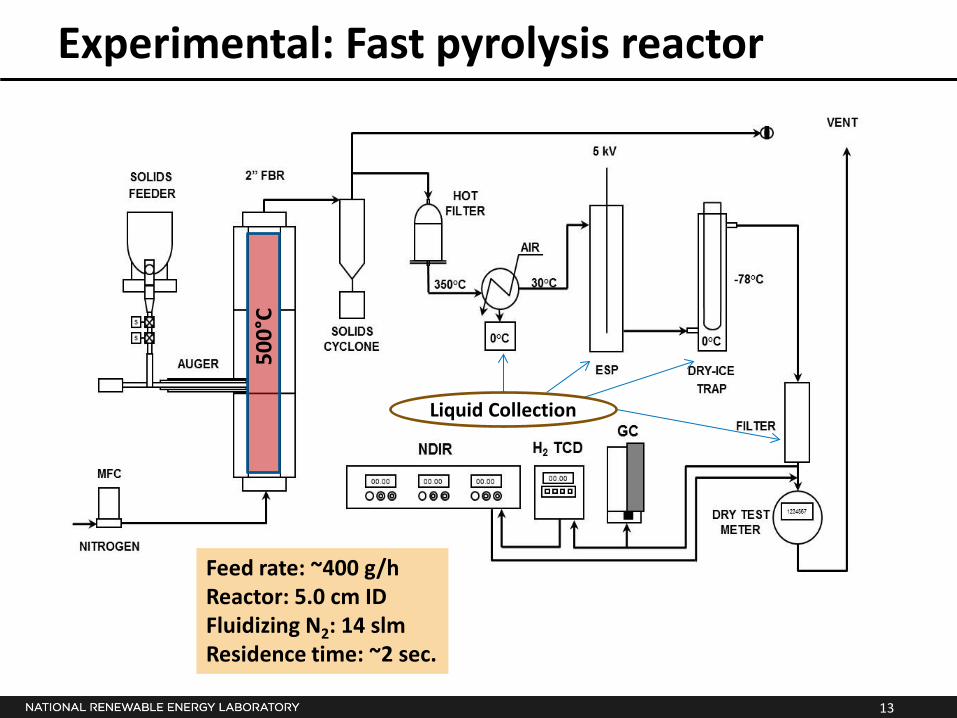
Experimental: Fast pyrolysis reactor
500°
C
Feed rate: ~400 g/h Reactor: 5.0 cm ID Fluidizing N2: 14 slm Residence time: ~2 sec.
Liquid Collection

14
Experimental: Hydrotreating reactor
Reactor: 1.3 cm ID, 63.5 cm long Feed rate: 48 mL/hr Pressure: 1550 psi
Stage 1: 220°C Ru/C, 30-60 mesh
Stage II: 400°C CoMo/Al2O3

15
0
10
20
30
40
50
60
70
CP WP HP TP SG CS BL1 BL2
Org
anic
oil
yiel
d (w
t-%
dry
bas
is)
gdry oil/gdry biomass
Fast pyrolysis results: product distributions
• Total liquid yields 52-71 wt%
• Water in bio-oil 18-37 wt%
• Char yields 9-19 wt%
• Gas yields 14-22 wt%
• Carbon conversion 45(CS)-70(TP) wt% of feed
• Average mass balance 94% (87% for C)
Expected

16
Fast pyrolysis results: bio-oil properties
0
2
4
6
8
10
Conc
entr
atio
n in
raw
bio
-oil
(g/1
00 m
L)
Clean pine whole tree pine
hybrid poplar tulip poplar
switchgrass corn stover (aq)
corn stover (org)
Clean pine Whole tree pine
Hybrid poplar Switchgrass Corn stover
(48aq/52org) Tulip
poplar Blend #1 Blend #2
C (wt% as rec’d) 45 45 46 35 14/59 45 40 43 H (wt% as rec’d) 8 8 8 9 11/8 7.7 8.5 8 N (wt% as rec’d) 0.08 0.09 0.08 0.36 0.16/1.29 0.08 0.19 0.09 O (by diff.) 47 47 46 55 76/32 47 50 48 S (wt% as rec’d) 0.06 0.06 0.06 0.1 0.08/0.12 0.06 0.08 0.07 Water (KF-wt%) 21 23 21 37 72/10 19 27 26 TAN (mg/g KOH) 40 38 66 104 41/46 71 72 47
Viscosity (cP, 25°C) 83 92 60 17 2/773 101 39 44

17
Catalytic hydrotreating results
• Fuel yields 37.2-56.8 (g/g dry oil)
• Water produced 34.3-39.8 g/g dry oil
• Gas yield 14.1-21.0 g/g dry oil
• H2 consumption 53(CS)-70(CP) mg/g dry oil
0%
20%
40%
60%
80%
100%
HT Y
ield
s (w
t-%
of d
ry b
io-o
il fe
d
gas
water
fuel
Expected

18
0
10
20
30
40
50
60
70
80
90
100
0 100 200 300 400 500
Mas
s % re
cove
red
Distillation Temperature (°C)
clean pine
whole tree pine
tulip poplar
hybrid poplar
switchgrass
corn stover
blend 1
blend 2
Jet Fraction
#2 Diesel Fraction
Gasoline Fraction
SimDis of final fuel blendstocks

19
Hydrotreating summary
Biomass Feedstock
Field-to-Fleet Yield
(g fuel oil/ g biomass)
Clean Pine 27.2% Whole Pine 24.9% Tulip Poplar 22.3%
Hybrid Poplar 24.6% Switchgrass 16.3% Corn stover 19.3%
Blend 1 24.1% Blend 2 24.1%
0
20
40
60
80
100
heavies
kerosene/jet
diesel
gasoline
Fuel composition

20
0.00
0.50
1.00
1.50
2.00
2.50
3.00
3.50
4.00
4.50
$/ga
solin
e ga
llon
equi
vale
nt
Preliminary Modeled Conversion Costs (excludes feedstock cost)
DOE design case ($2.47/gge) $66.68
$92.72
$92.72 $67.51- $99.50 $99.49
$86.57- $97.24
$75.64- $86.30

21
Summary
• Feedstock affects everything downstream: FP yields Bio-oil composition HT yields Selectivity to fuel products
• S:G ratio may have negative effect on hydrotreating
• Blends aren’t bad, demonstrated same performance for less $
Future work • Develop PLS model to predict bio-oil/fuel yields based on
feedstock composition (INL)
• Test more blended materials (include other high-volume feedstocks: MSW, C&D waste, yard waste)
22
Thank you for your attention!
This work was supported by the Bioenergy Technologies Office (BETO) at the U.S. Department of Energy’s Office of Energy Efficiency and Renewable Energy. National Renewable Energy Laboratory is operated by The Alliance for Sustainable Energy, LLC under Contract no. DE-AC36-08-GO28308. Idaho National Laboratory is operated by Battelle under contract no. DE-AC07-05ID14517 with the Department of Energy Idaho Operations Office. Pacific Northwest National Laboratory is operated by Battelle under contract DEAC05-76RL01830.
Acknowledgements:
Stuart Black
Earl Christensen
Mark Davis
Steve Deutch
Robert Evans (MicroChem)
Rick French
Whitney Jablonski
Kellene McKinney
Michele Myers
Jess Olstad
Anne Starace
Rachel Emerson
Tyler Westover
Corinne Drennen
Dan Howe
Susanne Jones
Igor Kutnyakov
Craig Lukins
Daniel Santosa
Alan Zacher
Recommended