Field Methods of Monitoring Aquatic Systems
Unit 5 – pH, Acidity and Alkalinity
Copyright © 2008 by DBS
Title
Pure water is neither acidic or basic because it contains equal concentrations of hydroxide and hydronium ions
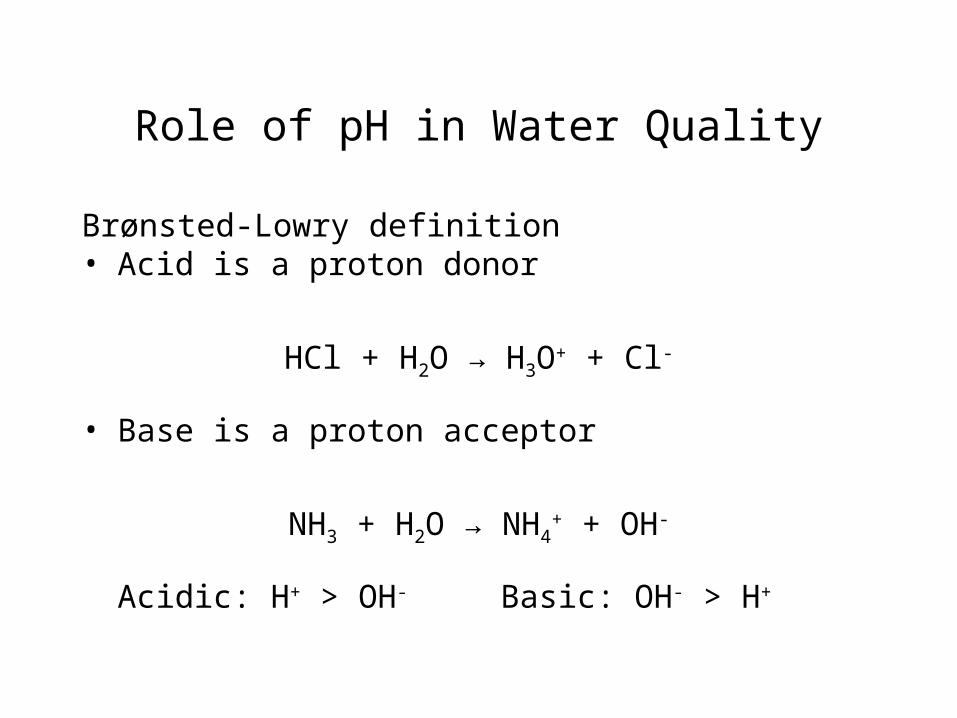
Role of pH in Water Quality
Brønsted-Lowry definition• Acid is a proton donor
HCl + H2O → H3O+ + Cl-
• Base is a proton acceptor
NH3 + H2O → NH4+ + OH-
Acidic: H+ > OH- Basic: OH- > H+
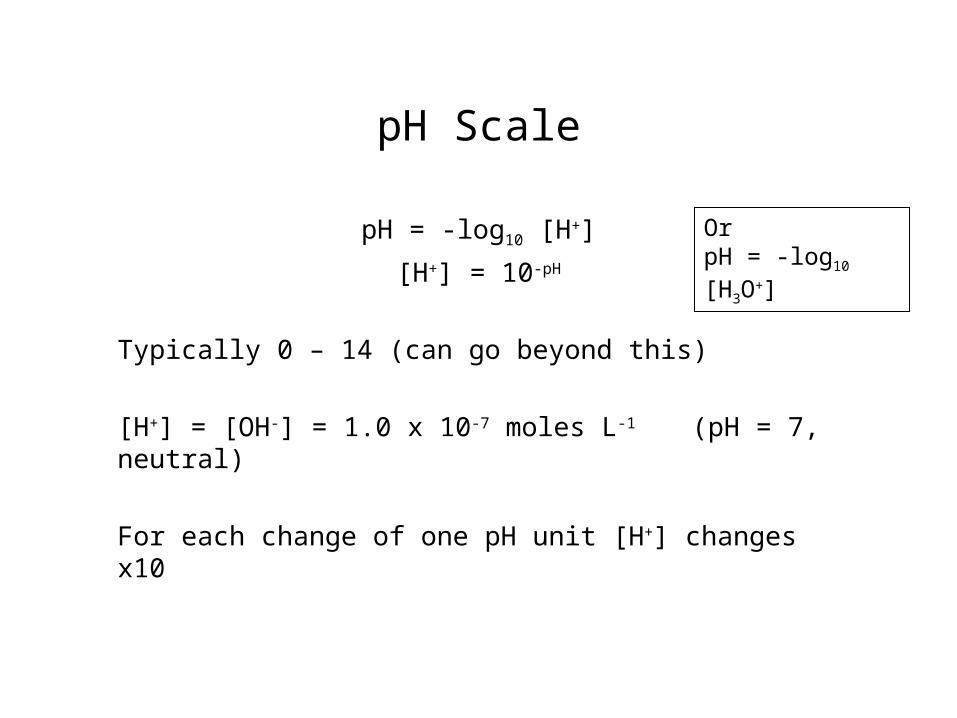
pH Scale
pH = -log10 [H+]
[H+] = 10-pH
Typically 0 – 14 (can go beyond this)
[H+] = [OH-] = 1.0 x 10⁻⁷ moles L-1 (pH = 7, neutral)
For each change of one pH unit [H+] changes x10
Or pH = -log10 [H3O+]
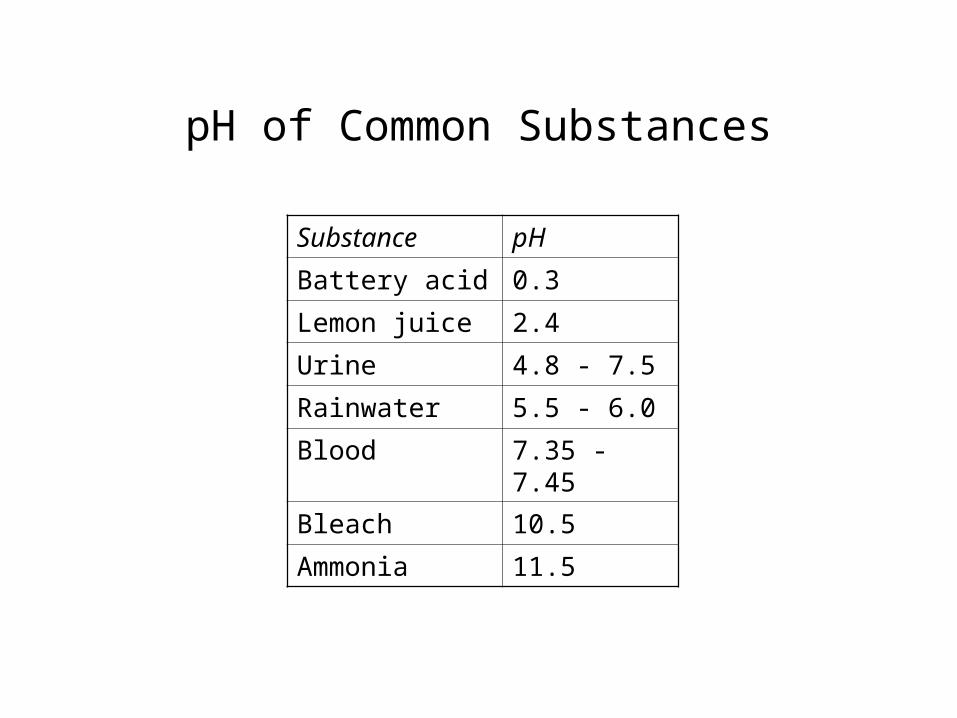
pH of Common Substances
Substance pH
Battery acid 0.3
Lemon juice 2.4
Urine 4.8 - 7.5
Rainwater 5.5 - 6.0
Blood 7.35 - 7.45
Bleach 10.5
Ammonia 11.5
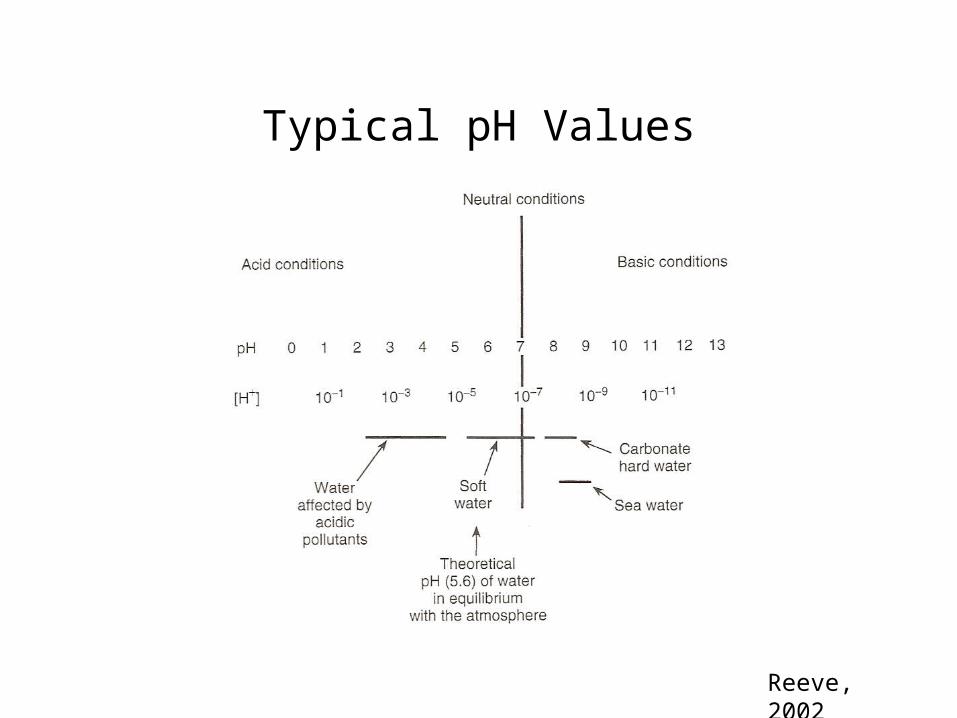
Typical pH Values
Reeve, 2002
Rainwater
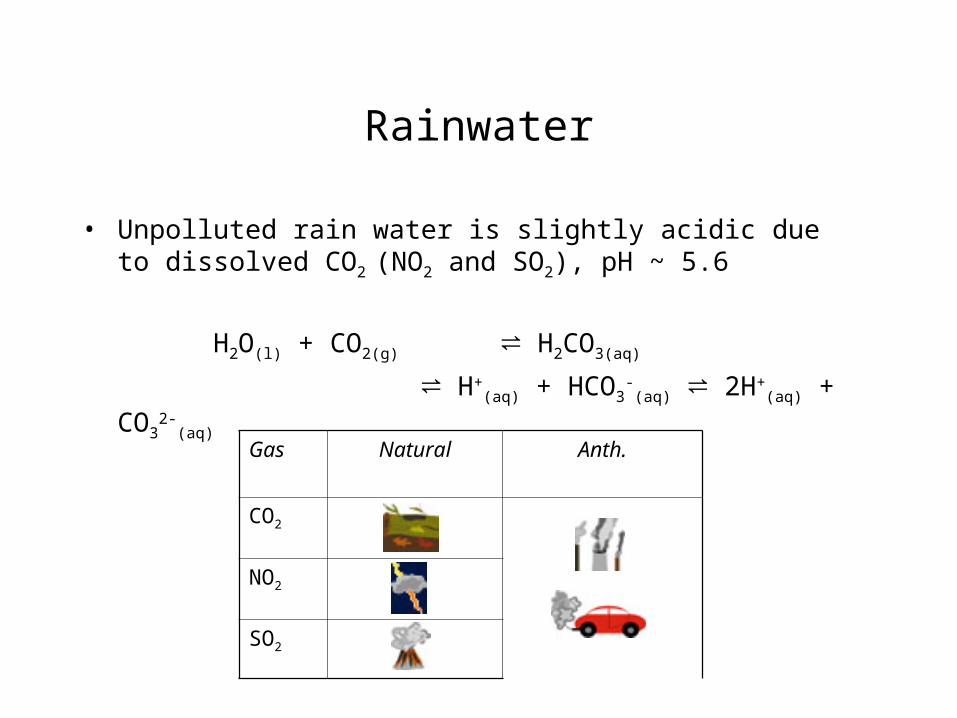
• Unpolluted rain water is slightly acidic due to dissolved CO2
(NO2 and SO2), pH ~ 5.6
H2O(l) + CO2(g) ⇌ H2CO3(aq)
⇌ H+(aq) + HCO3
-(aq) ⇌ 2H+
(aq) + CO32-
(aq)
Gas Natural Anth.
CO2
NO2
SO2
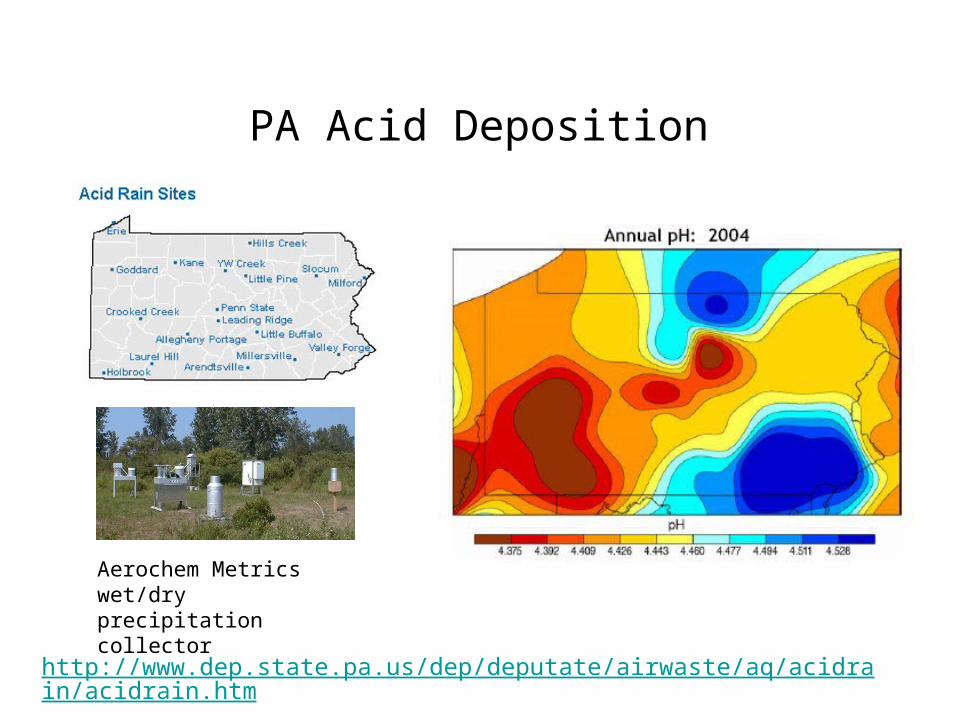
PA Acid Deposition
Aerochem Metrics wet/dry precipitation collector
http://www.dep.state.pa.us/dep/deputate/airwaste/aq/acidrain/acidrain.htm
Question
We must always hold an objective view. If you look for it there is a positive side of the existence of acid rain. What could this be?
Acid rain cleans the atmosphere of pollutants
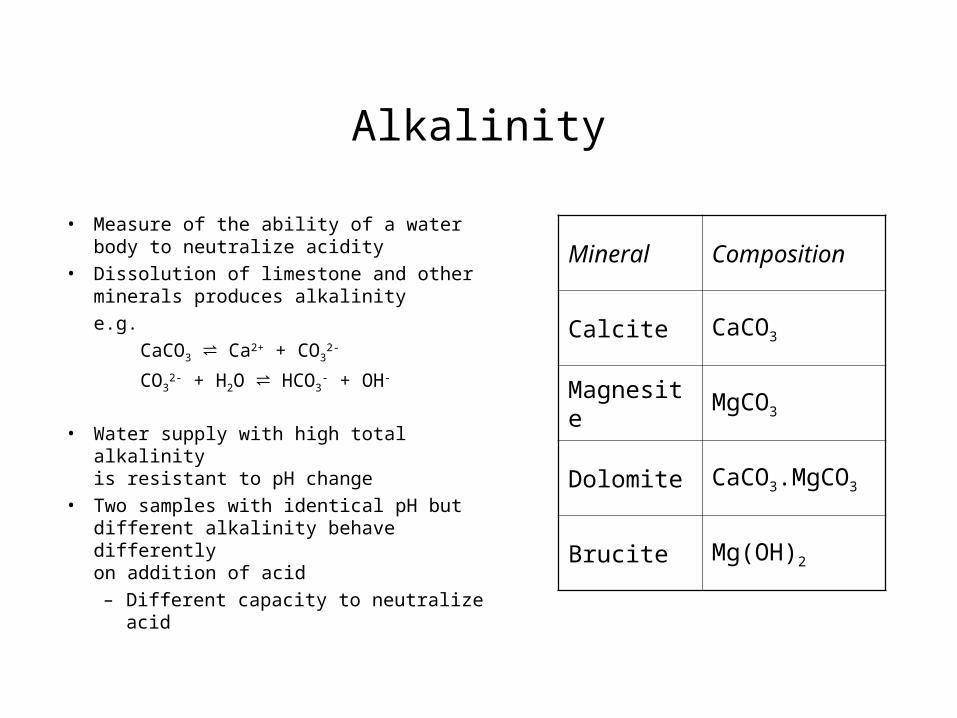
Alkalinity
• Measure of the ability of a water body to neutralize acidity
• Dissolution of limestone and other minerals produces alkalinity
e.g.
CaCO3 ⇌ Ca2+ + CO32-
CO32- + H2O ⇌ HCO3
- + OH-
• Water supply with high total alkalinity is resistant to pH change
• Two samples with identical pH but different alkalinity behave differently on addition of acid
– Different capacity to neutralize acid
Mineral Composition
Calcite CaCO3
Magnesite MgCO3
Dolomite CaCO3.MgCO3
Brucite Mg(OH)2
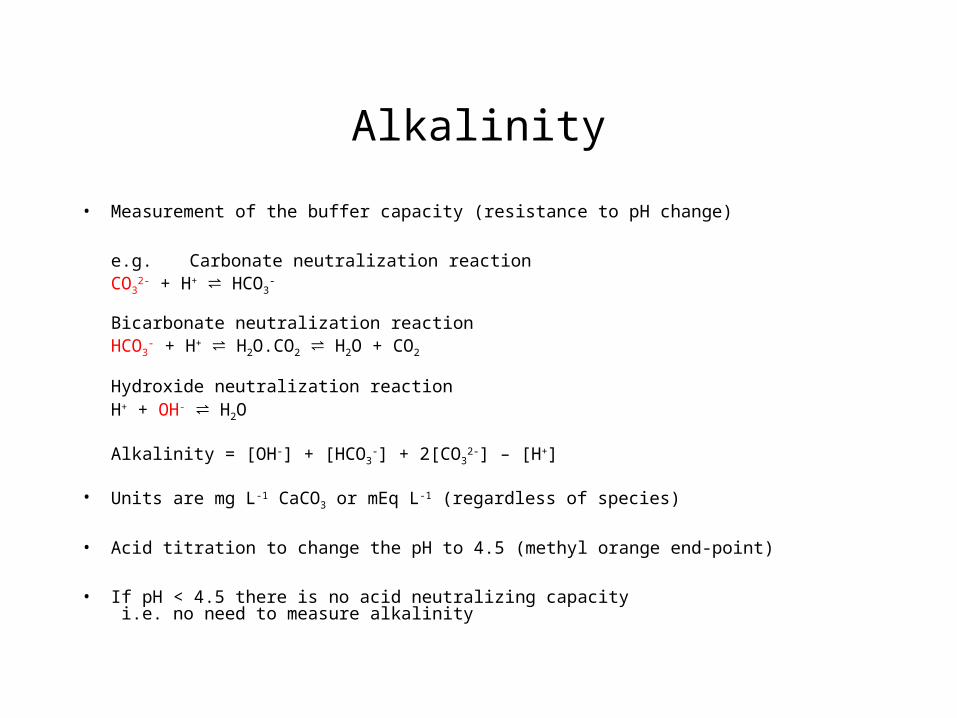
Alkalinity
• Measurement of the buffer capacity (resistance to pH change)
e.g. Carbonate neutralization reactionCO3
2- + H+ ⇌ HCO3-
Bicarbonate neutralization reactionHCO3
- + H+ ⇌ H2O.CO2 ⇌ H2O + CO2
Hydroxide neutralization reactionH+ + OH- ⇌ H2O
Alkalinity = [OH-] + [HCO3-] + 2[CO3
2-] – [H+]
• Units are mg L-1 CaCO3 or mEq L-1 (regardless of species)
• Acid titration to change the pH to 4.5 (methyl orange end-point)
• If pH < 4.5 there is no acid neutralizing capacity i.e. no need to measure alkalinity
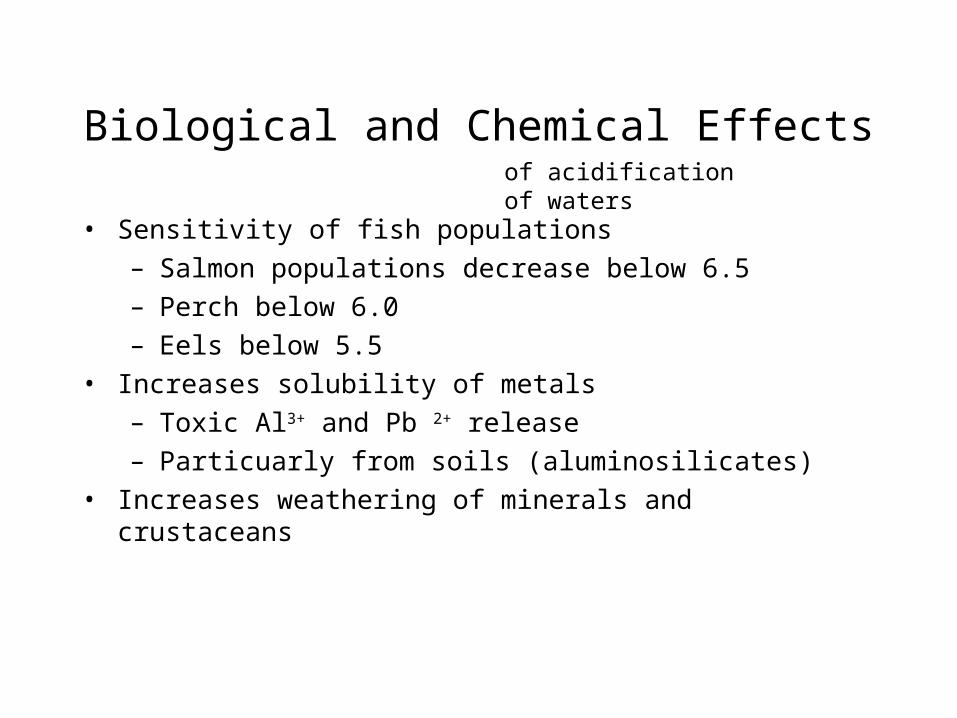
Biological and Chemical Effects
• Sensitivity of fish populations– Salmon populations decrease below 6.5– Perch below 6.0– Eels below 5.5
• Increases solubility of metals– Toxic Al3+ and Pb 2+ release– Particuarly from soils (aluminosilicates)
• Increases weathering of minerals and crustaceans
of acidification of waters
Water Quality
• Public Health Service Act accepted level 6.5-8.5• Public health concern is corrosion and leaching of toxic metals
(Pb, Cu, Zn, Fe) from metal pipes
Measuring pH
• Electrochemical• Colorimetric
Remove sample from refrigerator ~30 mins prior to analysis Measure on unfiltered samplesSamples may be stored for 24 hrs at 4 °C prior to analysis
Electrochemical
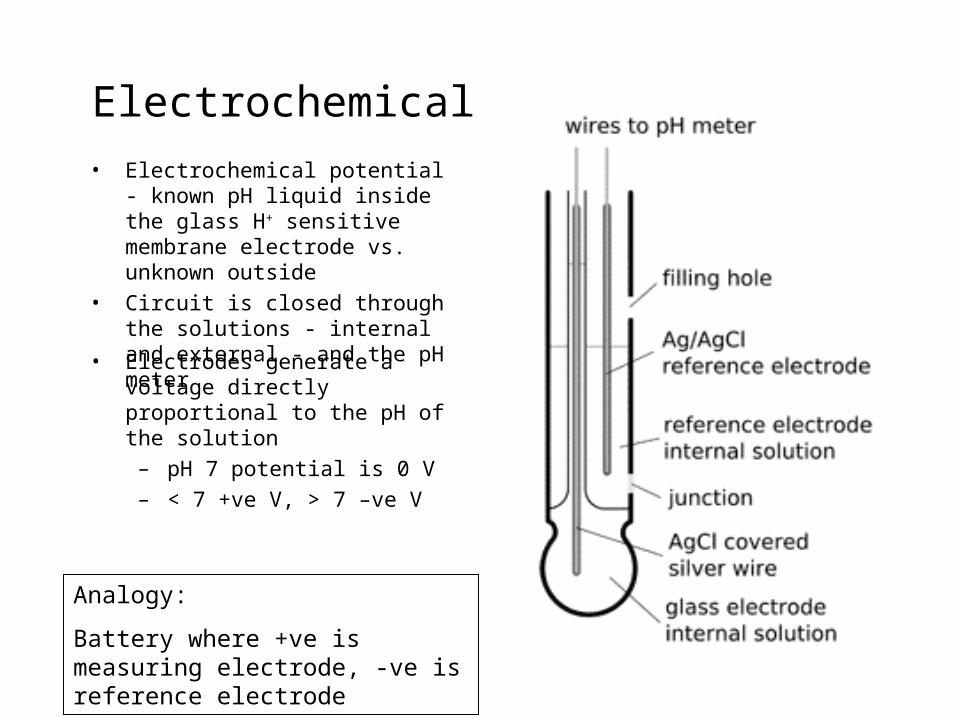
• Electrodes generate a voltage directly proportional to the pH of the solution
– pH 7 potential is 0 V– < 7 +ve V, > 7 –ve V
Analogy:
Battery where +ve is measuring electrode, -ve is reference electrode
• Electrochemical potential - known pH liquid inside the glass H+ sensitive membrane electrode vs. unknown outside
• Circuit is closed through the solutions - internal and external - and the pH meter
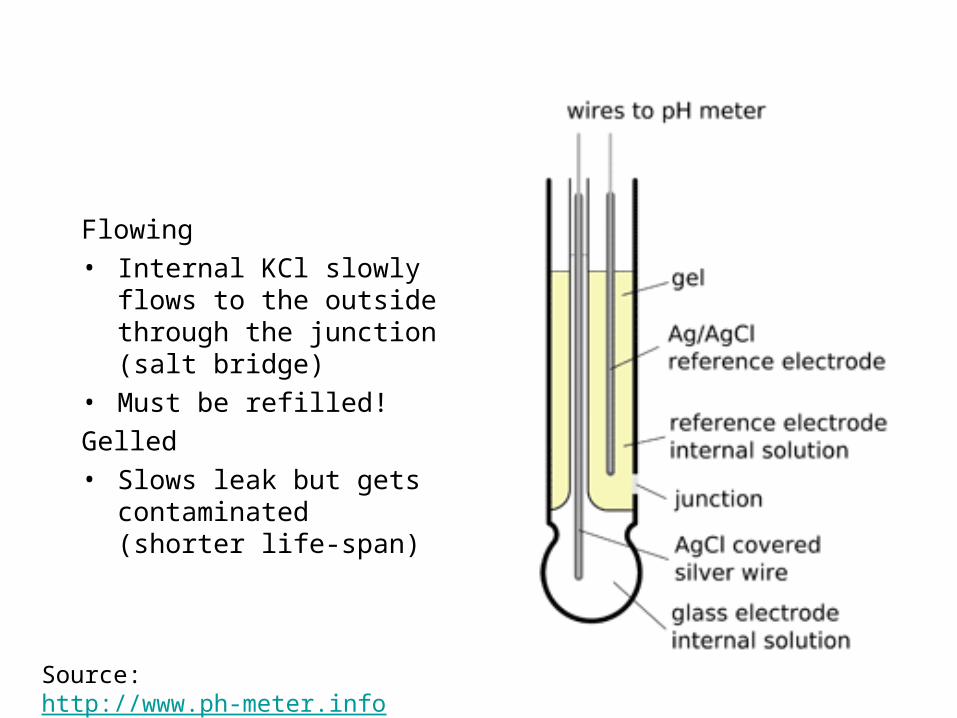
Flowing• Internal KCl slowly flows to
the outside through the junction (salt bridge)
• Must be refilled!
Gelled• Slows leak but gets
contaminated (shorter life-span)
Source: http://www.ph-meter.info
Thin Glass Membrane
• Aluminosilicate (Al2SiO5)
• Kegley description is incorrect, not controlled by H+ but Na+
Electrochemical Potential
Nernst equation
• Ecell = constant – 0.059 pH (at 25 °C)
• Calibrated with buffer solutions of known pH
• Straight line plot of Ecell vs. pH
Colorimetric
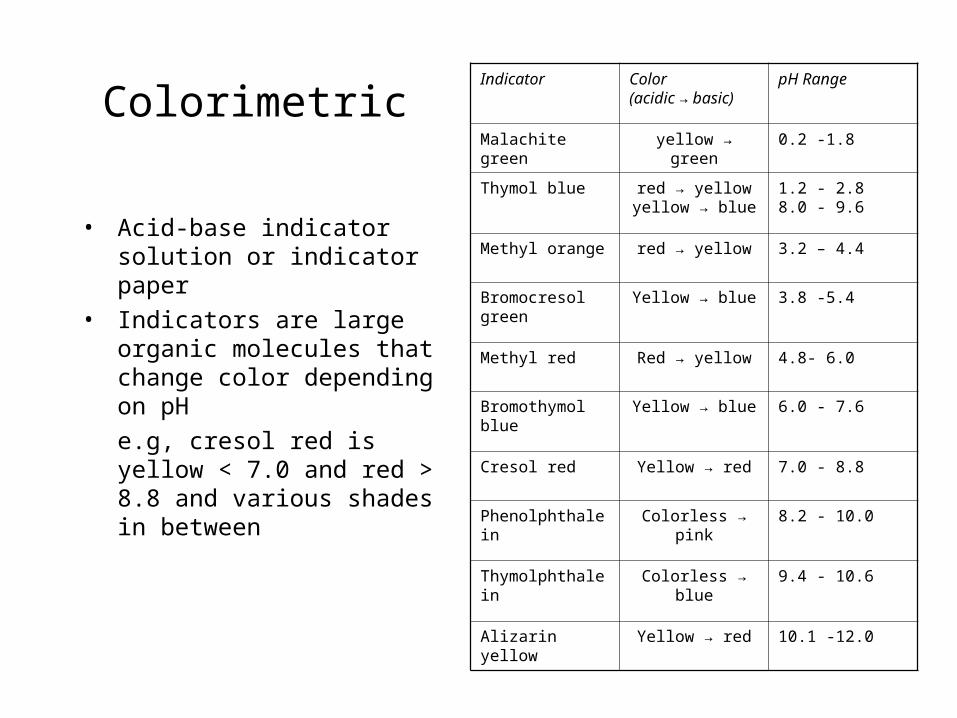
• Acid-base indicator solution or indicator paper
• Indicators are large organic molecules that change color depending on pH
e.g, cresol red is yellow < 7.0 and red > 8.8 and various shades in between
Indicator Color(acidic → basic)
pH Range
Malachite green yellow → green 0.2 -1.8
Thymol blue red → yellowyellow → blue
1.2 - 2.88.0 - 9.6
Methyl orange red → yellow 3.2 – 4.4
Bromocresol green
Yellow → blue 3.8 -5.4
Methyl red Red → yellow 4.8- 6.0
Bromothymol blue Yellow → blue 6.0 - 7.6
Cresol red Yellow → red 7.0 - 8.8
Phenolphthalein Colorless → pink 8.2 - 10.0
Thymolphthalein Colorless → blue 9.4 - 10.6
Alizarin yellow Yellow → red 10.1 -12.0
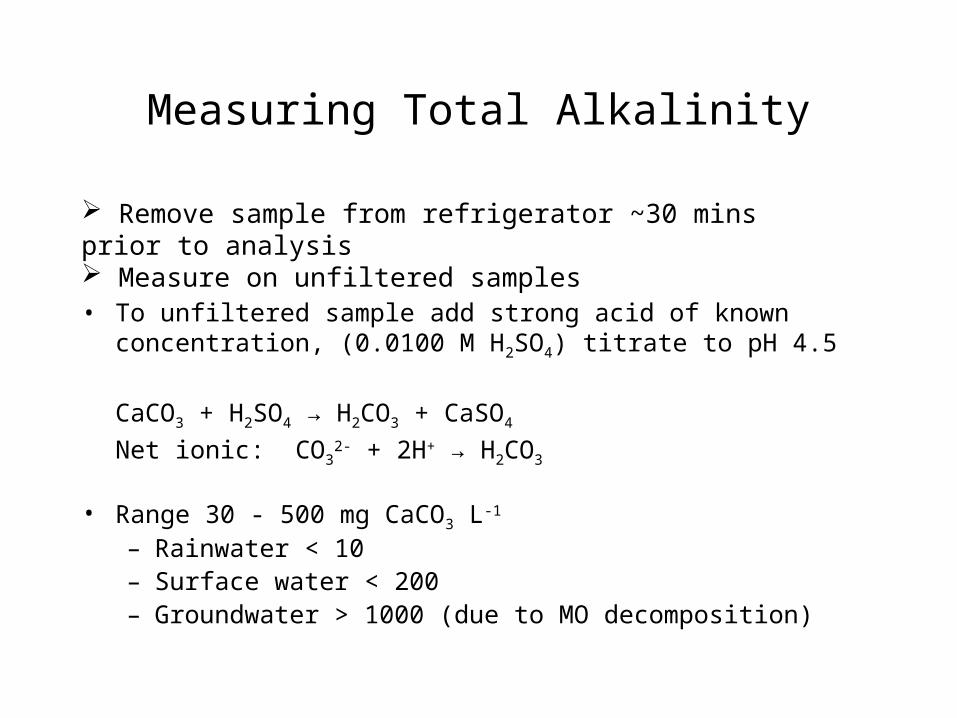
Measuring Total Alkalinity
• To unfiltered sample add strong acid of known concentration, (0.0100 M H2SO4) titrate to pH 4.5
CaCO3 + H2SO4 → H2CO3 + CaSO4
Net ionic: CO32- + 2H+ → H2CO3
• Range 30 - 500 mg CaCO3 L-1
– Rainwater < 10– Surface water < 200– Groundwater > 1000 (due to MO decomposition)
Remove sample from refrigerator ~30 mins prior to analysis Measure on unfiltered samples
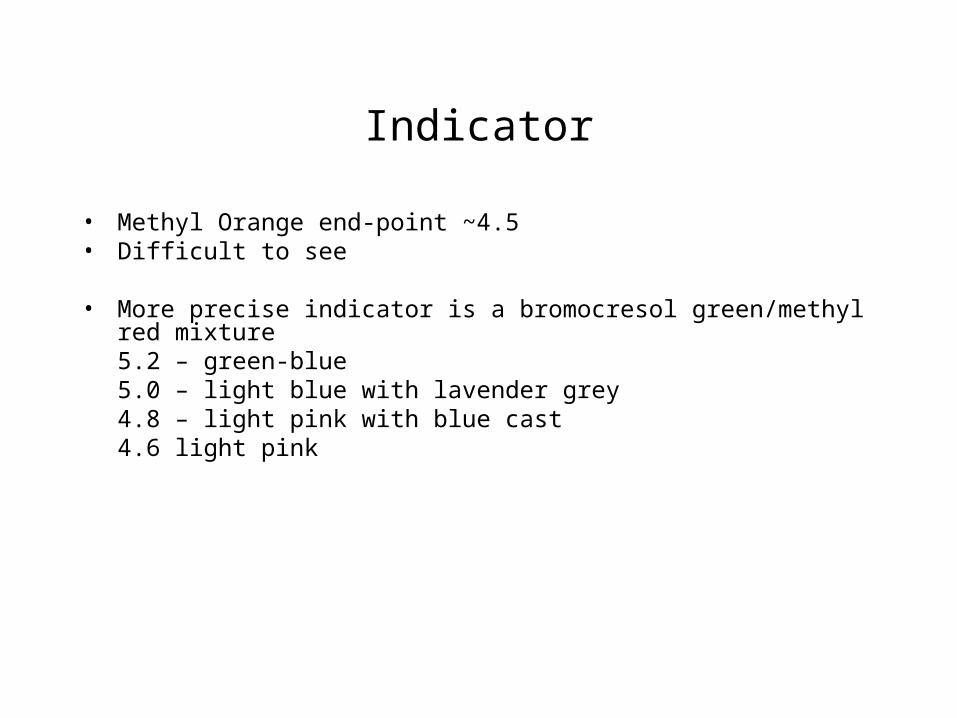
Indicator
• Methyl Orange end-point ~4.5• Difficult to see
• More precise indicator is a bromocresol green/methyl red mixture5.2 – green-blue5.0 – light blue with lavender grey4.8 – light pink with blue cast4.6 light pink
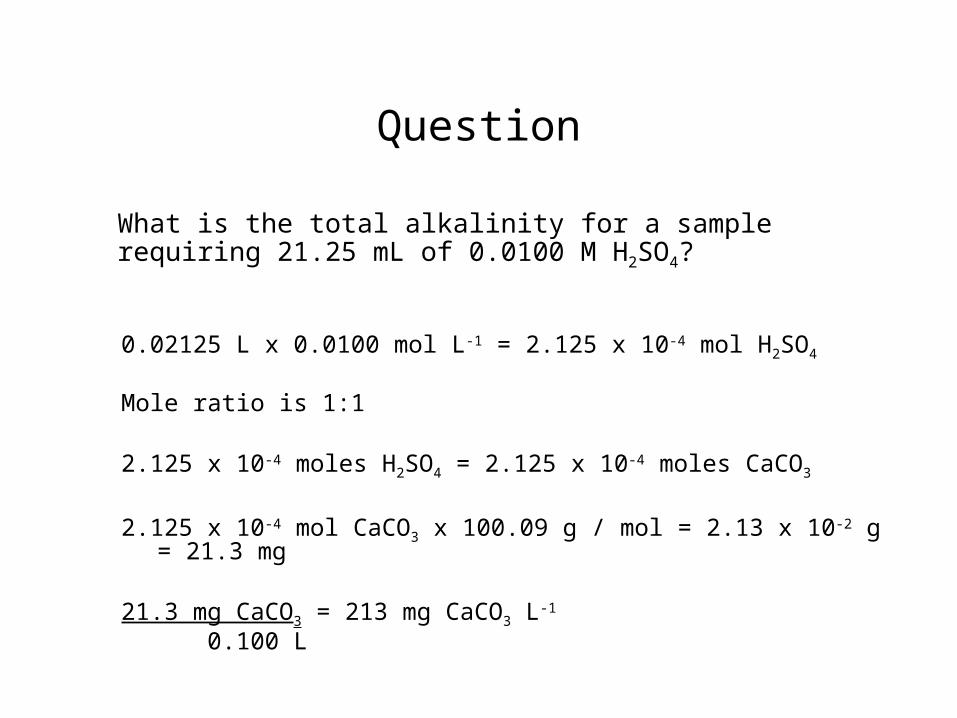
Question
What is the total alkalinity for a sample requiring 21.25 mL of 0.0100 M H2SO4?
0.02125 L x 0.0100 mol L-1 = 2.125 x 10⁻⁴ mol H2SO4
Mole ratio is 1:1
2.125 x 10⁻⁴ moles H2SO4 = 2.125 x 10⁻⁴ moles CaCO3
2.125 x 10⁻⁴ mol CaCO3 x 100.09 g / mol = 2.13 x 10⁻² g = 21.3 mg
21.3 mg CaCO3 = 213 mg CaCO3 L-1
0.100 L
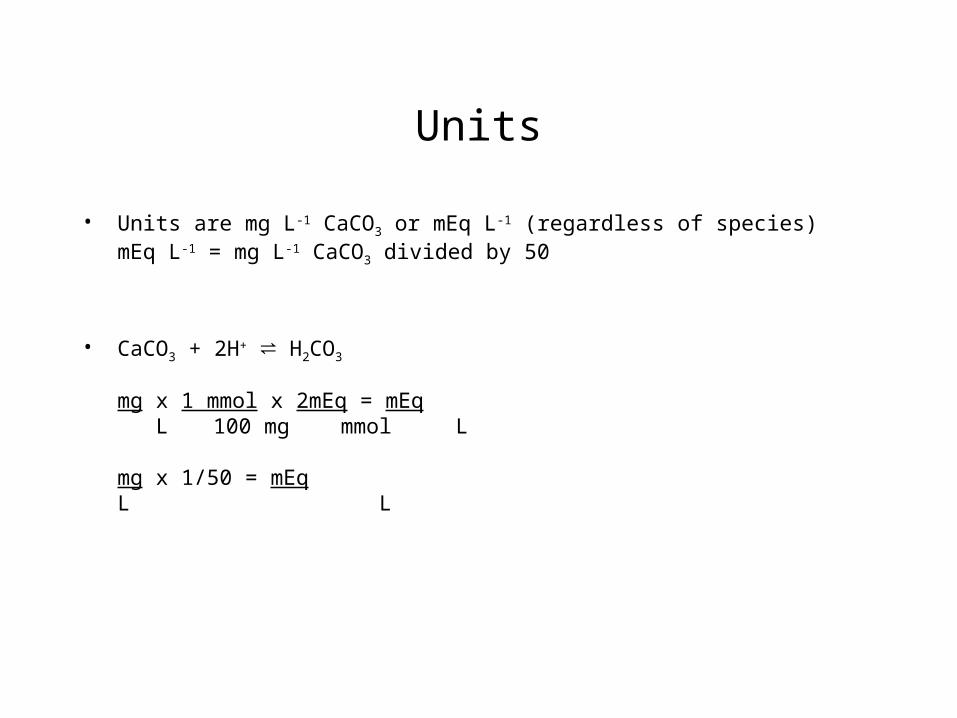
Units
• Units are mg L-1 CaCO3 or mEq L-1 (regardless of species)mEq L-1 = mg L-1 CaCO3 divided by 50
• CaCO3 + 2H+ ⇌ H2CO3
mg x 1 mmol x 2mEq = mEq L 100 mg mmol L
mg x 1/50 = mEq L L
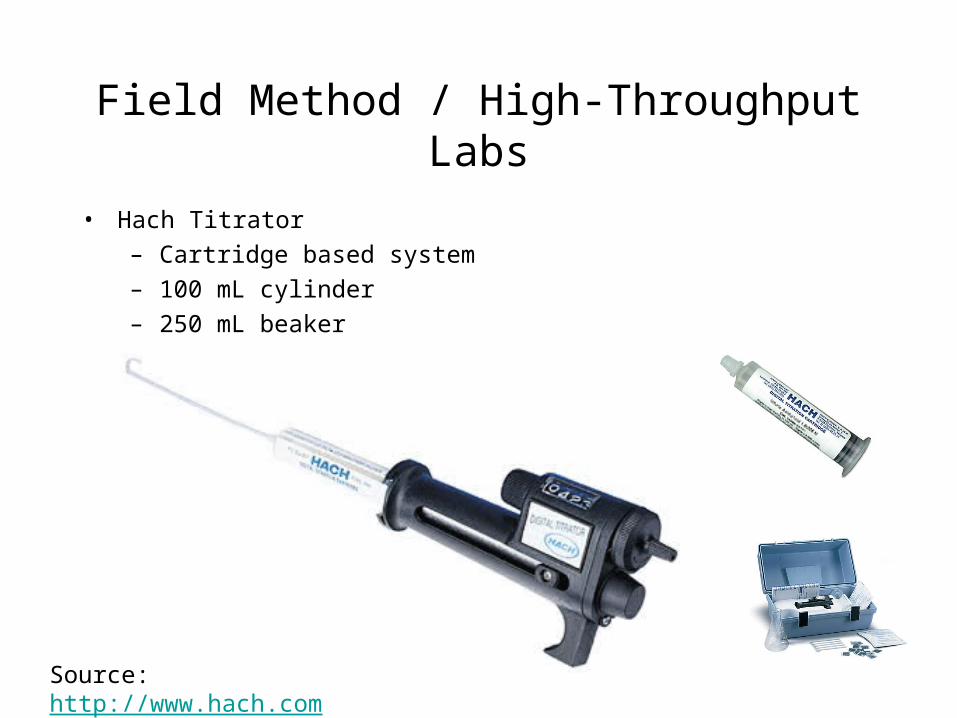
Field Method / High-Throughput Labs
• Hach Titrator
– Cartridge based system
– 100 mL cylinder
– 250 mL beaker
Source: http://www.hach.com
Text Books
• Rump, H.H. (2000) Laboratory Manual for the Examination of Water, Waste Water and Soil. Wiley-VCH.
• Nollet, L.M. and Nollet, M.L. (2000) Handbook of Water Analysis. Marcel Dekker.
• Keith, L.H. and Keith, K.H. (1996) Compilation of Epa's Sampling and Analysis Methods. CRC Press.
• Van der Leeden, F., Troise, F.L., and Todd, D.K. (1991) The Water Encyclopedia. Lewis Publishers.
• Kegley, S.E. and Andrews, J. (1998) The Chemistry of Water. University Science Books.
• Narayanan, P. (2003) Analysis of environmental pollutants : principles and quantitative methods. Taylor & Francis.
• Reeve, R.N. (2002) Introduction to environmental analysis. Wiley.
• Clesceri, L.S., Greenberg, A.E., and Eaton, A.D., eds. (1998) Standard Methods for the Examination of Water and Wastewater, 20th Edition. Published by American Public Health Association, American Water Works Association and Water Environment Federation.
Recommended