OR I G INA L ART I C L E
Feel the Noise: Relating Individual Differencesin Auditory Imagery to the Structure and Functionof Sensorimotor SystemsCésar F. Lima1,3,†, Nadine Lavan1,4,†, Samuel Evans1, Zarinah Agnew1,5,Andrea R. Halpern6, Pradheep Shanmugalingam1, Sophie Meekings1,Dana Boebinger1, Markus Ostarek1, Carolyn McGettigan1,4, Jane E. Warren2,and Sophie K. Scott1
1Institute of Cognitive Neuroscience, 2Faculty of Brain Sciences, University College London, London, UK, 3Centerfor Psychology, University of Porto, Porto, Portugal, 4Department of Psychology, Royal Holloway University ofLondon, London, UK, 5Department of Otolaryngology, University of California, San Francisco, USA and6Department of Psychology, Bucknell University, Lewisburg, USA
Address correspondence to Dr César F. Lima, Institute of Cognitive Neuroscience, University College London, 17 Queen Square, London WC1N 3AR, UK.Email: [email protected] or [email protected]
†César F. Lima and Nadine Lavan have contributed equally to the work
AbstractHumans can generate mental auditory images of voices or songs, sometimes perceiving them almost as vividly as perceptualexperiences. The functional networks supporting auditory imagery have been described, but less is known about the systemsassociated with interindividual differences in auditory imagery. Combining voxel-based morphometry and fMRI, weexamined the structural basis of interindividual differences in how auditory images are subjectively perceived, and exploredassociations between auditory imagery, sensory-based processing, and visual imagery. Vividness of auditory imagerycorrelated with graymatter volume in the supplementary motor area (SMA), parietal cortex, medial superior frontal gyrus, andmiddle frontal gyrus. An analysis of functional responses to different types of human vocalizations revealed that the SMA andparietal sites that predict imagery are also modulated by sound type. Using representational similarity analysis, we found thathigher representational specificity of heard sounds in SMA predicts vividness of imagery, indicating a mechanistic linkbetween sensory- and imagery-based processing in sensorimotor cortex. Vividness of imagery in the visual domain alsocorrelated with SMA structure, and with auditory imagery scores. Altogether, these findings provide evidence for a signatureof imagery in brain structure, and highlight a common role of perceptual–motor interactions for processing heard andinternally generated auditory information.
Key words: auditory imagery, auditory processing, fMRI, supplementary motor area, voxel-based morphometry
© The Author 2015. Published by Oxford University Press.This is anOpenAccess article distributedunder the terms of the Creative CommonsAttribution License (http://creativecommons.org/licenses/by/4.0/), whichpermits unrestricted reuse, distribution, and reproduction in any medium, provided the original work is properly cited.
Cerebral Cortex, November 2015;25: 4638–4650
doi: 10.1093/cercor/bhv134Advance Access Publication Date: 19 June 2015Original Article
by guest on January 24, 2017http://cercor.oxfordjournals.org/
Dow
nloaded from
Introduction
Imagine the voice of a close friend when you laugh together, or apiano playing your favorite song. Auditory imagery is a complexprocess by which an individual generates and processes mentalimages in the absence of sound perception—“hearing with themind’s ear.”Auditorymental images can be so vivid that they re-semble the real experience of hearing, and they can be as accur-ate as representations arising directly from sensory input (Janata2012). They facilitate several cognitive and motor processes. Inmusic performance, for instance, imagery supports action plan-ning, formation of expectations about upcoming events, andinterpersonal coordination (Keller 2012; Novembre et al. 2014).Functional neuroimaging studies have shown that the networkof brain regions engaged during auditory imagery minimally in-cludes the superior temporal gyri (STG), parietal, motor, and pre-motor cortices, the inferior frontal gyrus, and the supplementarymotor area (SMA) (Shergill et al. 2001; Herholz et al. 2012;Zvyagintsev et al. 2013; for a meta-analysis, McNorgan 2012).
The involvement of STG in auditory imagery has been sug-gested to reflect the reconstruction of sound-like representationsvia higher order cortical mechanisms, contributing to the sub-jective experience of “hearing” (Kraemer et al. 2005; Zatorre andHalpern 2005). The superior parietal cortex is associated withthe manipulation of imagined auditory events, for examplewhen the task requires participants to mentally reverse thenotes of a melody (Zatorre et al. 2010). Frontal regions are as-sumed to underlie general control, working memory, retrieval,and semantic processes (Zvyagintsev et al. 2013). The SMA andpremotor cortices seem to be directly involved in generatingauditory images (Halpern and Zatorre 1999; Herholz et al. 2012),implicating an intimate link between sensorimotor and imageryprocesses. Consistent with the idea that auditory–motor interac-tions may be involved in auditory imagery, in a functionalmagnetic resonance imaging (fMRI) study, Kleber et al. (2007)showed that the premotor cortex and SMA are active both whenprofessional singers overtly sing an Italian aria and when theyare asked to imagine the act of singing as vividly as possiblewith-out performing any movements. Functional imaging work hasadditionally revealed that auditory imagery recruits brain net-works that also respond to heard auditory information (Zatorreet al. 1996; Kosslyn et al. 2001; Zatorre and Halpern 2005; Herholzet al. 2012). For instance, Zatorre et al. (1996) asked participants tomake pitch judgments about words taken from familiar tunes inan imagery condition, in which there was no auditory input, andin a perceptual condition, in which participants could actuallyhear the song. Common activations were found across conditionsdespite thedifferences in input, including the temporal and front-al lobes, the supramarginal gyrus, midbrain, and SMA.
We have a good picture of the functional networks that areactive during auditory imagery tasks, but a common aspect tomany of the available studies is that findings are based ongroup averages—similarities across individuals are privilegedover interindividual differences so that general processes maybe inferred. Less is known about the predictors of individual dif-ferences in how people experience auditory images, or aboutwhich neural systems account for these differences. These ques-tions matter, as behavioral data reveal considerable variability inhow well individuals perform on tasks that engage imagery abil-ities, e.g., judging whether or not a final probe note of a scale ismistuned when the initial notes were played but the remainingones had to be imagined (Janata 2012). People also vary widelyin how vividly they experience auditory mental images, asmeasured by self-report on the Bucknell Auditory Imagery
Scale (BAIS; Pfordresher and Halpern 2013). In that study, highervividness of imagery predicted better accuracy in a pitch imita-tion task in which participants reproduced sequences of pitches,suggesting that the sensorimotor components of imagery play arole in planning and guiding vocal imitation. In 2 fMRI studies,individual differences in the BAIS correlated with blood oxygenlevel-dependent (BOLD) responses in the right superior parietalcortex during a task involving mental reversal of melodies(Zatorre et al. 2010), and in the right STG, right dorsolateral pre-frontal cortex and left frontal pole during imagery of familiartunes (Herholz et al. 2012).
Crucial to the understanding of interindividual differences inimagery is the question of whether they are determined by thelocal structure of gray matter. A growing number of studies indi-cates that individual differences in a range of basic and higherorder cognitive functions are reflected in brain structure, asmea-sured using techniques such as voxel-basedmorphometry (VBM)and diffusion tensor imaging (for a review, Kanai and Rees 2011).Differences in brain structure have been reported among groupsof experts, such as musicians (Gaser and Schlaug 2003), taxi dri-vers (Woollett and Maguire 2011), and phoneticians (Golestaniet al. 2011), as well as in samples from the general population.For instance, among people with no particular expertise,increased gray matter volume in the left thalamus predictsenhanced ability to adjust to degraded speech (Erb et al. 2012)and, in the right anterior prefrontal cortex, it predicts the abilityto introspect about self-performance during perceptual decisions(Fleming et al. 2010).
In the present study, we examine for the first time whetherdifferences in brain structure predict differences in how auditoryimages are subjectively experienced. Gray matter volume wasmeasured using VBM, and auditory imagery was evaluated interms of perceived vividness, aswell as in terms of perceived con-trol over mental representations, that is, the ease with whichpeople can change or manipulate representations (Pfordresherand Halpern 2013; Halpern 2015). Two additional novel questionswere addressed. First, we combined VBM and fMRI approaches toinvestigatewhether the structural predictors of imagery co-local-ize with systems that also play a role in the processing of heardauditory information. Importantly, in addition to looking at co-localization, we examined possible co-variation between interin-dividual differences in auditory imagery and in the patterns ofonline functional responses to auditory input. Electrophysio-logical studies have shown similar modulations of the N100component by imagery and sensory-based auditory processes(Navarro-Cebrian and Janata 2010a), and imaging studies havereported common activations during imagery and auditoryprocessing (Zatorre et al. 1996; Kosslyn et al. 2001; Zatorre andHalpern 2005; Herholz et al. 2012), a result suggestive of conver-ging mechanisms. However, because co-localization does notnecessitate shared function (e.g., Woo et al. 2014), more directevidence for links between the processing of heard and internallygenerated auditory information is needed. Second, in an add-itional VBM study, we aimed to determine the extent to whichthe structural predictors of auditory imagery reflect the operationof mechanisms that are specialized to auditory information. Tothat end, links with visual imagery were investigated. Researchon imagery is typically confined to a single modality, but somefMRI studies suggest that whereas the STG may play an audi-tory-specific role, the SMA, premotor, parietal, and prefrontal re-gionsmay be involved in imagerywithin and beyond the auditorydomain, forming a modality-independent “core” imagerynetwork (Daselaar et al. 2010; McNorgan 2012; Burianová et al.2013). Therefore, the current study takes advantage of combining
Auditory Imagery and Brain Structure Lima et al. | 4639
by guest on January 24, 2017http://cercor.oxfordjournals.org/
Dow
nloaded from
behavioral with structural and functional measures to shed newlight on the neural underpinnings of interindividual differencesin auditory imagery, and on how these differences may reflectmechanisms shared with sensory-based processing and theoperation of supramodal processes.
Materials and MethodsParticipants
Seventy-four participants were included in the study lookingat the structural correlates of auditory imagery (Mage = 42.61,SD = 17.11; range = 20–81; 40 female). None reported a diagnosisof neurological or psychiatric disorders. Written informed con-sent was collected and ethical approval was obtained from theUCL Research Ethics Committee. All structural scans were re-viewed by a neurologist to identify anatomical abnormalitiesthat could affect their suitability for VBM; this led to the exclusionof 2 participants of the 76 initially included. No participantshad significant cognitive impairment (all participants aged ≥50years completed the Montreal Cognitive Assessment, Mscore = 28,max 30; SD = 1.68; range = 25–30; www.mocatest.org). The partici-pants’ age range was wide because these data were collectedas part of a larger project on neurocognitive ageing. All partici-pants completed the forward condition of the digit span test ofthe Wechsler Adult Intelligence Scale (WAIS-III, Wechsler 1997;average number of digits correctly recalled = 7.08; SD = 1.21;range = 4–9). Short-term memory is highly correlated with work-ing memory and intelligence (Colom et al. 2008) and, therefore, itwas used as a proxy for general cognitive abilities. Thirty partici-pants had some degree of musical training (Myears of training = 6.03,SD = 4.47; range = 1–20).
From the 74 participants, 56 completed the fMRI study exam-ining brain responses during auditory processing (Mage = 47.05,SD = 17.23; range = 20–81; 31 female).
Forty-six participants took part in the follow-up VBM studylooking at the links between auditory and visual imagery (44 ofthem also participated in the first VBM study; Mage = 47.13,SD = 17.83; range = 20–81; 24 female).
Materials
Individual Differences in ImageryTo assess auditory imagery, we used the BAIS (Pfordresher andHalpern 2013; Halpern 2015), a self-report measure that includes2 14-item subscales. The first subscale focuses on “vividness” ofimagery: participants are asked to generate amental image of thesound described in each item, and to rate its subjective clarity in a7-point scale (1 = no image present at all; 7 = as vivid as actualsound), for example, “consider ordering something over thephone; the voice of an elderly clerk assisting you”; “consider at-tending classes; the slow-paced voice of your English teacher.”The second subscale focuses on “control” of imagery: partici-pants are asked to generate mental images corresponding topairs of items, and to consider how easily they can change thefirst image to the second image (1 = no image present at all;7 = extremely easy to change the item), for example, “considerordering something over the phone; image a—the voice of an eld-erly clerk assisting you; image b—the elderly clerk leaves and thevoice of a younger clerk is now on the line.” Most of the itemscover vocal and musical sounds, with only a minority of themfocusing exclusively on environmental sounds (3 items in eachsubscale; e.g., the sound of gentle rain). The BAIS has appropriatepsychometric properties, including high internal reliability, a
coherent factor structure, and no association with social desir-ability (Halpern 2015). It has been used in behavioral (Pfordresherand Halpern 2013; Gelding et al. 2015) and fMRI studies (Zatorreet al. 2010; Herholz et al. 2012).
To assess visual imagery, we used the Vividness of Visual Im-agery Questionnaire (VVIQ; Marks 1973). In this task, participantsare given 4 hypothetical scenarios and generate 4 mental imagescorresponding to different aspects of each scenario, forming 16items in total (e.g., contour of faces; color and shape of trees; at-titudes of body of a friend or relative). Responses are provided ona scale from 1 (perfectly clear and vivid as normal vision) to 5 (noimage at all), that is, lower scores correspond to higher vividness,unlike the BAIS in which the direction of the scale is reversed. Forease of interpretation, scores were inverted so that higher scorescorrespond to higher vividness both in the auditory (BAIS) andvisual domains (VVIQ). The VVIQ is the most frequently usedself-report measure of vividness of visual imagery. It has appro-priate internal reliability (Kozhevnikov et al. 2005; Campos andPérez-Fabello 2009) and correlates with brain responses duringvisual perception and imagery (Cui et al. 2007).
Auditory StimuliThe auditory stimuli used in the fMRI study consisted of 5 typesof human vocal sounds. These included vowels spoken with aneutral intonation (e.g., prolonged “a”), laughter, screams, andsounds of pleasure and disgust (retching sounds). Similar to im-agery processes, these vocal communicative signals are known toengage auditory systems, as well as sensorimotor and controlsystems involved in higher order mechanisms and social behav-ior (Warren et al. 2006; McGettigan et al. 2015). The 5 sound typeswere matched for duration (Mduration = 1018 ms; SD = 326), and 20different examples of eachwere included in the experiment (theywere generated by 8 different speakers, 4 women; for further de-tails about the stimuli, Sauter et al. 2010; Lima et al. 2013). A sixthcondition, intended as an unintelligible distractor set, consistedof sounds created byspectral rotation of a selection of the originalvocal sounds. Rotated sounds were generated by inverting thefrequency spectrum around 2 kHz, using a digital version ofthe simple modulation technique described by Blesser (1972).The acoustic signal was first equalized with a filter (essentiallyhigh-pass) that gave the rotated signal approximately thesame long-term spectrum as the original. This equalizing filter(33-point finite impulse response [FIR]) was constructed basedon measurements of the long-term average spectrum of speech(Byrne et al. 1994), although the roll-off below 120 Hzwas ignored,and a flat spectrum below 420 Hz was assumed (Scott, Rosen,et al. 2009; Green et al. 2013). The equalized signal was then amp-litude modulated by a sinusoid at 4 kHz, followed by low-passfiltering at 3.8 kHz. Spectral rotation retains the acoustic com-plexity of human sounds while rendering them unintelligible.Rotated sounds are used in numerous imaging studies of vocali-zations and speech perception (Scott et al. 2000; Narain et al.2003; Warren et al. 2006; Okada et al. 2010; Evans et al. 2014).
MRI Acquisition and data Processing
MRI data were acquired using a 32-channel birdcage headcoil ona Siemens 1.5-T Sonata MRI scanner (SiemensMedical, Erlangen,Germany). High-resolution anatomical images were acquiredusing aT1-weightedmagnetizationprepared rapid acquisition gra-dient echo sequence (repetition time = 2730 ms, echo time = 3.57ms, flip angle = 7°, slice thickness = 1 mm, 160 sagittal slices,acquisition matrix = 256 × 224 × 160 mm, voxel size = 1 mm3).Echo-planar fMRI images were acquired with repetition time= 9 s,
4640 | Cerebral Cortex, 2015, Vol. 25, No. 11
by guest on January 24, 2017http://cercor.oxfordjournals.org/
Dow
nloaded from
TA= 3 s, echo time = 50ms, flip angle = 90°, 35 axial slices, 3 mm3
in-plane resolution, using a sparse-sampling routine in whichsounds were presented in the silent gap between brain acquisi-tions (Hall et al. 1999).
Voxel-Based MorphometryThe structural imageswere subjected to VBM, as implemented inSPM8 (Wellcome Trust Centre for Neuroimaging, UK). SPM8 pro-vides an integrated routine that combines segmentation into dif-ferent tissue classes, bias correction, and spatial normalization inthe same model (New Segment). After being re-oriented into astandard space (viamanual alignment along the anterior–poster-ior commissure), each participant’s T1-weighted image was seg-mented into gray matter, white matter, and cerebrospinal fluid.Diffeomorphic Anatomical Registration was performed throughexponentiated lie algebra (DARTEL) for nonlinear intersubjectregistration of the gray and white matter images (Ashburner2007). This involves iterativelymatching the images to a templategenerated from their ownmean, that is, sample-specific gray andwhite matter templates were generated.
Because we were interested in differences across subjects inthe absolute “amount” (volume) of gray matter, the spatial nor-malization step was implemented with modulation in order topreserve the total amount of graymatter signal in the normalizedpartitions. This is necessaryas the process of normalizing imagesintroduces volumetric changes in brain regions; for the structuralimages to be aligned andmatched across subjects, expansions, orcontractions may be needed due to individual differences inbrain structure. To account for the amount of expansion and con-traction, themodulation step adjusts the normalized graymattervalues bymultiplying by its relative volume before and after spa-tial normalization (e.g., if a participant’s temporal lobe doubles involume during normalization, the correctionwill halve the inten-sity of the signal in this region; Mechelli et al. 2005). The resultingvalues at each voxel thus denote the absolute amount of tissuethat is gray matter at that location, after having adjusted for theconfounding effects of nonlinear warping. While an analysisbased on modulated data (implemented in the current study)tests for variability in the amount of gray matter, an analysiswithout modulation tests for variability in “concentration” ofgray matter (Ashburner and Friston 2000; Mechelli et al. 2005).Finally, the images were transformed to Montreal NeurologicalInstitute (MNI) stereotactic space (voxel size = 1.5 mm3), andsmoothed using a 10 mm full-width half-maximum (FWHM) iso-tropic Gaussian kernel. VBMprovides amixedmeasure of corticalsurface (or cortical folding) as well as cortical thickness, unlikesurface-based approaches, that emphasize measures of thick-ness derived from geometric models of the cortical surface (e.g.,Hutton et al. 2009). Further work is needed to specify the exactcellular basis of local differences in the amount of gray matteras measured by VBM. However, these are assumed to potentiallyreflect variability in the number and size of neurons or glia, or inaxonal architecture (May and Gaser 2006; Kanai and Rees 2011).
Multiple regressions were conducted on the smoothed graymatter images. At thewhole-brain level, per-participant auditoryimagery scores were entered into a general linear model, includ-ing age, gender, total gray matter volume (Peelle et al. 2012),short-term memory, and years of musical training as nuisancevariables in the design matrix to regress out any potential con-founding effects related to them. Musical training was includedbecause this has been shown to correlate with vividness of audi-tory imagery (Pfordresher and Halpern 2013), with the acuity ofmental auditory images in performance-based tasks (Janataand Paroo 2006; Navarro-Cebrian and Janata 2010a,2010b), as
well as with differences in brain structure (Gaser and Schlaug2003). Regressing out variability in short-termmemory is import-ant to ensure that correlations between imagery and gray mattercannot be attributed to nonspecific factors linked to general cog-nitive functioning. While a memory componentmay be involvedin imagery (e.g., Navarro-Cebrian and Janata 2010b), the need tocontrol for the general cognitive demands of the tasks has beenhighlighted (Halpern et al. 2004; Zatorre and Halpern 2005), andthis is of special relevance in the context of an off-line self-reportmeasure as the one used here. Any voxels showing gray matterintensity <0.05 were excluded using an absolutemasking thresh-old to avoid possible edge effects around the border between graymatter and white matter. Statistical maps were thresholded atP < 0.005 peak-level uncorrected, cluster corrected with a fam-ily-wise error (FWE) correction at P < 0.05, while accounting fornonstationary correction (Ridgway et al. 2008). In addition towhole-brain analysis, more sensitive region of interest (ROI) ana-lyses were conducted within regions for which we had a priorihypotheses, based on a recent activation likelihood estimationmeta-analysis of fMRI studies of imagery across modalities(McNorgan 2012). We covered 2 networks identified by thismeta-analysis, one derived from auditory imagery studies only(8 studies), and the other one from studies involving imageryacross multiple modalities (65 studies). When a region wasreported in both networks, we choose the coordinate of the audi-tory-specific one. Table 1 presents the list of ROIs and corre-sponding MNI coordinates. Statistical significance within theseROIs was assessed using small volume correction (Worsleyet al. 1996) at a threshold of P < 0.05 (FWE corrected), withinspheres with 12 mm radius centered at each of the coordinates.
fMRI Procedure and AnalysesFunctional and structural data were acquired on the same day.Participants were told that they would hear different kinds ofsounds, and that they should listen attentively to them. They lis-tened passively to the sounds and were asked to perform a vigi-lance task consisting of pressing a button every time a “beep”waspresented. The sounds were presented in 2 runs of 140 echo-pla-nar whole-brain volumes; each run lasted 21 min. The first 3 vo-lumes from each run were discarded to allow longitudinalmagnetization to reach equilibrium. Auditory onsets occurred5.5 s (±0.5 s jitter) before the beginning of the following whole-brain volume acquisition. On each trial, participants listened to2 randomly selected sounds of the same type. The sounds werepresented in a pseudo-randomized order for each participant,and we ensured that no more than 3 trials of the same typewere consecutively presented. All 120 sounds were presentedtwice per run (plus 9 vigilance and 8 rest/silence trials per run).Sounds were presented using Psychtoolbox (Brainard 1997) viaa Sony STR-DH510 digital AV control center (Sony, Basingstoke,UK) and MRI-compatible insert earphones (Sensimetrics Corpor-ation, Malden, MA, USA).
Data were analyzed using SPM8. Functional images were rea-ligned to the first image, unwarped, co-registered to the struc-tural image, and spatially normalized to MNI space using theparameters acquired from segmentation (Ashburner and Friston2005); they were resampled to 2-mm3 voxels and smoothed witha 10-mm FWHM Gaussian kernel. The hemodynamic responsewas modeled using a first-order FIR filter with a window lengthequal to the time taken to acquire a single volume. At the firstlevel, the 5 types of vocal sounds, the unintelligible rotatedsounds, and the vigilance trials (and 6 movement regressors ofno interest) were entered into a general linear model. The rest/silence trials were used as an implicit baseline. At the second
Auditory Imagery and Brain Structure Lima et al. | 4641
by guest on January 24, 2017http://cercor.oxfordjournals.org/
Dow
nloaded from
level, a one-way repeated-measures analysis of variance(ANOVA) was conducted using contrast images from the firstlevel to identify brain regions in which the magnitude of re-sponses varied as a function of the type of human vocalization;separate contrast images for each of the 5 types of intelligiblesounds versus rest baseline were entered in this model (for asimilar approach, Warren et al. 2006). The results are presentedat an uncorrected threshold of P < 0.005 peak level, with nonsta-tionary correction of P < 0.05 at cluster level for the whole-brainanalysis.
To examine whether the neural systems involved in imageryco-localize with those involved in auditory processing, ROI ana-lyses were conducted focusing on the regions shown to predictauditory imagery in the VBM study (at whole-brain and ROIlevels); small volume correction was used at a threshold ofPFWE < 0.05, within spheres with 12 mm radius, centered at thepeak of the clusters. Among these ROIs, when the one-wayrepeated-measures ANOVA revealed an effect, a more sensitivemultivariate Representational Similarity Analysis was also con-ducted (Kriegeskorte et al. 2008). This analysis was conductedto directly explorewhether there is an association between inter-individual differences in the specificity of neural representationsof heard vocal sounds and variation in self-report auditoryimagery ratings. This was achieved by extracting data from thewhole-brain t-statistic maps of each of the 5 types of intelligiblevocal sounds relative to the resting baseline, and Pearson prod-uct-moment correlating these maps with each other. We usedt-maps because, as they combine the effect size weighted byerror variance for a modeled response, they provide higherclassification accuracy in multivariate analyses; results are notunduly influenced by large, but highly variable response esti-mates (Misaki et al. 2010). In each participant, the correlationcoefficients reflecting the relationship between neural responses
to each of the 5 conditions with every other condition wereconverted to a z value using a Fisher transformation so as to con-form to statistical assumptions (normality) required for paramet-ric statistical tests. These values were averaged to provide asummary statistic for each participant, a higher value reflectinghigher similarity between neural responses, that is, lower dis-crimination between conditions; and a lower value reflectinglower similarity between neural responses, that is, higherdiscrimination between conditions or more distinct representa-tions. These values were then Pearson product-moment corre-lated with ratings of auditory imagery.
ResultsNeuroanatomical Predictors of Individual Differencesin Auditory Imagery
There were large individual differences in auditory imagery rat-ings: For the total imagery scale, ratings ranged between 2.5and 7 (M= 5.12; SD = 0.87); on the Vividness subscale, they rangedbetween 2.86 and 7 (M = 4.96; SD = 0.95); and on the Control sub-scale, they ranged between 2 and 7 (M= 5.28; SD = 0.95). Consist-ent with previous evidence (Pfordresher and Halpern 2013),vividness and control of imagery were highly correlated witheach other (r = 0.68, P < 0.001). No significant associations werefound between imagery and age (total imagery scale, r = −0.18,P = 0.13; vividness subscale, r = −0.14, P = 0.25; control subscale,r =−0.19, P = 0.11), suggesting that these processes are relativelystable across the adult life span. Shapiro–Wilk tests confirmedthat the ratings were normally distributed (P’s > 0.13).
The goal of this experiment was to determine whether indi-vidual differences in how people perceive auditory images canbe predicted from differences in brain morphology. A first
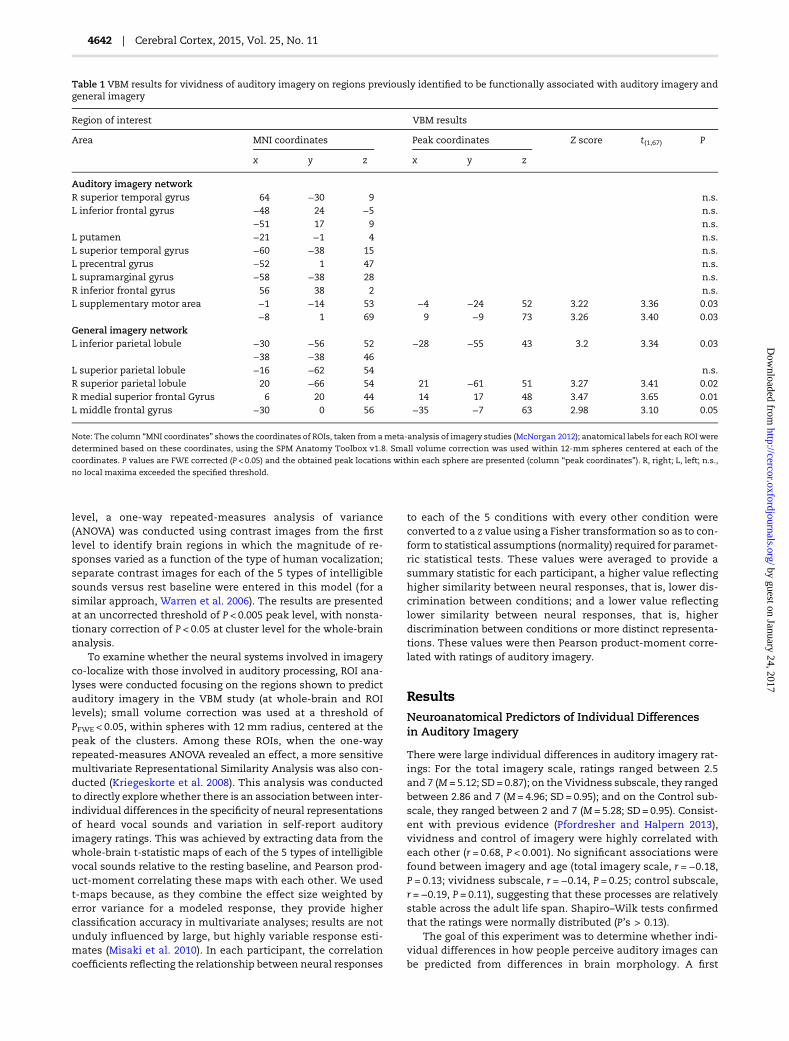
Table 1 VBM results for vividness of auditory imagery on regions previously identified to be functionally associated with auditory imagery andgeneral imagery
Region of interest VBM results
Area MNI coordinates Peak coordinates Z score t(1,67) P
x y z x y z
Auditory imagery networkR superior temporal gyrus 64 −30 9 n.s.L inferior frontal gyrus −48 24 −5 n.s.
−51 17 9 n.s.L putamen −21 −1 4 n.s.L superior temporal gyrus −60 −38 15 n.s.L precentral gyrus −52 1 47 n.s.L supramarginal gyrus −58 −38 28 n.s.R inferior frontal gyrus 56 38 2 n.s.L supplementary motor area −1 −14 53 −4 −24 52 3.22 3.36 0.03
−8 1 69 9 −9 73 3.26 3.40 0.03General imagery networkL inferior parietal lobule −30 −56 52 −28 −55 43 3.2 3.34 0.03
−38 −38 46L superior parietal lobule −16 −62 54 n.s.R superior parietal lobule 20 −66 54 21 −61 51 3.27 3.41 0.02R medial superior frontal Gyrus 6 20 44 14 17 48 3.47 3.65 0.01L middle frontal gyrus −30 0 56 −35 −7 63 2.98 3.10 0.05
Note: The column “MNI coordinates” shows the coordinates of ROIs, taken from ameta-analysis of imagery studies (McNorgan 2012); anatomical labels for each ROI were
determined based on these coordinates, using the SPM Anatomy Toolbox v1.8. Small volume correction was used within 12-mm spheres centered at each of the
coordinates. P values are FWE corrected (P < 0.05) and the obtained peak locations within each sphere are presented (column “peak coordinates”). R, right; L, left; n.s.,
no local maxima exceeded the specified threshold.
4642 | Cerebral Cortex, 2015, Vol. 25, No. 11
by guest on January 24, 2017http://cercor.oxfordjournals.org/
Dow
nloaded from

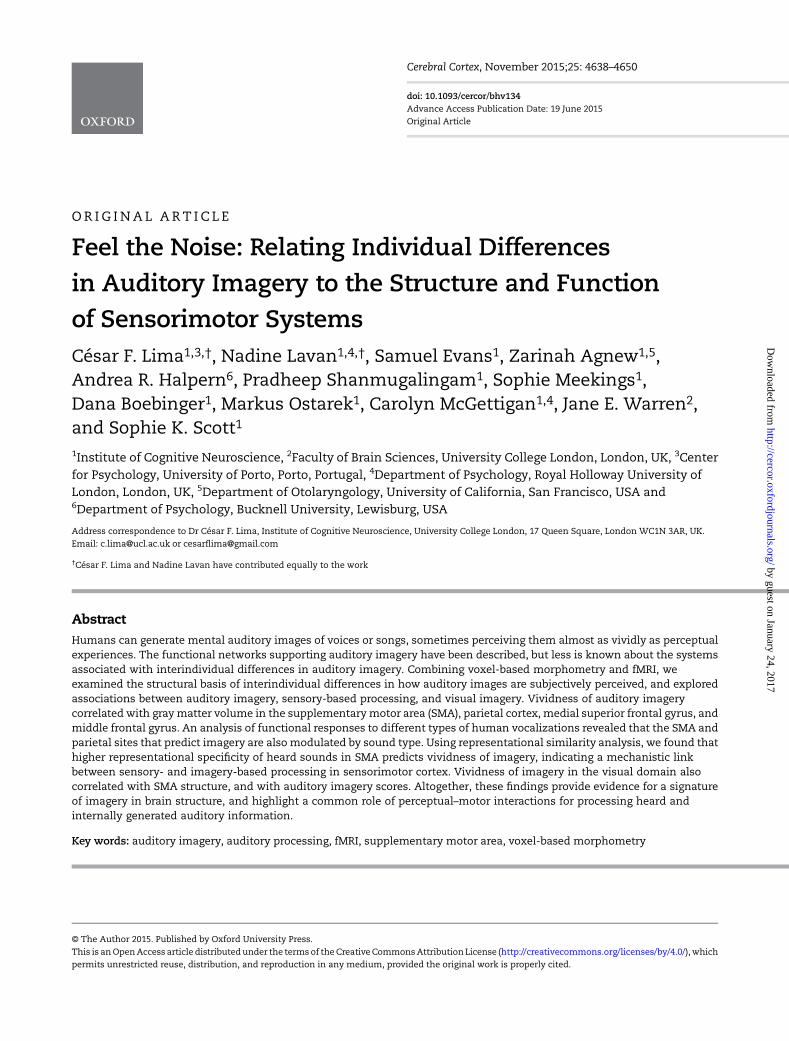
whole-brain analysis focusing on the total imagery ratings (aver-age of the 2 scales) revealed that higher ratings correlated withlarger gray matter volume in a cluster with a peak voxel in theleft paracentral lobule, extending to the right paracentral lobule,left precuneus, and left superior frontal gyrus (cluster size = 3369voxels, PFWE = 0.03; MNI coordinate for peak voxel: x =−8, y =−12,z = 69, t(1,67) = 3.63, Z = 3.45, P < 0.001 uncorrected). No associationswere found between higher imagery ratings and decreased graymatter (for the negative contrast, lowest PFWE = 0.43). To directlyinvestigate the structural predictors of each of the 2 auditory im-agery components, whole-brain analyseswere also conducted onvividness and control ratings separately (we refrained from in-cluding the 2 subscales in the same design matrix because theywere very highly correlated with each other). For individual dif-ferences in control of imagery, no clusters survived correction, ei-ther for positive or for negative correlations (lowest PFWE = 0.26).For vividness of imagery, on the other hand, a positive correlationwas found with regional gray matter volume in a cluster witha peak voxel situated within the left SMA, extending to theleft and right paracentral lobules (cluster size = 3531 voxels, PFWE
= 0.03; MNI coordinate for peak voxel: x = −6, y = −13, z = 67,t(1,67) = 3.57, Z = 3.40, P < 0.001). This cluster is shown in Figure 1,along with a scatterplot between graymatter residuals and vivid-ness scores (r = 0.46, P < 0.001). No results were found for negativecorrelations (lowest PFWE = 0.84). We extracted gray matter resi-duals within this SMA cluster and observed that the correlationwith higher vividness of imagery remained significant after re-gressing out variability accounted for by the other subscale,control of imagery (partial correlation, r = 0.34, P = 0.003). Thisindicates that the role of this structure for vividness of imagerycannot be reduced to nonspecific factors (e.g., confidence of par-ticipants in their judgments or temporal processing), as thesewould be similarly engaged across subscales.
ROI analyses, using small volume correction, were also con-ducted within regions hypothesized to be involved in auditoryand domain general imagery generation, as identified by a recentmeta-analysis of fMRI studies of imagery (McNorgan 2012). Wefound positive correlations between gray matter volume and
vividness of auditory imagery within 5 ROIs. Two of them arepart of the auditory imagery network, and they partly overlapwith the SMA cluster revealed by the more conservative whole-brain analysis (see Table 1 for full anatomical and statistical de-tails). The other three are part of the general imagery network:one in left inferior parietal lobule, one in right medial superiorfrontal gyrus, and one in left middle frontal gyrus. Additionally,a negative correlation was found between vividness of auditoryimagery and the amount of graymatter in the right superior par-ietal lobule. Similar analyses focusing on control of imageryratings revealed a marginally significant association betweenhigher control and increased gray matter volume within theleft SMA ROI (MNI coordinate for peak voxel within ROI: x =−11,y =−9, z = 72, t(1,67) = 3.11, Z = 3, PFWE = 0.05), and a negative associ-ation in the rightmedial superior frontal gyrus ROI (MNI coordin-ate for peak voxel within ROI: x = 6, y = 15, z = 33, t(1,67) = 3.12,Z = 3.01, PFWE = 0.05).
Functional Responses to Heard Auditory Information
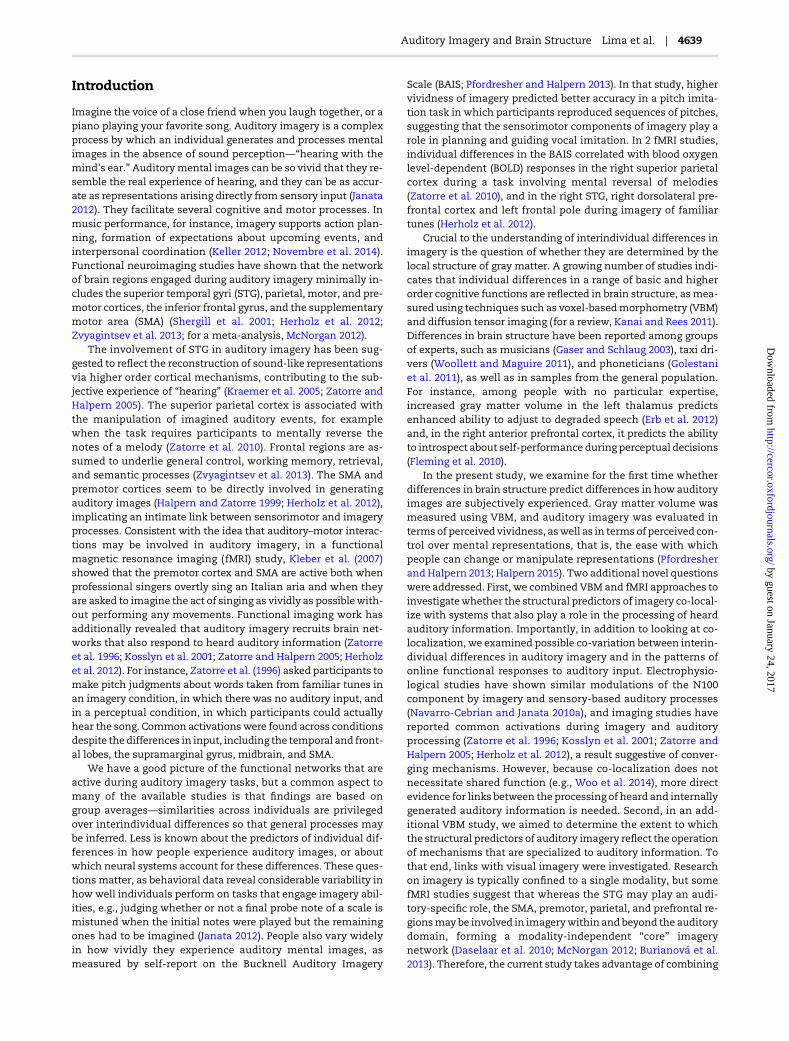
In thewhole-brain analysis, significantmodulations of neural re-sponses as a function of sound type were found in a number ofbrain regions, shown in Figure 2 and listed in Table 2. Consistentwith earlier work using similar stimuli (e.g., Warren et al. 2006;McGettigan et al. 2015), activations were largely bilateral and in-cluded the STG, precentral and prefrontal cortices, parietal re-gions, cuneus and precuneus, insula, and thalamus.
To assesswhether regions involved in auditory imagery co-lo-calized with those involved in the processing of heard auditoryinformation, analyses were conducted looking at hemodynamicresponseswithin the clusters inwhich graymatter volume corre-lated with vividness imagery ratings in the main VBM study.Using small volume correction, we found that the left SMA (clus-ter presented in Fig. 1) shows significantmodulation of theneuralresponse as a function of sound type (MNI coordinate for peakvoxel: x =−8, y =−2, z = 62, F(4,220) = 5.51, Z = 3.43, PFWE = 0.03), sug-gesting that this region plays a role in imagery and in the process-ing of heard information. Crucially, we additionally conducted a
Figure 1. Association between gray matter volume and vividness of auditory imagery. (A) Cluster with peak in left SMA showing a significant positive correlation with
vividness of auditory imagery in whole-brain analysis. Statistical maps were thresholded at P < 0.005 peak-level uncorrected, cluster corrected with a FWE correction
(P < 0.05). (B) Scatterplot showing the association between vividness ratings and adjusted gray matter volume within the cluster depicted in (A).
Auditory Imagery and Brain Structure Lima et al. | 4643
by guest on January 24, 2017http://cercor.oxfordjournals.org/
Dow
nloaded from
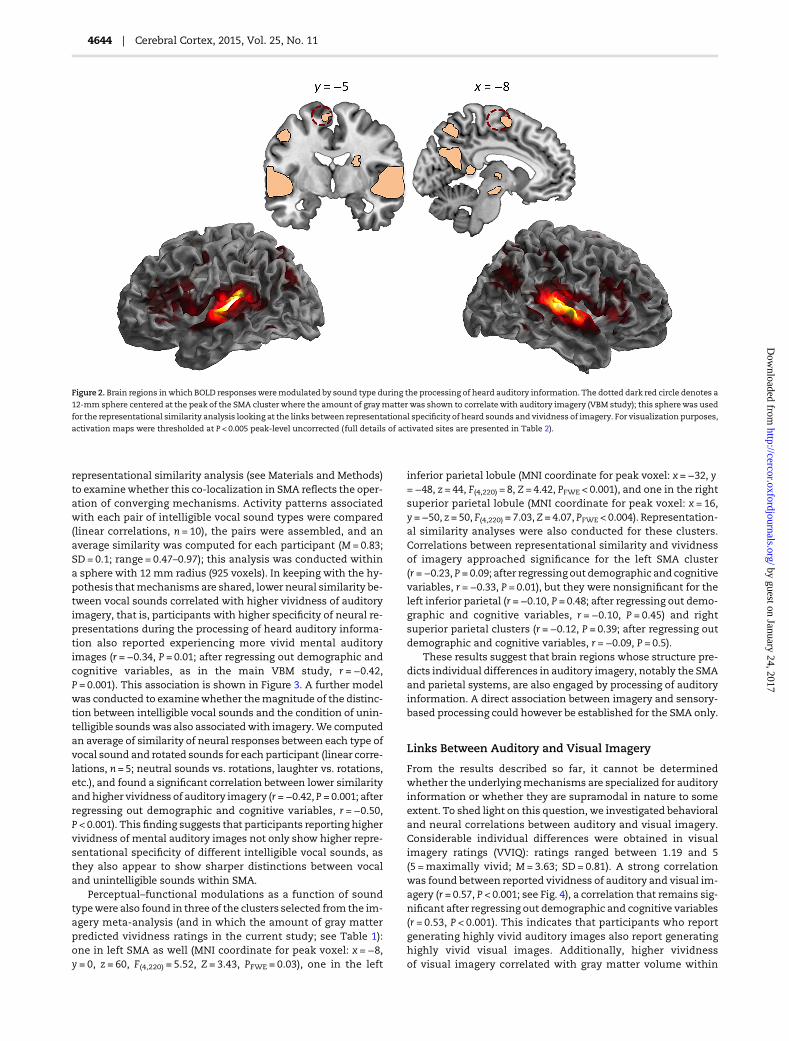
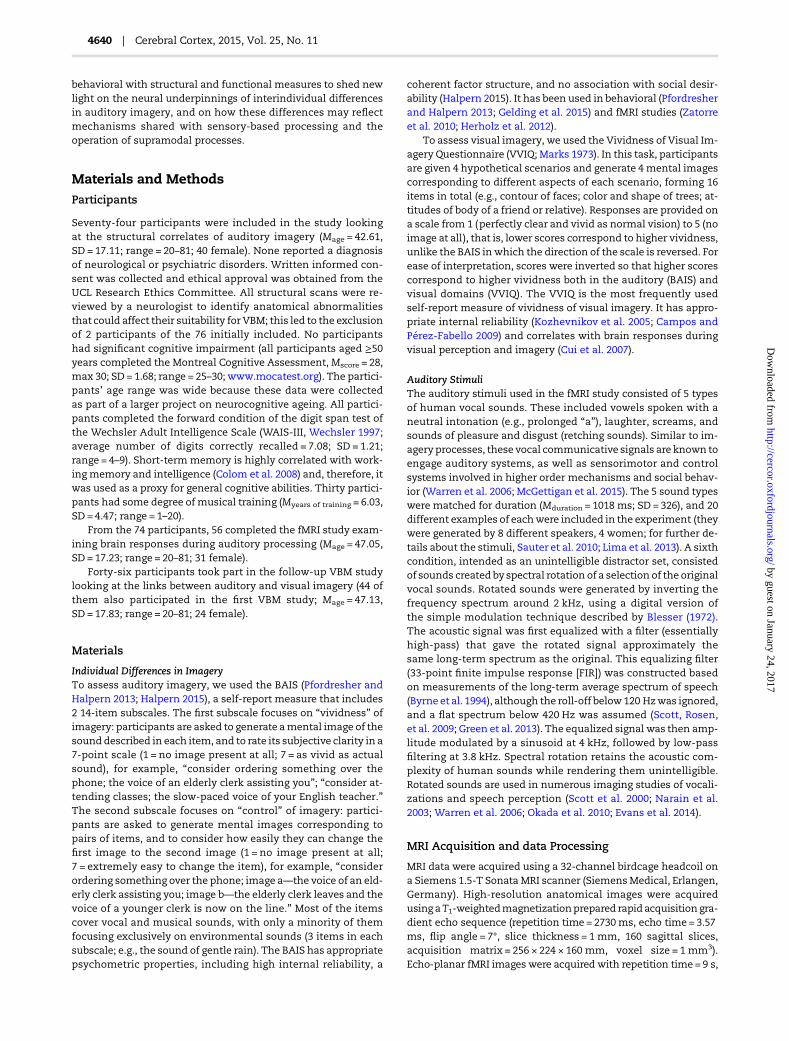
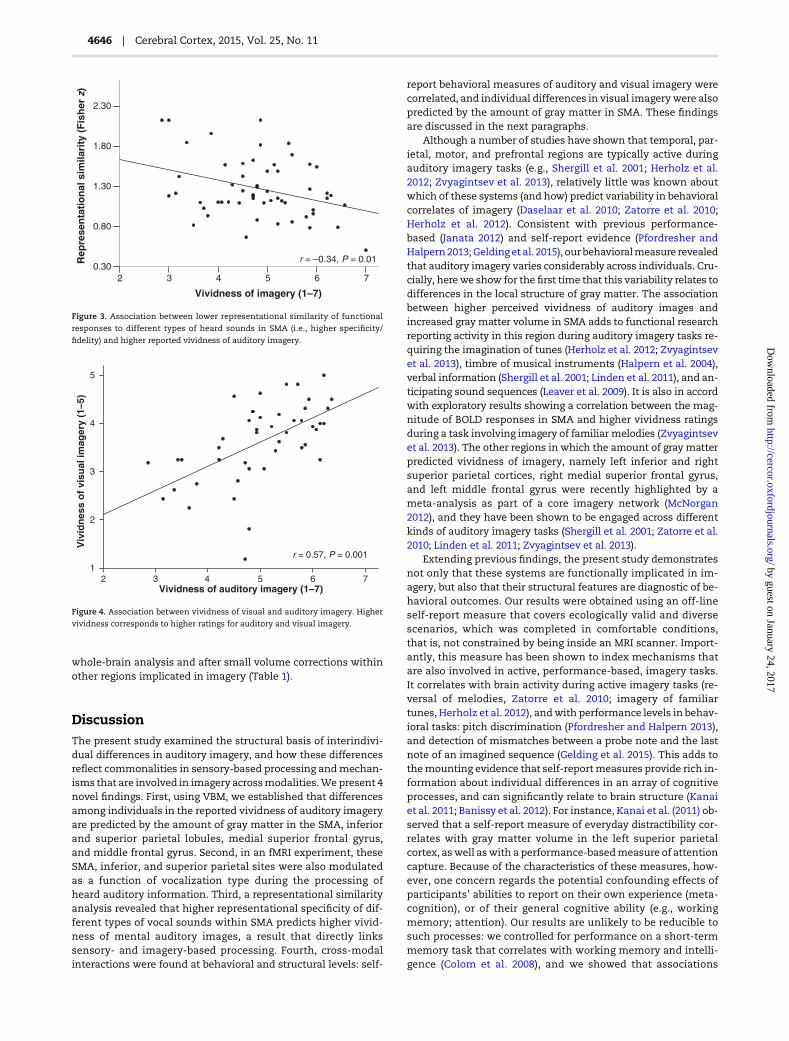
representational similarity analysis (see Materials and Methods)to examinewhether this co-localization in SMA reflects the oper-ation of converging mechanisms. Activity patterns associatedwith each pair of intelligible vocal sound types were compared(linear correlations, n = 10), the pairs were assembled, and anaverage similarity was computed for each participant (M= 0.83;SD = 0.1; range = 0.47–0.97); this analysis was conducted withina sphere with 12 mm radius (925 voxels). In keeping with the hy-pothesis thatmechanisms are shared, lower neural similarity be-tween vocal sounds correlated with higher vividness of auditoryimagery, that is, participants with higher specificity of neural re-presentations during the processing of heard auditory informa-tion also reported experiencing more vivid mental auditoryimages (r =−0.34, P = 0.01; after regressing out demographic andcognitive variables, as in the main VBM study, r = −0.42,P = 0.001). This association is shown in Figure 3. A further modelwas conducted to examinewhether themagnitude of the distinc-tion between intelligible vocal sounds and the condition of unin-telligible soundswas also associatedwith imagery.We computedan average of similarity of neural responses between each type ofvocal sound and rotated sounds for each participant (linear corre-lations, n = 5; neutral sounds vs. rotations, laughter vs. rotations,etc.), and found a significant correlation between lower similarityand higher vividness of auditory imagery (r =−0.42, P = 0.001; afterregressing out demographic and cognitive variables, r = −0.50,P < 0.001). This finding suggests that participants reporting highervividness of mental auditory images not only show higher repre-sentational specificity of different intelligible vocal sounds, asthey also appear to show sharper distinctions between vocaland unintelligible sounds within SMA.
Perceptual–functional modulations as a function of soundtypewere also found in three of the clusters selected from the im-agery meta-analysis (and in which the amount of gray matterpredicted vividness ratings in the current study; see Table 1):one in left SMA as well (MNI coordinate for peak voxel: x = −8,y = 0, z = 60, F(4,220) = 5.52, Z = 3.43, PFWE = 0.03), one in the left
inferior parietal lobule (MNI coordinate for peak voxel: x =−32, y=−48, z = 44, F(4,220) = 8, Z = 4.42, PFWE < 0.001), and one in the rightsuperior parietal lobule (MNI coordinate for peak voxel: x = 16,y =−50, z = 50, F(4,220) = 7.03, Z = 4.07, PFWE < 0.004). Representation-al similarity analyses were also conducted for these clusters.Correlations between representational similarity and vividnessof imagery approached significance for the left SMA cluster(r =−0.23, P = 0.09; after regressing out demographic and cognitivevariables, r =−0.33, P = 0.01), but they were nonsignificant for theleft inferior parietal (r =−0.10, P = 0.48; after regressing out demo-graphic and cognitive variables, r = −0.10, P = 0.45) and rightsuperior parietal clusters (r = −0.12, P = 0.39; after regressing outdemographic and cognitive variables, r =−0.09, P = 0.5).
These results suggest that brain regions whose structure pre-dicts individual differences in auditory imagery, notably the SMAand parietal systems, are also engaged by processing of auditoryinformation. A direct association between imagery and sensory-based processing could however be established for the SMA only.
Links Between Auditory and Visual Imagery
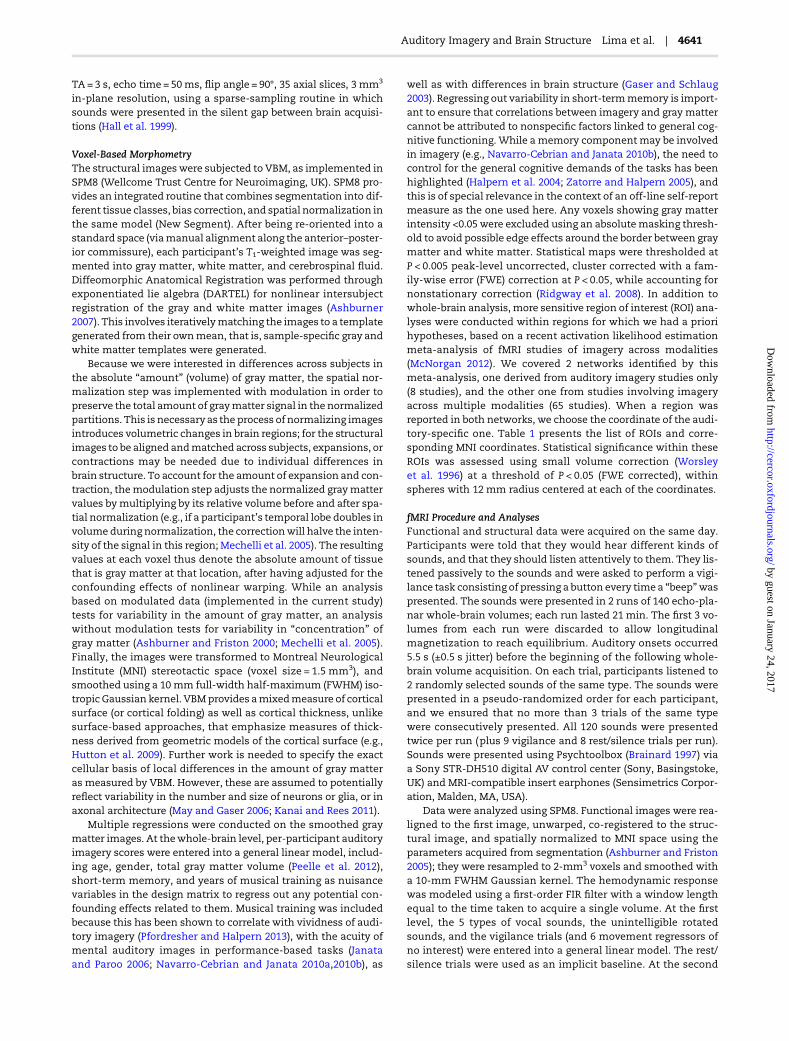
From the results described so far, it cannot be determinedwhether the underlyingmechanisms are specialized for auditoryinformation or whether they are supramodal in nature to someextent. To shed light on this question, we investigated behavioraland neural correlations between auditory and visual imagery.Considerable individual differences were obtained in visualimagery ratings (VVIQ): ratings ranged between 1.19 and 5(5 =maximally vivid; M= 3.63; SD = 0.81). A strong correlationwas found between reported vividness of auditory and visual im-agery (r = 0.57, P < 0.001; see Fig. 4), a correlation that remains sig-nificant after regressing out demographic and cognitive variables(r = 0.53, P < 0.001). This indicates that participants who reportgenerating highly vivid auditory images also report generatinghighly vivid visual images. Additionally, higher vividnessof visual imagery correlated with gray matter volume within
Figure 2. Brain regions in which BOLD responsesweremodulated by sound type during the processing of heard auditory information. The dotted dark red circle denotes a
12-mm sphere centered at the peak of the SMA cluster where the amount of graymatter was shown to correlate with auditory imagery (VBM study); this spherewas used
for the representational similarity analysis looking at the links between representational specificity of heard sounds and vividness of imagery. For visualization purposes,
activation maps were thresholded at P < 0.005 peak-level uncorrected (full details of activated sites are presented in Table 2).
4644 | Cerebral Cortex, 2015, Vol. 25, No. 11
by guest on January 24, 2017http://cercor.oxfordjournals.org/
Dow
nloaded from
the SMA cluster previously shown to correlate with vividness ofauditory imagery (in the whole-brain VBM analysis, Fig. 1; MNIcoordinate for peak voxel: x = 4, y = −12, z = 72, t(1,39) = 3.25,Z = 3.04, PFWE = 0.048). To investigate whether this associationreflects unique variance associated with visual imagery (i.e.,
independent of auditory imagery), we correlated gray matter re-siduals with visual imagery while regressing out variability invividness of auditory imagery; the partial correlation coefficientwas not significant (r = 0.03, P = 0.82). No other associationsbetween gray matter and visual imagery were found, both in
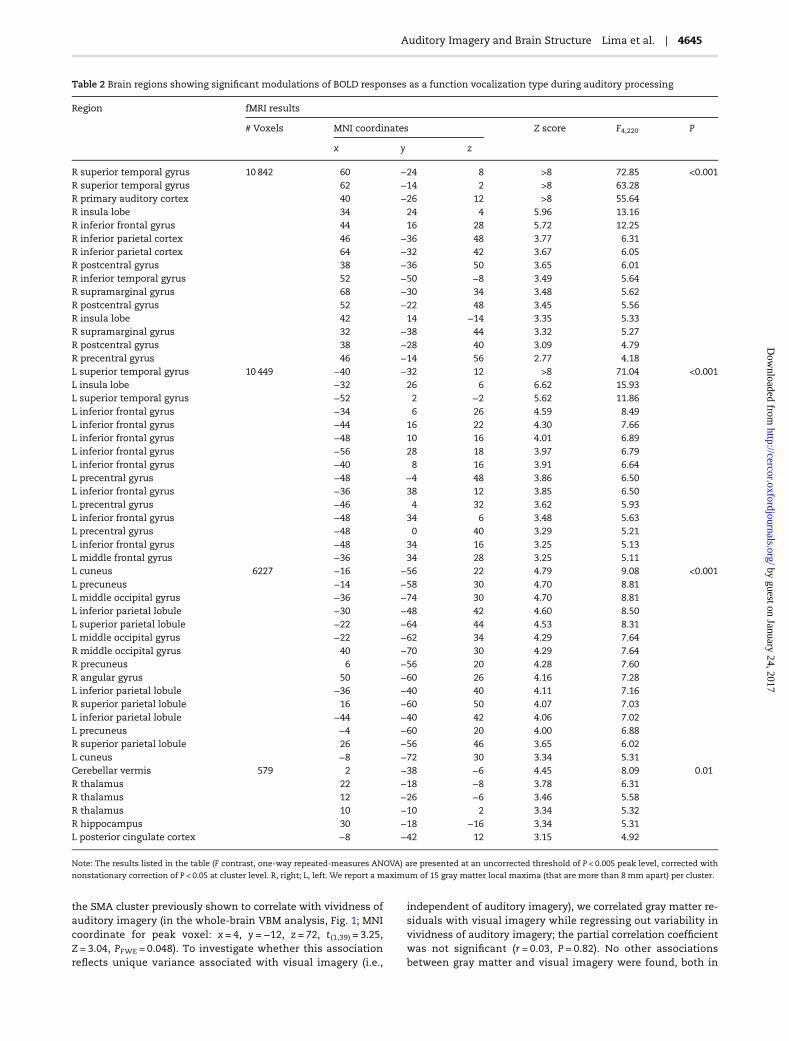
Table 2 Brain regions showing significant modulations of BOLD responses as a function vocalization type during auditory processing
Region fMRI results
# Voxels MNI coordinates Z score F4,220 P
x y z
R superior temporal gyrus 10 842 60 −24 8 >8 72.85 <0.001R superior temporal gyrus 62 −14 2 >8 63.28R primary auditory cortex 40 −26 12 >8 55.64R insula lobe 34 24 4 5.96 13.16R inferior frontal gyrus 44 16 28 5.72 12.25R inferior parietal cortex 46 −36 48 3.77 6.31R inferior parietal cortex 64 −32 42 3.67 6.05R postcentral gyrus 38 −36 50 3.65 6.01R inferior temporal gyrus 52 −50 −8 3.49 5.64R supramarginal gyrus 68 −30 34 3.48 5.62R postcentral gyrus 52 −22 48 3.45 5.56R insula lobe 42 14 −14 3.35 5.33R supramarginal gyrus 32 −38 44 3.32 5.27R postcentral gyrus 38 −28 40 3.09 4.79R precentral gyrus 46 −14 56 2.77 4.18L superior temporal gyrus 10 449 −40 −32 12 >8 71.04 <0.001L insula lobe −32 26 6 6.62 15.93L superior temporal gyrus −52 2 −2 5.62 11.86L inferior frontal gyrus −34 6 26 4.59 8.49L inferior frontal gyrus −44 16 22 4.30 7.66L inferior frontal gyrus −48 10 16 4.01 6.89L inferior frontal gyrus −56 28 18 3.97 6.79L inferior frontal gyrus −40 8 16 3.91 6.64L precentral gyrus −48 −4 48 3.86 6.50L inferior frontal gyrus −36 38 12 3.85 6.50L precentral gyrus −46 4 32 3.62 5.93L inferior frontal gyrus −48 34 6 3.48 5.63L precentral gyrus −48 0 40 3.29 5.21L inferior frontal gyrus −48 34 16 3.25 5.13L middle frontal gyrus −36 34 28 3.25 5.11L cuneus 6227 −16 −56 22 4.79 9.08 <0.001L precuneus −14 −58 30 4.70 8.81L middle occipital gyrus −36 −74 30 4.70 8.81L inferior parietal lobule −30 −48 42 4.60 8.50L superior parietal lobule −22 −64 44 4.53 8.31L middle occipital gyrus −22 −62 34 4.29 7.64R middle occipital gyrus 40 −70 30 4.29 7.64R precuneus 6 −56 20 4.28 7.60R angular gyrus 50 −60 26 4.16 7.28L inferior parietal lobule −36 −40 40 4.11 7.16R superior parietal lobule 16 −60 50 4.07 7.03L inferior parietal lobule −44 −40 42 4.06 7.02L precuneus −4 −60 20 4.00 6.88R superior parietal lobule 26 −56 46 3.65 6.02L cuneus −8 −72 30 3.34 5.31Cerebellar vermis 579 2 −38 −6 4.45 8.09 0.01R thalamus 22 −18 −8 3.78 6.31R thalamus 12 −26 −6 3.46 5.58R thalamus 10 −10 2 3.34 5.32R hippocampus 30 −18 −16 3.34 5.31L posterior cingulate cortex −8 −42 12 3.15 4.92
Note: The results listed in the table (F contrast, one-way repeated-measures ANOVA) are presented at an uncorrected threshold of P < 0.005 peak level, corrected with
nonstationary correction of P < 0.05 at cluster level. R, right; L, left. We report a maximum of 15 gray matter local maxima (that are more than 8 mm apart) per cluster.
Auditory Imagery and Brain Structure Lima et al. | 4645
by guest on January 24, 2017http://cercor.oxfordjournals.org/
Dow
nloaded from
whole-brain analysis and after small volume corrections withinother regions implicated in imagery (Table 1).
DiscussionThe present study examined the structural basis of interindivi-dual differences in auditory imagery, and how these differencesreflect commonalities in sensory-based processing andmechan-isms that are involved in imagery acrossmodalities.We present 4novel findings. First, using VBM, we established that differencesamong individuals in the reported vividness of auditory imageryare predicted by the amount of gray matter in the SMA, inferiorand superior parietal lobules, medial superior frontal gyrus,and middle frontal gyrus. Second, in an fMRI experiment, theseSMA, inferior, and superior parietal sites were also modulatedas a function of vocalization type during the processing ofheard auditory information. Third, a representational similarityanalysis revealed that higher representational specificity of dif-ferent types of vocal sounds within SMA predicts higher vivid-ness of mental auditory images, a result that directly linkssensory- and imagery-based processing. Fourth, cross-modalinteractions were found at behavioral and structural levels: self-
report behavioral measures of auditory and visual imagery werecorrelated, and individual differences in visual imagerywere alsopredicted by the amount of gray matter in SMA. These findingsare discussed in the next paragraphs.
Although a number of studies have shown that temporal, par-ietal, motor, and prefrontal regions are typically active duringauditory imagery tasks (e.g., Shergill et al. 2001; Herholz et al.2012; Zvyagintsev et al. 2013), relatively little was known aboutwhich of these systems (and how) predict variability in behavioralcorrelates of imagery (Daselaar et al. 2010; Zatorre et al. 2010;Herholz et al. 2012). Consistent with previous performance-based (Janata 2012) and self-report evidence (Pfordresher andHalpern2013;Gelding et al. 2015), ourbehavioralmeasure revealedthat auditory imagery varies considerably across individuals. Cru-cially, herewe show for the first time that this variability relates todifferences in the local structure of gray matter. The associationbetween higher perceived vividness of auditory images andincreased gray matter volume in SMA adds to functional researchreporting activity in this region during auditory imagery tasks re-quiring the imagination of tunes (Herholz et al. 2012; Zvyagintsevet al. 2013), timbre of musical instruments (Halpern et al. 2004),verbal information (Shergill et al. 2001; Linden et al. 2011), and an-ticipating sound sequences (Leaver et al. 2009). It is also in accordwith exploratory results showing a correlation between the mag-nitude of BOLD responses in SMA and higher vividness ratingsduring a task involving imagery of familiar melodies (Zvyagintsevet al. 2013). The other regions in which the amount of gray matterpredicted vividness of imagery, namely left inferior and rightsuperior parietal cortices, right medial superior frontal gyrus,and left middle frontal gyrus were recently highlighted by ameta-analysis as part of a core imagery network (McNorgan2012), and they have been shown to be engaged across differentkinds of auditory imagery tasks (Shergill et al. 2001; Zatorre et al.2010; Linden et al. 2011; Zvyagintsev et al. 2013).
Extending previous findings, the present study demonstratesnot only that these systems are functionally implicated in im-agery, but also that their structural features are diagnostic of be-havioral outcomes. Our results were obtained using an off-lineself-report measure that covers ecologically valid and diversescenarios, which was completed in comfortable conditions,that is, not constrained by being inside an MRI scanner. Import-antly, this measure has been shown to index mechanisms thatare also involved in active, performance-based, imagery tasks.It correlates with brain activity during active imagery tasks (re-versal of melodies, Zatorre et al. 2010; imagery of familiartunes, Herholz et al. 2012), andwith performance levels in behav-ioral tasks: pitch discrimination (Pfordresher and Halpern 2013),and detection of mismatches between a probe note and the lastnote of an imagined sequence (Gelding et al. 2015). This adds tothemounting evidence that self-reportmeasures provide rich in-formation about individual differences in an array of cognitiveprocesses, and can significantly relate to brain structure (Kanaiet al. 2011; Banissy et al. 2012). For instance, Kanai et al. (2011) ob-served that a self-report measure of everyday distractibility cor-relates with gray matter volume in the left superior parietalcortex, aswell aswith a performance-basedmeasure of attentioncapture. Because of the characteristics of these measures, how-ever, one concern regards the potential confounding effects ofparticipants’ abilities to report on their own experience (meta-cognition), or of their general cognitive ability (e.g., workingmemory; attention). Our results are unlikely to be reducible tosuch processes: we controlled for performance on a short-termmemory task that correlates with working memory and intelli-gence (Colom et al. 2008), and we showed that associations
Vividness of imagery (1–7)
76
r = –0.34, P = 0.01
5432
Rep
rese
nta
tio
nal
sim
ilari
ty (
Fis
her
z)
2.30
1.80
1.30
0.80
0.30
Figure 3. Association between lower representational similarity of functional
responses to different types of heard sounds in SMA (i.e., higher specificity/
fidelity) and higher reported vividness of auditory imagery.
Vividness of auditory imagery (1–7)765432
Viv
idn
ess
of
visu
al im
ager
y (1
–5)
5
4
3
2
1
r = 0.57, P = 0.001
Figure 4. Association between vividness of visual and auditory imagery. Higher
vividness corresponds to higher ratings for auditory and visual imagery.
4646 | Cerebral Cortex, 2015, Vol. 25, No. 11
by guest on January 24, 2017http://cercor.oxfordjournals.org/
Dow
nloaded from
between vividness and brain structure remain significant afteraccounting for responses on the other BAIS subscale focusingon control of imagery, whichwould load on the same nonspecificmetacognitive factors. Moreover, the ability to introspect aboutself-performance correlates with gray matter volume in theright anterior prefrontal cortex (Fleming et al. 2010), a region in-volved in high-level control of cognition and in the integration ofperceptual information with decision output. This region doesnot overlap with those identified here.
It was unexpected thatwe did not find an association betweenauditory imagery and the structure of STG, even after small vol-ume correction. Auditory association areas were previouslyfound to be more strongly activated during auditory versusothers forms of imagery (Zvyagintsev et al. 2013), and they havebeen assumed to support the reconstruction of auditory-like re-presentations (Janata 2001; Kraemer et al. 2005; Lange 2009;Navarro-Cebrian and Janata 2010a). It was further reported thatthe magnitude of BOLD responses within these areas predictsvividness ratings during imagery (Daselaar et al. 2010; Herholzet al. 2012; Zvyagintsev et al. 2013), even though this finding isnot always replicated (Leaver et al. 2009). Our null result doesnot weaken thewell-established idea that STG plays a functionalrole for auditory imagery, but it suggests that macroscopic graymatter differences in this region are not a source of interindivi-dual variability in the behavioral measure used here. This mayindicate that anterior control and sensorimotor systems have amore prominent role than posterior auditory ones for individualdifferences in imagery, or that the structural predictors partly de-pend on the specific task demands. Indeed, there is fMRI andelectrophysiological evidence that activity in auditory associ-ation areas is preceded and controlled by more anterior regionsduring imagery. Herholz et al. (2012) found increased connectiv-ity between STG and prefrontal areas for imagery versus percep-tion of tunes. Linden et al. (2011) showed that activity in SMAprecedes that of auditory areas during voluntary imagery, andthat this timing is impaired during hallucinations (lack of volun-tary control). In the visual domain, Borst et al. (2012) showed thatactivity in frontal regions precedes that ofmoreposterior regions,namely of occipital cortex, in a scene imagery task. In addition tobeing activated first, responses in frontal regions also predictedreaction times on the scene imagery task (consisting of judgingwhether a visually presented fragment of the scenewasmirroredor not), while other regions did not. Concerning possible task ef-fects, the self-reportmeasure used here focuses on perceived viv-idness and on the sense of control over auditory images; itremains to be seen whether individual differences in perform-ance-based imagery tasks requiring a fine-grained analysis ofsound representations would reveal a structural role of STG(e.g., judging whether a probe note is mistuned or not, Janataand Paroo 2006; Navarro-Cebrian and Janata 2010a, 2010b).
The amount of gray matter in SMA was the most robust pre-dictor of vividness of auditory imagery, an effect found bothin whole-brain analysis and in the ROI analyses based on themeta-analysis of functional studies on imagery (McNorgan2012). Supporting the hypothesis that imagery partly engagesthe network that responds to heard auditory information, wealso observed that this regionwasmodulated by vocal sound cat-egory in the fMRI study, alongwith other regions that are typical-ly engaged by intelligible vocal information, such as bilateral STG(e.g., Warren et al. 2006; Okada et al. 2010; Evans et al. 2014;McGettigan et al. 2015). Our functional results are consistentwith previous work reporting the engagement of motor systemsduring the processing of vocal information (Warren et al. 2006;McGettigan et al. 2015). We focus on vocalizations only, but
these systems seem to be recruited by complex soundsmore gen-erally (Scott, McGettigan, et al. 2009), such asmusic (Zatorre et al.2007; Herholz et al. 2012), degraded speech (Mattys et al. 2012),and sounds derived from human actions like kissing or openinga zipper (Gazzola et al. 2006). Regarding the links betweenimagined and heard information, although previous studies ob-served common activations in SMA using linguistic and musicalstimuli (Zatorre et al. 1996; Herholz et al. 2012), here we went astep further: we show co-localization across structural and func-tional levels and, crucially, we provide the first evidence for co-variation between vividness of auditory imagery and specificityof neural representations of heard auditory information withinthis region. Such an association is central to the argument thatco-localization reflects the operation of similar mechanisms.
The SMA provides a crucial link between perception and ac-tion, and its functional attributes facilitate many cognitive andmotor processes. It is involved in aspects of action includingplanning, initiation and inhibition, in learning new associationsbetween stimuli and motor responses, in cognitive control pro-cesses such as switching between motor plans, and in the pas-sive observation of grasping actions and emotional expressions(Warren et al. 2006; Kleber et al. 2007; Nachevet al. 2008;Mukamelet al. 2010). Mukamel et al. (2010) recorded single-neuron re-sponses in humans during the observation and execution ofgrasping actions and facial gestures, and found that a significantnumber of neurons in SMA responded to both conditions, reveal-ing sensorimotor properties. As for the structure of SMA, previ-ous studies demonstrated that it may vary across individuals asa function of motor learning and expertise: there is longitudinalevidence of increments in the volume of gray matter during 6weeks of learning of a complex motor task (Taubert et al. 2010),as well as cross-sectional evidence of expertise-related structuraldifferences in gymnasts (Huang et al. 2013) and ballet dancers(Hänggi et al. 2010). That sensorimotor systems respond to differ-ent types of complex auditory information, even when partici-pants are not required to perform or plan any movements, mayreflect the automatic engagement of some level of sensorimotorsimulation. Processing and evaluating complex sounds—humanvocalizations, in the case of the current study—would involve theactivation of motor representations that link sensory informa-tion to actions related to the production of those sounds (Gazzolaet al. 2006; Warren et al. 2006; Scott, McGettigan, et al. 2009; Scottet al. 2014; McGettigan et al. 2015).We argue that the samemech-anism of covert simulation may support auditory imagery—animagery-to-action pathway. Accessing auditory–motor represen-tations may be central for the generation of different types ofmental auditory images, such as vocal and musical ones(Halpern and Zatorre 1999; Meteyard et al. 2012; Zvyagintsevet al. 2013), and the structure of sensorimotor systems may be adeterminant of the efficiency of this mechanism. The perceivedvividness of mental images and the representational specificityof heard information would both be shaped by how efficientlyrelevant sensorimotor information is retrieved.
Such an imagery-to-action pathway is unlikely to be specia-lized to auditory information, as other forms of imagery (e.g., vis-ual, motor) may also have associated action components andengage sensorimotor processes to some extent. Indeed, activityin SMA is observed in functional studies conducted on nonaudi-tory modalities of imagery (Guillot et al. 2009; Borst et al. 2012;McNorgan 2012; Hétu et al. 2013; Zvyagintsev et al. 2013). Further-more, SMA is similarly active during motor imagery and execu-tion, suggesting that movement sensations are simulatedduring motor imagery (Naito et al. 2002; Ehrsson et al. 2003;Hanakawa et al. 2003). The same was suggested in the visual
Auditory Imagery and Brain Structure Lima et al. | 4647
by guest on January 24, 2017http://cercor.oxfordjournals.org/
Dow
nloaded from
domain (Grèzes and Decety 2002; Solodkin et al. 2004; Zacks 2008;Mukamel et al. 2010). However, despite the suggestive evidence ofcross-modal commonalities in the mechanisms supporting im-agery, only rarely have different modalities been directly com-pared (Halpern et al. 2004; Solodkin et al. 2004; Daselaar et al.2010). We established that participants reporting highly vividauditory images also report experiencing highly vivid visualimages. That vividness of visual imagery is reflected in differ-ences in gray matter volume in SMA, paralleling the findingsfor auditory imagery, suggests that converging sensorimotorsimulation processesmay operate acrossmodalities. These com-monalities may further reflect the fact that everyday imageryoften involves multisensory components, that is, mental imagesare frequently not confined to one single modality (Hubbard2013). Even in an experimental setting in which the task requiresparticipants to focus on a particular modality, components fromothermodalitiesmay be spontaneously retrieved.When asked togenerate an image of an auditory scene, for instance, concurrentvisual and kinesthetic images might spontaneously appear (e.g.,when imagining the cheer of the crowd as a player hits the ball—one of the BAIS items—individuals may also generate a visualimage of the crowd in a stadium). In future studies, it would beinteresting to examine whether the diversity of componentsretrieved for an auditory or visual scene may actually contributeto enhance the impression of vividness.
To conclude, the present study forms the first demonstrationthat interindividual differences in auditory imagery have a signa-ture in brain structure, adding to the growing body of evidencethat individual differences can be an invaluable source of infor-mation to link behavior and cognition to brain anatomy. Buildingupon prior functional neuroimaging studies, our results establisha role for the structure of parietal, prefrontal, and sensorimotorsystems (in particular SMA) in supporting auditory imagery. InSMA, we further established links between auditory imagery,processing of heard vocal information, and visual imagery. Weargue for sensorimotor simulation as a candidate mechanismfor such commonalities. Future investigations could extend thiswork to refine the exploration of converging computations be-tween imagery and auditory processing, for example, by includ-ing different types of perceived and imagined sounds that afforda wider range of variability in terms of the accessibility of rele-vant sensorimotor representations. Our focus was on links be-tween heard human vocal information and auditory imagerymostly for voices and music (the main domains covered by theBAIS). Further work will also need to specify the microstructuralbasis of the large-scale anatomical differences reported here, andto determine how they are shaped by environmental and geneticfactors.
FundingThis work was supported by a Wellcome Trust Senior ResearchFellowship (WT090961MA) awarded to Sophie Scott. During theplanning and execution of this project, César Lima was fundedby a postdoctoral fellowship from the Portuguese Foundationfor Science and Technology (SFRH/BPD/77189/2011), and AndreaHalpern was partly funded by a Leverhulme Visiting Professor-ship. Funding to pay the Open Access publication charges forthis article was provided by The Wellcome Trust.
NotesWe thank the staff at the Birkbeck-UCL Centre for NeuroImaging(BUCNI) for technical advice. Conflict of Interest: None declared.
ReferencesAshburner J. 2007. A fast diffeomorphic image registration algo-
rithm. Neuroimage. 38:95–113.Ashburner J, Friston KJ. 2000. Voxel-based morphometry—the
methods. Neuroimage. 11:805–821.Ashburner J, Friston KJ. 2005. Unified segmentation. Neuroimage.
26:839–851.Banissy MJ, Kanai R, Walsh V, Rees G. 2012. Inter-individual dif-
ferences in empathy are reflected in human brain structure.Neuroimage. 62:2034–2039.
Blesser B. 1972. Speech perception under conditions of spectraltransformation. J Speech Hear Res. 15:5–41.
Borst AW, Sack AT, Jansma BM, Esposito F, Martino F, Valente G,Roebroeck A, Salle F, Goebel R, Formisano E. 2012. Integrationof “what” and “where” in frontal cortex during visual imageryof scenes. Neuroimage. 60:47–58.
Brainard DH. 1997. The Psychophysics Toolbox. Spat Vis.10:433–436.
Burianová H, Marstaller L, Sowman P, Tesan G, Rich AN,Williams M, Savage G, Johnson BW. 2013. Multimodal func-tional imaging of motor imagery using a novel paradigm.Neuroimage. 71:50–58.
Byrne D, Dillon H, Tran K, Arlinger S, Wilbraham K, Cox RHB,Hetu RKJ, Liu C, Kiessling J, Kotby MN, et al. 1994. An inter-national comparison of long-term average speech spectra.J Acoust Soc Am. 96:2108–2120.
Campos A, Pérez-Fabello MJ. 2009. Psychometric quality of a re-vised version of the Vividness of Visual Imagery Question-naire. Percept Mot Skills. 108:798–802.
Colom R, Abad FJ, Quiroga MA, Shih PC, Flores-Mendoza C. 2008.Working memory and intelligence are highly related con-structs, but why? Intelligence. 36:584–606.
Cui X, Jeter CB, Yang D, Montague PR, Eagleman DM. 2007. Vivid-ness of mental imagery: individual variability can be mea-sured objectively. Vision Res. 47:474–478.
Daselaar SM, Porat Y, HuijbertsW, Pennartz CMA. 2010. Modality-specific and modality-independent components of thehuman imagery system. Neuroimage. 52:677–685.
Ehrsson HH, Geyer S, Naito E. 2003. Imagery of voluntary move-ment of fingers, toes, and tongue activates correspondingbody-part-specific motor representations. J Neurophysiol.90:3304–3316.
Erb J, Henry MJ, Eisner F, Obleser J. 2012. Auditory skills and brainmorphology predict individual differences in adaptation todegraded speech. Neuropsychologia. 50:2154–2164.
Evans S, Kyong JS, Rosen S, Golestani N,Warren JE, McGettigan C,Mourão-Miranda J, Wise RJS, Scott SK. 2014. The pathways forintelligible speech: multivariate and univariate perspectives.Cereb Cortex. 24:2350–2361.
Fleming SM, Weil RS, Nagy Z, Dolan RJ, Rees G. 2010. Relatingintrospective accuracy to individual differences in brain struc-ture. Science. 329:1541–1543.
Gaser C, Schlaug G. 2003. Brain structures differ between musi-cians and non-musicians. J Neurosci. 23:9240–9245.
Gazzola V, Ziz-Zadeh L, Keysers C. 2006. Empathy and the soma-totopic auditory mirror system in humans. Curr Biol.16:1824–1829.
Gelding RW, Thompson WF, Johnson BW. 2015. The pitch im-agery arrow task: effects of musical training, vividness, andmental control. PLoS One. 10:e0121809.
Golestani N, Price C, Scott SK. 2011. Born with an ear for dialects?Structural plasticity in the expert phonetician brain. J Neurosci.31:4213–4220.
4648 | Cerebral Cortex, 2015, Vol. 25, No. 11
by guest on January 24, 2017http://cercor.oxfordjournals.org/
Dow
nloaded from
Grèzes J, Decety J. 2002. Does visual perception of object afford ac-tion? Evidence from a neuroimaging study. Neuropsychologia.40:212–222.
Green T, Rosen S, Faulkner A, Paterson R. 2013. Adaptation tospectrally-rotated speech. J Acoust Soc Am. 134:1369–1377.
Guillot A, Collet C, Nguyen VA, Malouin F, Richards C, Doyon J.2009. Brain activity during visual versus kinesthetic imagery:an fMRI study. Hum Brain Mapp. 30:2157–2172.
Hall DA, Haggard MP, Akeroyd MA, Palmer AR, Summerfield AQ,Elliott MR, Gurney EM, Bowtell RW. 1999. “Sparse” temporalsampling in auditory fMRI. Hum Brain Mapp. 7:213–223.
Halpern AR. forthcoming 2015. Differences in auditory imageryself-report predict neural and behavioral outcomes.Psychomusicology. doi:10.1037/pmu0000081.
Halpern AR, Zatorre RJ. 1999. When that tune runs through yourhead: a PET investigation of auditory imagery for familiarmelodies. Cereb Cortex. 9:697–704.
Halpern AR, Zatorre RJ, Bouffard M, Johnson JA. 2004. Behavioraland neural correlates of perceived and imaginedmusical tim-bre. Neuropsychologia. 42:1281–1292.
Hanakawa T, Immisch I, Toma K, Dimyan MA, Gelderen P,Hallett M. 2003. Functional properties of brain areas asso-ciated with motor execution and imagery. J Neurophysiol.89:989–1002.
Hänggi J, Koeneke S, Bezzola L, Jäncke L. 2010. Structural neuro-plasticity in the sensorimotor network of professional femaleballet dancers. Hum Brain Mapp. 31:1196–1206.
Herholz SC, Halpern AR, Zatorre RJ. 2012. Neuronal correlates ofperception, imagery, and memory for familiar tunes. J CognNeurosci. 24:1382–1397.
Hétu S, Grégoire M, Saimpont A, Coll M, Eugène F, Michon P,Jackson P. 2013. The neural network of motor imagery: anALE meta-analysis. Neurosci Biobehav Rev. 37:930–949.
Huang R, Lu M, Song Z, Wang J. 2013. Long-term intensive train-ing induced brain structural changes inworld class gymnasts.Brain Struct Funct. 220:625–644.
Hubbard TL. 2013. Auditory imagery contains more than audi-tion. In: Lacey S, Lawson R, editors. Multisensory imagery.New York: Springer. p. 221–246.
HuttonC,Draganski B, Ashburner J,WeiskopfN. 20099. A compari-son between voxel-based cortical thickness and voxel-basedmorphometry in normal aging. Neuroimage. 48:371–380.
Janata P. 2012. Acuity ofmental representations of pitch. AnnNYAcad Sci. 1252:214–221.
Janata P. 2001. Brain electrical activity evoked by mental formationof auditory expectations and images. Brain Topogr. 13:169–193.
Janata P, Paroo K. 2006. Acuity of auditory images in pitch andtime. Percept Psychophys. 68:829–844.
Kanai R, DongMY, Bahrami B, Rees G. 2011. Distractibility in dailylife is reflected in the structure and function of human par-ietal cortex. J Neurosci. 31:6620–6626.
Kanai R, Rees G. 2011. The structural basis of inter-individualdifferences in human behaviour and cognition. Nat RevNeurosci. 12:231–242.
Keller PE. 2012. Mental imagery in music performance: under-lying mechanisms and potential benefits. Ann N Y Acad Sci.1252:206–2013.
Kleber B, BirbaumerN, Veit R, TrevorrowT, LotzeM. 2007. Overt andimagined singing of an Italian area. Neuroimage. 36:889–900.
Kosslyn SM, Ganis G, ThompsonWL. 2001. Neural foundations ofimagery. Nat Rev Neurosci. 2:635–642.
KozhevnikovM, Kosslyn S, Shephard J. 2005. Spatial versus objectvisualizers: a new characterization of visual cognitive style.Mem Cogn. 33:710–726.
Kraemer DJM, Macrae CN, Green AR, Kelley WM. 2005. Sound ofsilence activates auditory cortex. Nature. 434:158.
Kriegeskorte N, MurM, Bandettini P. 2008. Representational simi-larity analysis—connecting the branches of systems neuro-science. Front Syst Neurosci. 2:4.
Lange K. 2009. Brain correlates of early auditory processing are at-tenuated by expectations for time and pitch. Brain Cogn.69:127–137.
Leaver AM, Van Lare J, Zielinski B, Halpern AR, Rauschecker JP.2009. Brain activation during anticipation of sound se-quences. J Neurosci. 29:2477–2485.
Lima CF, Castro SL, Scott SK. 2013. When voices get emotional: acorpus of nonverbal vocalizations for research on emotionprocessing. Behav Res Meth. 45:1234–1245.
Linden DEJ, Thornton K, Kuswanto CN, Johnston SJ, van de Ven V,Jackson MC. 2011. The brain’s voices: comparing nonclinicalauditory hallucinations and imagery. Cereb Cortex. 21:330–337.
Marks DF. 1973. Visual imagery differences in the recall of pic-tures. Br J Psychol. 64:17–24.
Mattys SL, DavidMH, BradlowAR, Scott SK. 2012. Speech recogni-tion in adverse conditions: a review. Lang Cogn Proc.27:953–978.
MayA, Gaser C. 2006.Magnetic resonance-basedmorphometry: awindow into structural plasticity of the brain. Curr OpinNeurol. 19:407–411.
McGettiganC,Walsh E, Jessop R, AgnewZK, Sauter DA,Warren JE,Scott SK. 2015. Individual differences in laughter perceptionreveal roles for mentalizing and sensorimotor systems inthe evaluation of emotional authenticity. Cereb Cortex.25:246–257.
McNorgan C. 2012. A meta-analytic review of multisensory im-agery identifies the neural correlates of modality-specificand modality-general imagery. Front Hum Neurosci. 6:285.
Mechelli A, Price CJ, Friston KJ, Ashburner J. 2005. Voxel-basedmorphometry of the human brain:methods and applications.Curr Med Imaging Rev. 1:105–113.
Meteyard L, Cuadrado SR, Bahrami B, Vigliocco G. 2012. Coming ofage: a review of embodiment and the neuroscience of seman-tics. Cortex. 48:788–804.
Misaki M, Kim Y, Bandettini PA, Kriegeskorte N. 2010. Compari-son of multivariate classifiers and response normalizationsfor pattern-information fMRI. Neuroimage. 53:103–118.
Mukamel R, Ekstrom AD, Kaplan J, Iacoboni M, Fried I. 2010. Sin-gle-neuron responses in humans during execution and obser-vation of actions. Curr Biol. 20:750–756.
Nachev P, Kennard C, Husain M. 2008. Functional role of the sup-plementary and pre-supplementary motor areas. Nat RevNeurosci. 9:856–869.
Naito E, Kochiyama T, Kitada R, Nakamura S, Matsumura M,Yonekura Y, Sadato N. 2002. Internally simulated movementsensations during motor imagery activate cortical motorareas and the cerebellum. J Neurosci. 22:3683–3691.
Narain C, Scott SK, Wise RJS, Rosen S, Leff A, Iversen SD,Matthews PM. 2003. Defininga left-lateralized responsespecificto intelligible speech using fMRI. Cereb Cortex. 13:1362–1368.
Navarro-Cebrian A, Janata P. 2010a. Electrophysiological corre-lates of accurate mental image formation in auditory percep-tion and imagery tasks. Brain Res. 1342:39–54.
Navarro-Cebrian A, Janata P. 2010b. Influences of multiple mem-ory systems on auditory mental image acuity. J Acoust SocAm. 127:3189–3202.
Novembre G, Ticini L, Schütz-Bosbach S, Keller P. 2014. Motorsimulation and the coordination of self and other in real-time joint action. Soc Cogn Affect Neurosci. 9:1062–1068.
Auditory Imagery and Brain Structure Lima et al. | 4649
by guest on January 24, 2017http://cercor.oxfordjournals.org/
Dow
nloaded from
Okada K, Rong F, Venezia J, Matchin W, Hsieh IH, Saberi K,Serences JT, Hickok G. 2010. Hierarchical organization ofhuman auditory cortex: evidence from acoustic invariance inthe response to intelligible speech. Cereb Cortex. 20:2486–2495.
Peelle JE, Cusack R, HensonRNA. 2012. Adjusting for global effectsin voxel-based morphometry: grey matter decline in normalaging. Neuroimage. 60:1503–1516.
Pfordresher PQ, Halpern AR. 2013. Auditory imagery and thepoor-pitch singer. Psychon B Rev. 20:747–753.
RidgwayGR,Henley SMD, Rohrer JD, Scahill RI,Warren JD, FoxNC.2008. Ten simple rules for reporting voxel-based morphom-etry studies. Neuroimage. 40:1429–1435.
Sauter DA, Eisner F, Calder AJ, Scott SK. 2010. Perceptual cues innonverbal vocal expressions of emotion. Q J Exp Psychol.63:2251–2272.
Scott SK, Blank CC, Rosen S, Wise RJS. 2000. Identification of apathway for intelligible speech in the left temporal lobe.Brain. 123:2400–2406.
Scott SK, Lavan N, Chen S, McGettigan C. 2014. The social life oflaughter. Trends Cogn Sci. 18:618.620.
Scott SK, McGettigan C, Eisner F. 2009. A little more conversation,a little less action—candidate roles for the motor cortex inspeech perception. Nat Rev Neurosci. 10:295–302.
Scott SK, Rosen S, Beaman CP, Davis JP, Wise RJ. 2009. The neuralprocessing of masked speech: evidence for different mechan-isms in the left and right temporal lobes. J Acoust Soc Am.125:1737–1743.
Shergill SS, Bullmore ET, Brammer MJ, Williams SCR, Murray RM,McGuire PK. 2001. A functional study of auditory verbal im-agery. Psychol Med. 31:241–253.
Solodkin A, Hlustik P, Chen EE, Small SL. 2004. Finemodulation innetwork activation during motor execution and motor im-agery. Cereb Cortex. 14:1246–1255.
Taubert M, Draganski B, Anwander A, Mueller K, Horstmann A,Villringer A, Ragert P. 2010. Dynamic properties of human
brain structure: learning-related changes in cortical areasand associated fiber connections. J Neurosci. 30:11670–11677.
Warren JE, Sauter DA, Eisner F, Wiland J, Dresner MA, Wise RJS,Rosen S, Scott SK. 2006. Positive emotions preferentially engagean auditory-motor “mirror” system. J Neurosci. 26:13067–13075.
Wechsler D. 1997. Wechsler Adult Intelligence Scale—thirdedition (WAIS-III). San Antonio: Pearson.
Woo C, Koban L, Kross E, Lindquist MA, Banich MT, Ruzic L, An-drews-Hanna JR,Wager TD. 2014. Separate neural representa-tions for physical pain and social rejection. Nat Commun.5:5380.
Woollett K, Maguire EA. 2011. Acquiring “the Knowledge” of Lon-don’s layout drives structural brain changes. Curr Biol.21:2109–2114.
Worsley KJ, Marrett S, Neelin P, Vandal AC, Friston KJ, Evans AC.1996. A unified statistical approach for determining significantsignals in images of cerebral activation. Hum Brain Mapp.4:58–73.
Zacks JM. 2008. Neuroimaging studies ofmental rotation: ameta-analysis and review. J Cogn Neurosci. 20:1–19.
Zatorre RJ, Chen JL, Penhune VB. 2007. When the brain playsmusic: auditory-motor interactions in music perception andproduction. Nat Rev Neurosci. 8:547–558.
Zatorre RJ, Halpern AR. 2005. Mental concerts: musical imageryand auditory cortex. Neuron. 47:9–12.
Zatorre RJ, Halpern AR, Bouffard M. 2010. Mental reversal of ima-gined melodies: a role for the posterior parietal cortex. J CognNeurosci. 22:775–789.
Zatorre RJ, Halpern AR, Perry DW, Meyer E, Evans AC. 1996. Hear-ing in the mind’s ear: a PET investigation of musical imageryand perception. J Cogn Neurosci. 8:29–46.
Zvyagintsev M, Clemens B, Chechko N, Mathiak KA, Sack AT,Mathiak K. 2013. Brain networks underlying mental imageryof auditory and visual information. Eur J Neurosci.37:1421–1434.
4650 | Cerebral Cortex, 2015, Vol. 25, No. 11
by guest on January 24, 2017http://cercor.oxfordjournals.org/
Dow
nloaded from
Recommended