CORPORATE PRESENTATION
February 2015
Delivering Value and Growth
SNAPSHOT
2014F 2015F
Capital expenditures (C$ million) $11,955 $6,190
Dividend (C$/Share) $0.88
Production (annual average, before royalties)
Oil (Mbbl/d) 531 - 557 552 - 592
Natural gas (MMcf/d) 1,550 - 1,570 1,730 - 1,770
BOE (MBOE/d) 789 - 819 840 - 887
Company Gross Reserves of crude oil and natural gas (as at December 31, 2013)
Proved crude oil and NGLs (MMbbl) 4,420
Proved natural gas (Bcf) 4,305
Proved BOE (MMBOE) 5,137
Proved and probable BOE (MMBOE) 7,991
Corporate Presentation February 2015
1
CNQ
Five Key Messages
Strong financial position
Large, balanced, high quality asset base
Transitioning to long life, low decline assets
Increasing sustainable free cash flow through organic profitable growth
Unlocking significant shareholder value
Slide 2
CNQ
• Long term ratings‒S&P: BBB+ (Stable Outlook)‒Moody’s: Baa1 (Stable Outlook)‒DBRS: BBB High (Stable Trend)
• Short term ratings‒S&P: A-2‒Moody’s: P-2
• Strong liquidity with $5.8 billion in credit lines‒$2.4 billion available at September 30, 2014
• Disciplined allocation of capital delivers sustainable dividend policy‒14 consecutive years of dividend increases
• Normal Course Issuer Bid‒10.2 million shares purchased in 2013‒ 9.675 million shares purchased to date in 2014
Delivering on Financial Objectives
Slide 3WE DELIVERED OUR FINANCIAL PLAN
Corporate Presentation February 2015
2
CNQ
0
500
1,000
1,500
2,000
2,500
3,000
3,500
4,000
4,500
CNQ SU OXY IMP DVN APC CHK APA EOG CVE ECA NBL HSE TLM
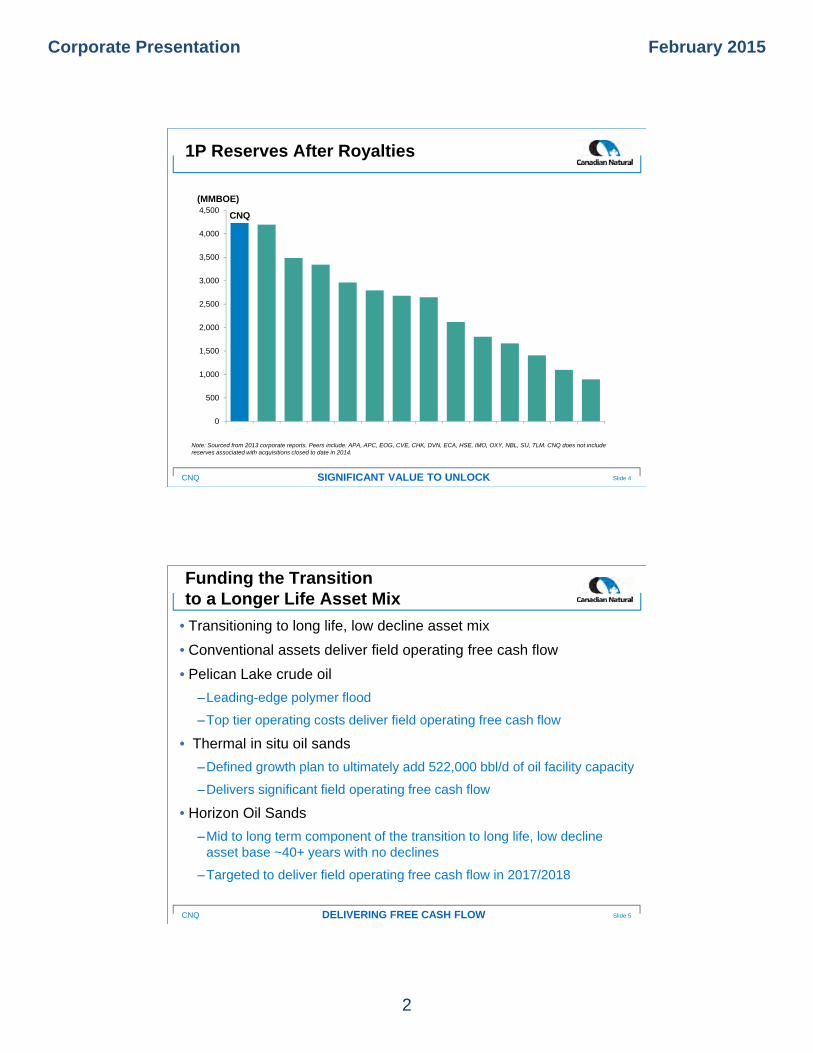
1P Reserves After Royalties
Slide 4SIGNIFICANT VALUE TO UNLOCK
Note: Sourced from 2013 corporate reports. Peers include: APA, APC, EOG, CVE, CHK, DVN, ECA, HSE, IMO, OXY, NBL, SU, TLM. CNQ does not include reserves associated with acquisitions closed to date in 2014.
(MMBOE)
CNQ
CNQ
• Transitioning to long life, low decline asset mix
• Conventional assets deliver field operating free cash flow
• Pelican Lake crude oil
‒Leading-edge polymer flood
‒Top tier operating costs deliver field operating free cash flow
• Thermal in situ oil sands
‒Defined growth plan to ultimately add 522,000 bbl/d of oil facility capacity
‒Delivers significant field operating free cash flow
• Horizon Oil Sands
‒Mid to long term component of the transition to long life, low decline asset base ~40+ years with no declines
‒Targeted to deliver field operating free cash flow in 2017/2018
Funding the Transition to a Longer Life Asset Mix
Slide 5DELIVERING FREE CASH FLOW
Corporate Presentation February 2015
3
CNQ
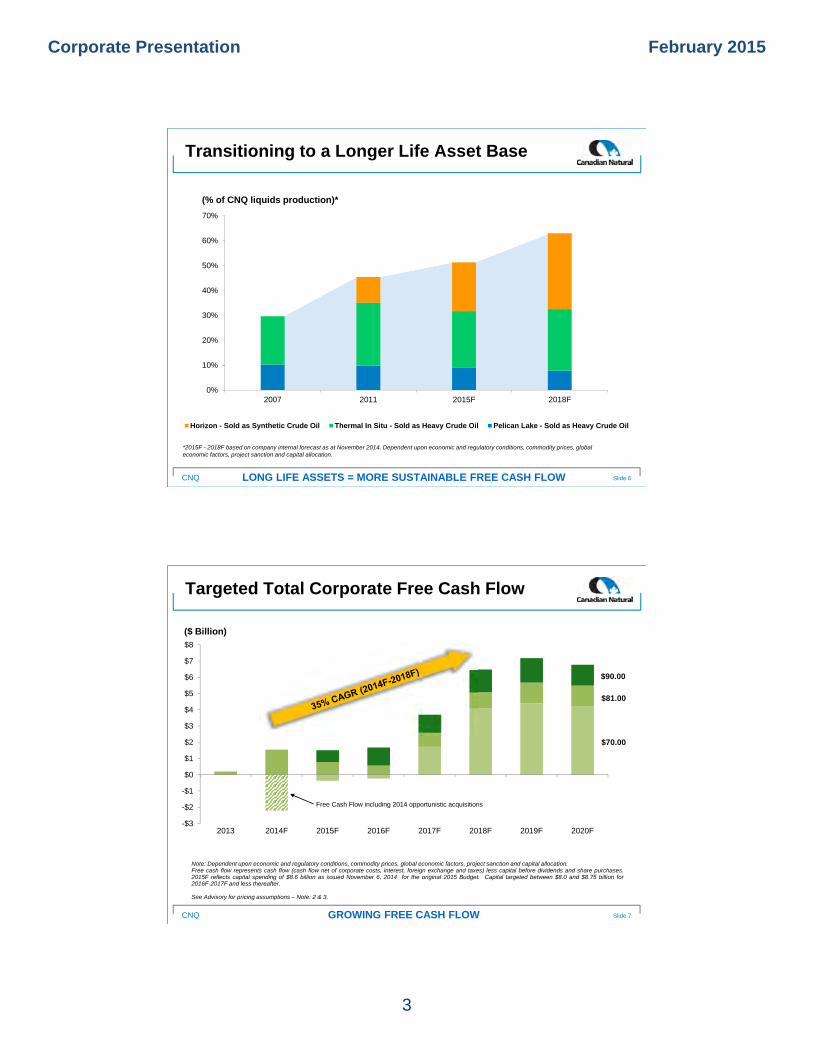
Transitioning to a Longer Life Asset Base
Slide 6LONG LIFE ASSETS = MORE SUSTAINABLE FREE CASH FLOW
*2015F - 2018F based on company internal forecast as at November 2014. Dependent upon economic and regulatory conditions, commodity prices, global economic factors, project sanction and capital allocation.
(% of CNQ liquids production)*
0%
10%
20%
30%
40%
50%
60%
70%
2007 2011 2015F 2018F
Horizon - Sold as Synthetic Crude Oil Thermal In Situ - Sold as Heavy Crude Oil Pelican Lake - Sold as Heavy Crude Oil
CNQ
-$3
-$2
-$1
$0
$1
$2
$3
$4
$5
$6
$7
$8
2013 2014F 2015F 2016F 2017F 2018F 2019F 2020F
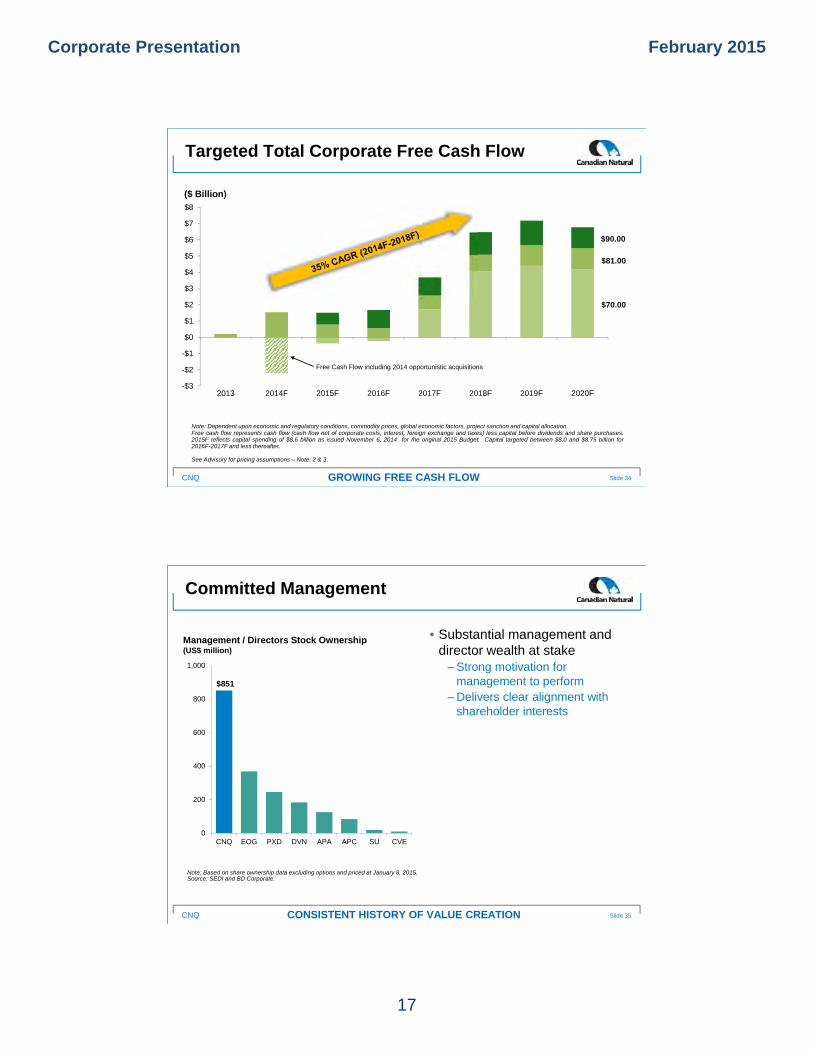
Targeted Total Corporate Free Cash Flow
GROWING FREE CASH FLOW
($ Billion)
Note: Dependent upon economic and regulatory conditions, commodity prices, global economic factors, project sanction and capital allocation.Free cash flow represents cash flow (cash flow net of corporate costs, interest, foreign exchange and taxes) less capital before dividends and share purchases.2015F reflects capital spending of $8.6 billion as issued November 6, 2014 for the original 2015 Budget. Capital targeted between $8.0 and $8.75 billion for2016F-2017F and less thereafter.
See Advisory for pricing assumptions – Note: 2 & 3.
Free Cash Flow including 2014 opportunistic acquisitions
Slide 7
$90.00
$81.00
$70.00
Corporate Presentation February 2015
4
CNQ
• Resource development‒Executing our defined plan
‒Transitioning to a longer life low decline asset base
‒Capital flexibility allows us to be nimble
• Dividends‒14 consecutive years of dividend increases
34% CAGR (2009 - 2014)
‒Must be sustainable
• Pay down debt
• Opportunistic acquisitions
• Share purchases
Free Cash Flow Allocation
Slide 8PRUDENT USE OF CASH FLOW
CNQ
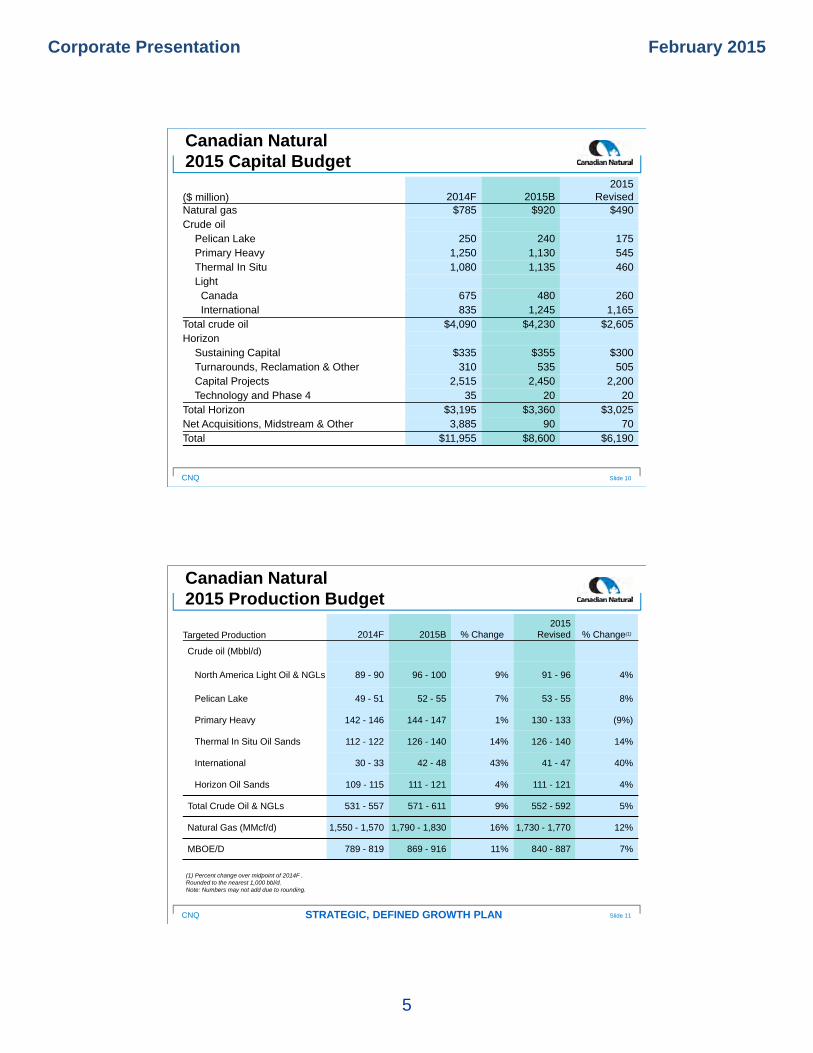
$0
$200
$400
$600
$800
$1,000
$1,200
$1,400
$1,600
2002 2003 2004 2005 2006 2007 2008 2009 2010 2011 2012 2013 2014F
Dividend Share Purchase
Horizon build years
Return to Shareholders
Slide 9RETURNS TO SHAREHOLDERS A PRIORITY
($ million)
Note: CAGR represents 2009-2014 potential. 10.2 million common shares purchased in 2013 at a weighted average price of $31.46/share. As at November 6, 2014, 9.675 million common shares have been purchased in 2014 at a weighted average price of $45.01/share.
Corporate Presentation February 2015
5
CNQ
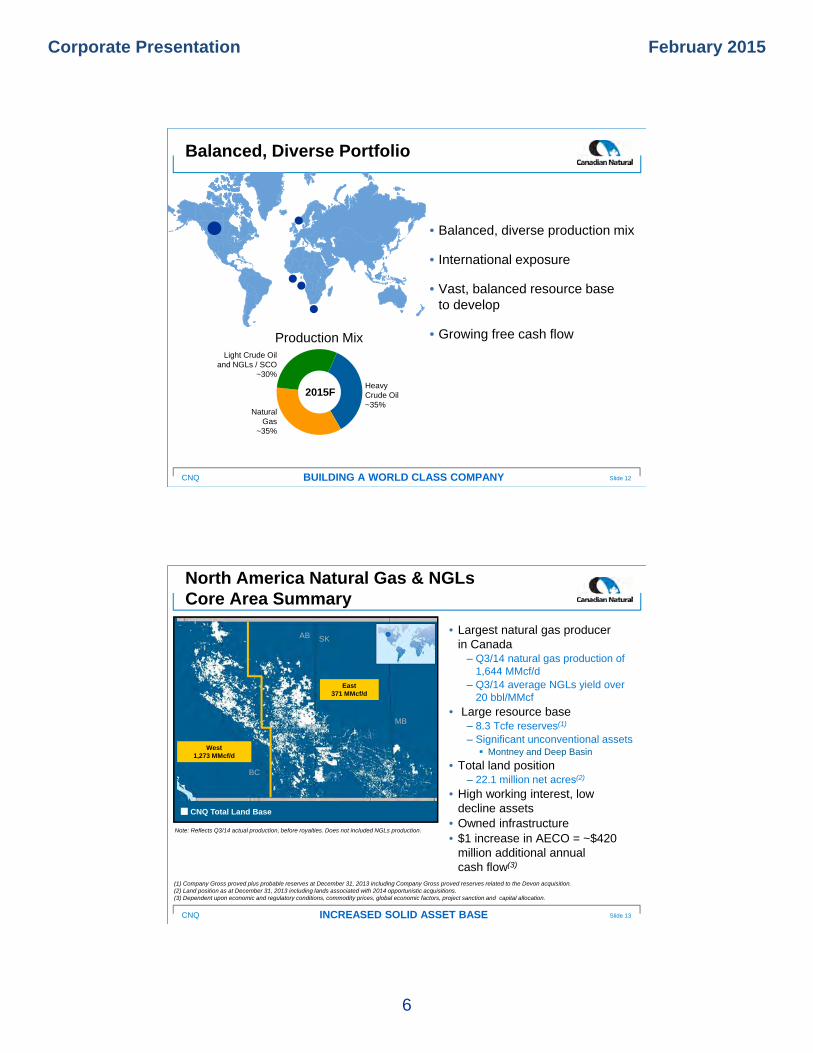
Canadian Natural2015 Capital Budget
Slide 10
($ million) 2014F 2015B2015
RevisedNatural gas $785 $920 $490Crude oil
Pelican Lake 250 240 175Primary Heavy 1,250 1,130 545Thermal In Situ 1,080 1,135 460Light
Canada 675 480 260International 835 1,245 1,165
Total crude oil $4,090 $4,230 $2,605Horizon
Sustaining Capital $335 $355 $300Turnarounds, Reclamation & Other 310 535 505Capital Projects 2,515 2,450 2,200Technology and Phase 4 35 20 20
Total Horizon $3,195 $3,360 $3,025Net Acquisitions, Midstream & Other 3,885 90 70Total $11,955 $8,600 $6,190
CNQ
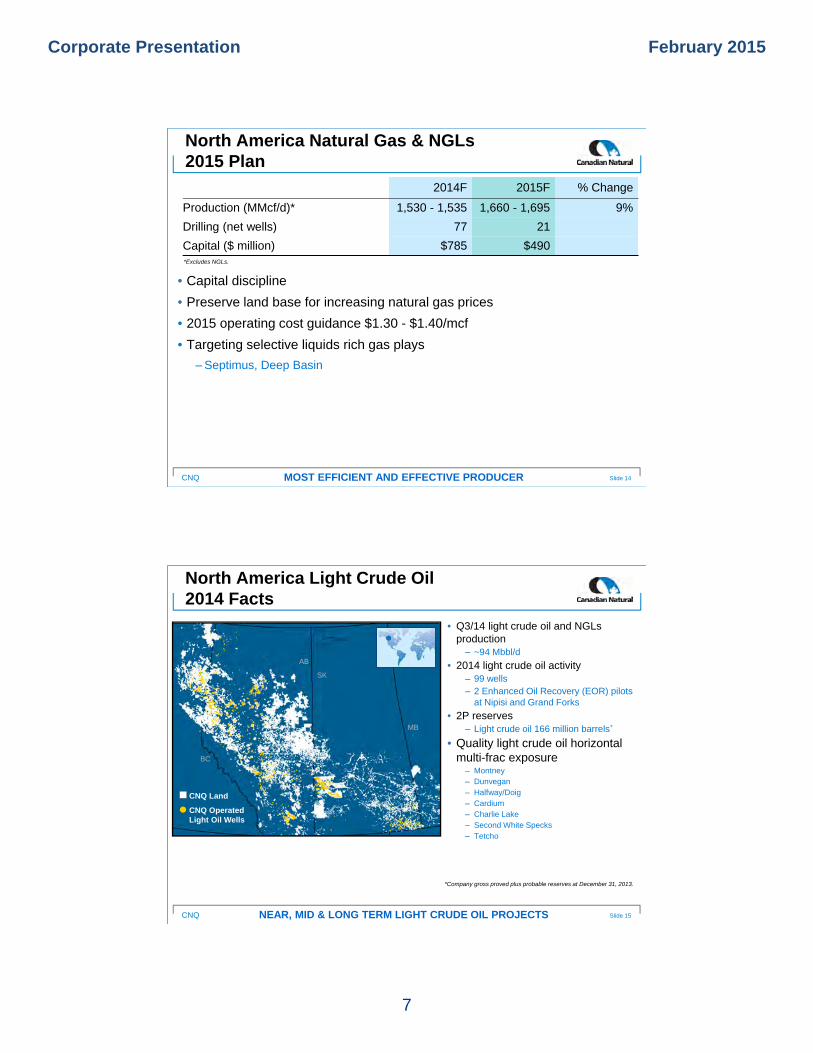
Canadian Natural2015 Production Budget
Slide 11STRATEGIC, DEFINED GROWTH PLAN
Targeted Production 2014F 2015B % Change 2015
Revised % Change(1)
Crude oil (Mbbl/d)
North America Light Oil & NGLs 89 - 90 96 - 100 9% 91 - 96 4%
Pelican Lake 49 - 51 52 - 55 7% 53 - 55 8%
Primary Heavy 142 - 146 144 - 147 1% 130 - 133 (9%)
Thermal In Situ Oil Sands 112 - 122 126 - 140 14% 126 - 140 14%
International 30 - 33 42 - 48 43% 41 - 47 40%
Horizon Oil Sands 109 - 115 111 - 121 4% 111 - 121 4%
Total Crude Oil & NGLs 531 - 557 571 - 611 9% 552 - 592 5%
Natural Gas (MMcf/d) 1,550 - 1,570 1,790 - 1,830 16% 1,730 - 1,770 12%
MBOE/D 789 - 819 869 - 916 11% 840 - 887 7%
(1) Percent change over midpoint of 2014F .Rounded to the nearest 1,000 bbl/d.Note: Numbers may not add due to rounding.
Corporate Presentation February 2015
6
CNQ
Balanced, Diverse Portfolio
Slide 12BUILDING A WORLD CLASS COMPANY
• Balanced, diverse production mix
• International exposure
• Vast, balanced resource base to develop
• Growing free cash flow
Heavy Crude Oil~35%
Light Crude Oil and NGLs / SCO
~30%
Natural Gas
~35%
2015F
Production Mix
CNQ
AB SK
MB
CNQ Total Land Base
West1,273 MMcf/d
East371 MMcf/d
BC
North America Natural Gas & NGLsCore Area Summary
• Largest natural gas producer in Canada‒ Q3/14 natural gas production of
1,644 MMcf/d‒ Q3/14 average NGLs yield over
20 bbl/MMcf• Large resource base
‒ 8.3 Tcfe reserves(1)
‒ Significant unconventional assets Montney and Deep Basin
• Total land position‒ 22.1 million net acres(2)
• High working interest, low decline assets
• Owned infrastructure• $1 increase in AECO = ~$420
million additional annual cash flow(3)
Slide 13INCREASED SOLID ASSET BASE
(1) Company Gross proved plus probable reserves at December 31, 2013 including Company Gross proved reserves related to the Devon acquisition.(2) Land position as at December 31, 2013 including lands associated with 2014 opportunistic acquisitions.(3) Dependent upon economic and regulatory conditions, commodity prices, global economic factors, project sanction and capital allocation.
Note: Reflects Q3/14 actual production, before royalties. Does not included NGLs production.
Corporate Presentation February 2015
7
CNQ
2014F 2015F % Change
Production (MMcf/d)* 1,530 - 1,535 1,660 - 1,695 9%
Drilling (net wells) 77 21
Capital ($ million) $785 $490
• Capital discipline
• Preserve land base for increasing natural gas prices
• 2015 operating cost guidance $1.30 - $1.40/mcf
• Targeting selective liquids rich gas plays
‒Septimus, Deep Basin
North America Natural Gas & NGLs2015 Plan
Slide 14MOST EFFICIENT AND EFFECTIVE PRODUCER
*Excludes NGLs.
CNQ
North America Light Crude Oil 2014 Facts
• Q3/14 light crude oil and NGLs production‒ ~94 Mbbl/d
• 2014 light crude oil activity‒ 99 wells‒ 2 Enhanced Oil Recovery (EOR) pilots
at Nipisi and Grand Forks
• 2P reserves‒ Light crude oil 166 million barrels*
• Quality light crude oil horizontal multi-frac exposure‒ Montney‒ Dunvegan‒ Halfway/Doig‒ Cardium‒ Charlie Lake‒ Second White Specks‒ Tetcho
Slide 15NEAR, MID & LONG TERM LIGHT CRUDE OIL PROJECTS
*Company gross proved plus probable reserves at December 31, 2013.
AB
SK
BC
MB
CNQ Land
CNQ Operated Light Oil Wells
Corporate Presentation February 2015
8
CNQ
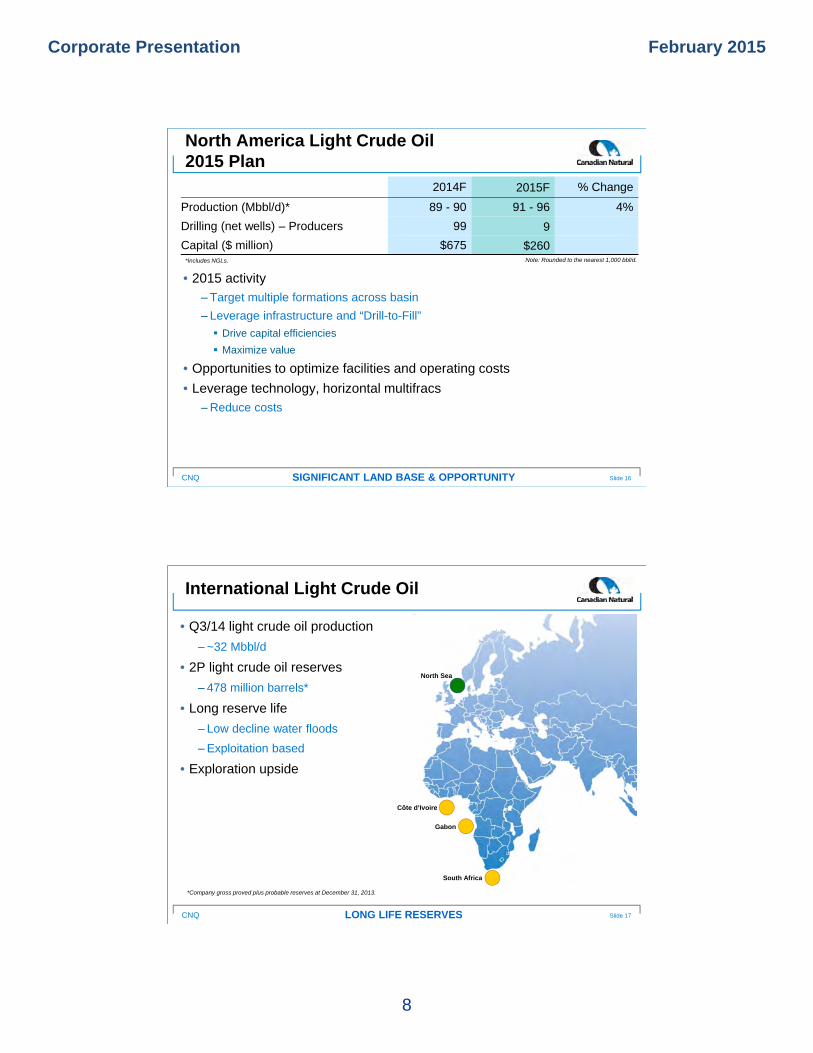
• 2015 activity
‒ Target multiple formations across basin
‒ Leverage infrastructure and “Drill-to-Fill”
Drive capital efficiencies
Maximize value
• Opportunities to optimize facilities and operating costs
• Leverage technology, horizontal multifracs
‒Reduce costs
North America Light Crude Oil 2015 Plan
Slide 16SIGNIFICANT LAND BASE & OPPORTUNITY
2014F 2015F % Change
Production (Mbbl/d)* 89 - 90 91 - 96 4%
Drilling (net wells) – Producers 99 9
Capital ($ million) $675 $260Note: Rounded to the nearest 1,000 bbl/d.*Includes NGLs.
CNQ
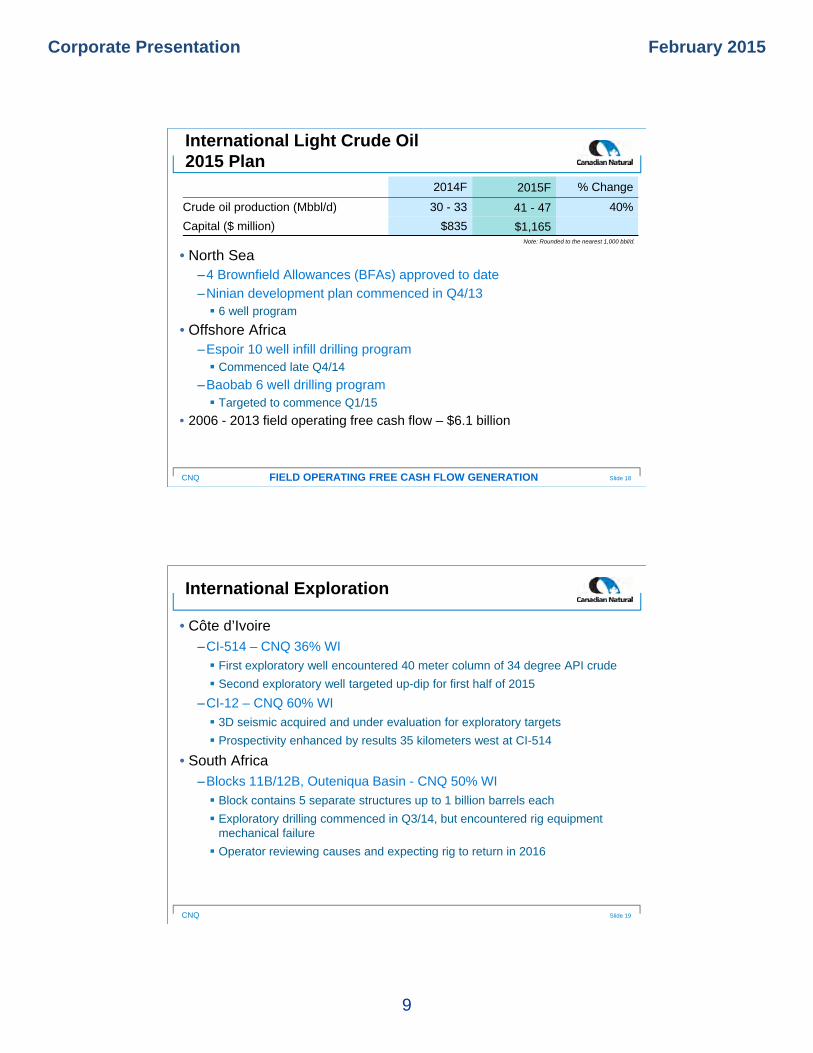
International Light Crude Oil
• Q3/14 light crude oil production
‒ ~32 Mbbl/d
• 2P light crude oil reserves
‒ 478 million barrels*
• Long reserve life
‒ Low decline water floods
‒Exploitation based
• Exploration upside
Slide 17LONG LIFE RESERVES
North Sea
Côte d’Ivoire
Gabon
South Africa
*Company gross proved plus probable reserves at December 31, 2013.
Corporate Presentation February 2015
9
CNQ
• North Sea‒4 Brownfield Allowances (BFAs) approved to date
‒Ninian development plan commenced in Q4/13 6 well program
• Offshore Africa‒Espoir 10 well infill drilling program Commenced late Q4/14
‒Baobab 6 well drilling program Targeted to commence Q1/15
• 2006 - 2013 field operating free cash flow – $6.1 billion
International Light Crude Oil 2015 Plan
Slide 18FIELD OPERATING FREE CASH FLOW GENERATION
Note: Rounded to the nearest 1,000 bbl/d.
2014F 2015F % Change
Crude oil production (Mbbl/d) 30 - 33 41 - 47 40%
Capital ($ million) $835 $1,165
CNQ
• Côte d’Ivoire‒CI-514 – CNQ 36% WI
First exploratory well encountered 40 meter column of 34 degree API crude
Second exploratory well targeted up-dip for first half of 2015
‒CI-12 – CNQ 60% WI
3D seismic acquired and under evaluation for exploratory targets
Prospectivity enhanced by results 35 kilometers west at CI-514
• South Africa‒Blocks 11B/12B, Outeniqua Basin - CNQ 50% WI
Block contains 5 separate structures up to 1 billion barrels each
Exploratory drilling commenced in Q3/14, but encountered rig equipmentmechanical failure
Operator reviewing causes and expecting rig to return in 2016
International Exploration
Slide 19
Corporate Presentation February 2015
10
CNQ
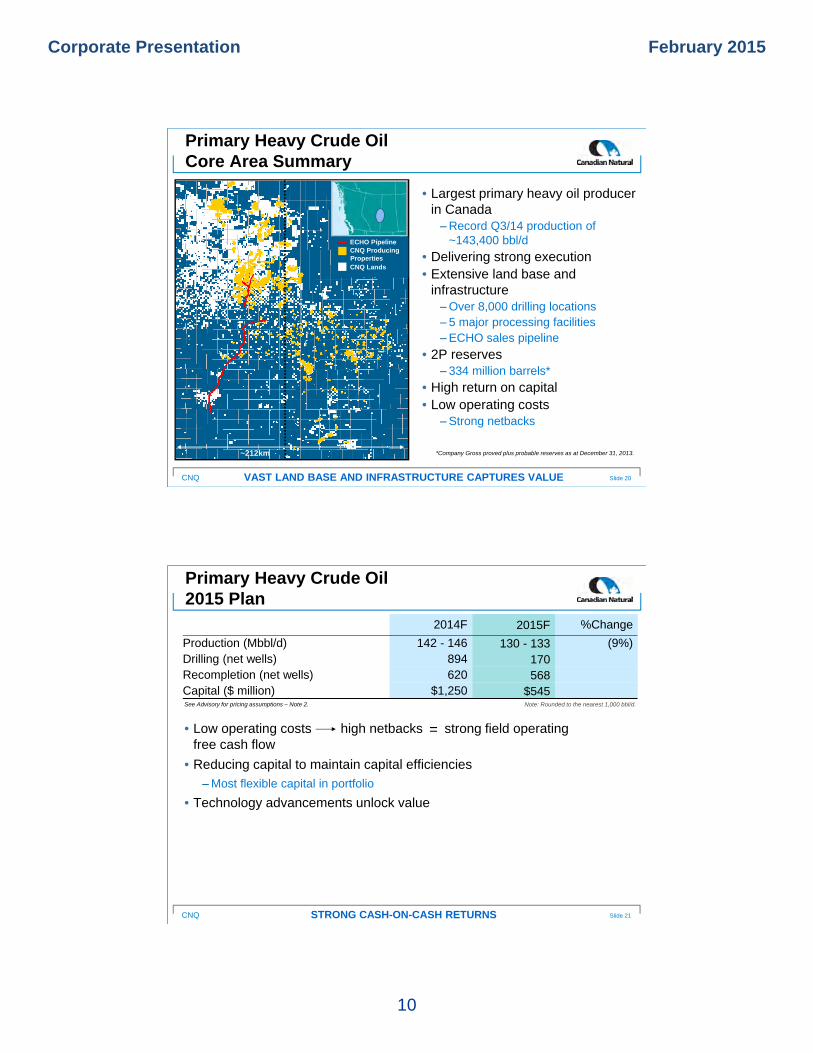
Primary Heavy Crude Oil Core Area Summary
• Largest primary heavy oil producer in Canada‒Record Q3/14 production of
~143,400 bbl/d
• Delivering strong execution• Extensive land base and
infrastructure‒Over 8,000 drilling locations‒ 5 major processing facilities‒ECHO sales pipeline
• 2P reserves‒ 334 million barrels*
• High return on capital• Low operating costs
‒Strong netbacks
Slide 20VAST LAND BASE AND INFRASTRUCTURE CAPTURES VALUE
*Company Gross proved plus probable reserves as at December 31, 2013.~212km
ECHO PipelineCNQ Producing PropertiesCNQ Lands
CNQ
2014F 2015F %Change
Production (Mbbl/d) 142 - 146 130 - 133 (9%)Drilling (net wells) 894 170Recompletion (net wells) 620 568Capital ($ million) $1,250 $545
Primary Heavy Crude Oil 2015 Plan
Slide 21STRONG CASH-ON-CASH RETURNS
Note: Rounded to the nearest 1,000 bbl/d.
• Low operating costs high netbacks strong field operating free cash flow
• Reducing capital to maintain capital efficiencies
‒Most flexible capital in portfolio
• Technology advancements unlock value
=
See Advisory for pricing assumptions – Note 2.
Corporate Presentation February 2015
11
CNQ
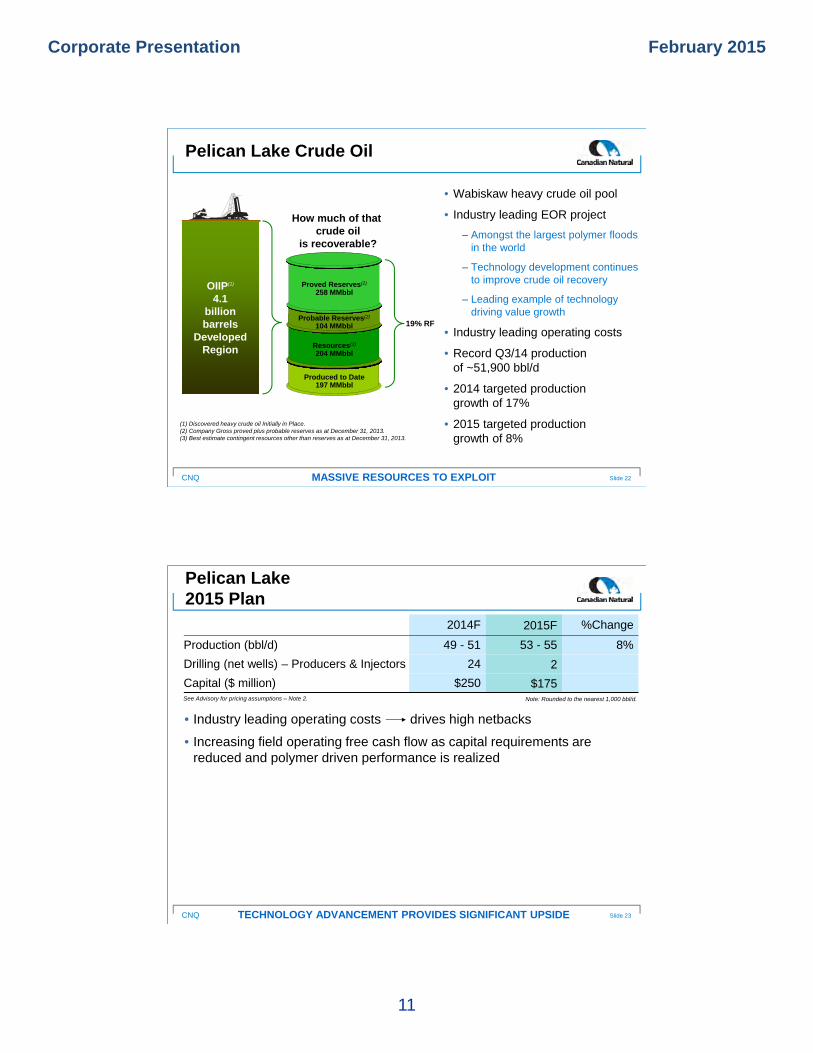
Pelican Lake Crude Oil
• Wabiskaw heavy crude oil pool
• Industry leading EOR project
‒ Amongst the largest polymer floods in the world
‒ Technology development continues to improve crude oil recovery
‒ Leading example of technology driving value growth
• Industry leading operating costs
• Record Q3/14 production of ~51,900 bbl/d
• 2014 targeted production growth of 17%
• 2015 targeted production growth of 8%
Slide 22MASSIVE RESOURCES TO EXPLOIT
How much of that crude oil
is recoverable?
OIIP(1)
4.1 billion barrels
Developed Region
19% RF
Produced to Date197 MMbbl
Resources(3)
204 MMbbl
Probable Reserves(2)
104 MMbbl
Proved Reserves(2)
258 MMbbl
(1) Discovered heavy crude oil Initially in Place. (2) Company Gross proved plus probable reserves as at December 31, 2013.(3) Best estimate contingent resources other than reserves as at December 31, 2013.
CNQ
2014F 2015F %Change
Production (bbl/d) 49 - 51 53 - 55 8%
Drilling (net wells) – Producers & Injectors 24 2
Capital ($ million) $250 $175
Pelican Lake 2015 Plan
Slide 23TECHNOLOGY ADVANCEMENT PROVIDES SIGNIFICANT UPSIDE
Note: Rounded to the nearest 1,000 bbl/d.See Advisory for pricing assumptions – Note 2.
• Industry leading operating costs drives high netbacks
• Increasing field operating free cash flow as capital requirements are reduced and polymer driven performance is realized
Corporate Presentation February 2015
12
CNQ
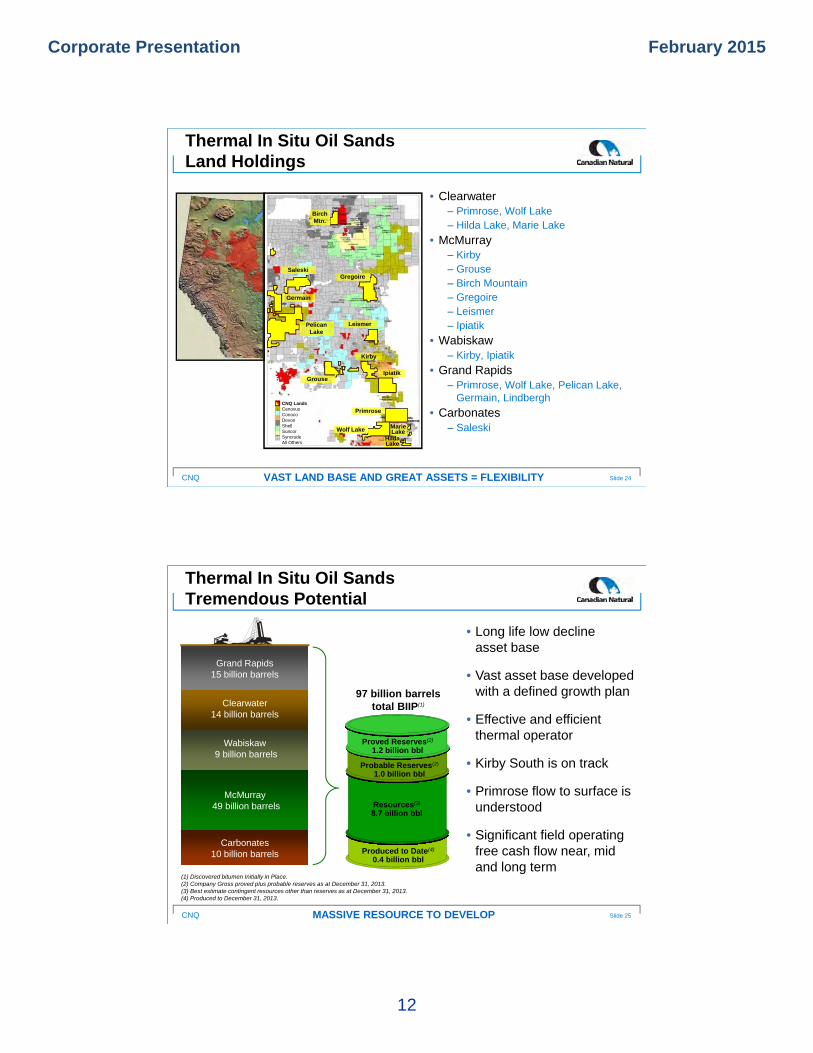
Thermal In Situ Oil Sands Land Holdings
Slide 24VAST LAND BASE AND GREAT ASSETS = FLEXIBILITY
CNQ LandsCenovusConocoDevonShellSuncorSyncrudeAll Others
Birch Mtn.
Gregoire
Kirby
Leismer
Ipiatik Grouse
Pelican Lake
Germain
Primrose
Wolf Lake
Hilda Lake
Marie Lake
Saleski
• Clearwater ‒ Primrose, Wolf Lake‒ Hilda Lake, Marie Lake
• McMurray ‒ Kirby‒ Grouse‒ Birch Mountain‒ Gregoire‒ Leismer‒ Ipiatik
• Wabiskaw‒ Kirby, Ipiatik
• Grand Rapids‒ Primrose, Wolf Lake, Pelican Lake,
Germain, Lindbergh
• Carbonates‒ Saleski
CNQ
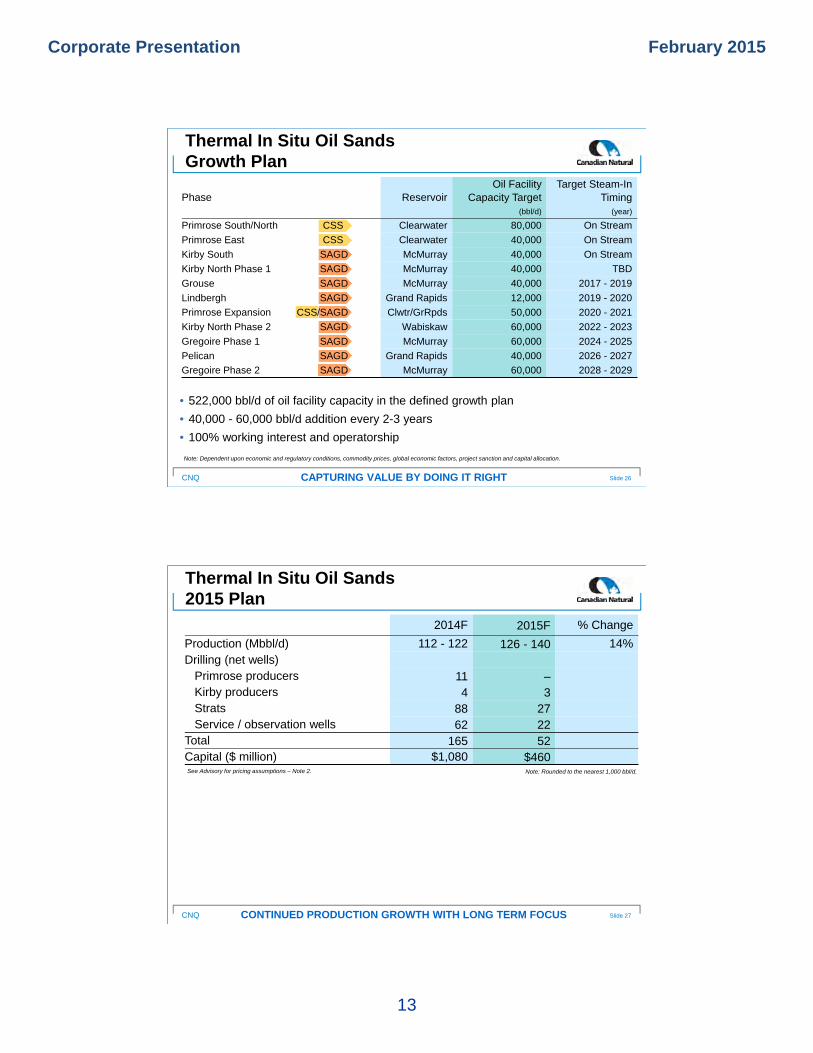
Thermal In Situ Oil Sands Tremendous Potential
Slide 25MASSIVE RESOURCE TO DEVELOP
McMurray49 billion barrels
Wabiskaw9 billion barrels
Carbonates10 billion barrels
Clearwater14 billion barrels
Grand Rapids15 billion barrels
(1) Discovered bitumen Initially in Place.(2) Company Gross proved plus probable reserves as at December 31, 2013.(3) Best estimate contingent resources other than reserves as at December 31, 2013.(4) Produced to December 31, 2013.
97 billion barrels total BIIP(1)
Produced to Date(4)
0.4 billion bbl
Resources(3)
8.7 billion bbl
Probable Reserves(2)
1.0 billion bbl
Proved Reserves(2)
1.2 billion bbl
• Long life low decline asset base
• Vast asset base developed with a defined growth plan
• Effective and efficient thermal operator
• Kirby South is on track
• Primrose flow to surface is understood
• Significant field operating free cash flow near, mid and long term
Corporate Presentation February 2015
13
CNQ
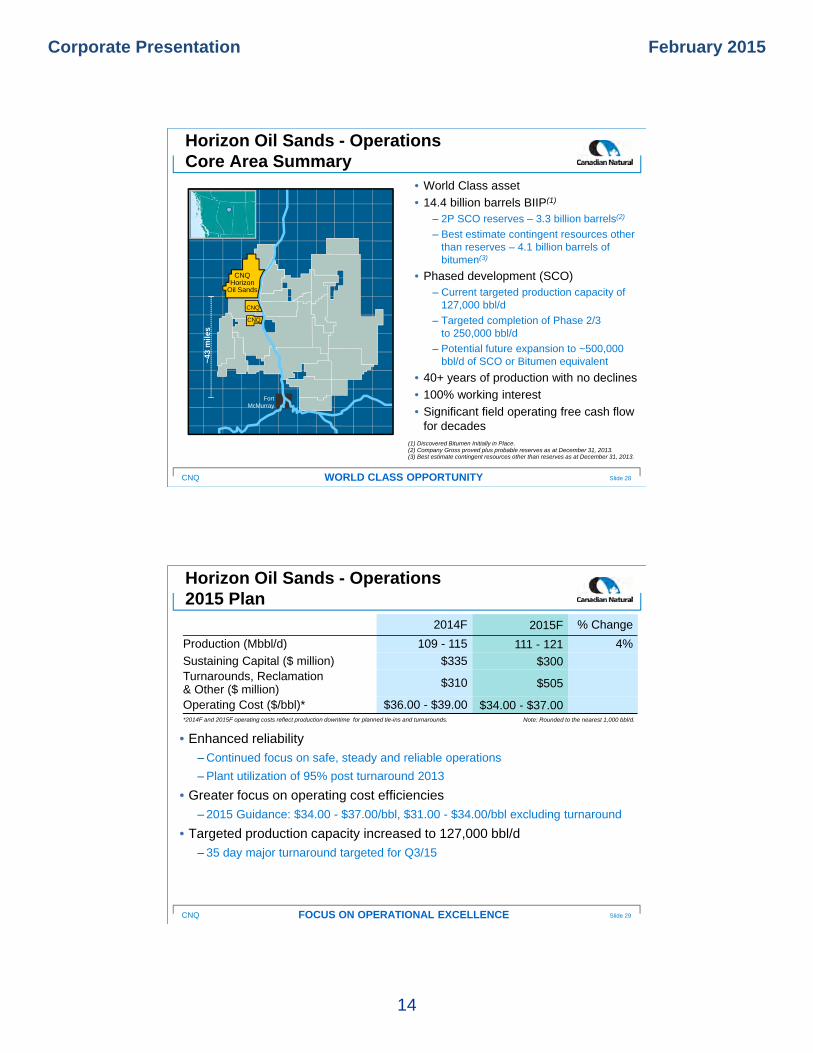
Thermal In Situ Oil Sands Growth Plan
Slide 26CAPTURING VALUE BY DOING IT RIGHT
• 522,000 bbl/d of oil facility capacity in the defined growth plan
• 40,000 - 60,000 bbl/d addition every 2-3 years
• 100% working interest and operatorship
Phase Reservoir Oil Facility
Capacity Target(bbl/d)
Target Steam-InTiming
(year)
Primrose South/North CSS Clearwater 80,000 On Stream
Primrose East CSS Clearwater 40,000 On Stream
Kirby South SAGD McMurray 40,000 On Stream
Kirby North Phase 1 SAGD McMurray 40,000 TBD
Grouse SAGD McMurray 40,000 2017 - 2019
Lindbergh SAGD Grand Rapids 12,000 2019 - 2020
Primrose Expansion CSS/SAGD Clwtr/GrRpds 50,000 2020 - 2021
Kirby North Phase 2 SAGD Wabiskaw 60,000 2022 - 2023
Gregoire Phase 1 SAGD McMurray 60,000 2024 - 2025
Pelican SAGD Grand Rapids 40,000 2026 - 2027
Gregoire Phase 2 SAGD McMurray 60,000 2028 - 2029
Note: Dependent upon economic and regulatory conditions, commodity prices, global economic factors, project sanction and capital allocation.
CNQ
Thermal In Situ Oil Sands 2015 Plan
2014F 2015F % Change
Production (Mbbl/d) 112 - 122 126 - 140 14%Drilling (net wells)
Primrose producers 11 –Kirby producers 4 3Strats 88 27Service / observation wells 62 22
Total 165 52Capital ($ million) $1,080 $460
Slide 27CONTINUED PRODUCTION GROWTH WITH LONG TERM FOCUS
Note: Rounded to the nearest 1,000 bbl/d.See Advisory for pricing assumptions – Note 2.
Corporate Presentation February 2015
14
CNQ
Horizon Oil Sands - OperationsCore Area Summary
• World Class asset
• 14.4 billion barrels BIIP(1)
‒ 2P SCO reserves – 3.3 billion barrels(2)
‒ Best estimate contingent resources other than reserves – 4.1 billion barrels of bitumen(3)
• Phased development (SCO)‒ Current targeted production capacity of
127,000 bbl/d
‒ Targeted completion of Phase 2/3 to 250,000 bbl/d
‒ Potential future expansion to ~500,000 bbl/d of SCO or Bitumen equivalent
• 40+ years of production with no declines
• 100% working interest
• Significant field operating free cash flow for decades
Slide 28WORLD CLASS OPPORTUNITY
(1) Discovered Bitumen Initially in Place.(2) Company Gross proved plus probable reserves as at December 31, 2013.(3) Best estimate contingent resources other than reserves as at December 31, 2013.
UTS
SYN
SHC
SYN
SYN
DVN
PCASU
PCA
IOL
ECA
SU
SU
IOL
HSE
XOM
SHC
SU
SynencoSHC
XOM
ECA
ECA
Deer Creek
SU
FortMcMurray
~4
3 m
ile
s
CNQ
CNQ
CNQHorizon
Oil Sands
CNQ
• Enhanced reliability
‒Continued focus on safe, steady and reliable operations
‒Plant utilization of 95% post turnaround 2013
• Greater focus on operating cost efficiencies
‒ 2015 Guidance: $34.00 - $37.00/bbl, $31.00 - $34.00/bbl excluding turnaround
• Targeted production capacity increased to 127,000 bbl/d
‒ 35 day major turnaround targeted for Q3/15
Horizon Oil Sands - Operations2015 Plan
Slide 29FOCUS ON OPERATIONAL EXCELLENCE
2014F 2015F % Change
Production (Mbbl/d) 109 - 115 111 - 121 4%
Sustaining Capital ($ million) $335 $300Turnarounds, Reclamation & Other ($ million) $310 $505
Operating Cost ($/bbl)* $36.00 - $39.00 $34.00 - $37.00Note: Rounded to the nearest 1,000 bbl/d. *2014F and 2015F operating costs reflect production downtime for planned tie-ins and turnarounds.
Corporate Presentation February 2015
15
CNQ
70
72
74
76
78
80
82
84
86
88
90
92
94
96
98
100
CNQ CNQ CNQ CNQ Peer 1 Peer 2 CNQ Peer 1 Peer 2
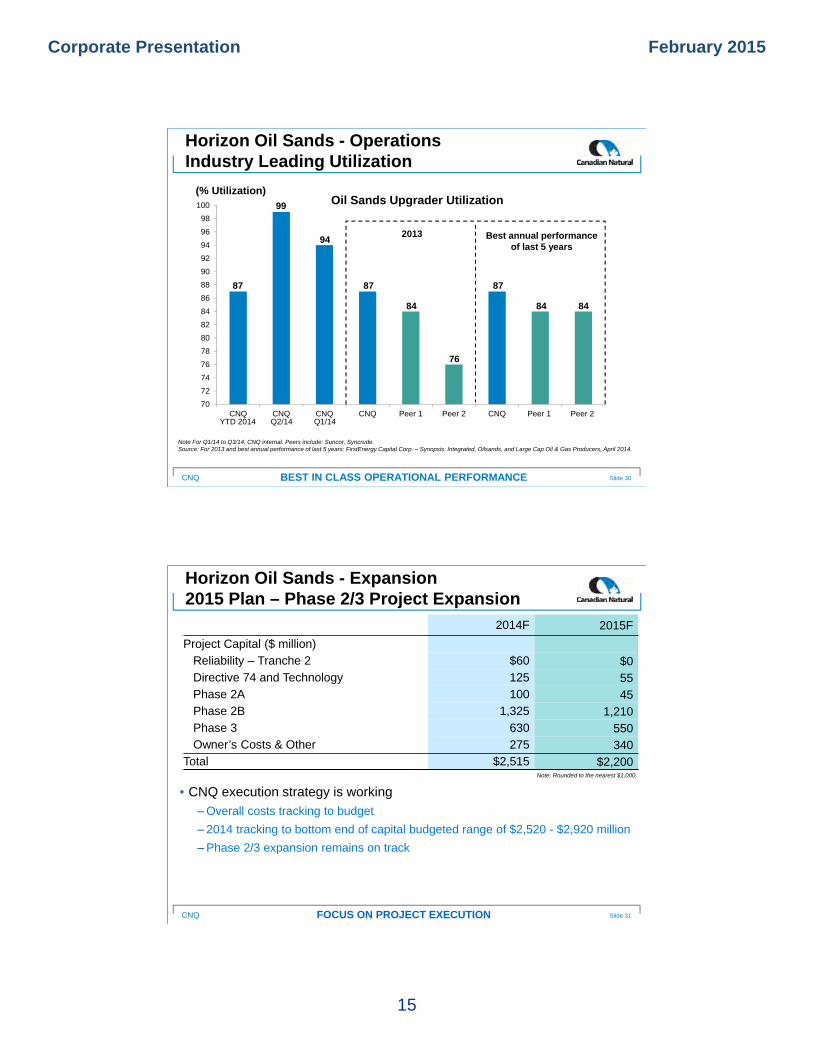
Horizon Oil Sands - OperationsIndustry Leading Utilization
Slide 30BEST IN CLASS OPERATIONAL PERFORMANCE
Q1/14
Note For Q1/14 to Q3/14, CNQ internal. Peers include: Suncor, Syncrude.Source: For 2013 and best annual performance of last 5 years: FirstEnergy Capital Corp. – Synopsis: Integrated, Oilsands, and Large Cap Oil & Gas Producers, April 2014.
Best annual performance of last 5 years
2013
Oil Sands Upgrader Utilization(% Utilization)
YTD 2014 Q2/14
87
84
76
87
84 84
87
99
94
CNQ
Horizon Oil Sands - Expansion2015 Plan – Phase 2/3 Project Expansion
Slide 31FOCUS ON PROJECT EXECUTION
2014F 2015F
Project Capital ($ million)
Reliability – Tranche 2 $60 $0Directive 74 and Technology 125 55Phase 2A 100 45Phase 2B 1,325 1,210Phase 3 630 550Owner’s Costs & Other 275 340
Total $2,515 $2,200
• CNQ execution strategy is working
‒Overall costs tracking to budget
‒ 2014 tracking to bottom end of capital budgeted range of $2,520 - $2,920 million
‒Phase 2/3 expansion remains on track
Note: Rounded to the nearest $1,000.
Corporate Presentation February 2015
16
CNQ
75,000
100,000
125,000
150,000
175,000
200,000
225,000
250,000
275,000
2012 2013 2014F 2015F 2016F 2017F 2018F 2019F
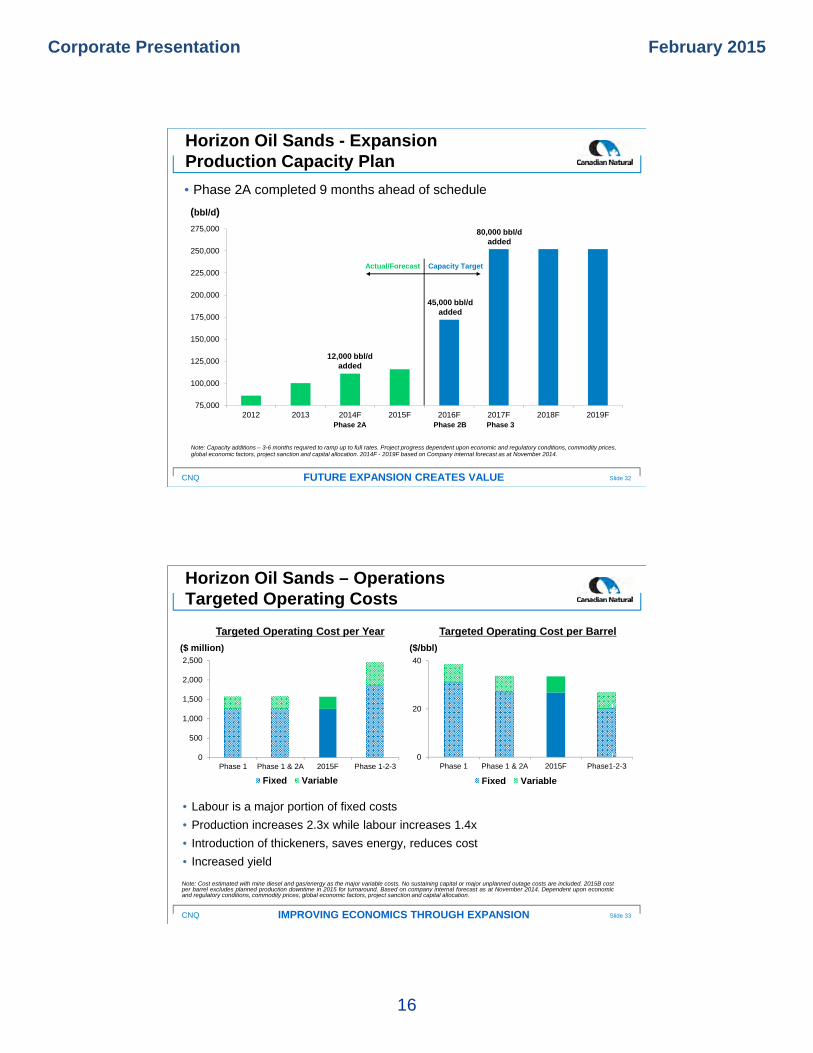
Horizon Oil Sands - ExpansionProduction Capacity Plan
Slide 32FUTURE EXPANSION CREATES VALUE
Actual/Forecast Capacity Target
12,000 bbl/d added
45,000 bbl/d added
80,000 bbl/d added
Phase 2A Phase 2B Phase 3
Note: Capacity additions – 3-6 months required to ramp up to full rates. Project progress dependent upon economic and regulatory conditions, commodity prices, global economic factors, project sanction and capital allocation. 2014F - 2019F based on Company internal forecast as at November 2014.
(bbl/d)
• Phase 2A completed 9 months ahead of schedule
CNQ
Horizon Oil Sands – OperationsTargeted Operating Costs
Slide 33IMPROVING ECONOMICS THROUGH EXPANSION
($/bbl)($ million)
Targeted Operating Cost per BarrelTargeted Operating Cost per Year
Note: Cost estimated with mine diesel and gas/energy as the major variable costs. No sustaining capital or major unplanned outage costs are included. 2015B costper barrel excludes planned production downtime in 2015 for turnaround. Based on company internal forecast as at November 2014. Dependent upon economicand regulatory conditions, commodity prices, global economic factors, project sanction and capital allocation.
• Labour is a major portion of fixed costs
• Production increases 2.3x while labour increases 1.4x
• Introduction of thickeners, saves energy, reduces cost
• Increased yield
0
500
1,000
1,500
2,000
2,500
Phase 1 Phase 1 & 2A 2015F Phase 1-2-3
Fixed Variable
0
20
40
Phase 1 Phase 1 & 2A 2015F Phase1-2-3
Fixed Variable
Corporate Presentation February 2015
17
CNQ
-$3
-$2
-$1
$0
$1
$2
$3
$4
$5
$6
$7
$8
2013 2014F 2015F 2016F 2017F 2018F 2019F 2020F
Targeted Total Corporate Free Cash Flow
GROWING FREE CASH FLOW
($ Billion)
Note: Dependent upon economic and regulatory conditions, commodity prices, global economic factors, project sanction and capital allocation.Free cash flow represents cash flow (cash flow net of corporate costs, interest, foreign exchange and taxes) less capital before dividends and share purchases.2015F reflects capital spending of $8.6 billion as issued November 6, 2014 for the original 2015 Budget. Capital targeted between $8.0 and $8.75 billion for2016F-2017F and less thereafter.
See Advisory for pricing assumptions – Note: 2 & 3.
Free Cash Flow including 2014 opportunistic acquisitions
Slide 34
$90.00
$81.00
$70.00
CNQ
0
200
400
600
800
1,000
CNQ EOG PXD DVN APA APC SU CVE
Committed Management
• Substantial management and director wealth at stake ‒Strong motivation for
management to perform‒Delivers clear alignment with
shareholder interests
Slide 35CONSISTENT HISTORY OF VALUE CREATION
Note: Based on share ownership data excluding options and priced at January 8, 2015.Source: SEDI and BD Corporate.
Management / Directors Stock Ownership(US$ million)
$851
Corporate Presentation February 2015
18
CNQ
• Strong Balance Sheet• Large, diversified, well balanced asset base• Transition to longer-life, low decline assets reduces capital
requirements while maintaining production• Delivering increasing and more sustainable free cash flow
to allocate to:‒Resource development – transitioning to longer life assets‒Returns to shareholders‒Opportunistic acquisitions‒Balance sheet strength
• Driven by:‒Effective capital allocation‒Effective and efficient operations‒Strong management teams
Canadian Natural’s Advantage
GROWING AND INCREASING THE SUSTAINABLY OF FREE CASH FLOW Slide 36
Corporate Presentation February 2015
19
CNQ
PROVEN EFFECTIVE STRATEGY
PREMIUM VALUE, DEFINED GROWTH, INDEPENDENT.
Appendices
CNQ
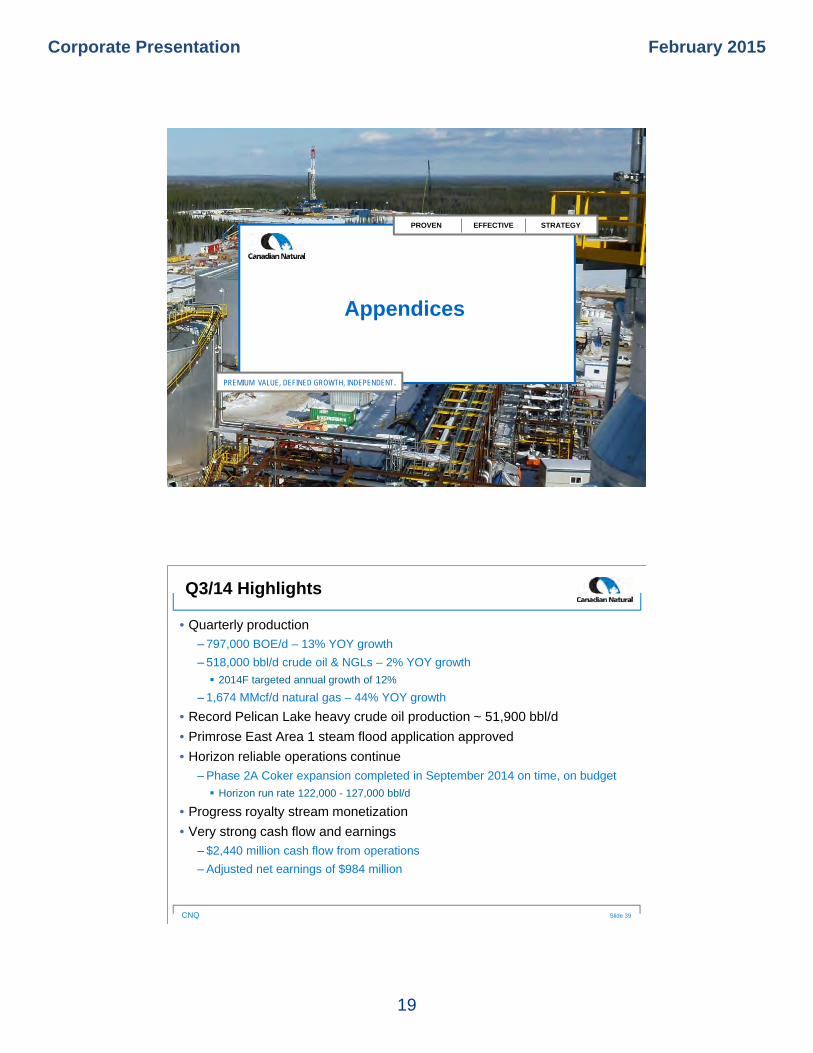
• Quarterly production
‒ 797,000 BOE/d – 13% YOY growth
‒ 518,000 bbl/d crude oil & NGLs – 2% YOY growth
2014F targeted annual growth of 12%
‒ 1,674 MMcf/d natural gas – 44% YOY growth
• Record Pelican Lake heavy crude oil production ~ 51,900 bbl/d
• Primrose East Area 1 steam flood application approved
• Horizon reliable operations continue
‒Phase 2A Coker expansion completed in September 2014 on time, on budget
Horizon run rate 122,000 - 127,000 bbl/d
• Progress royalty stream monetization
• Very strong cash flow and earnings
‒ $2,440 million cash flow from operations
‒Adjusted net earnings of $984 million
Q3/14 Highlights
Slide 39
Corporate Presentation February 2015
20
CNQ
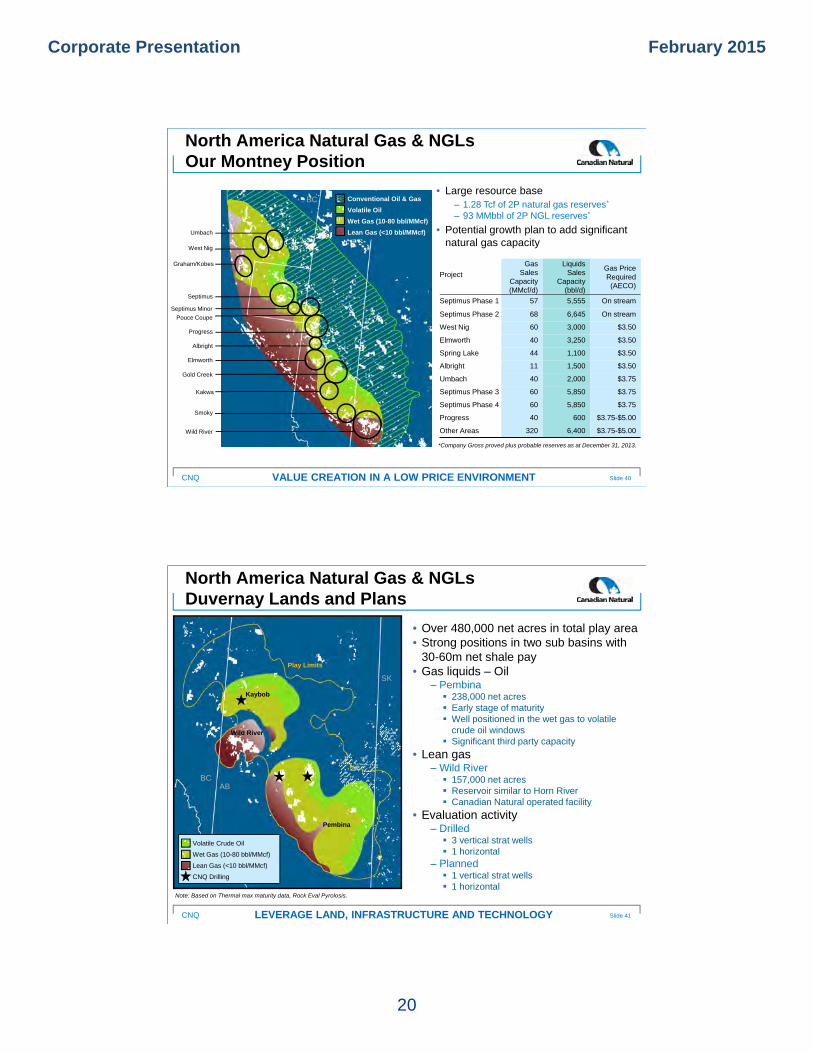
North America Natural Gas & NGLsOur Montney Position
Project
GasSales
Capacity (MMcf/d)
Liquids Sales
Capacity (bbl/d)
Gas Price Required(AECO)
Septimus Phase 1 57 5,555 On stream
Septimus Phase 2 68 6,645 On stream
West Nig 60 3,000 $3.50
Elmworth 40 3,250 $3.50
Spring Lake 44 1,100 $3.50
Albright 11 1,500 $3.50
Umbach 40 2,000 $3.75
Septimus Phase 3 60 5,850 $3.75
Septimus Phase 4 60 5,850 $3.75
Progress 40 600 $3.75-$5.00
Other Areas 320 6,400 $3.75-$5.00
Slide 40VALUE CREATION IN A LOW PRICE ENVIRONMENT
AB
*Company Gross proved plus probable reserves as at December 31, 2013.
BC
Umbach
Septimus
West Nig
Pouce Coupe
Progress
Septimus Minor
Albright
Elmworth
Gold Creek
Wild River
Kakwa
Smoky
Conventional Oil & Gas
Volatile Oil
Wet Gas (10-80 bbl/MMcf)
Lean Gas (<10 bbl/MMcf)
• Large resource base‒ 1.28 Tcf of 2P natural gas reserves*
‒ 93 MMbbl of 2P NGL reserves*
• Potential growth plan to add significant natural gas capacity
Graham/Kobes
CNQ
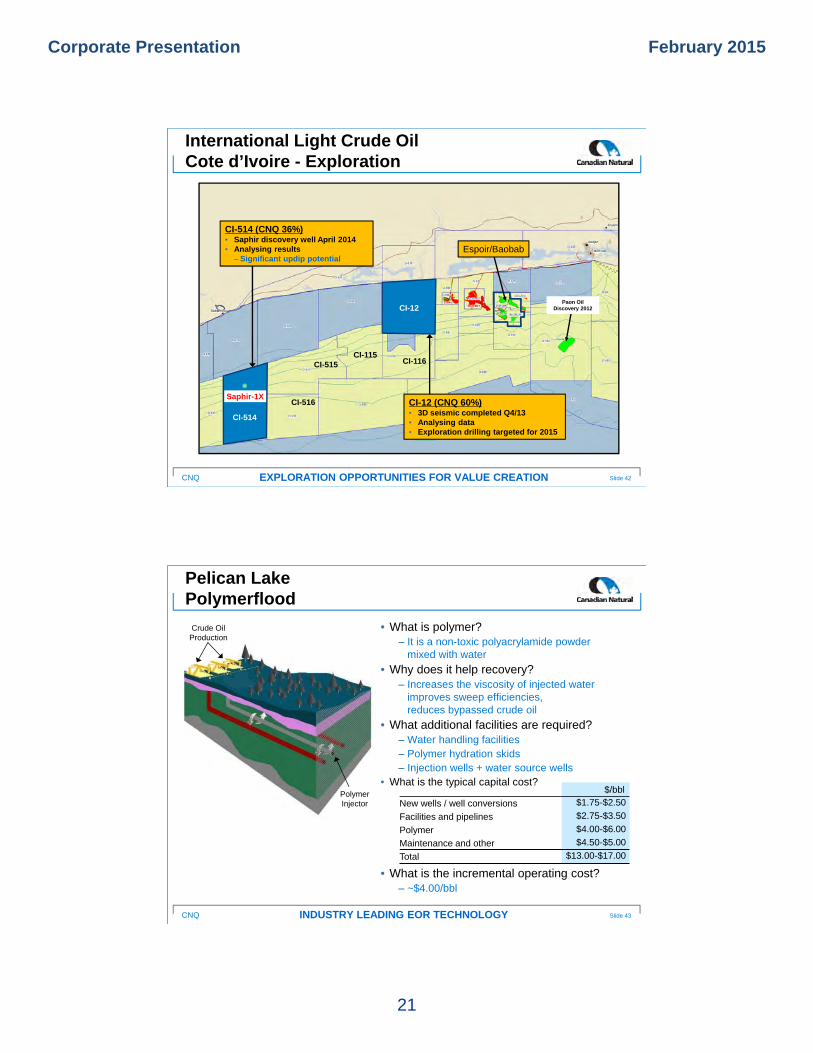
North America Natural Gas & NGLsDuvernay Lands and Plans
Slide 41LEVERAGE LAND, INFRASTRUCTURE AND TECHNOLOGY
Kaybob
Wild River
Pembina
AB
Volatile Crude Oil
Wet Gas (10-80 bbl/MMcf)
Lean Gas (<10 bbl/MMcf)
CNQ Drilling
Play Limits
Note: Based on Thermal max maturity data, Rock Eval Pyrolosis.
• Over 480,000 net acres in total play area• Strong positions in two sub basins with
30-60m net shale pay• Gas liquids – Oil
‒ Pembina 238,000 net acres Early stage of maturity Well positioned in the wet gas to volatile
crude oil windows Significant third party capacity
• Lean gas‒ Wild River 157,000 net acres Reservoir similar to Horn River Canadian Natural operated facility
• Evaluation activity‒ Drilled 3 vertical strat wells 1 horizontal
‒ Planned 1 vertical strat wells 1 horizontal
BC
SK
Corporate Presentation February 2015
21
CNQ
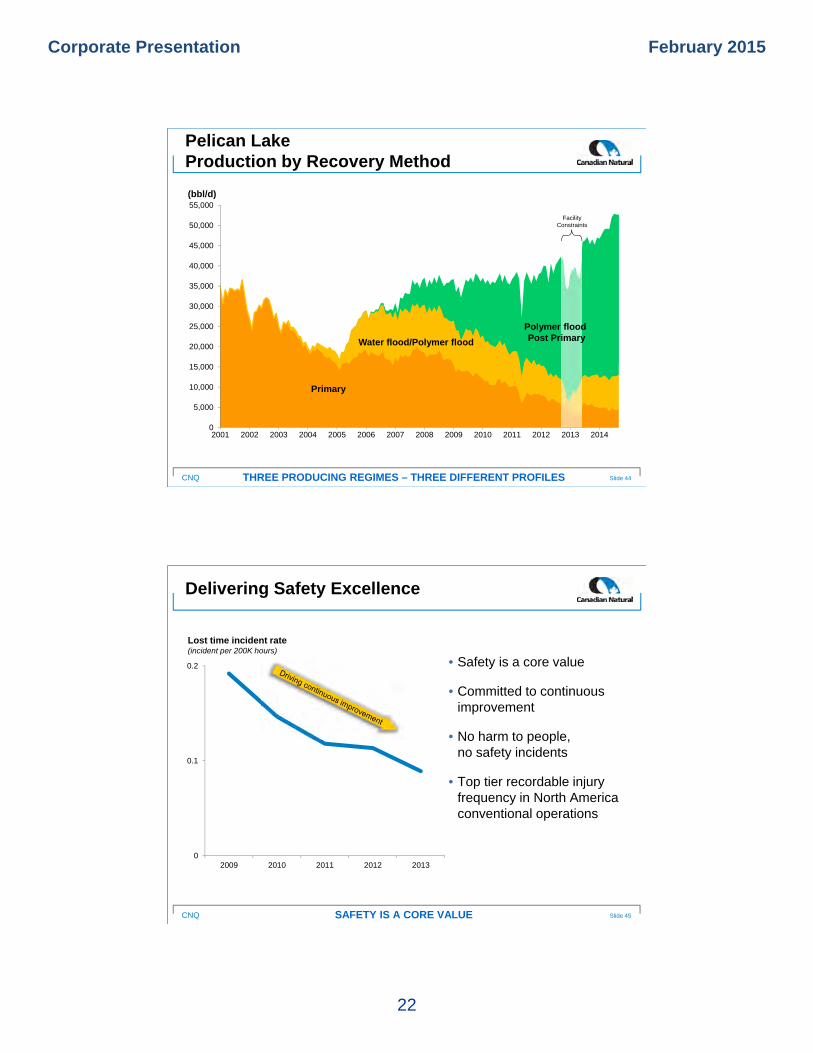
International Light Crude Oil Cote d’Ivoire - Exploration
Slide 42EXPLORATION OPPORTUNITIES FOR VALUE CREATION
12.5km
CI-12
CI-515
CI-516
CI-115CI-116
CI-514
Saphir-1X
Espoir/Baobab
Paon Oil Discovery 2012
CI-12 (CNQ 60%) • 3D seismic completed Q4/13• Analysing data• Exploration drilling targeted for 2015
CI-514 (CNQ 36%)• Saphir discovery well April 2014• Analysing results
– Significant updip potential
CNQ
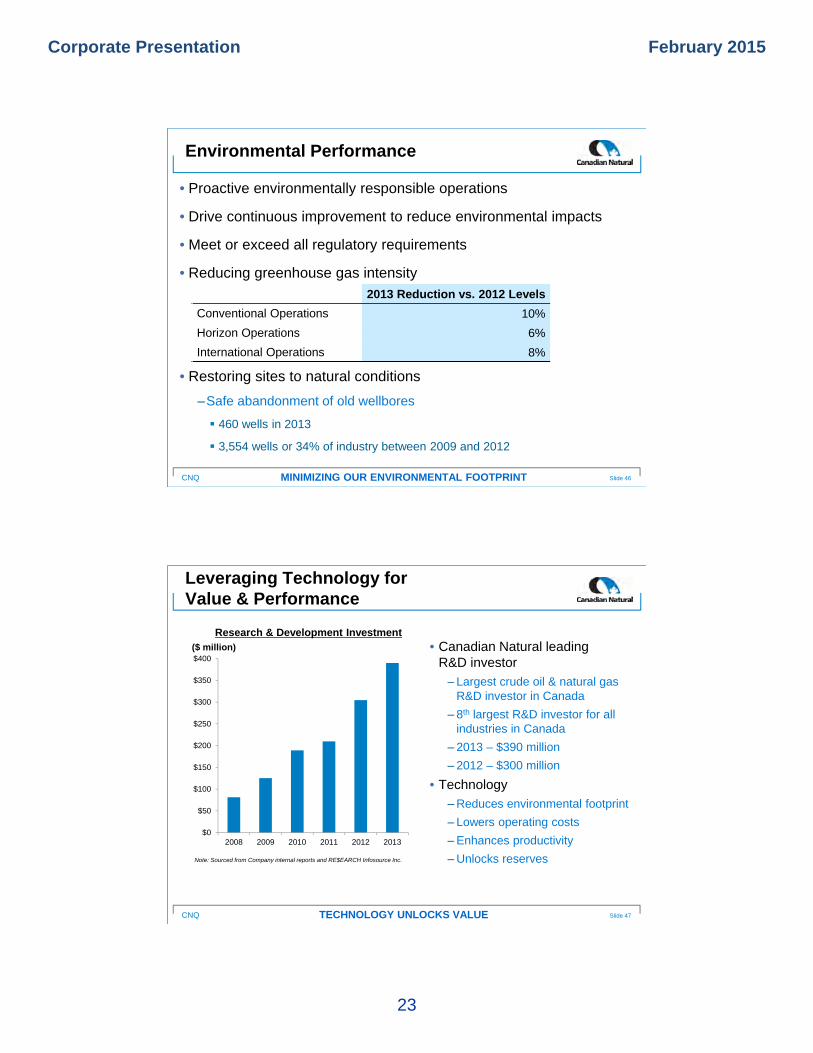
Pelican Lake Polymerflood
Slide 43INDUSTRY LEADING EOR TECHNOLOGY
$/bbl
New wells / well conversions $1.75-$2.50
Facilities and pipelines $2.75-$3.50
Polymer $4.00-$6.00
Maintenance and other $4.50-$5.00
Total $13.00-$17.00
PolymerInjector
Crude Oil Production
• What is polymer?‒ It is a non-toxic polyacrylamide powder
mixed with water
• Why does it help recovery?‒ Increases the viscosity of injected water
improves sweep efficiencies, reduces bypassed crude oil
• What additional facilities are required?‒ Water handling facilities‒ Polymer hydration skids‒ Injection wells + water source wells
• What is the typical capital cost?
• What is the incremental operating cost?‒ ~$4.00/bbl
Corporate Presentation February 2015
22
CNQ
0
5,000
10,000
15,000
20,000
25,000
30,000
35,000
40,000
45,000
50,000
55,000
2001 2002 2003 2004 2005 2006 2007 2008 2009 2010 2011 2012 2013 2014
Pelican Lake Production by Recovery Method
Slide 44THREE PRODUCING REGIMES – THREE DIFFERENT PROFILES
Primary
Water flood/Polymer flood
(bbl/d)
Facility Constraints
Polymer flood Post Primary
CNQ
Delivering Safety Excellence
Slide 45SAFETY IS A CORE VALUE
0
0.1
0.2
2009 2010 2011 2012 2013
Lost time incident rate(incident per 200K hours)
• Safety is a core value
• Committed to continuous improvement
• No harm to people,no safety incidents
• Top tier recordable injury frequency in North America conventional operations
Corporate Presentation February 2015
23
CNQ
• Proactive environmentally responsible operations
• Drive continuous improvement to reduce environmental impacts
• Meet or exceed all regulatory requirements
• Reducing greenhouse gas intensity
• Restoring sites to natural conditions
‒Safe abandonment of old wellbores
460 wells in 2013
3,554 wells or 34% of industry between 2009 and 2012
2013 Reduction vs. 2012 Levels
Conventional Operations 10%
Horizon Operations 6%
International Operations 8%
Environmental Performance
Slide 46MINIMIZING OUR ENVIRONMENTAL FOOTPRINT
CNQ
$0
$50
$100
$150
$200
$250
$300
$350
$400
2008 2009 2010 2011 2012 2013
Leveraging Technology for Value & Performance
TECHNOLOGY UNLOCKS VALUE
($ million)
Note: Sourced from Company internal reports and RE$EARCH Infosource Inc.
Research & Development Investment
• Canadian Natural leading R&D investor
‒ Largest crude oil & natural gas R&D investor in Canada
‒ 8th largest R&D investor for all industries in Canada
‒ 2013 – $390 million
‒ 2012 – $300 million
• Technology
‒Reduces environmental footprint
‒ Lowers operating costs
‒Enhances productivity
‒Unlocks reserves
Slide 47
Corporate Presentation February 2015
24
CNQ
• Incremental PADD 2 conversion capacity
‒ BP Whiting refinery capacity increase of 260,000 bbl/d
• Significant additional rail loading capacity in WCSB
‒ 1.4 Mmbbl/d of loading capacity by Q4/15
‒ Approximately 200 – 300 Mbbl/d railed out of WCSB today
• Debottlenecking pipeline capacity to USGC via Cushing adds substantial incremental markets
‒ Cushing to USGC
Seaway 400,000 bbl/d with expansion up to 850,000 bbl/d – in service
Keystone Marketlink capacity of 700,000 bbl/d – in service
‒ Canadian heavy crude oil into Cushing
Spearhead estimated at 150,000 bbl/d
Keystone Base estimated at 275,000 – 300,000 bbl/d
• Redwater targeted on-stream 2017 – 50,000 bbl/d of bitumen
MarketingContinued Strong Heavy Oil Pricing
Slide 48INCREMENTAL MARKETS – STRONG HEAVY OIL PRICING
CNQ
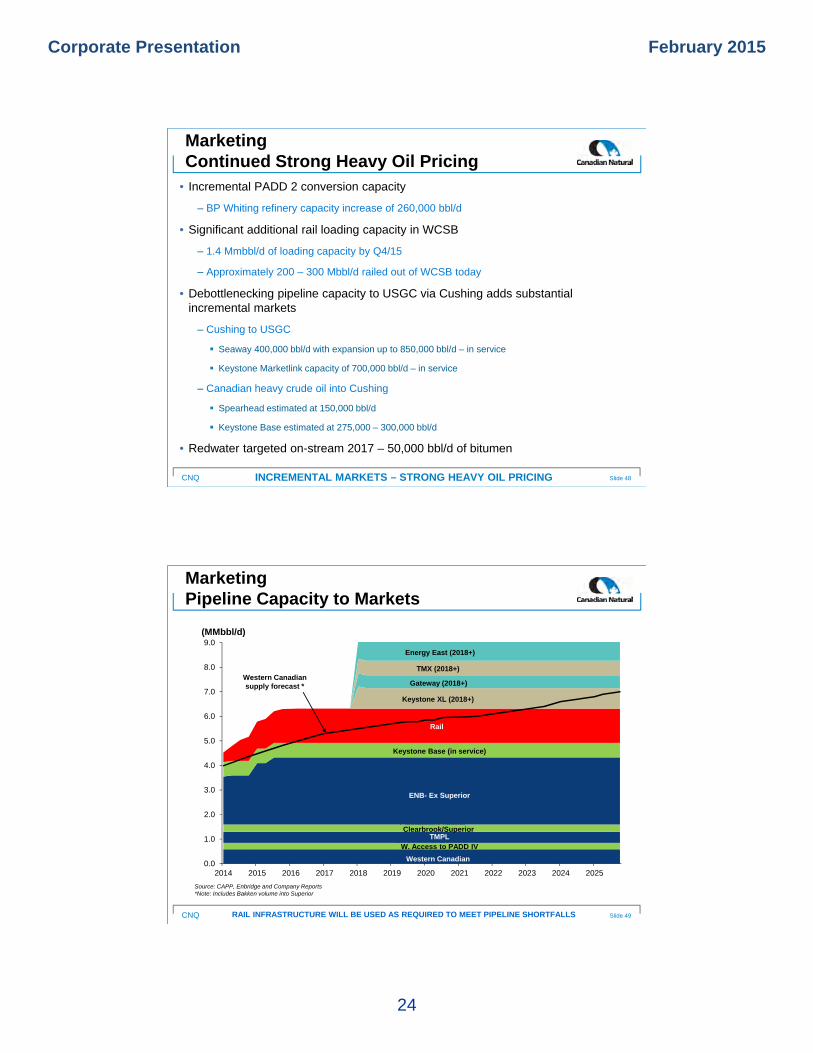
MarketingPipeline Capacity to Markets
Slide 49RAIL INFRASTRUCTURE WILL BE USED AS REQUIRED TO MEET PIPELINE SHORTFALLS
(MMbbl/d)
Western Canadian Refineries
TMPL
ENB- Ex Superior
W. Access to PADD IV
Clearbrook/Superior
Keystone Base (in service)
Rail
Keystone XL (2017)
Gateway (2017+)TMX (2017+)
Energy East (2017+)
Source: CAPP, Enbridge and Company Reports*Note: Includes Bakken volume into Superior
0.0
1.0
2.0
3.0
4.0
5.0
6.0
7.0
8.0
9.0
2014 2015 2016 2017 2018 2019 2020 2021 2022 2023 2024 2025
Western Canadian RefineriesTMPL
ENB- Ex Superior
W. Access to PADD IV
Clearbrook/Superior
Keystone Base (in service)
Rail
Keystone XL (2018+)
Gateway (2018+)
TMX (2018+)
Energy East (2018+)
TMPL
Western Canadian Refineries
Western Canadian supply forecast *
Corporate Presentation February 2015
25
CNQ
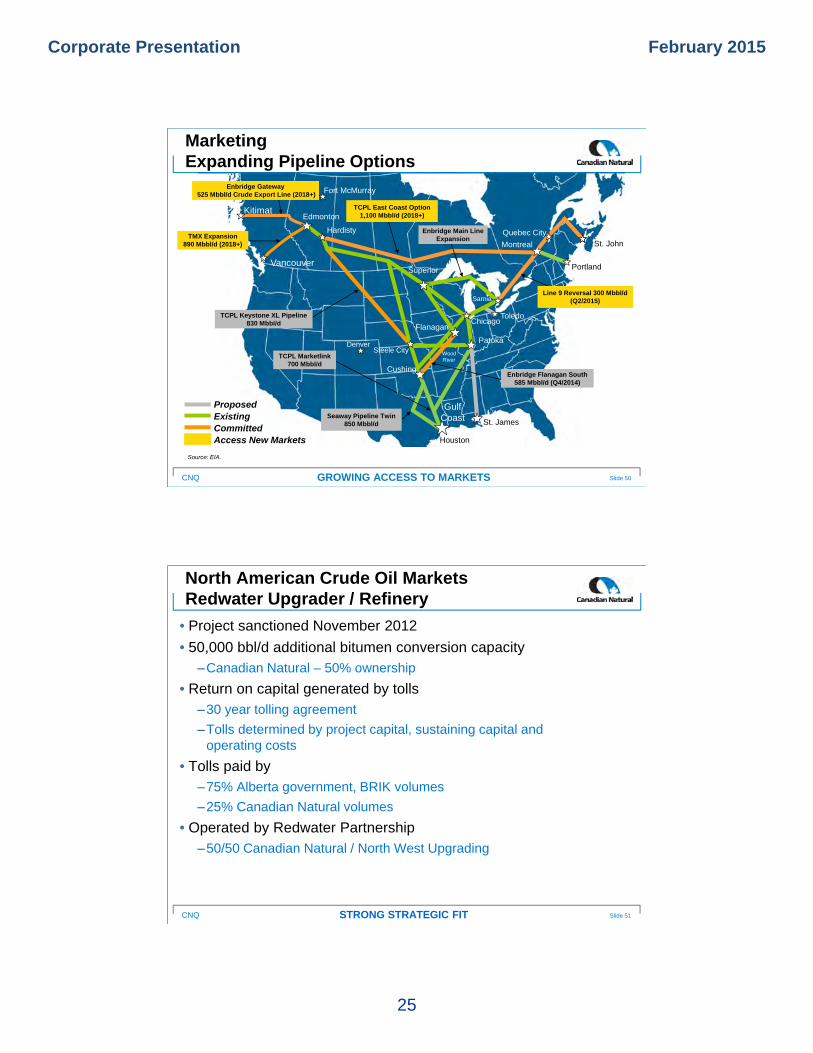
Superior
Fort McMurray
KitimatEdmonton
Steele City
Sarnia
Montreal
Portland
St. John
Enbridge Gateway525 Mbbl/d Crude Export Line (2018+)
TMX Expansion 890 Mbbl/d (2018+)
Seaway Pipeline Twin850 Mbbl/d
Vancouver
Houston
Toledo
Hardisty
TCPL East Coast Option 1,100 Mbbl/d (2018+)
ProposedExistingCommittedAccess New Markets
WoodRiver
TCPL Marketlink700 Mbbl/d
TCPL Keystone XL Pipeline830 Mbbl/d
Enbridge Main Line Expansion
GulfCoast
Enbridge Flanagan South585 Mbbl/d (Q4/2014)
Quebec City
MarketingExpanding Pipeline Options
Slide 50GROWING ACCESS TO MARKETS
Source: EIA.
St. James
Denver
Line 9 Reversal 300 Mbbl/d (Q2/2015)
Chicago
Patoka
Flanagan
Cushing
CNQ
• Project sanctioned November 2012
• 50,000 bbl/d additional bitumen conversion capacity‒Canadian Natural – 50% ownership
• Return on capital generated by tolls‒30 year tolling agreement
‒Tolls determined by project capital, sustaining capital and operating costs
• Tolls paid by‒75% Alberta government, BRIK volumes
‒25% Canadian Natural volumes
• Operated by Redwater Partnership‒50/50 Canadian Natural / North West Upgrading
North American Crude Oil Markets Redwater Upgrader / Refinery
Slide 51STRONG STRATEGIC FIT
Corporate Presentation February 2015
26
CNQ
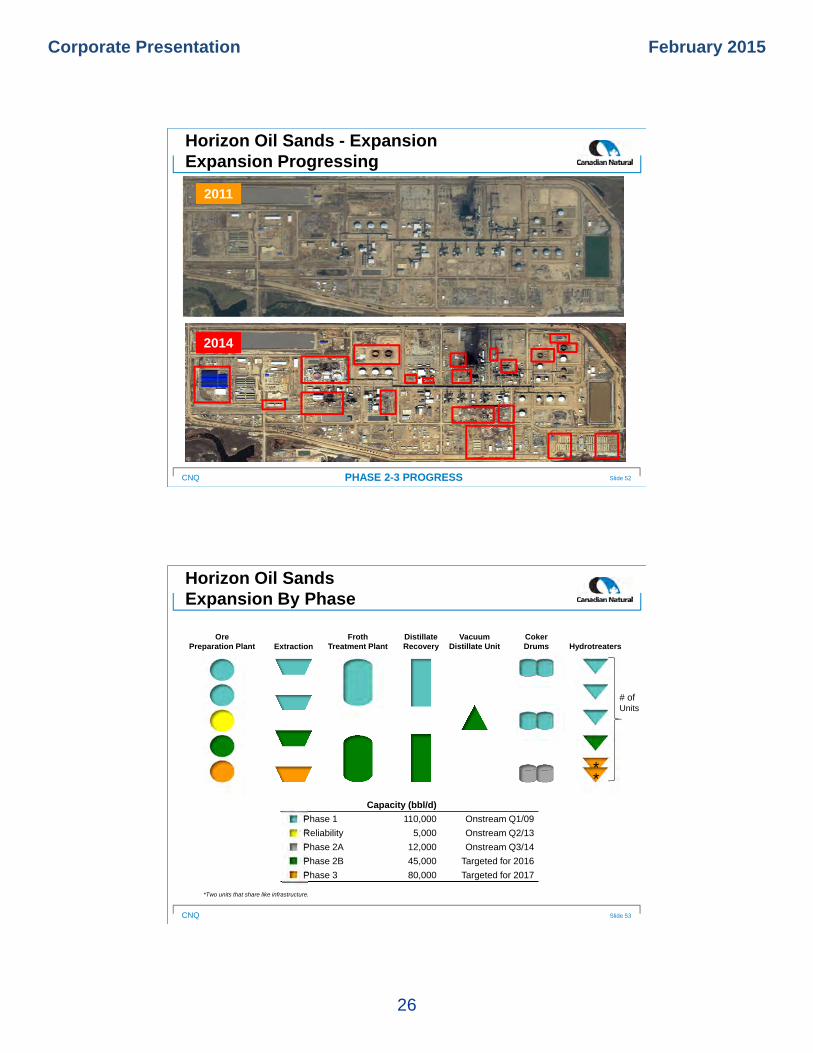
Horizon Oil Sands - ExpansionExpansion Progressing
Slide 52PHASE 2-3 PROGRESS
2014
2011
CNQ
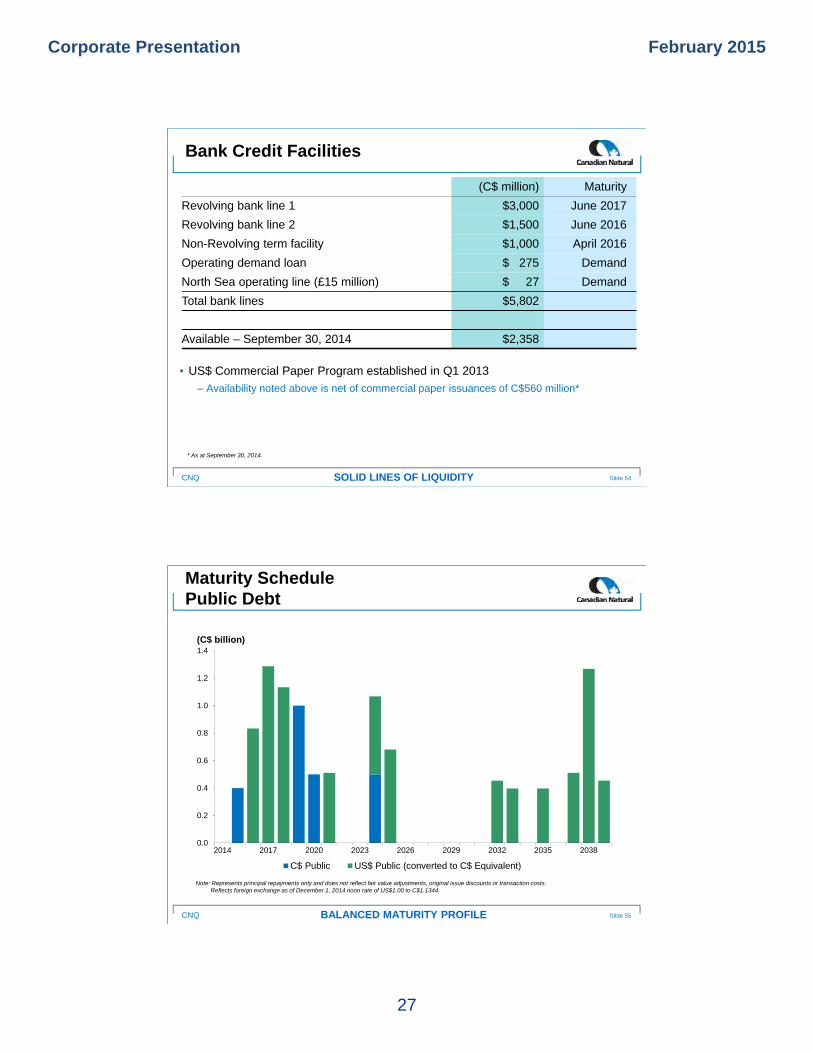
Horizon Oil SandsExpansion By Phase
Slide 53
OrePreparation Plant Extraction
Froth Treatment Plant
Distillate Recovery
Vacuum Distillate Unit
Coker Drums Hydrotreaters
**
# of Units
Capacity (bbl/d)
Phase 1 110,000 Onstream Q1/09
Reliability 5,000 Onstream Q2/13
Phase 2A 12,000 Onstream Q3/14
Phase 2B 45,000 Targeted for 2016
Phase 3 80,000 Targeted for 2017
*Two units that share like infrastructure.
Corporate Presentation February 2015
27
CNQ
Bank Credit Facilities
(C$ million) Maturity
Revolving bank line 1 $3,000 June 2017
Revolving bank line 2 $1,500 June 2016
Non-Revolving term facility $1,000 April 2016
Operating demand loan $ 275 Demand
North Sea operating line (£15 million) $ 27 Demand
Total bank lines $5,802
Available – September 30, 2014 $2,358
Slide 54SOLID LINES OF LIQUIDITY
• US$ Commercial Paper Program established in Q1 2013
‒ Availability noted above is net of commercial paper issuances of C$560 million*
* As at September 30, 2014.
CNQ
0.0
0.2
0.4
0.6
0.8
1.0
1.2
1.4
2014 2017 2020 2023 2026 2029 2032 2035 2038
C$ Public US$ Public (converted to C$ Equivalent)
Maturity SchedulePublic Debt
Slide 55BALANCED MATURITY PROFILE
(C$ billion)
Note: Represents principal repayments only and does not reflect fair value adjustments, original issue discounts or transaction costs.Reflects foreign exchange as of December 1, 2014 noon rate of US$1.00 to C$1.1344.

Notes
Advisory Special Note Regarding Currency, Production and ReservesIn this document, all references to dollars refer to Canadian dollars unless otherwise stated. Reserves and production data are presented on a before royalties basis unless otherwise stated. In addition, reference is made to crude oil and natural gas in common units called barrel of oil equivalent ("BOE"). A BOE is derived by converting six thousand cubic feet of natural gas to one barrel of crude oil (6Mcf:1bbl). This conversion may be misleading, particularly if used in isolation, since the 6Mcf:1bbl ratio is based on an energy equivalency conversion method primarily applicable at the burner tip and does not represent a value equivalency at the wellhead. In comparing the value ratio using current crude oil prices relative to natural gas prices, the 6Mcf:1bbl conversion ratio may be misleading as an indication of value.
This document , herein incorporated by reference, have been prepared in accordance with IFRS, as issued by the International Accounting Standards Board.
For the year ended December 31, 2013 the Company retained Independent Qualified Reserves Evaluators (“Evaluators”), Sproule Associates Limited and Sproule International Limited (together as “Sproule”) and GLJ Petroleum Consultants Ltd. (“GLJ”), to evaluate and review all of the Company’s proved and proved plus probable reserves with an effective date of December 31, 2013 and a preparation date of February 3, 2014. Sproule evaluated the North America and International light and medium crude oil, primary heavy crude oil, Pelican Lake heavy crude oil, bitumen (thermal oil), natural gas and NGLs reserves. GLJ evaluated the Horizon SCO reserves. The evaluation and review was conducted in accordance with the standards contained in the Canadian Oil and Gas Evaluation Handbook (“COGE Handbook”) and disclosed in accordance with National Instrument 51-101 – Standards of Disclosure for Oil and Gas Activities (“NI 51-101”) requirements. In previous years, Canadian Natural had been granted an exemption order from the securities regulators in Canada that allowed substitution of U.S. Securities Exchange Commission (“SEC”) requirements for certain NI 51-101 reserves disclosures. This exemption expired on December 31, 2010. As a result, the 2011 and 2012 reserves disclosure is presented in accordance with Canadian reporting requirements using forecast prices and escalated costs.
The Company annually discloses net proved reserves and the standardized measure of discounted future net cash flows using 12-month average prices and current costs in accordance with United States Financial Accounting Standards Board Topic 932 “Extractive Activities - Oil and Gas” in the Company’s Form 40-F filed with the SEC in the “Supplementary Oil and Gas Information” section of the Company’s Annual Report released in March 2014.
Resources Other Than ReservesThe contingent resources other than reserves (“resources”) estimates provided in this presentation are internally evaluated by qualified reserves evaluators in accordance with the COGE Handbook as directed by NI 51-101. No independent third party evaluation or audit was completed. Resources provided are best estimates as of December 31, 2013. The resources are evaluated using deterministic methods which represent the expected outcome with no optimism or conservatism.
Resources, as per the COGE Handbook definition, are those quantities of petroleum estimated, as of a given date, to be potentially recoverable from known accumulations using established technology or technology under development, but are not currently considered commercially viable due to one or more contingencies. There is no certainty that it will be commercially viable to produce any portion of these resources.
Due to the inherent differences in standards and requirements employed in the evaluation of reserves and contingent resources, the total volumes of reserves or resources are not to be considered indicative of total volumes that may actually be recovered and are provided for illustrative purposes only.
Crude oil, bitumen or natural gas initially-in-place volumes provided are discovered resources which include production, reserves, contingent resources and unrecoverable volumes.
Special Note Regarding non-GAAP Financial MeasuresThis document includes references to financial measures commonly used in the crude oil and natural gas industry, such as adjusted net earnings from operations, cash flow from operations, cash production costs and net asset value. These financial measures are not defined by International Financial Reporting Standards (“IFRS”) and therefore are referred to as non-GAAP measures. The non-GAAP measures used by the Company may not be comparable to similar measures presented by other companies. The Company uses these non-GAAP measures to evaluate its performance. The non-GAAP measures should not be considered an alternative to or more meaningful than net earnings, as determined in accordance with IFRS, as an indication of the Company’s performance. The non-GAAP measures adjusted net earnings from operations and cash flow from operations are reconciled to net earnings, as determined in accordance with IFRS, in the “Net Earnings and Cash Flow from Operations” section of the Company’s MD&A. The derivation of cash production costs is included in the “Operating Highlights – Oil Sands Mining and Upgrading” section of the Company’s MD&A. The Company also presents certain non-GAAP financial ratios and their derivation in the “Liquidity and Capital Resources” section of the Company’s MD&A.
Volumes shown are Company share before royalties unless otherwise stated.
Forward Looking StatementsCertain statements relating to Canadian Natural Resources Limited (the “Company”) in this document or documents incorporated herein by reference constitute forward-looking statementsor information (collectively referred to herein as “forward-looking statements”) within the meaning of applicable securities legislation. Forward-looking statements can be identified by thewords “believe”, “anticipate”, “expect”, “plan”, “estimate”, “target”, “continue”, “could”, “intend”, “may”, “potential”, “predict”, “should”, “will”, “objective”, “project”, “forecast”, “goal”, “guidance”,“outlook”, “effort”, “seeks”, “schedule”, “proposed” or expressions of a similar nature suggesting future outcome or statements regarding an outlook. Disclosure related to expected futurecommodity pricing, forecast or anticipated production volumes, royalties, operating costs, capital expenditures, income tax expenses, and other guidance provided throughout thispresentation constitute forward-looking statements. Disclosure of plans relating to and expected results of existing and future developments, including but not limited to the Horizon OilSands operations and future expansion, Septimus, Primrose thermal projects, Pelican Lake water and polymer flood project, the Kirby Thermal Oil Sands Project, construction of theproposed Keystone XL Pipeline from Hardisty, Alberta to the US Gulf coast, the proposed Kinder Morgan Trans Mountain pipeline expansion from Edmonton, Alberta to Vancouver, BritishColumbia, the proposed Energy East pipeline from Hardisty to Eastern Canada, the construction and future operations of the North West Redwater bitumen upgrader and refinery anddisclosures relating to the Devon Canada Asset acquisition also constitute forward-looking statements. This forward-looking information is based on annual budgets and multi-year forecasts,and is reviewed and revised throughout the year as necessary in the context of targeted financial ratios, project returns, product pricing expectations and balance in project risk and timehorizons. These statements are not guarantees of future performance and are subject to certain risks and the reader should not place undue reliance on these forward-looking statementsas there can be no assurances that the plans, initiatives or expectations upon which they are based will occur.
In addition, statements relating to “reserves” are deemed to be forward-looking statements as they involve the implied assessment based on certain estimates and assumptions that thereserves described can be profitably produced in the future. There are numerous uncertainties inherent in estimating quantities of proved and proved plus probable crude oil and natural gasand natural gas liquids (NGLs”) reserves and in projecting future rates of production and the timing of development expenditures. The total amount or timing of actual future production mayvary significantly from reserve and production estimates.
The forward-looking statements are based on current expectations, estimates and projections about the Company and the industry in which the Company operates, which speak only as ofthe date such statements were made or as of the date of the report or document in which they are contained, and are subject to known and unknown risks and uncertainties that couldcause the actual results, performance or achievements of the Company to be materially different from any future results, performance or achievements expressed or implied by suchforward-looking statements. Such risks and uncertainties include, among others: general economic and business conditions which will, among other things, impact demand for and marketprices of the Company’s products; volatility of and assumptions regarding crude oil and natural gas prices; fluctuations in currency and interest rates; assumptions on which the Company’scurrent guidance is based; economic conditions in the countries and regions in which the Company conducts business; political uncertainty, including actions of or against terrorists,insurgent groups or other conflict including conflict between states; industry capacity; ability of the Company to implement its business strategy, including exploration and developmentactivities; impact of competition; the Company’s defense of lawsuits; availability and cost of seismic, drilling and other equipment; ability of the Company and its subsidiaries to completecapital programs; the Company’s and its subsidiaries’ ability to secure adequate transportation for its products; unexpected disruptions or delays in the resumption of the mining, extractingor upgrading of the Company’s bitumen products; potential delays or changes in plans with respect to exploration or development projects or capital expenditures; ability of the Company toattract the necessary labour required to build its thermal and oil sands mining projects; operating hazards and other difficulties inherent in the exploration for and production and sale ofcrude oil and natural gas and in mining, extracting or upgrading the Company’s bitumen products; availability and cost of financing; the Company’s and its subsidiaries’ success ofexploration and development activities and their ability to replace and expand crude oil and natural gas reserves; timing and success of integrating the business and operations of acquiredcompanies; production levels; imprecision of reserve estimates and estimates of recoverable quantities of crude oil, natural gas and NGLs not currently classified as proved; actions bygovernmental authorities; government regulations and the expenditures required to comply with them (especially safety and environmental laws and regulations and the impact of climatechange initiatives on capital and operating costs); asset retirement obligations; the adequacy of the Company’s provision for taxes; and other circumstances affecting revenues andexpenses. The Company’s operations have been, and in the future may be, affected by political developments and by federal, provincial and local laws and regulations such as restrictionson production, changes in taxes, royalties and other amounts payable to governments or governmental agencies, price or gathering rate controls and environmental protection regulations.Should one or more of these risks or uncertainties materialize, or should any of the Company’s assumptions prove incorrect, actual results may vary in material respects from thoseprojected in the forward-looking statements. The impact of any one factor on a particular forward-looking statement is not determinable with certainty as such factors are dependent uponother factors, and the Company’s course of action would depend upon its assessment of the future considering all information then available. For additional information refer to the “RisksFactors” section of the AIF. Readers are cautioned that the foregoing list of factors is not exhaustive. Unpredictable or unknown factors not discussed in this report could also have materialadverse effects on forward-looking statements.
Although the Company believes that the expectations conveyed by the forward-looking statements are reasonable based on information available to it on the date such forward-lookingstatements are made, no assurances can be given as to future results, levels of activity and achievements. All subsequent forward-looking statements, whether written or oral, attributable tothe Company or persons acting on its behalf are expressly qualified in their entirety by these cautionary statements. Except as required by law, the Company assumes no obligation toupdate forward-looking statements, whether as a result of new information, future events or other factors, or the foregoing factors affecting this information, should circumstances orManagement’s estimates or opinions change.
AdvisoryFree Cash Flow Pricing Assumptions
1. 2014F based upon pricing assumptions at October 2014; WTI of US$95.34/bbl, AECO of C$4.19/GJ, WCS differential of 20% and foreign exchange of US$1.00 to C$1.10.
2. 2015F based upon pricing assumptions at October 2014; WTI of US$81.00/bbl, AECO of C$3.45/GJ, WCS differential of 18% and foreign exchange of US$1.00 to C$1.13. For $70 and $90 cases for 2015F, see table below.
3. 2016F to 2020F based on constant price assumptions of:
Definitions1. Field operating free cash flow represents operating cash flow (operational cash flow before corporate costs, interest, foreign exchange, risk management and
taxes) less capital. 2. Free cash flow represents cash flow (cash flow net of corporate costs, interest, foreign exchange and taxes) less capital before dividends and share purchases.3. CAGR – Compound Annual Growth Rate4. BOE/d – Barrel of oil equivalent per day
$70.00 WTI Strip $90.00 WTIWTI (US$) $70.00 $81.00 $90.00 NYMEX (US$/Mmbtu) $3.75 $3.74 $4.48AECO (C$/GJ) $3.50 $3.45 $4.00WCS differental 22% 22% 22%FX (1 US$ = X C$) $1.176 $1.126 $1.11
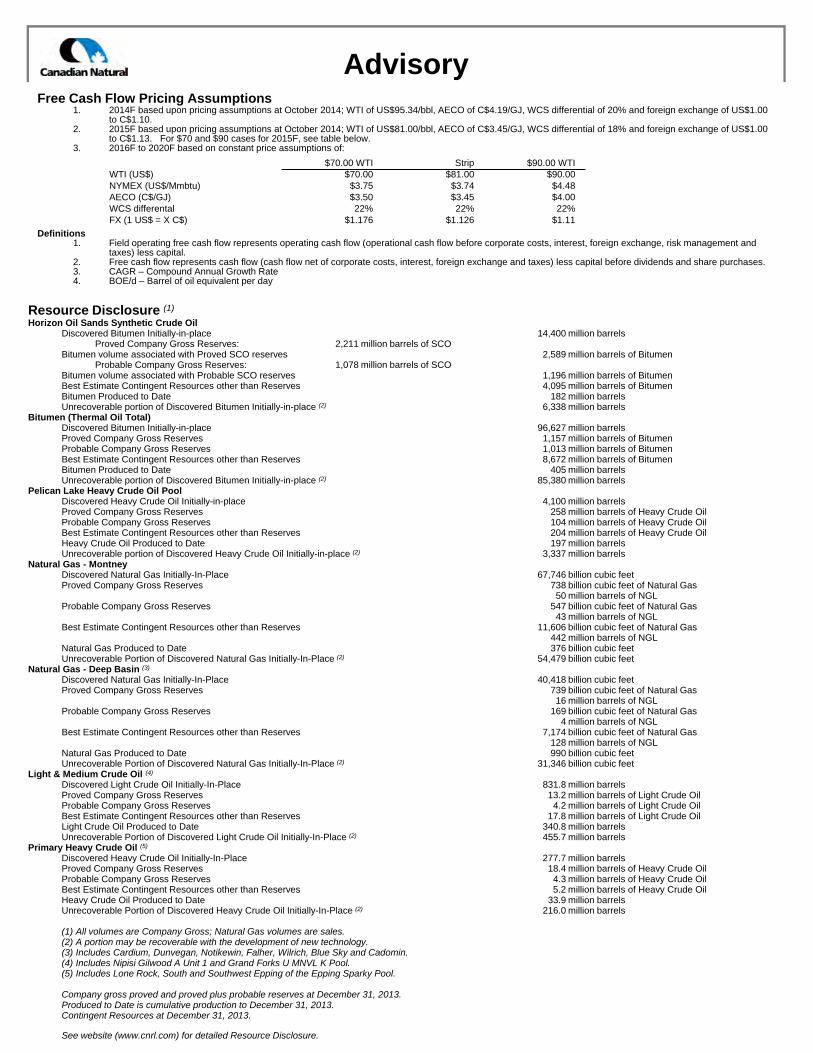
Resource Disclosure (1)
Horizon Oil Sands Synthetic Crude OilDiscovered Bitumen Initially-in-place 14,400 million barrels
Proved Company Gross Reserves: 2,211 million barrels of SCOBitumen volume associated with Proved SCO reserves 2,589 million barrels of Bitumen
Probable Company Gross Reserves: 1,078 million barrels of SCOBitumen volume associated with Probable SCO reserves 1,196 million barrels of BitumenBest Estimate Contingent Resources other than Reserves 4,095 million barrels of BitumenBitumen Produced to Date 182 million barrelsUnrecoverable portion of Discovered Bitumen Initially-in-place (2) 6,338 million barrels
Bitumen (Thermal Oil Total)Discovered Bitumen Initially-in-place 96,627 million barrelsProved Company Gross Reserves 1,157 million barrels of BitumenProbable Company Gross Reserves 1,013 million barrels of BitumenBest Estimate Contingent Resources other than Reserves 8,672 million barrels of BitumenBitumen Produced to Date 405 million barrelsUnrecoverable portion of Discovered Bitumen Initially-in-place (2) 85,380 million barrels
Pelican Lake Heavy Crude Oil PoolDiscovered Heavy Crude Oil Initially-in-place 4,100 million barrelsProved Company Gross Reserves 258 million barrels of Heavy Crude OilProbable Company Gross Reserves 104 million barrels of Heavy Crude OilBest Estimate Contingent Resources other than Reserves 204 million barrels of Heavy Crude OilHeavy Crude Oil Produced to Date 197 million barrelsUnrecoverable portion of Discovered Heavy Crude Oil Initially-in-place (2) 3,337 million barrels
Natural Gas - MontneyDiscovered Natural Gas Initially-In-Place 67,746 billion cubic feetProved Company Gross Reserves 738 billion cubic feet of Natural Gas
50 million barrels of NGLProbable Company Gross Reserves 547 billion cubic feet of Natural Gas
43 million barrels of NGLBest Estimate Contingent Resources other than Reserves 11,606 billion cubic feet of Natural Gas
442 million barrels of NGLNatural Gas Produced to Date 376 billion cubic feetUnrecoverable Portion of Discovered Natural Gas Initially-In-Place (2) 54,479 billion cubic feet
Natural Gas - Deep Basin (3)
Discovered Natural Gas Initially-In-Place 40,418 billion cubic feetProved Company Gross Reserves 739 billion cubic feet of Natural Gas
16 million barrels of NGLProbable Company Gross Reserves 169 billion cubic feet of Natural Gas
4 million barrels of NGLBest Estimate Contingent Resources other than Reserves 7,174 billion cubic feet of Natural Gas
128 million barrels of NGLNatural Gas Produced to Date 990 billion cubic feetUnrecoverable Portion of Discovered Natural Gas Initially-In-Place (2) 31,346 billion cubic feet
Light & Medium Crude Oil (4)
Discovered Light Crude Oil Initially-In-Place 831.8 million barrelsProved Company Gross Reserves 13.2 million barrels of Light Crude OilProbable Company Gross Reserves 4.2 million barrels of Light Crude OilBest Estimate Contingent Resources other than Reserves 17.8 million barrels of Light Crude OilLight Crude Oil Produced to Date 340.8 million barrelsUnrecoverable Portion of Discovered Light Crude Oil Initially-In-Place (2) 455.7 million barrels
Primary Heavy Crude Oil (5)
Discovered Heavy Crude Oil Initially-In-Place 277.7 million barrelsProved Company Gross Reserves 18.4 million barrels of Heavy Crude OilProbable Company Gross Reserves 4.3 million barrels of Heavy Crude OilBest Estimate Contingent Resources other than Reserves 5.2 million barrels of Heavy Crude OilHeavy Crude Oil Produced to Date 33.9 million barrelsUnrecoverable Portion of Discovered Heavy Crude Oil Initially-In-Place (2) 216.0 million barrels
(1) All volumes are Company Gross; Natural Gas volumes are sales.(2) A portion may be recoverable with the development of new technology.(3) Includes Cardium, Dunvegan, Notikewin, Falher, Wilrich, Blue Sky and Cadomin.(4) Includes Nipisi Gilwood A Unit 1 and Grand Forks U MNVL K Pool.(5) Includes Lone Rock, South and Southwest Epping of the Epping Sparky Pool.
Company gross proved and proved plus probable reserves at December 31, 2013.Produced to Date is cumulative production to December 31, 2013.Contingent Resources at December 31, 2013.
See website (www.cnrl.com) for detailed Resource Disclosure.
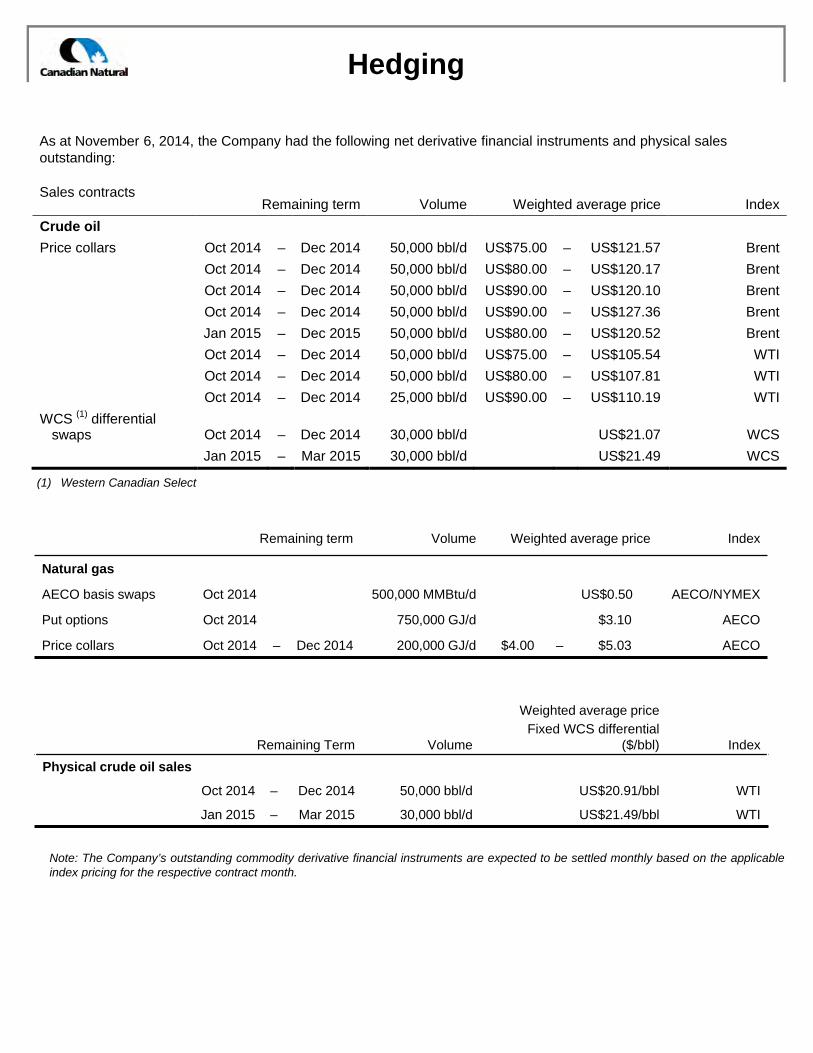
Remaining term Volume Weighted average price Index
Crude oil
Price collars Oct 2014 – Dec 2014 50,000 bbl/d US$75.00 – US$121.57 Brent
Oct 2014 – Dec 2014 50,000 bbl/d US$80.00 – US$120.17 Brent
Oct 2014 – Dec 2014 50,000 bbl/d US$90.00 – US$120.10 Brent
Oct 2014 – Dec 2014 50,000 bbl/d US$90.00 – US$127.36 Brent
Jan 2015 – Dec 2015 50,000 bbl/d US$80.00 – US$120.52 Brent
Oct 2014 – Dec 2014 50,000 bbl/d US$75.00 – US$105.54 WTI
Oct 2014 – Dec 2014 50,000 bbl/d US$80.00 – US$107.81 WTI
Oct 2014 – Dec 2014 25,000 bbl/d US$90.00 – US$110.19 WTI
WCS (1) differential swaps Oct 2014 – Dec 2014 30,000 bbl/d US$21.07 WCS
Jan 2015 – Mar 2015 30,000 bbl/d US$21.49 WCS
Hedging
Note: The Company’s outstanding commodity derivative financial instruments are expected to be settled monthly based on the applicableindex pricing for the respective contract month.
(1) Western Canadian Select
As at November 6, 2014, the Company had the following net derivative financial instruments and physical sales outstanding:
Sales contracts
Remaining term Volume Weighted average price Index
Natural gas
AECO basis swaps Oct 2014 500,000 MMBtu/d US$0.50 AECO/NYMEX
Put options Oct 2014 750,000 GJ/d $3.10 AECO
Price collars Oct 2014 – Dec 2014 200,000 GJ/d $4.00 – $5.03 AECO
Remaining Term Volume
Weighted average priceFixed WCS differential
($/bbl) Index
Physical crude oil sales
Oct 2014 – Dec 2014 50,000 bbl/d US$20.91/bbl WTI
Jan 2015 – Mar 2015 30,000 bbl/d US$21.49/bbl WTI
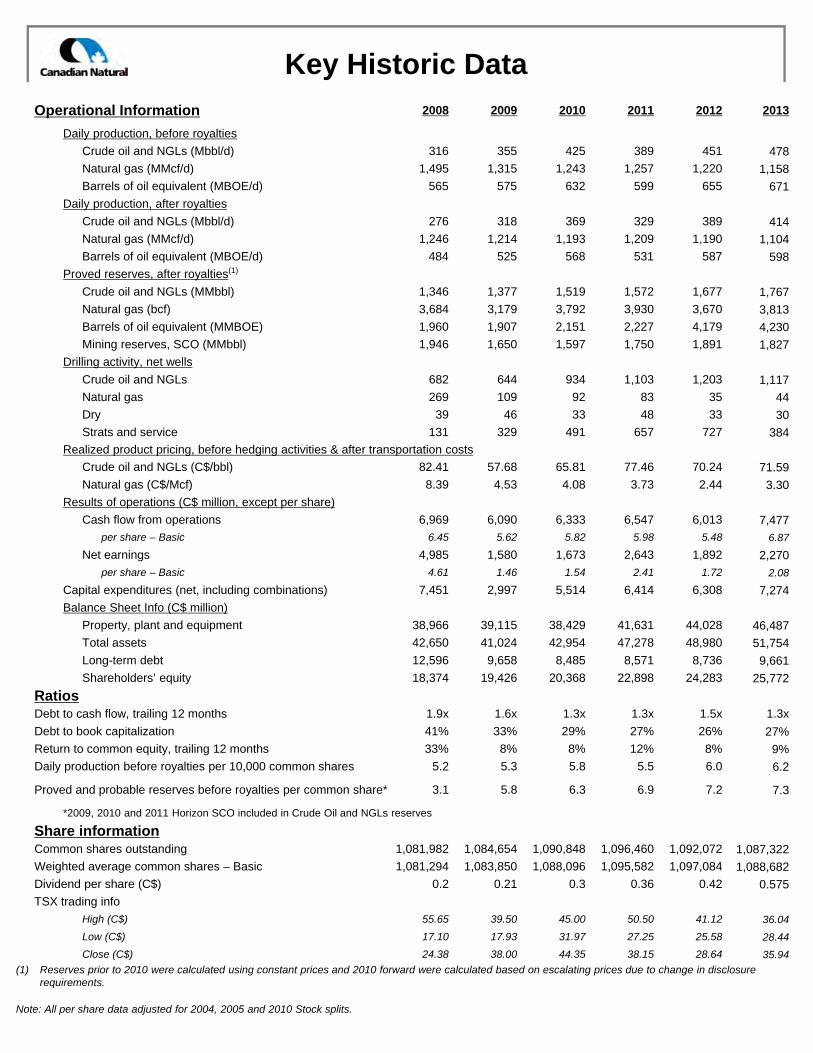
Key Historic Data
Operational Information 2008 2009 2010 2011 2012 2013
Daily production, before royalties
Crude oil and NGLs (Mbbl/d) 316 355 425 389 451 478
Natural gas (MMcf/d) 1,495 1,315 1,243 1,257 1,220 1,158
Barrels of oil equivalent (MBOE/d) 565 575 632 599 655 671
Daily production, after royalties
Crude oil and NGLs (Mbbl/d) 276 318 369 329 389 414
Natural gas (MMcf/d) 1,246 1,214 1,193 1,209 1,190 1,104
Barrels of oil equivalent (MBOE/d) 484 525 568 531 587 598
Proved reserves, after royalties(1)
Crude oil and NGLs (MMbbl) 1,346 1,377 1,519 1,572 1,677 1,767
Natural gas (bcf) 3,684 3,179 3,792 3,930 3,670 3,813
Barrels of oil equivalent (MMBOE) 1,960 1,907 2,151 2,227 4,179 4,230
Mining reserves, SCO (MMbbl) 1,946 1,650 1,597 1,750 1,891 1,827
Drilling activity, net wells
Crude oil and NGLs 682 644 934 1,103 1,203 1,117
Natural gas 269 109 92 83 35 44
Dry 39 46 33 48 33 30
Strats and service 131 329 491 657 727 384
Realized product pricing, before hedging activities & after transportation costs
Crude oil and NGLs (C$/bbl) 82.41 57.68 65.81 77.46 70.24 71.59
Natural gas (C$/Mcf) 8.39 4.53 4.08 3.73 2.44 3.30
Results of operations (C$ million, except per share)
Cash flow from operations 6,969 6,090 6,333 6,547 6,013 7,477per share – Basic 6.45 5.62 5.82 5.98 5.48 6.87
Net earnings 4,985 1,580 1,673 2,643 1,892 2,270
per share – Basic 4.61 1.46 1.54 2.41 1.72 2.08
Capital expenditures (net, including combinations) 7,451 2,997 5,514 6,414 6,308 7,274
Balance Sheet Info (C$ million)
Property, plant and equipment 38,966 39,115 38,429 41,631 44,028 46,487
Total assets 42,650 41,024 42,954 47,278 48,980 51,754
Long-term debt 12,596 9,658 8,485 8,571 8,736 9,661
Shareholders’ equity 18,374 19,426 20,368 22,898 24,283 25,772
RatiosDebt to cash flow, trailing 12 months 1.9x 1.6x 1.3x 1.3x 1.5x 1.3x
Debt to book capitalization 41% 33% 29% 27% 26% 27%
Return to common equity, trailing 12 months 33% 8% 8% 12% 8% 9%
Daily production before royalties per 10,000 common shares 5.2 5.3 5.8 5.5 6.0 6.2
Proved and probable reserves before royalties per common share* 3.1 5.8 6.3 6.9 7.2 7.3
*2009, 2010 and 2011 Horizon SCO included in Crude Oil and NGLs reserves
Share informationCommon shares outstanding 1,081,982 1,084,654 1,090,848 1,096,460 1,092,072 1,087,322
Weighted average common shares – Basic 1,081,294 1,083,850 1,088,096 1,095,582 1,097,084 1,088,682
Dividend per share (C$) 0.2 0.21 0.3 0.36 0.42 0.575
TSX trading info
High (C$) 55.65 39.50 45.00 50.50 41.12 36.04
Low (C$) 17.10 17.93 31.97 27.25 25.58 28.44
Close (C$) 24.38 38.00 44.35 38.15 28.64 35.94
(1) Reserves prior to 2010 were calculated using constant prices and 2010 forward were calculated based on escalating prices due to change in disclosure requirements.
Note: All per share data adjusted for 2004, 2005 and 2010 Stock splits.
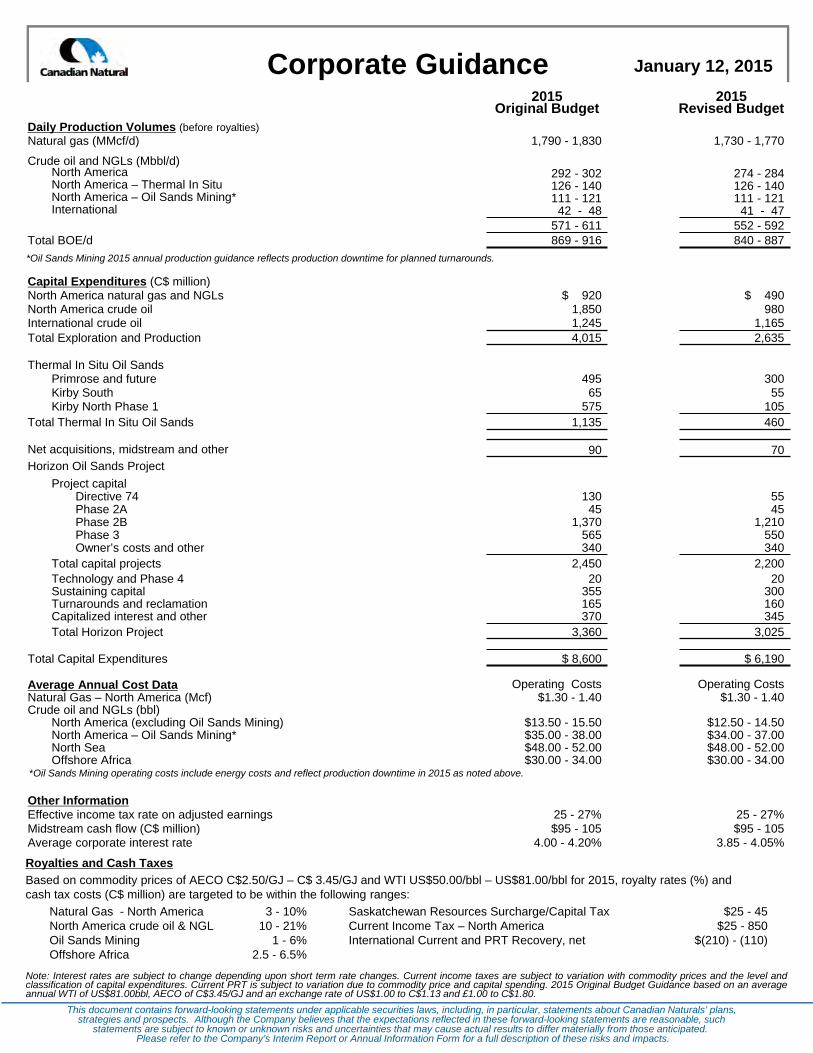
Corporate Guidance January 12, 2015
Note: Interest rates are subject to change depending upon short term rate changes. Current income taxes are subject to variation with commodity prices and the level andclassification of capital expenditures. Current PRT is subject to variation due to commodity price and capital spending. 2015 Original Budget Guidance based on an averageannual WTI of US$81.00bbl, AECO of C$3.45/GJ and an exchange rate of US$1.00 to C$1.13 and £1.00 to C$1.80.
This document contains forward-looking statements under applicable securities laws, including, in particular, statements about Canadian Naturals’ plans, strategies and prospects. Although the Company believes that the expectations reflected in these forward-looking statements are reasonable, such
statements are subject to known or unknown risks and uncertainties that may cause actual results to differ materially from those anticipated. Please refer to the Company’s Interim Report or Annual Information Form for a full description of these risks and impacts.
2015Original Budget
2015Revised Budget
Daily Production Volumes (before royalties)Natural gas (MMcf/d) 1,790 - 1,830 1,730 - 1,770
Crude oil and NGLs (Mbbl/d)North America 292 - 302 274 - 284North America – Thermal In Situ 126 - 140 126 - 140North America – Oil Sands Mining* 111 - 121 111 - 121International 42 - 48 41 - 47
571 - 611 552 - 592Total BOE/d 869 - 916 840 - 887
Capital Expenditures (C$ million)North America natural gas and NGLs $ 920 $ 490North America crude oil 1,850 980International crude oil 1,245 1,165Total Exploration and Production 4,015 2,635
Thermal In Situ Oil SandsPrimrose and future 495 300Kirby South 65 55Kirby North Phase 1 575 105
Total Thermal In Situ Oil Sands 1,135 460
Net acquisitions, midstream and other 90 70Horizon Oil Sands Project
Project capitalDirective 74 130 55Phase 2A 45 45Phase 2B 1,370 1,210Phase 3 565 550Owner’s costs and other 340 340
Total capital projects 2,450 2,200Technology and Phase 4 20 20Sustaining capital 355 300Turnarounds and reclamation 165 160Capitalized interest and other 370 345Total Horizon Project 3,360 3,025
Total Capital Expenditures $ 8,600 $ 6,190
Average Annual Cost Data Operating Costs Operating CostsNatural Gas – North America (Mcf) $1.30 - 1.40 $1.30 - 1.40Crude oil and NGLs (bbl)
North America (excluding Oil Sands Mining) $13.50 - 15.50 $12.50 - 14.50North America – Oil Sands Mining* $35.00 - 38.00 $34.00 - 37.00North Sea $48.00 - 52.00 $48.00 - 52.00Offshore Africa $30.00 - 34.00 $30.00 - 34.00
Other InformationEffective income tax rate on adjusted earnings 25 - 27% 25 - 27%Midstream cash flow (C$ million) $95 - 105 $95 - 105Average corporate interest rate 4.00 - 4.20% 3.85 - 4.05%
*Oil Sands Mining operating costs include energy costs and reflect production downtime in 2015 as noted above.
*Oil Sands Mining 2015 annual production guidance reflects production downtime for planned turnarounds.
Royalties and Cash Taxes
Based on commodity prices of AECO C$2.50/GJ – C$ 3.45/GJ and WTI US$50.00/bbl – US$81.00/bbl for 2015, royalty rates (%) and cash tax costs (C$ million) are targeted to be within the following ranges:
Natural Gas - North America 3 - 10% Saskatchewan Resources Surcharge/Capital Tax $25 - 45North America crude oil & NGL 10 - 21% Current Income Tax – North America $25 - 850Oil Sands Mining 1 - 6% International Current and PRT Recovery, net $(210) - (110)Offshore Africa 2.5 - 6.5%
CANADIAN NATURAL RESOURCES LIMITED
2100, 855 - 2nd Street S.W., Calgary, Alberta,
T2P 4J8
Telephone: (403) 514-7777Facsimile: (403) 514-7888
Email: [email protected]
Steve W. LautPresident
Tim S. McKayChief Operating Officer
Douglas A. Proll Executive Vice President
Corey B. BieberChief Financial Officer and Senior Vice President, Finance
Mark StainthorpeManager,Investor Relations (403) 514-7845
Jason PopkoSupervisor, Investor Relations (403) 386-5408
PROVEN EFFECTIVE STRATEGY
Recommended