Louisiana State UniversityLSU Digital Commons
LSU Master's Theses Graduate School
2006
Feasibility of supercritical carbon dioxide as adrilling fluid for deep underbalanced drillingoperationsAnamika GuptaLouisiana State University and Agricultural and Mechanical College, [email protected]
Follow this and additional works at: https://digitalcommons.lsu.edu/gradschool_theses
Part of the Petroleum Engineering Commons
This Thesis is brought to you for free and open access by the Graduate School at LSU Digital Commons. It has been accepted for inclusion in LSUMaster's Theses by an authorized graduate school editor of LSU Digital Commons. For more information, please contact [email protected].
Recommended CitationGupta, Anamika, "Feasibility of supercritical carbon dioxide as a drilling fluid for deep underbalanced drilling operations" (2006). LSUMaster's Theses. 3860.https://digitalcommons.lsu.edu/gradschool_theses/3860

FEASIBILITY OF SUPERCRITICAL CARBON DIOXIDE AS A DRILLING FLUID FOR DEEP UNDERBALANCED
DRILLING OPERATIONS
A Thesis
Submitted to the Graduate Faculty of the Louisiana State University and
Agricultural and Mechanical College in partial fulfillment of the
requirements for the degree of Master of Science in Petroleum Engineering
in
The Craft and Hawkins Department of Petroleum Engineering
by Anamika Gupta
B.E., Mumbai University Institute of Chemical Technology, 2003 May 2006

ACKNOWLEDGEMENTS
I would like to express my gratitude to my advisor, Dr.Anuj Gupta, for his constant
guidance and support. He has always been extremely supportive and shared the
enthusiasm of working on an interesting project like this. My special thanks to my
examining committee members, Professor Julius Langlinais and Professor John Smith for
their suggestions and co-operation. Their experience and wisdom helped this project
immensely. I am grateful to the Craft and Hawkins Department for giving me the
opportunity to learn. I would like to thank my parents and family for their encouragement
and blessings. I would like to extend a special acknowledgement for Samarth who has
always been there to bring out the best in me. I am extremely grateful to Dr.
P.V.Suryanarayana, Dr. Ravi Vaidya and my colleagues at Blade Energy Partners for
their support in the completion of my thesis and the opportunity to learn at Blade. All my
friends at LSU and elsewhere have been extremely generous and I would like to thank
them all.
ii

TABLE OF CONTENTS
ACKNOWLEDGEMENTS……………………………………………………………..ii LIST OF TABLES……………………………………………………………………….v LIST OF FIGURES…………………………………………………………………….vi ABSTRACT…………………………………………………………………………....viii CHAPTER 1. INTRODUCTION….…………………………………………………...1
1.1 Example Case Study………………………………………………………..….....1 1.2 Properties of Supercritical Carbon Dioxide……………………………….……...2 1.3 Proposed Solution……………………………………………………...…………4
CHAPTER 2. LITERATURE SURVEY………………………………………………6 2.1 Sources of CO2 …………………………………………………………………..6 2.2 Underbalanced Drilling (UBD)…………………..………………………………7 2.3 Coiled Tubing Underbalanced Drilling (CTUBD)………………………………10 2.4 Previous Work on Drilling with SCCO2 by Kolle[13]…...………….……...…...11 CHAPTER 3. MODEL DEVELOPMENT…………………………………………...13 3.1 PVT Model……………………………………………………….……………...13 3.2 Heat Transfer Model………………………………………………...…………...17 3.3 Circulation Model……………………...………………………………………...17 3.4 Assumptions of the Model……...………………………………………………..19 3.5 Methodology…………………………………………………………….……….19 CHAPTER 4. CASE STUDY APPLICATION………………………………………21 4.1 Operations Summary……………………………………………………..……....21 4.2 Input Data [1]...……………………………………………………………….…..21 4.3 Simulation Results and Discussions……………………...……………….……...23 CHAPTER 5. WELLFLO 7 MODELING AND RESULTS………………………...29 5.1 About WellFlo 7…………………….…………………………………..………..29 5.2 Comparison of Results from Proposed Model and WellFlo 7……………....……30 CHAPTER 6. CORROSION PROBLEMS WITH CO2 AND ITS CUTTINGS CARRYING CAPACITY……………………………………………..38 6.1 Corrosion Potential of CO2……………………………………………………….38 6.2 Low Viscosity of CO2: Potential for Using Thickening Agents………………….42 CHAPTER 7. QUALITATIVE ANALYSIS OF DRILLING WITH SUPERCRITICAL CO2……………………………………………………………………….45 7.1 Potential Advantages………………………………………………………….….45 7.2 Possible Problems…………………………………………………………….…..45
iii

7.3 Economic Considerations………………………………………………………...47 CHAPTER 8. CONCLUSIONS AND RECOMMENDATIONS…………………..49 8.1 Conclusions………………………………………………………………………49 8.2 Recommendations………………………………………………………………..50 REFERENCES…………..……………………………………………………….……51 APPENDIX A: PROPERTIES OF CARBON DIOXIDE…………………………..54 APPENDIX B: SPREADSHEET AND VB CODE EXAMPLE…….……………...56 APPENDIX C: HEAT TRANSFER MODEL BASED ON THE WORK OF HOLMES AND SWIFT [18]………………………………………..60
VITA……………………………………………………………………………………63
iv

LIST OF TABLES
1. Chung et al. Coefficients to Calculate Ei =ai+biω [14]………………………...17 2. Input Parameters for the Model for BHP = 400 psi…..………………….…….23
3. Spreadsheet Output for Calculations on the Annulus Side…………………….59
v

LIST OF FIGURES
1. Phase Diagram of Carbon Dioxide[2]……………………………………………..3
2. Phase Change of Carbon Dioxide to Supercritical State[3]……………………….3
3. Hydrate Formation Regions of Gases[4]…...……………………………………..4
4. Example of a Finite Element Considered in the Model………………..………...20
5. Flowchart of the Proposed Model………………………………………………..20
6. Wellbore Schematic for Example Case Study…………………………………...22
7. Variation of Density of CO2 with Pressure at Different Temperature Values…...24
8. Variation of Viscosity of CO2 with Temperature at Different Pressure Values…25
9. Variation of CO2 Density with Depth…………………………………………... 26
10. Variation of Circulating Pressure with Depth…………………………………...26
11. Variation of Bottom-hole Pressure with Choke Pressure……………………….27
12. CTR Variations with Depth and Cuttings Size……….…………………………28
13. Circulating Pressure Profile of Foam of Nitrogen and Water................................31
14. Cuttings Transport Ratios for 0.1” and 0.2” Cuttings for Foam………………... 32
15. Comparison of Circulating Pressure Profile from Model and WellFlo 7……......33
16. Comparison of Frictional Pressure Drop with Choke Pressure from Model and WellFlo 7 …………………………………………………………...……… 34
17. Comparison of Frictional Pressure Drop with Gas Flow Rate from Model and WellFlo 7 ……………………………………………………………………34 18. Comparison of Density Predictions from Model and WellFlo 7………………...35
19. CO2 Density Variations in the Tubing and the Annulus…….…………………...36
20. CTR Variations with Depth for Different Sized Cuttings Using WellFlo 7……..37
21. de Waard and Milliams Nomogram[16]……………….………………………...39
vi

22. Corrosion Rates Along the Annulus Length for Different Choke Pressures……41
23. SEM Images of Foam Produced from CO2-gels………..……………………....44
C1. Temperature Profile of CO2 in the Tubing and Annulus………...……………. 62
vii

ABSTRACT
Feasibility of drilling with supercritical carbon dioxide to serve the needs of deep
underbalanced drilling operations has been analyzed. A case study involving
underbalanced drilling to access a depleted gas reservoir is used to illustrate the need for
such a research. For this well, nitrogen was initially considered as the drilling fluid. Dry
nitrogen, due to its low density, was unable to generate sufficient torque in the downhole
motor. The mixture of nitrogen and water, stabilized as foam generated sufficient torque
but made it difficult to maintain underbalanced conditions. This diminished the intended
benefit of using nitrogen as the drilling fluid.
CO2 is expected to be supercritical at downhole pressure and temperature conditions,
with density similar to that of a liquid and viscosity comparable to a gas. A
computational model was developed to calculate the variation of density and viscosity in
the tubing and the annulus with pressure, temperature and depth. A circulation model was
developed to calculate the frictional pressure losses in the tubing and the annulus, and
important parameters such as the jet impact force and the cuttings transport ratio. An
attempt was made to model the temperatures in the well using an analytical model.
Corrosion aspects of a CO2 based drilling system are critical and were addressed in this
study.
The results show that the unique properties of CO2, which is supercritical in the tubing
and changes to vapor phase in the annulus, are advantageous in its role as a drilling fluid.
It has the necessary density in the tubing to turn the downhole motor and the necessary
density and viscosity to maintain underbalanced conditions in the annulus. The role of a
surface choke is crucial in controlling the annular pressures for this system. A carefully
viii

designed corrosion control program is essential for such a system. Results of this study
may also be important for understanding the flow behavior of CO2 in CO2 sequestration
and CO2 based enhanced oil recovery operations.
ix

CHAPTER 1
INTRODUCTION
Supercritical carbon dioxide (SCCO2) has attracted the attention of researchers because
of its unique properties attainable for some drilling applications. The present work
addresses the potential advantages and feasibility of using SCCO2 as a drilling fluid in
underbalanced drilling of depleted/ sub-normal pressure formations. A potential
application where the use of supercritical CO2 as a drilling fluid may be of great value is
highlighted by the following case study.
1.1. Example Case Study
This refers to a depleted gas well in the Darbun field in Mississippi, where depletion of
the reservoir over time had led to an extremely low pressure of 700 psi at a depth of
14,340 feet. It is believed that the casing had collapsed due to such an extreme pressure
imbalance [1]. In order to regain production from this depleted gas reservoir, the
operator decided to drill a sidetracked well branch, from the existing completed well.
After the sidetrack operation, conventional drilling through the depleted sixty feet thick
reservoir section was unacceptable. It would have caused lost circulation problems and
differential sticking due to excessive overbalance resulting from the large hydrostatic
pressure exerted by a tall column of mud. This could also cause severe reduction in
productivity due to potential water-blockage and formation damage.
To overcome these problems, it was decided to drill the depleted zone with nitrogen as a
drilling fluid, in order to maintain wellbore pressure below the reservoir pressure while
drilling. Coiled tubing drilling (CTD) was the selected method as it provided pressure
1

control while tripping and allowed continuous operation without the time consuming
tripping operation for making connections as is done for conventional drillpipe.
Unforeseen operational problems developed while drilling the target reservoir section
with pure nitrogen. Low density of nitrogen did not allow generation of sufficient torque
to turn the downhole motor and the drill-bit. To overcome this problem, it was decided to
drill with foam of nitrogen and water to address the motor torque problem. Though the
motor was efficiently powered by the foam, the increased frictional losses and hydrostatic
pressure exerted, due to the addition of water, made it difficult to maintain the desired
underbalanced conditions in the annulus.
CO2 is known to have unique properties in the supercritical phase and this case study
offered an opportunity to investigate its utility as a drilling fluid.
1.2. Properties of Supercritical Carbon Dioxide
A substance above its critical temperature and critical pressure is considered to be a
supercritical fluid. The critical point represents the highest temperature and pressure at
which the vapor and liquid phase of a substance can co-exist in equilibrium. Above the
critical point, the distinction between gas and liquid does not apply and the substance can
only be described as a fluid. The physical properties of supercritical CO2, such as,
density, viscosity and diffusivity coefficient can be varied between limits of gas and near-
liquid properties by controlling temperature and pressure. Since their physical properties
can be adjusted to suit the desired application, they prove to be very useful. The
properties of CO2 are listed in Appendix A.
The phase diagram of carbon dioxide is shown in Figure 1 [2]. CO2 is a supercritical
fluid above 88 deg. F and 1074 psi.
2

Figure 1. Phase Diagram of Carbon Dioxide [2]
Figure 2 illustrates the phase change of CO2 from distinct gas and liquid phases to a
homogeneous supercritical phase [3]. At supercritical conditions, CO2 has a density
similar to a liquid and viscosity and diffusivity comparable to a gas.
SupercriticalGas
Figure 2. Phase Change of Carbon Dioxide to Supercritical State [3]
3

CO2 is known to form hydrates and for safe operation of a system using CO2, the
operating pressures and temperatures must be selected to eliminate the possibility of
hydrate formation. Hydrates are formed when gas molecules are trapped inside an ice like
structure, typically at low temperature and high pressure conditions. Figure 3 illustrates
the hydrate formation conditions for CO2 which occur at temperature below 10 oC (50 oF)
and pressure above 5 MPa (650 psi) [4].
Figure 3. Hydrate Formation Regions of Gases [4]
1.3. Proposed Solution
The properties that CO2 develops in the supercritical phase and the ability to tune the
temperatures and pressures to bring the necessary phase changes, is the reason that it is
being investigated as a potential solution to the problem described in the example case
study. The aim is to inject CO2 such that the dense phases that occur in the tubing run
the downhole motor and later force a phase change across the nozzle in order to have the
4

lighter phase in the annulus to maintain the desired underbalance. Feasibility of such a
system will be studied by developing a model that computes the change in properties with
temperature and pressure, in addition to pressure losses as CO2 is circulated through the
coiled tubing system.
5

CHAPTER 2
LITERATURE SURVEY
The decision to investigate the use of supercritical CO2 as a drilling fluid for the example
case study was made after a thorough literature search. The availability of CO2 from
sources other than CO2 natural reservoirs was looked into as many industrial processes
produce CO2 and could be potential sources. The benefits and drawbacks of under-
balanced drilling with a coiled tubing drilling system were examined. The experimental
work by Kolle [13] on jet-assisted drilling with supercritical CO2 proved the potential of
CO2 as a jetting fluid for drilling applications and has been discussed in this chapter.
2.1. Sources of CO2
The sources of CO2 include natural CO2 reservoirs, industrial sources and produced gas
streams. Nearly all CO2 enhanced oil recovery (EOR) projects in USA use CO2 produced
from reservoirs containing nearly pure CO2 [5]. The price of CO2 varies depending on the
proximity of the CO2 production wells [6]. Industrial sources such as natural gas
processing, hydrogen production facilities and power plants, offer alternatives to
naturally occurring CO2, although more expensive ones. In addition to the cost of CO2,
there are other costs associated with its transport, compression and storage.
Drilling using SCCO2 is a technology that is yet to be applied on a large scale in any
field. However the major application of CO2 in the petroleum industry has been in the
EOR projects. The number of CO2 EOR projects has remained steady or increased
slightly with CO2 production volumes increasing significantly [7]. The industry is now
focusing on capturing CO2 from industrial sources to reduce the dependence on natural
occurring reservoirs and also to reduce CO2 emissions in the atmosphere.
6

2.2. Underbalanced Drilling (UBD)
UBD is performed with drilling fluids that enable the borehole pressure to remain less
than the formation pressure. The bottomhole circulating pressure is intentionally set to be
less than the reservoir pressure. Due to this, the formation fluids enter the wellbore while
drilling. In the case of UBD, the parameters for selecting the appropriate drilling fluid are
different from the overbalanced drilling operation. For instance, for the case study being
investigated, the drilling fluid must offer suitable hydraulic energy to run the downhole
drilling motor. At the same time it should be able to carry the cuttings to the surface to
get a good rate of penetration (ROP). Very importantly, it must be non-damaging.
The low density drilling fluids utilized to generate the underbalanced condition for a
low-pressure reservoir include air, dry gases, mist, foam, and gasified liquids. In the
example case study, the initial plan was to drill only with nitrogen, as the reservoir
pressure was very low. The plan was then changed to drill with foam of water and
nitrogen since pure nitrogen could not impart sufficient hydraulic energy to run the
motor. Foams are a popular choice in UBD applications, primarily due to their excellent
cuttings carrying capacity in comparison to gases. Beyer et al. [8] discuss, in detail, the
flow behavior of foam as a well circulating fluid.
There are several papers [9, 10] where advantages of UBD have been discussed.
Bennion et al. [9] present the praises and perils associated with UBD. The advantages of
UBD presented by the authors include the following:
1. Reduction in invasive formation damage
Invasive damage is an important consideration for many formations, particularly
in conventional drilling operations. It causes considerable reduction in the
7

productivity of a well. It may be caused by the physical migration of fines and
clays due to fluid leakoff. Adverse reaction between invaded filtrate and
formation or in-situ fluids (emulsions, precipitates and scales) also causes
damage.
2. Increased rate of penetration (ROP)
Due to decreased pressure at the bit head, UBD operations demonstrate superior
penetration rates in comparison to conventional drilling techniques.
3. Rapid indication of productive reservoir zones
As drilling is accompanied by production, proper flow monitoring of the produced
fluids at surface can provide a good indication of productive zones of the
reservoir.
4. Ability to flow /test well while drilling
The ability to conduct single or multirate drawdown tests while drilling proves
beneficial to the operator, as the tests indicate the productive capacity of the
formation and formation properties.
In addition to these, there are advantages associated with reduction of differential
sticking and lost circulation problems.
Suryanarayana et al. [10] classify the benefits of UBD into two classes:
• Cost Avoidance
This includes mitigation of conventional drilling problems such as differential
sticking and lost circulation. One also avoids costs associated with stimulation.
• Value Creation
This includes productivity improvement, increase in ultimate recovery and real-
8

time reservoir characterization while drilling. This is primarily due to the fact
that UBD reduces or eliminates formation damage.
UBD is not a panacea for all drilling related problems. The right candidate selection
is a must for it to be successful. Bennion et al. [9] also discuss the disadvantages
associated with UBD which include:
a. Expense
UBD is usually more expensive than an overbalanced drilling operation,
particularly in sour and offshore environments. However, these costs may be
offset by improved productivity and increased ROP.
b. Safety concerns
As the well may be flowing while drilling there are some safety concerns. There
are corrosion and flammability issues, especially when drilling with air or
processed flue gas. Recent developments in surface equipment and CTD have
helped to increase the reliability of UBD operations.
c. Wellbore stability concerns
This is particularly a concern for poorly consolidated and highly depleted
formations. A reservoir by reservoir evaluation is required to quantify stability
concerns for each UBD application.
d. Failure to maintain a continuously underbalanced condition during
drilling and completion and resulting formation damage
Because there is no filter cake formed in UBD, the protective ability and presence
of this filter cake as a barrier to fluid and solids invasion is not present if well
experiences occasional overbalance.
9

e. Overbalanced/conventional completion kill jobs
This negates the benefit of using UBD. To obtain maximum benefit to well
productivity, underbalanced completion procedures must be used.
f. Spontaneous imbibition and counter-current imbibition effects
Adverse capillary effects can result in imbibition of fluids in near-wellbore region
which could reduce the permeability or flow capacity due to the incompatibility of
formation (or connate fluid) with the imbibed fluid. Thus a very good
understanding of formation wettability coupled with base fluid selection for UBD
is important.
g. Difficulty in zones of extreme permeability
Extremely high permeability formation can result in risks associated with
handling huge volumes of produced fluids and high pressures on the surface
equipment. Improvement in surface handling equipment is needed.
To summarize, there are risks associated with UBD. Screening tests using criteria for the
right candidate selection must be conducted along with careful reservoir characterization.
If rigorous well engineering procedures are followed, significant economic and technical
benefits can be achieved.
2.3. Coiled Tubing Underbalanced Drilling (CTUBD)
Coiled tubing (CT) refers to a continuous reel of pipe wound on a spool at the surface.
Depending on the diameter of the pipe and the spool size, the length of the CT varies.
Scherchel et al. [11] discuss the CT technology being applied to underbalanced drilling
operations. According to the authors, CT systems are quite relevant for drilling
underbalanced. The primary advantage is the ability to control pressure while tripping.
10

This allows minimal pipe handling and faster trip times. The continuous nature (no
connections) of the coiled tubing string facilitates maintenance of a constant bottomhole
pressure with no forced surging of the reservoir. The rig footprint is small and set-up is
quicker. As the CT is not rotated, mechanical damage (pasting of cuttings over borehole
wall) is avoided. Scherchel et al. discuss, in details, the equipment for the CTUBD
operation. The bottomhole assembly (BHA) can be electrically connected to the surface
with wireline, which allows transmission of steering tool data to the surface. Electrical
functionality of the BHA includes MWD capabilities, acquisition of pressure,
temperature, BHA vibration data, all measured in real time. The drill motor is attached
directly beneath the orienter and is the only part of the BHA which rotates while drilling.
If the reservoir has been determined to be a UBD candidate, then coiled tubing’s
mechanical and hydraulic limitations to the drillable lengths should be evaluated. In
addition, there are fatigue limitations associated with CT due to bending and
straightening of the CT at the surface. UBD generally involves circulating two phase
fluid system and the volumetric flow rate through the motor is variable, dependent on the
bottomhole circulating pressure. Thatcher et al. [12] present the planning and execution
of the integrated service of CT and UBD through a case history.
2.4. Previous Work on Drilling with SCCO2 by Kolle [13]
Kolle [13] has reported pioneering work in the field of jet-assisted CTD with SCCO2.
The goal of ultra-high pressure (UHP), jet-assisted drilling is to increase the rate of
penetration (ROP) in deeper oil and gas wells, where the rocks become harder and more
difficult to drill using conventional drill bits. The ultrahigh pressure, high velocity jet cuts
a small kerf in the bottom of the borehole that enhances the mechanical drilling action of
11

the conventional bit. Jet erosion is an order of magnitude less efficient than mechanical
drilling. Despite this inefficiency, jet drilling is attractive for small diameter holes
because the jet hydraulic power is much higher than the mechanical power available from
small diameter motors. CT is an attractive option for jet-assisted drilling as it allows for
continuous circulation of low-solids drilling fluids. However, the bending fatigue is
compounded by internal pressure and tubing tension.
Experiments reported by Kolle [13] using water and SCCO2 indicate that SCCO2 can
cut hard shale, marble and granite at much lower pressure than water. This demonstrates
that SCCO2 can provide better jet-erosion and mechanical drilling rates than water based-
fluids. Small-scale pressure drilling tests were reported for shale with SCCO2 using a
microbit with a drag cutter [13].The rate of penetration in Mancos shale with CO2 was
3.3 times that with water.
The drilling system described by Kolle [13] involves injecting liquid CO2 in the CT
using a high-pressure plunger pump. It becomes supercritical as it enters the tubing and
powers the downhole motor. After exiting the nozzle, a phase change occurs in the
annulus from supercritical to the gas phase. The drill motor used is a high-pressure vane
motor that can be run by dry gas including high-pressure SCCO2. The surface choke
provides the necessary control of the bottomhole pressure.
The model for the proposed system is based on calculating the pressure losses in tubing,
borehole pressure and pressures in the annulus assuming turbulent Newtonian flow. The
density and viscosity data is modeled using Peng Robinson equation of state. From the
production enhancement perspective, SCCO2 is a non-damaging fluid that is known to
stimulate production with immediate payback to the operator [13].
12

CHAPTER 3
MODEL DEVELOPMENT
Designing a successful system that utilizes supercritical CO2 as a drilling fluid requires
accurate modeling and prediction of the phase behavior of CO2 as it traverses down the
tubing, expands across the bit-nozzles and returns up the annulus. The required model is
developed as a Visual-Basic-Excel® program that allows the user to perform sensitivity
analysis using a spreadsheet. The algorithm is coded in macros written in Visual Basic
and can be run using Microsoft Excel®. The iterations for convergence are done using
the Solver add-in application in Excel®. The model consists of three key components:
PVT Model
Heat Transfer Model
Circulation Model
3.1. PVT Model
An understanding of the phase behavior of CO2 is essential for its use as a drilling fluid.
Properties of importance such as density, viscosity and compressibility of CO2 are no
longer constant and their variation with depth is calculated using the PVT model.
The Peng Robinson equation of state [14] is used to calculate the density for each
pressure and temperature combination. Carroll and Boyle [15] compared several methods
(Soave-Kwong-Redlich (SRK), Peng Robinson (PR) and Patel-Teja (PT)) for calculating
gas densities for acid gas injection applications. Their work spanned temperature from
32 oF to 302 oF and pressures from atmospheric to 4351 psi. They concluded that PR is
more accurate in predicting densities of pure components.
The Peng Robinson Equation of state is represented by equation 2,
13

(2)
where,
P = Pressure, Pa,
T = Temperature, K,
V = Volume, m3/mol,
R = Universal gas constant,
a (T), a gas constant, is a function of temperature, described by equation 3,
(3)
where,
Pc = Critical Pressure, Pa,
Tc = Critical Temperature, K,
Vc =Critical Volume, cm3/mol,
and α (T) is a function of temperature, described by equation 4,
)/1(1 cTTm −+=α (4)
b is a constant for the selected fluid as described by equation 5,
14

(5)
m is a function of the acentric factor, ω, which is equal to 0.2249 for CO2 [14].
226992.54226.137464. ωω −+=m (6)
The equation of state can also be expressed in terms of the compressibility factor, z:
0)()23()1( 32223 =−−−−−+−− BBABBBAzBz (7)
Where,
RTPVz /= (8)
2)/(RTaPA = (9)
RTbPB /= (10)
Here constants A & B are dependent on the values of the constants a & b. Cubic Equation
7 is solved to get one real root that gives the molar volume from which the density is
obtained.
The Chung et al. method [16] is one of the widely used methods to find the viscosity of
dense gases. This method includes density along with temperature and pressure, as the
input for calculating the viscosity. Chung et al. suggested the following expression for
describing the fact that the fluid has a high density for high pressure,
3/21 *)344.36(*
c
c
VMTµ
µ = (11)
Where,
µ= viscosity, µP, M = molecular weight, g/mol,
15

Tc = Critical Temperature, K,
Vc =Critical Volume, cm3/mol,
and
( ) [ ] ∗∗−∗
++Ω
= µµ yEGFTc
v6
12
5.0
1 )( (12)
T* = 1.2593Tr and Ωv and Fc are defined by equations 13 and 14 respectively.
)exp()exp()( 11111 ∗∗−∗ −+−+=Ω TFETDCTA B
v (13)
where A1=1.16145, B1= 0.14874, C1=0.52487, D1=0.77320, E= 2.16178 and F1=2.43787
Fc= 1-0.2756ω (14)
ω is the acentric factor which is equal to 0.2249 for CO2 [14].
With molar density, ρ in mol/cc,
6/cVy ρ= (15)
( )31 15.01
yyG
−−
= (16)
[ ] 3241
13512412
)exp(/exp(1EEEE
GEyEGEyyEEG
++++−−
= (17)
[ ]210
1982
27 )()(exp −∗−∗∗∗ ++= TETEEGyEµ (18)
and the parameters E1 to E10 are shown in Table 1.
16

Table 1. Chung et al. Coefficients to Calculate Ei =ai+biω [14]
i ai bi1 3.324 50.412 2 1.210E-3 -1.154E-3 3 5.283 254.209 4 6.623 38.096 5 19.745 7.630 6 -1.900 -12.537 7 24.275 3.450 8 0.7972 1.117 9 -0.2382 0.06770 10 0.06863 0.3479
3.2. Heat Transfer Model
Lyons et al. [17] illustrated through plots of temperature in compressible air drilling
operations that temperature of the compressed air at any position in the borehole and
inside the tubing is approximately the geothermal temperature at that depth. This is
because air/gas has poor heat storage capacities relative to drilling mud and turbulent
flow conditions in the annulus is very efficient in transferring heat from surface of
borehole to the flowing air/gas in the annulus. Therefore, temperature of CO2 in the
annulus and the tubing can be assumed to be the geothermal temperature as a first
approximation. For the case studies that will be discussed subsequently, the temperature
profile in the annulus and the tubing has been calculated based on this approximation.
An attempt was made for calculating the temperatures of CO2 in the tubing and the
annulus based on the analytical model proposed by Holmes and Swift [18]. This has been
discussed in detail in Appendix C.
3.3. Circulation Model
The density and viscosity values obtained from the PVT model are needed as inputs for
the circulation model that calculates the hydrostatic pressure and frictional pressure
17

losses in the tubing and the annulus at each depth and provides the value of the
bottomhole pressure. The frictional losses are calculated based on the equations for
turbulent Newtonian fluid (Bourgoyne et al [19]).
The model also calculates important drilling parameters such as the cuttings transport
ratio (CTR) and the jet impact force. CTR is defined as [19]:
)/(1 annslip VVCTR −= , (19)
where,
slipV = slip velocity of cutting, ft/sec
annV = fluid velocity in the annulus, ft/sec
A positive CTR indicates that the cuttings are transported to the surface. It is an excellent
measure of the cuttings carrying capacity of a drilling fluid. In general, it is desirable to
have CTR > 0.7 in the vertical section, and > 0.9 in the horizontal section, for optimum
hole cleaning [20]. For low values of cuttings transport ratio, the concentration of
cuttings remaining in the borehole increases. This in turn leads to a high circulation
bottomhole pressure and a low penetration rate [19].
Another important drilling performance parameter is the impact force of the fluid jets
once they exit the nozzle. The cleaning action can be maximized by maximizing the total
hydraulic impact force of the jetted fluid against the bottom of the hole [19]. The jet
impact force Fj is given by the following equation [19]:
bdj pqCF ∆= ρ01823.0 (20)
where,
Cd = discharge coefficient
q = flow rate, gpm
18

ρ = density of fluid, lb/gal
∆pb = pressure drop across the nozzle, psi
3.4. Assumptions of the Model
The following simplifying assumptions are needed in order to solve various model
equations while preserving the essential physics of the flow process.
1. Temperature of CO2 in the annulus and the tubing follows the geothermal
temperature.
2. The pressure losses are calculated by considering CO2 as a Newtonian fluid in
turbulent flow.
3. The total pressure loss across the mud-motor/turbo-drill, the MWD array and the
nozzles is assumed.
4. No inflow of formation water.
3.5. Methodology
The model developed in this study is used to simulate potential scenarios during drilling
with supercritical CO2 as a drilling fluid. The possibility of maintaining the bottomhole
pressure (BHP) lower than the reservoir pressure by controlling the choke is simulated.
The model simulations start on the annulus side, at the choke, where the user specifies the
choke pressure and the surface temperature. The well is segmented into smaller
elements, each of length, ∆L. The pressure at each location along the annulus is
determined by first calculating pressure losses and then integrating the hydrostatic
pressure due to the overlying fluid. The calculations are sequentially performed for each
element from the surface down to the bottom of the well. The bottomhole pressure, along
with the knowledge of pressure drop across the bit nozzles, allows the calculation of
19
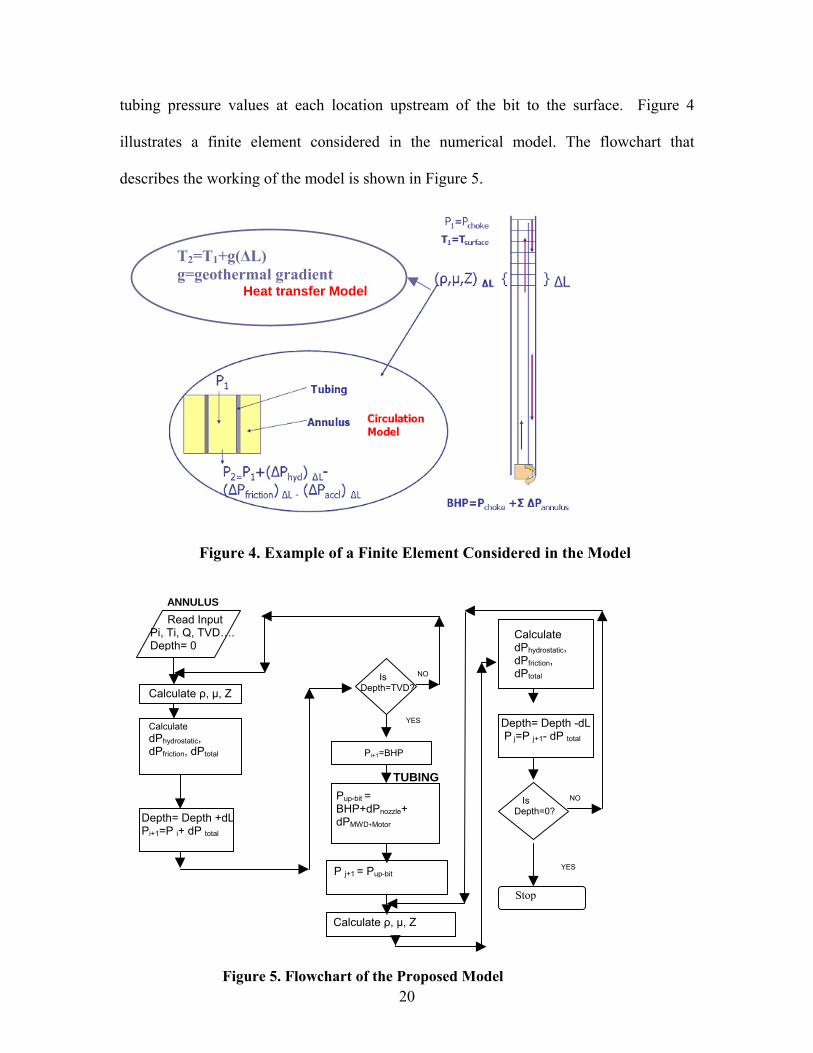
tubing pressure values at each location upstream of the bit to the surface. Figure 4
illustrates a finite element considered in the numerical model. The flowchart that
describes the working of the model is shown in Figure 5.
T2=T1+g(∆L) g=geothermal gradient Heat transfer Model
Figure 4. Example of a Finite Element Considered in the Model
ANNULUS
20
Pi, Ti, Q, TVD…. Read Input
Depth= 0
Calculate ρ, µ, Z
Calculate dPhydrostatic, dPfriction, dPtotal
Depth= Depth +dL Pi+1=P i+ dP total
Is Depth=TVD?
NO
Pi+1=BHP
TUBINGPup-bit = BHP+dPnozzle+ dPMWD+Motor
Depth= Depth -dL P j=P j+1- dP total
Stop
Figure 5. Flowchart of the Proposed Model
P j+1 = Pup-bit
Calculate ρ, µ, Z
Calculate dPhydrostatic, dPfriction, dPtotal
Is Depth=0?
YES
NO
YES

CHAPTER 4
CASE STUDY APPLICATION
4.1. Operations Summary
The problems described in Section 1.1. that occurred during the drilling operation in the
example depleted gas well may be overcome by using CO2 and nozzle sizes such that the
pressure drop across the bit is large enough to force a phase change. The proposed
system is designed such that liquid CO2 from bulk supply is pumped through the coiled
tubing using a high-pressure pump to a pressure level above its critical pressure (1074
psia). As it enters the tubing, CO2 heats up and becomes supercritical. On its circulation
downhole the supercritical phase powers the downhole motor that turns the bit. As the
supercritical CO2 exits the nozzles attached to the drill-bit, the large pressure drop across
the nozzle is expected to flash it to a gas phase in the annulus, resulting in a low
bottomhole pressure and low annular pressure gradient. CO2 in the gas phase is expected
to carry the cuttings to the surface where the solids are separated at the separator
following the choke manifold. Ideally, there is a need to incorporate a CO2 compression
unit following the returns handling system, in order to prevent the venting of CO2 into
atmosphere and to reduce the amount of CO2 needed for the drilling operations.
4.2. Input Data [1]
• Well Data
The vertical section of the well consisted of a 7.625” production casing. The sidetrack
started at 11,286’ and terminated at 14,304’, 0.5 deg from the vertical. A 4.5” casing was
placed through the sidetracked length and cemented just above the target zone. The
21

depth to be drilled was from 14,304 to 14,364’ using a 3.875” drill-bit. The wellbore
schematic is illustrated in Figure 6.
External casing (7.625 “OD, 6.38” ID)
Production casing (4.5”OD, 4”ID)
Coiled Tubing (1.75” OD, 1.5” ID)
Bit (3.875”)
Figure 6. Wellbore Schematic for Example Case Study
22

• Coiled Tubing and Bottomhole Assembly
The coiled tubing used for the project had a 1.75” OD, 0.135” wall thickness and 80,000
psi minimum yield strength. The BHA had a diameter of 2.875” and consisted of a
specially designed high pressure downhole motor.
• Drilling Fluid
The drilling fluid considered for the simulation study is carbon dioxide which will be
stored and injected as a liquid.
The main input parameters to get a bottomhole pressure of 400 psi so as to achieve an
underbalance of 300 psi are indicated in Table 2. The choke pressure and /or flow rate of
gas is varied to achieve the target bottomhole pressure.
Table 2. Main Input Parameters for the Model for BHP = 400 psi
Choke Pressure, psia 100 Surface Temperature, deg.F 60
Flow rate of gas, scfm (Equivalent flow rate of liquid
CO2,lbm/min)
1500 (174)
Geothermal gradient, deg.F/ft 0.016
4.3. Simulation Results and Discussions
1. The bottom-hole pressure obtainable for the CO2 system is 400 psi with an
underbalance of 300 psi. In comparison, the foam had created an overbalance of
1938 psi with a BHP of 2638 psi (this case was modeled using WELLFLO 7 and
is discussed in Chapter 5). The frictional pressure drop in the annulus is 139 psi.
2. Figure 7 illustrates the calculated variations of CO2 density with pressure at
different temperatures. The plot at 50 oF corresponds to the liquid phase of CO2.
With increase in temperature and pressure, CO2 attains the supercritical phase
23
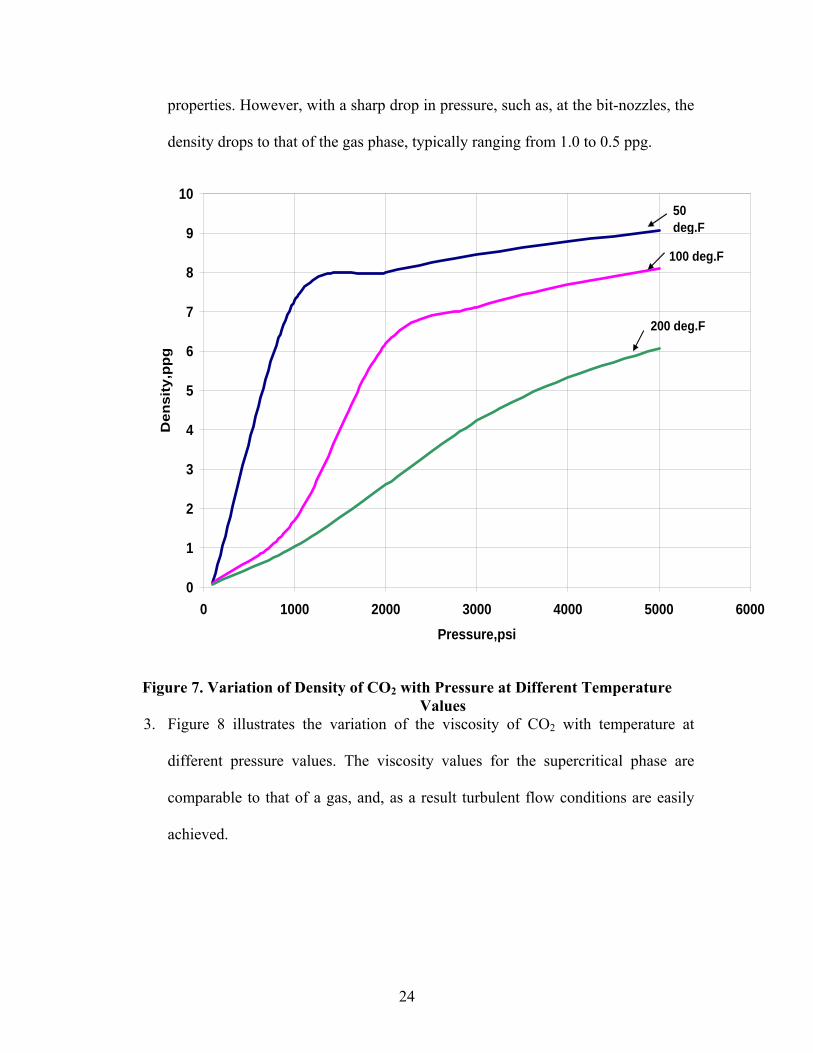
properties. However, with a sharp drop in pressure, such as, at the bit-nozzles, the
density drops to that of the gas phase, typically ranging from 1.0 to 0.5 ppg.
0
1
2
3
4
5
6
7
8
9
10
0 1000 2000 3000 4000 5000 6000Pressure,psi
Den
sity
,ppg
50 deg.F
100 deg.F
200 deg.F
Figure 7. Variation of Density of CO2 with Pressure at Different Temperature Values
3. Figure 8 illustrates the variation of the viscosity of CO2 with temperature at
different pressure values. The viscosity values for the supercritical phase are
comparable to that of a gas, and, as a result turbulent flow conditions are easily
achieved.
24

0
0.02
0.04
0.06
0.08
0.1
0.12
0.14
0.16
0 50 100 150 200 250
Temp., deg.F
visc
osity
, cP 5000 psi
2500 psi
1500 psi
500 psi
Figure 8. Variation of Viscosity of CO2 with Temperature at Different Pressure Values
4. Figure 9 illustrates the variation of the density of CO2 with depth in the tubing
and annulus. It is observed that it is possible to obtain a sharp contrast in the
density values in the tubing and the annulus when CO2 is used as the drilling
fluid. The higher density in the tubing is necessary for generating sufficient torque
in the motor, while the lower density in the annulus allows the underbalanced
conditions. This is a very important result as density of CO2 strongly influences
the resulting circulating pressures in the tubing and the annulus and this can be
observed in Figure 10.
25

0
1
2
3
4
5
6
7
8
0 2000 4000 6000 8000 10000 12000 14000 16000depth(ft)
den
sity
(pp
g)
TubingAnnulus
Figure 9. Variation of CO2 Density with Depth
Pressure,psi
0
Annulus Tubing
Choke2000
Pressure4000
6000h,ft Dept
8000
10000
12000
14000 0 1 000 2000 3000 4000 5000 6000
BottomholePressure
Pressure dropacrossnozzles+motor+MWD
Figure 10. Variation of Circulating Pressure with Depth
26

5. Figure 10 illustrates the circulating pressures in the tubing and the annulus,
respectively. The pressure profile in the annulus is attractive from an
underbalanced drilling perspective. The large pressure drop across the nozzles
generates the desirable jet impact force.
6. Figure 11 illustrates the variation of bottomhole pressure with choke pressure
changes. It is clearly seen that the surface choke plays a crucial role in
maintaining underbalanced conditions in the annulus when CO2 is used as a
drilling fluid. One can adjust the choke to readily change the annular pressure
profile from underbalanced to balanced to overbalanced conditions.
0
2000
4000
6000
8000
10000
12000
140000 1000 2000 3000 4000 5000 6000
Pressure, psi
Dep
th, f
t
Pchoke=300 psi400 psi600 psi800 psi1000
Figure 11. Variation of Bottom-hole Pressure with Choke Pressure
27

7. Figure 12 illustrates the variation of cuttings transport ratio (CTR) with depth for
cutting sizes of 0.1, 0.05 and 0.05 inches, respectively. The annular velocities are
higher at shallower depth which shows higher CTRs. The size of the cuttings is
generally small in an underbalanced drilling operation. Also, the jetting action of
CO2 is expected to further reduce the size of the cuttings.
0
2000
4000
6000
8000
10000
12000
140000.7 0.75 0.8 0.85 0.9 0.95 1
CTR
dept
h(ft)
0.01 inch cuttings0.05 inch cuttings0.1 inch cutting
Figure 12. CTR Variations with Depth and Cuttings Size
8. The jet impact force generated by CO2 expanding through the nozzles (5000 psi)
is 1564 lbf. This is calculated based on the density change across the nozzle.
28

CHAPTER 5
WELLFLO 7 MODELING AND RESULTS
WellFlo7, a NeoTec product, is an industry-standard steady state multiphase flow
analysis tool used in UBD well design [23]. It contains a compositional module where the
user can specify the equation of state and other correlations to calculate the PVT based
properties of the drilling fluid. Because an accurate prediction of the phase behavior of
CO2 is important for our system, WellFlo7 was selected for comparison of the results
from the model. Also, the proposed model does not contain iterations and WellFlo7
performs rigorous iterations for target convergence and therefore a comparison of results
with WellFlo7 becomes necessary.
5.1. About WellFlo 7 [23]
The user is allowed to design or monitor a UBD well by simulating the fluid flows that
occur. Drilling fluids can be any gas, including nitrogen (with or without impurities);
water, including brines; hydrocarbon liquids, including diesel and native oils; or aqueous
foams. Reservoir fluid production can be specified to occur from a single location,
multiple locations or distributed per foot or per meter over any number of defined
intervals. Contributing flow rates can be specified as a fixed rate or computed using an
IPR. Furthermore, flow can be defined as “in flow”, “out flow” or “free flow”, where
flow is entering, leaving, or determined by the pressure differential (i.e. if the bottom-
hole pressure is higher than the reservoir static pressure, then you have out flow). All
produced reservoir fluids are commingled with the injected drilling fluid(s) on either a
compositional or non-compositional basis. Provision exists for taking into account the
29

pressure drop in the drill string due to the BHA. Pressure losses through the nozzles of
the BHA can be specified or calculated and the motor input is reported as an equivalent
liquid volumetric rate. Continual velocity checks are performed as the calculations step
through the well. In addition, the liquid volume fraction is reported at that point. Input
data can be specified using units familiar to drilling engineers (i.e. US gal/min or
litres/min for liquids, and scf/min or Sm3/min for gases). Specialized plots such as
bottom-hole pressure versus gas injection, liquid transit time, motor equivalent liquid
volume versus injection rate, etc, are available in addition to the standard well hydraulics
plots.
All calculations are performed using the stepwise calculation procedure for optimum
results. Step sizes can be controlled by the user, or the software can be directed to
optimize the step size. Pressure calculations can be performed by assuming a temperature
profile. Wellhead and bottom-hole temperatures can be entered to define a linear
temperature profile or a detailed temperature versus depth profile can be supplied.
5.2. Comparison of Results from Proposed Model and WellFlo 7
Before comparing the results from the proposed model with WellFlo 7 for drilling with
CO2, the case for drilling with foam of nitrogen and water was modeled. 900 scfm
nitrogen and 0.75 bpm KCL water with foaming agent was used to generate a 65 quality
foam [1]. The choke pressure was set to 100 psi. The resulting pressure profile is shown
in Figure 13. The resulting bottomhole pressure is 2638 psi, which creates a condition of
severe overbalance in the annulus. The friction in the annulus is 728 psi which is much
higher than with CO2 and the hydrostatic head contribution is 1840 psi. Figure 14
30

illustrates the excellent cuttings carrying capacity of foam. This is done for cuttings sizes
of 0.1 inch and 0.2 inch.
0
2000
4000
6000
8000
10000
12000
14000 0 500 1000 1500 2000 2500 3000 3500
pressure,psi
dept
h,ft
tubingannulus
Figure 13. Circulating Pressure Profile of Foam of Nitrogen and Water
Results from figure 14 confirm that foams have excellent hole cleaning capacity. They
are therefore used frequently in UBD operations. Foams are an expensive option in
comparison to the common drilling fluids used in underbalanced drilling. However, for a
very low pressured reservoir, they are unable to maintain underbalance in the wellbore as
indicated by the pressure profile in Figure 13. Foams are formed by the addition of
surfactant to a mixture of nitrogen and water. The foam breaks close to the surface
resulting in a drop in CTR. This is because its quality increases towards the surface due
to the decrease in pressure and the gas fraction in the foam increases.
31

0
2000
4000
6000
8000
10000
12000
14000 0 0.2 0.4 0.6 0.8 1 1.2
Dep
th,ft
0.2 inch0.1 inch
Foam breaks
CTR
Figure 14. Cuttings Transport Ratios for 0.1” and 0.2” Cuttings for Foam
Results obtained for the case study example using the proposed model were compared
with the results from WellFlo 7 to determine the accuracy of the model developed. CO2
was modeled as a compositional fluid because it suitably described its phase changes on
the tubing side. The drilling profile and other parameters were entered by assuming a
linear temperature profile both on the annulus and the tubing side. The input parameters
are same as indicated in Table 2. Figure 15 illustrates the circulating pressure profile for
the case study using WellFlo 7. On comparing with Figure 10, the model underestimates
the injection pressure needed to get the necessary pressure drop across the BHA and the
bottomhole pressure by 37 psi. The WellFlo results indicate that with CO2, the pressure
profile needed to get underbalanced conditions can be achieved. Also, denser phase in the
tubing can be achieved. The friction pressure drop in the annulus is 107 psi compared to
32

139 psi predicted by the proposed model. This comparison is done by assuming the same
choke pressure and flow rate.
0
2000
4000
6000
8000
10000
12000
14000 0 1000 2000 3000 4000 5000 6000 7000
dept
h,ft
WellFlo7
Model
WellFlo7
Model
pressure,psi
Figure 15. Comparison of circulating pressure profile from Model and WellFlo 7
Figure 16 illustrates the comparison of the frictional pressure drop values with choke
pressure for the same flow rate of gas, from the model and WellFlo7. As the choke
pressure is increased, the bottomhole pressure also increases which causes a reduction in
the annular velocity of the drilling fluid. This causes a reduction in the frictional pressure
drop in the annulus.
Figure 17 illustrates the comparison of the frictional pressure drop values with gas flow
rate for the same choke pressure, from the model and WellFlo7. A higher gas flow rate
results in higher circulating annular velocity which causes higher frictional pressure drop.
33

As the gas flow rate is increased, the difference in the pressure drop values predicted by
the model and WellFlo7 also increases.
0
50
100
150
200
250
300
350
400
450
500
0 500 1000 1500 2000 2500 3000Flow rate of gas (scfm)
Fric
tiona
l Pre
ssur
e dr
op in
ann
ulus
(psi
)
Model
WellFlo7
Choke Pressure=100 psi
Figure 16. Comparison of Frictional Pressure Drop with Choke Pressure from
Model and WellFlo 7
0
50
100
150
200
250
0 50 100 150 200 250 300Choke Pressure (psi)
Fric
tiona
l pre
ssur
e dr
op in
ann
ulus
(psi
)
ModelWellFlo7
Flow rate of gas= 1500 scfm
34
Figure 17. Comparison of Frictional Pressure Drop with Gas Flow Rate from Model and WellFlo 7

A comparison of density values obtained from the model and WellFlo7 for a combination
of pressure and temperature values is shown in Figure 18. The density values predicted
by the model closely match the values calculated by WellFlo7. This increases the
confidence in the density predictions by the PVT model. Density is an extremely
important property as it largely determines the circulating pressure profile. This is
definitely an encouraging result.
y = 1.0074x - 0.0091R2 = 1
0
1
2
3
4
5
6
7
0 1 2 3 4 5 6 7density predicted by WellFlo7(ppg)
dens
ity p
redi
cted
by
mod
el (p
pg)
(P1,T1)(P2,T2)
(P3,T3)
(P4,T4)
(P5,T5)
(P6,T6)(P1,T1)=500 psi, 60 F
(P2,T2)=1000 psi, 200 F
(P3,T3)=2000 psi, 260 F
(P4,T4)=2500 psi, 207 F
(P5,T5)=3618 psi, 250 F
(P6,T6)=6349 psi, 248 F
Figure 18. Comparison of Density Predictions from Model and WellFlo 7
Figure 19 illustrates the change in density of CO2 in the tubing and the annulus. It agrees
with our expectation of being able to achieve a higher density in the tubing and a lighter
fluid in the annulus. WellFlo 7 does not identify the supercritical phase of CO2 as
supercritical, but as a liquid or gas depending on the pressure and temperature. The drop
in density in the above plot is due to the transition of liquid phase of CO2 to the
35

supercritical phase. However WellFlo 7 identifies supercritical CO2 beyond this transition
phase as liquid until some distance where it sees it as a gas. However, the incapability of
WellFlo7 to distinguish the phase changes does not affect the results as the density values
predicted by WellFlo 7 closely match that of model as shown in Figure 18.
0
1
2
3
4
5
6
7
8
0 2000 4000 6000 8000 10000 12000 14000 16000Depth, ft
Den
sity
,ppg
transition from liquid to supercritical phase
Tubing
Annulus
Gas Phase According to WellFlo
WellFloModel
WellFloModel
Figure 19. CO2 Density Variations in the Tubing and the Annulus
A comparison of the CTRs obtained from the model and WellFlo7 as a function of depth
is shown in Figure 20. The results predicted by WellFlo7 reaffirm that CTRs would be
acceptable for the selected range of cuttings sizes for this CO2 drilling system. The CTRs
predicted by WellFlo7 and the model are fairly close for smaller size cuttings i.e. 0.01
inch and 0.05 inch cuttings. However, for size cuttings greater than 0.1 inch, the
difference in the predicted values increases.
36

0
2000
4000
6000
8000
10000
12000
14000
0.7 0.75 0.8 0.85 0.9 0.95 1CTR
Dept
h(ft)
0.1 inch, WellFlo70.1 inch, Model0.05 inch,WellFlo70.05 inch,Model0.01 inch,WellFlo70.01 inch,Model
. Figure 20. CTR Variations with Depth for Different Sized Cuttings Using WellFlo7
37

CHAPTER 6
CORROSION PROBLEMS WITH CO2 AND ITS CUTTINGS CARRYING CAPACITY
6.1. Corrosion Potential of CO2
Pure and dry CO2 is non-corrosive. However, if it encounters formation water,
carbonic acid is formed which corrodes the metal surface. Iron carbonate is one of the
products of the corrosion reaction and is known to have protective properties. The
primary environmental factors that affect corrosion rates are: the partial pressure of CO2,
operating pressure and temperature, flow rate of CO2, water content and contaminants
such as hydrogen sulfide and oxygen. Pure CO2 exerts a very large partial pressure that
leads to reduction in pH and increase in the carbonic acid reduction reaction. At
temperatures lower than 158 oF, the corrosion rate progressively increases up to an
intermediate temperature range (158 to 194 oF) and then the corrosion rate drops [24].
Higher temperatures cause a reduction in the solubility of the protective film of iron
carbonate, and this increases pH. However, larger pressure increases solubility and
lowers the pH. Higher flow rates increase the transport rates of reacting species to the
metal surface and do not allow the protective films to form. Presence of hydrogen sulfide
and oxygen can worsen the situation [24]. The physical parameters that affect corrosion
rate include water wetting, presence of wax and crude oil, and, characteristics of the
corrosion film. If a water-in-oil emulsion forms in an oil/water system, then water is
shielded by a continuous oil-film, thus reducing the rate of corrosion. Wettability effect
and corrosion inhibition by surface active components of the crude oil can provide
protection [25].
38

In terms of corrosion mitigation, iron carbonate or siderite film is most important. In
terms of metallurgy, small quantities of chromium (0.5 wt % to 3 wt %) is beneficial as it
promotes the formation of stable, protective chromium oxide film. It is found that V-
microalloyed steel containing Cr, Si, Mo and Cu is the most promising composition in
terms of corrosion resistance and mechanical properties [24]. Liquid CO2 is completely
dehydrated before injection so internal corrosion of the tubing may not be a problem.
The de Waard and Milliams equation [26] predicts the maximum rate of corrosion or the
worst case scenario. The de Waard and Milliams nomogram is a simple form of
relationship between ‘potential corrosivity’ and temperature and partial pressure of CO2
and is illustrated in Figure 21. It also includes a scale for the deposit factor (scale factor)
that accounts for the formation of the protective carbonate film that causes reduction in
corrosion rate at higher temperature.
.
Figure 21. de Waard and Milliams Nomogram [16]
39

The corrosion rates are expressed in millimeters/year or mils/year. The rate is expressed
as a function of pressure and temperature:
)log(67.0)/1710(8.5)log( 2COcorr ppTV +−= (21)
where,
= corrosion rate in mm/year corrV
T = temperature, K
= partial pressure of CO2COpp 2, bar
Above equation does not consider the presence of scale, flow rate, pH and non-
ideality of gas. Aaker [22] corrected the de Waard and Milliams equation for scaling and
non-ideality of gases. A scale factor (Fscale) is taken into account for the formation of
protective carbonate films that lead to a reduced corrosion rate at higher temperatures. At
temperatures above 140 deg. F one needs to take this factor into account though at
temperatures below 140 deg. F its value is taken as 1. Scale factor is given by:
))5.7/(2500(log −= TFscale
(22)
where
T = temperature, K
Fugacity coefficient (a) that takes into consideration the non-ideality of gases at higher
pressure is calculated by the following equation. The fugacity of CO2 (fCO2) was used in
place of partial pressure in the calculations.
(23) ))((22 COCO ppaf =
⎥⎦⎤
⎢⎣⎡ −= )4.1(0031.0)log(
TPa total (24)
where
40

Ptotal = Total pressure of the system
T = temperature, K
= partial pressure of CO2COpp 2, bar
Based on the work of Aaker [22], the corrosion rates for a CO2 based drilling system,
along the length of the annulus, are illustrated in Figure 22. The variation of choke
pressure causes changes in BHP which, in turn, affects the downhole corrosion rates.
Higher choke pressure implies higher pressures in the annulus and hence higher corrosion
rates.
0
0.5
1
1.5
2
2.5
3
3.5
4
0 2000 4000 6000 8000 10000 12000 14000 16000
Depth, ft
Cor
rosi
on ra
te(m
m/y
ear)
Pchoke=300 psi, tsurface=60deg.F
Pchoke=500 psi, tsurface=60 deg.F
Pchoke=700 psi, tsurface=60 deg.F
Figure 22. Corrosion Rates Along the Annulus Length for Different Choke Pressures
41

Corrosion affects the economics of the process and hence it is essential to include the
necessary corrosion related steps in the planning phase before the initiation of the project.
Detection and monitoring of corrosion rates is essential. Data collection on wells
improves the chances of accurately predicting and managing the risks of corrosion. Test
coupons, caliper surveys, sonic-thickness logs and probes are some of the options that do
not require pulling the tubing out of the hole for inspection.
Since the corrosion rates can be severe under certain downhole conditions, one must
look at the available preventive methods. An effective corrosion control program must be
designed that may combine 2 or more preventive methods. Corrosion resistant alloys
(13% Cr steel, duplex stainless steels) either in the solid form or as a cladding on carbon
steel are the most attractive though expensive solution to CO2 corrosion problem. The
most common method of corrosion prevention in the industry is the use of corrosion
inhibitor that is designed to cover the metal surface with an oil-wet film. Its concentration
can be changed in situ without disrupting any operations. Protective coatings provide a
barrier between the metal and the environment. However in presence of solids and high
flow rates coatings can be quickly eroded and hence do not offer a reliable solution to the
corrosion problem.
6.2. Low Viscosity of CO2: Potential for Using Thickening Agents
The low viscosity of CO2 is a concern from the cuttings carrying perspective. Turbulent
velocity conditions in the annulus are an alternative for avoiding cleaning problems in the
hole, in the absence of high-viscosity of the drilling fluid. However, the increase in the
frictional losses in the tubing limits the increment in velocity of the drilling fluid to
maintain turbulence in the annulus. The low viscosity of CO2 is also a concern in fracture
42

stimulation and EOR projects using CO2. Hence numerous studies [27, 28, 29, 30 and 31]
have been conducted to develop ‘thickeners’ for CO2.
Enick et al. [27] designed and synthesized thickeners that exhibit high CO2 solubility
and the ability to induce significant increases (2-100 fold) in viscosity. Each candidate
thickener contained a CO2–philic group for enhancing solubility and a CO2–phobic group
to induce intermolecular interactions that resulted in formation of macromolecular
structures in solution which were capable of causing tremendous increases in solution
viscosity. The thickened solution would be transparent, single-phase and shear-thinning.
Xu et al. [28] discuss the utility of fluroacrylate –styrene copolymer for thickening of
CO2. Fluropolymers are characterized by environmental persistence, high cost and
unavailability in large quantities. Therefore nonflurous, inexpensive thickeners are
currently being designed. Several promising non-fluorous CO2 soluble polymers have
been identified in the literature, including polypropylene oxide and polyvinyl acetate. Bae
and Irani [29] conducted a laboratory investigation of the viscosified CO2 using a
commercial silicon polymer and toluene as a cosolvent. The viscosified CO2 was used in
corefloods in Berea and carbonate reservoir cores. The oil recovery obtained was
compared to the results of other processes such as neat CO2 and WAG. It was found that
oil recovery is enhanced and CO2 breakthrough retarded significantly. Enick [21] has
conducted a literature review of the studies in this field where it is concluded that a
satisfactory thickener has not been identified for field application but the effort is being
carried out in this regard. Significant research in this field is ongoing.
Techniques are being developed to “gel” carbon dioxide [31].Shi et al. [31] have
combined concepts of CO2-philic design and molecular assembly in solution to generate
43

compounds that gel CO2 at concentrations below 5 weight %. These compounds have a
strong thermodynamic affinity for CO2 dissolving in it to form gels. Upon removal of the
CO2, these gels produce free-standing foams with an average diameter smaller than 1
micrometer and a bulk density reduction of 97 % relative to the parent material. Figure 23
illustrates the scanning electron microscope (SEM) images of the foam produced from
different gelling compounds in single-phase solutions of CO2.The interesting finding is
that once the gelling of supercritical CO2 under high pressure is done to form a semi-solid
material, the release of pressure does not change the shape of the material.
Figure 23. SEM Images of Foam Produced from CO2-gels
44

CHAPTER 7
QUALITATIVE ANALYSIS OF DRILLING WITH SUPERCRITICAL CO2
7.1. Potential Advantages
Based on the results of the simulation study for the example case study and results from
WELLFLO 7, some advantages of using CO2 as a drilling fluid become apparent.
1. High density of liquid-supercritical CO2 in the tubing allows the downhole motor
to generate necessary torque for satisfactory drilling in the example case study.
Also, the jetting action is expected to complement the bit performance and
enhance the drilling rates. In addition to lubricating and cooling the bit, it
provides pre-cleaning of the tool path and propagation of the cracks induced by
the bit [13].
2. Gaseous phase CO2 in the annulus leads to lower pressure values in the annulus
which is very important for an underbalanced drilling operation. The results also
indicate that efficient hole-cleaning is achieved in the system as long as cutting
sizes are less than 0.05”.
3. The critical temperature (88 deg. F) and critical pressure of CO2 (1074 psi) are
favorable from the point of view of energy requirements.
4. CO2 is a non-damaging fluid for the formation and does not adversely affect the
formation permeability. In fact, it is often used as a fracturing fluid because it
improves the fluid conductivity near the wellbore.
7.2. Possible Problems
Despite potential advantages offered by the use of CO2 as a drilling fluid, some problems
are anticipated as described in the following.
45

a. If formation water mixes with CO2 in the annulus, then corrosion rates can be
significant. This is a major concern.
b. Cuttings carrying capacity could be questionable due to the low viscosity of CO2.
However, the results show that as long as turbulent flow conditions are
maintained in the annulus and for smaller cuttings, CTRs are favorable. For other
situations, there may be a need to increase the viscosity using CO2
thickeners/viscosifiers.
c. The NIST data tables [21] indicate that the Joule Thompson coefficient for the
CO2 system is 0.0012 oF/psi, which corresponds to a temperature drop of 8 oF
across the nozzles. The Joule Thompson effect, though not significant for the case
study, needs to be considered for any possibility of a large temperature drop
across the nozzles and the choke.
d. The CO2 drilling system requires a specially designed high pressure motor with
sealing elements compatible with supercritical CO2, as it is known to cause
swelling of the elastomers. Drilling turbines may offer an attractive alternative to
mud-motors.
e. The system requires high-pressure equipment, including a high pressure pump to
inject liquid CO2, high pressure coiled tubing and specially designed jetting bits
that work on the principle of critical flow. This is important because critical flow
will definitely occur as a large pressure drop is desired across the nozzles. The
working pressure rating of coiled tubing is constrained by its fatigue limits.
f. CO2 is a green-house gas and therefore there are environmental issues associated
with its discharge to the atmosphere. An alternative is to re-compress the
46

circulated CO2, which can be stored for further use as a drilling fluid or for
enhanced recovery projects.
7.3. Economic Considerations
The costs for CO2 vary between $10/ton to $50/ton depending on the location of the
source such as CO2 producing reservoirs or power stations. It makes most economical
sense to have the source close to the drilling site. Wooten [32] provided a brief outline of
methods of supply versus volume requirement:
1. Low Volume or job specific or temporary/ short term injection requirement -
Transport Trucks
2. Intermediate volume requirement or remote locations - Investigate installation of
small gas extraction system
3. Medium to High Volume or long term project- Source of gas from other gas
fields.
UBD wells are drilled after serious front-end engineering as they are expensive wells to
be drilled due to the requirement of special equipment and personnel.The incremental
surface equipment costs include a high pressure pump, compressors, and separation units,
in addition to CO2 recovery systems. The coiled tubing system, well control system and
bottomhole assembly add to the equipment costs. The process may be cost-effective as
long as CO2 can be recaptured after drilling and stored for use as a fracturing fluid or an
enhanced recovery treatment. In addition, the benefits associated with underbalanced
drilling include the cost savings of the non-productive time associated with conventional
drilling, dealing with lost circulation and differential sticking problems [20]. Additional
47

savings may result from improved drilling rates and elimination of the costs associated
with stimulation and cleanup [20].
48

CHAPTER 8
CONCLUSIONS AND RECOMMENDATIONS
8.1. Conclusions
The work presented is an analysis of the technical feasibility of underbalanced drilling
with CO2 in deep wells using a coiled tubing operation. The system is modeled as a
spreadsheet application and applied to a field case study. The results are compared with
WELLFLO 7, a flow modeling tool for UBD.
1. The results indicate that drilling with the CO2 system can provide solutions to the
important problems encountered in the example case study. This is very
encouraging as it justifies the further development of the proposed technology.
2. Liquid-like density and gas-like viscosity of CO2 is advantageous in its role as a
drilling fluid. These properties allow it to run the downhole motor as well as
develop the desired underbalance across the formation face.
3. The large pressure drop across the nozzles allows CO2 to change to a vapor phase
in the annulus which results in accelerated flow velocity for effective borehole
cleaning and at the same time maintain underbalanced conditions in the annulus.
4. The surface choke plays a key role in maintaining the desired bottomhole
pressure. It allows relatively quick adjustment of bottomhole pressure from
underbalanced to overbalanced conditions if the need arises.
5. A corrosion control program is a must for the system and needs careful
consideration. It must be a part of the planning process.
6. The drilling cost reduction and reservoir value creation associated with UBD most
likely offsets the costs associated with equipment and purchase of bulk liquid CO2
49

7. The drilling cost reduction and reservoir value creation associated with UBD most
likely offsets the costs associated with equipment and purchase of bulk liquid
CO2.
8. Techniques to recover CO2 after circulation may make this a value-added process.
The recovered CO2 may then be used for other applications that include EOR and
fracture stimulation.
This work has helped to propose a technology that holds potential for the future. The
comparison with WELLFLO 7 shows that the model needs to be refined to improve its
accuracy. The case study using WELLFLO 7 indicates that CO2 is an attractive choice for
underbalanced drilling operations. Therefore one can conclude that the technical
feasibility seems to be proved to an extent. However, this is still an ongoing research and
more work is needed in the improvement of the model and its application to a field
project.
8.2. Recommendations
Following recommendations are made:
1. A more rigorous iterative technique for the circulation model is recommended to
improve its accuracy.
2. A finite-difference approach is recommended for the modeling of the temperature
profile in the tubing and the annulus.
3. Techniques for recovery of the circulated CO2 need to be researched to make it a
more economical viable process.
4. A thorough economic analysis of the proposed technology is recommended.
50

REFERENCES
1. Hilton, D., Pruet Production Co., Personal Communication 2. Phase Diagram of carbon dioxide
Source: http://www.chemicalogic.com/co2tab/downloads.htm
3. Phase change of carbon dioxide to supercritical state, Source: www.firstscience.com 4. Hydrate formation diagram of gases, Source: www.telusplanet.net/public/jcarroll/HYDR.HTM 5. Bennaceur K., Monea M., Sakurai S., Gupta N., Ramakrishnan T.S., Randem T.
and Whittaker S., “CO2 Capture and Storage”, Oilfield Review, 2004 6. Friedman B.M., Wissbaum R.J. and Anderson S.P, “ Various recovery processes
supply CO2 for EOR projects”, Oil and Gas Journal, Aug 23, 2004
7. “CO2 EOR Technology”, Dec 2004 www.fe.doe.gov/programs/oilgas/publications/eor_co2/CO2brochure2004.pdf 8. Beyer A.H., Millhone R.S. and Foote R.W., “Flow Behavior of Foam as a Well
Circulating Fluid”, SPE 3986, Oct 1972 9. Bennion D.B., Thomas F.B., Bietz R.F. and Bennion D.W., “Underbalanced
Drilling: Praises and Perils”, SPE 52889, April 1996 10. Suryanarayana, P.V., Rahman, S, Natarajan, R., and, Reiley, R.: “Development of
a probabilistic model to estimate productivity improvement due to underbalanced drilling”, paper IADC/SPE 81639 presented at Underbalanced Tech and Exhibition, March 2003
11. Scherchel S.R. and Graves D.G., “Underbalanced-Directional Drilling with
Coiled Tubing- Challenges and solutions”, paper SPE 37062, Nov 1996 12. Thatcher D.A.A, Szutiak G.A. and Lemay M.M., “Integration of Coiled-Tubing
Underbalanced- Drilling Service to Improve Effciency and Value”, SPE 60708, April 2000
13. Kolle, J.J: “Coiled-Tubing Drilling with Supercritical Dioxide”, paper SPE 65534
presented at SPE/CIM International Conference on Horizontal Well Technology, Canada, Nov 2000
14. Smith J.M., Van Ness H.C. and Abbott M., “Introduction to Chemical
Engineering Thermodynamics”, 2004
51

15. Carroll J.J. and Boyle T.B., “Calculation of Acid Gas Density in the Vapor, Liquid and Dense Phase Region”, Presented at the 51st Canadian Chemical Engineering Conference, Oct 2001
16. Poling, B.E, Prausnitz, J.M, and, O’Connell, J.P: “Properties of gases and
liquids”, 5th Ed, McGraw Hill, 2002 17. Lyons W.C., Guo B. and Seidel F.A., “Air and Gas Drilling Manual”, 2nd edition,
McGraw-Hill, 2001 18. Holmes, C.S. and Swift, S.C; “Calculation of Circulating Mud Temperatures”,
paper SPE 2318, JPT, 670-674, June 1970 19. Bourgoyne A.T., Chenevert M.E.,Millheim K.K. and Young Jr., : “Applied
Drilling Engineering”, SPE Textbook Series, (Eds) Evers J.F and Pye D.S, Ninth Printing, 2003
20. Suryanarayana, P.V., Smith, B., Hasan, ABM, Leslie, C., and, Pruitt, R: “Basis of
Design for Coiled tubing Underbalanced Through-Tubing Drilling in Sajaa Field”, paper IADC/SPE 87146 presented at IADC/SPE Drilling Conference, Dallas, March 2004
21. Lemmon, E.W., McLinden, M.O., and Friend, D.G.: "Thermophysical Properties of Fluid Systems" in NIST Chemistry WebBook, NIST Standard Reference
Database Number 69, Eds. W.G. Mallard and P.J. Lindstrom, November 1998, National Institute of Standards and Technology, Gaithersburg MD, 20899
22. Aaker, G.A, “Corrosion Prediction”, Engineering Services, L.P.
URL: http://www.engineering-experts.com/co2.html 23. WellFlo 7, Neotechnology Consultants, Technical and User Documentation
24. Kermani M.B and Morshed A; “Carbon Dioxide Corrosion in Oil and Gas Production-A Compendium”, Corrosion, Vol 59, No.8, 2003
25. Lotz. U et al., “The effect of type of Oil or Gas Condensate on Carbonic Acid
Corrosion”, Corrosion, Vol. 47, No.8, 1991 26. CO2 Corrosion in Oil and Gas Production-Selected Papers, Abstracts, and
References”, Eds. Newton, L.E, Jr. and Hausler, R.H., an official NACE Publication, 1984
27. Enick R.M., Beckman E.J., Shi C., Huang Z., Xu J., Kilic S., “Direct Thickeners
for Carbon Dioxide”, SPE 59325, April 2000
52

28. Xu J., Enick R.M., Wlaschin A., “Thickening Carbon Dioxide with Fluroacrylate-Styrene Polymer”, SPE 84949, June 2003
29. Bae J.H. and Irani C.A., “A Laboratory Investigation of Viscosified CO2
Process”, paper SPE 20467, April 1993 30. Enick R.M., “A Literature Review of Attempts to Increase Viscosity of Dense
Carbon Dioxide”, under DOE contract DE-AP26-97FT25356, Oct 1998 31. Shi C., Huang Z., Kilic S., Xu J., Enick R.M., Beckman E.J., Carr A.J., Melendez
R.E. and Hamilton A.D., “The Gelation of CO2 : A Sustainable Route to the Creation of Microcellular Materials”, Science magazine, Vol 286, Nov 1999
32. James Wooten, Blade Energy Partners, Personal Correspondence.
53

APPENDIX A
PROPERTIES OF CARBON DIOXIDE
a) Critical Properties:
Critical Temperature: 88 deg. F
Critical Pressure: 1074 psia
Critical Density: 29.2 lb/cu ft
Critical Volume: 94.07 cc/mol
b) Triple Point
Temperature: -70 deg. F
Pressure: 75 psia
c) Normal Boiling Point( 14.7 psi)
Temperature: -109.3 deg. F
Latent Heat of Vaporization: 245.5 BTU/lb
d) Other Gas Properties
Gas density (1.013 bar at sublimation point): 2.814 kg/m3
Gas density (1.013 bar and 15 °C (59 °F)): 1.87 kg/m3
Compressibility Factor (Z) (1.013 bar and 15 °C (59 °F)): 0.9942
Specific gravity (air = 1) (1.013 bar and 21 °C (70 °F)): 1.521
Specific volume (1.013 bar and 21 °C (70 °F)): 0.547 m3/kg
Heat capacity at constant pressure (Cp) (1.013 bar and 25 °C (77 °F)): 0.037 kJ/ (mol.K)
Heat capacity at constant volume (Cv) (1.013 bar and 25 °C (77 °F)): 0.028 kJ/ (mol.K)
Ratio of specific heats (γ:Cp/Cv) (1.013 bar and 25 °C (77 °F)) : 1.293759
54

Viscosity (1.013 bar and 0 °C (32 °F)): 0.0001372 Poise
Thermal conductivity (1.013 bar and 0 °C (32 °F)): 14.65 mW/ (m.K)
Liquid Phase Properties
Liquid density (at -20 °C (or -4 °F) and 19.7 bar): 1032 kg/m3
Liquid/gas equivalent (1.013 bar and 15 °C (per kg of solid)): 845 vol/ vol
Boiling point (Sublimation): -78.5 °C
Latent heat of vaporization (1.013 bar at boiling point): 571.08 kJ/kg
Vapor pressure (at 20 °C or 68 °F): 58.5 bar
55

APPENDIX B
SPREADSHEET AND VB CODE EXAMPLE
VB Code to calculate Z factor
Public Function zfactor(p, t)
R = 8.314
Tc = 304
Pc = 7.4
molwt = 44
Tr = t / Tc
Pr = p / Pc
Omega = 0.22491
Pi = 3.14159267
m = 0.37464 + 1.54226 * Omega - 0.26992 * Omega ^ 2
alpha = (1 + m * (1 - (Tr ^ 0.5))) ^ 2
A = (0.4572355289 * (R ^ 2) * (Tc ^ 2)) / Pc
aalpha = A * alpha
B = 0.0777960739 * R * Tc / Pc
x = A * alpha * p / ((R * t) ^ 2)
Y = (B * p) / (R * t)
a2 = -(1 - Y)
a1 = x - 3 * (Y ^ 2) - 2 * Y
a0 = -(x * Y - (Y ^ 2) - (Y ^ 3))
56

p1 = ((3 * (a1)) - ((a2) ^ 2)) / 3
'q1 = (2 * ((a2) ^ 3) - 9 * a2 * a1 + 27 * ao) / 27
q1 = ((2 * (a2 ^ 3)) - (9 * a2 * a1) + (27 * a0)) / 27
rn = (((q1) ^ 2) / 4) + ((p1) ^ 3) / 27
If rn > 0 Then
'one real root
g1 = (-q1 / 2) + (rn ^ 0.5)
If g1 > 0 Then
pnew = Abs(((-q1 / 2) + (rn ^ 0.5))) ^ (1 / 3)
Else
pnew = -1 * Abs(((-q1 / 2) + (rn ^ 0.5))) ^ (1 / 3)
End If
term1 = (-1 * (q1)) / 2
term3 = (rn) ^ 0.5
qnew1 = (term1 - term3)
If qnew1 < 0 Then
qnew2 = -1 * Abs(qnew1) ^ (1 / 3)
Else
qnew2 = (qnew1) ^ (1 / 3)
End If
'qnew = ((-(q1) / 2) - (rn ^ 0.5)) ^ (1 / 3)
root = pnew + qnew2
root11 = root - (a2 / 3)
57

zo = root11
Else
'three unequal real roots
mnew = 2 * ((-p1 / 3) ^ 0.5)
theta = (3 * q1) / (p1 * mnew)
theta1 = WorksheetFunction.Acos(theta)
'theta1 = Acos(theta)
theta2 = theta1 / 3
root1 = mnew * Cos(theta2)
root2 = mnew * Cos(theta2 + 4 * Pi / 3)
root3 = mnew * Cos(theta2 + 2 * Pi / 3)
root11 = root1 - (a2 / 3)
root22 = root2 - (a2 / 3)
root33 = root3 - (a2 / 3)
If 217 < t < 400 And 0.52 < p < 7.4 Then
zo = root11
Else
zo = root33
End If
End If
cfactor = zo
zfactor = zo
End Function
58

Table 3. Spreadsheet Output for Calculations on the Annulus Side
n TDChoke Pressure
Surface Temp
20 14364 ft 100 psi 60 FDepth Pressure Pressure Temp Temp Density Density Viscosity(feet) (psi) (MPa) (deg.F) (K) ppg lb/cu.ft cP0 100 0.68947 60 288.7056 0.110132 0.823897 0.014409718.2 115.9455 0.79941 71.41938 295.0497 0.12543 0.938341 0.0147361436.4 131.1482 0.904227 82.83876 301.3938 0.139297 1.042078 0.0150612154.6 145.9221 1.006089 94.25814 307.7379 0.152132 1.138102 0.0153842872.8 160.4487 1.106246 105.6775 314.082 0.164175 1.228191 0.0157063591 174.8428 1.205489 117.0969 320.4261 0.175579 1.313507 0.0160254309.2 189.1819 1.304353 128.5163 326.7702 0.186454 1.394861 0.0163435027.4 203.5205 1.403213 139.9357 333.1143 0.196878 1.472843 0.0166585745.6 217.8983 1.502343 151.355 339.4584 0.206911 1.547902 0.0169726463.8 232.3449 1.601948 162.7744 345.8025 0.2166 1.620388 0.0172847182 246.8829 1.702184 174.1938 352.1466 0.225983 1.690582 0.0175957900.2 261.53 1.803171 185.6132 358.4907 0.23509 1.758712 0.0179038618.4 276.2997 1.905004 197.0326 364.8348 0.243947 1.824967 0.018219336.6 291.2031 2.007758 208.4519 371.1789 0.252574 1.889509 0.01851510054.8 306.2486 2.111492 219.8713 377.523 0.260991 1.952473 0.01881810773 321.4433 2.216255 231.2907 383.8671 0.269212 2.013977 0.01911911491.2 336.7927 2.322085 242.7101 390.2112 0.277252 2.074123 0.01941912209.4 352.3013 2.429012 254.1295 396.5553 0.285122 2.133001 0.01971712927.6 367.9727 2.537061 265.5488 402.8994 0.292834 2.190692 0.02001313645.8 383.8097 2.646253 276.9682 409.2435 0.300396 2.247266 0.02030714364 399.8146 2.756602 288.3876 415.5876 0.307818 2.302786 0.0206
59

APPENDIX C
HEAT TRANSFER MODEL BASED ON THE WORK OF HOLMES AND SWIFT [18]
The model is a solution of the steady-state equation for the heat transfer between the
fluids in the annulus and the fluids in the drill pipe. This is combined with an
approximate equation for the transient heat transfer between the fluid in the annulus and
in the formation. The approximate method may be adequate since the total heat transfer
between the two fluids is much greater than that between the annulus fluid and the
formation. The low heat transfer between the annulus fluid and the formation is a result
of the relatively low thermal conductivity of the formation.
Temperature values are calculated as a function of depth, circulation rate, CO2 properties,
reservoir properties and borehole geometry. The temperature of drilling fluid inside the
drill pipe is given as,
3.
2.
121 GATGxeKeKT s
xCxCp
−+++= (C1)
and temperature in the annulus is given as
sxCxC
aTGxeCKeCKT +++= .
42.
3121 (C2)
where,
))/41(1)(2/( 5.0331 BABC ++= (C3)
))/41(1)(2/( 5.0332 BABC +−= (C4)
))/41(1(2/1 5.03 BBC +++= (C5)
))/41(1(2/1 5.04 BBC +−+= (C6)
ppp hrmcA π2/3 = (C7)
60

pphrrUB /3 = (C8)
Forcing the boundary condition that annular and drillpipe fluid temperatures are equal at
the bottom of the well gives,
Boundary Condition1 at x=0; Tp = Tpi
Boundary Condition 2 at x=H; THp=THa
Using boundary condition 1 in equation 19 gives
321 GATKTK spi +−−= (C9)
Using boundary condition 2 gives
3.
2.
121 GAeKeK HCHC −+ = (C10) HCHC eCKeCK .
42.
3121 +
Substituting the value of K1 from equation 27 in equation 28 gives
)1()1()1()(
34
3332 12
1
CeCeCeGATTGA
K HCHC
HCspi
−−−
−+−−= (C11)
where
x = depth, ft,
H = total depth of the well, ft,
cp = heat capacity of the drilling fluid, BTU/ (lbm- oF)
G = geothermal gradient, oF /ft
sT = temperature of earth’s surface, oF
Tpi = inlet temperature of mud in drillpipe, oF
r = radius of well, ft
rp = radius of drillpipe, ft
m= mass flow rate, lbm/hour
U= overall heat transfer coefficient across wellbore face, BTU/ (sq.ft- oF -hour)
61

hp = overall heat transfer coefficient across drillpipe, BTU/ (sq.ft- oF -hour)
This is an approximate method as average properties are considered for heat transfer
coefficients and further work using a finite difference approach is recommended. The
resulting temperature profile could be illustrated by Figure 4.8. Liquid CO2 gains heat as
it enters the tubing. After exiting the nozzles, it follows the geothermal temperature until,
closer to the surface, considerable heat exchange between cold CO2 in the tubing and the
returning CO2 leads to a drop in its temperature. The Joule-Thompson effect occurs
during expansion of SCCO2 through the nozzles. The NIST data tables [27] indicate that
the Joule Thompson coefficient for the CO2 system is 0.0012 oF/psi, which corresponds to
a temperature drop of 6 oF across the nozzles.
0
2000
4000
6000
8000
10000
12000
14000
0 50 100 150 200 250Temp., deg.F
Dep
th, f
t
Temperature in the tubing
Temperature in the annulus
Geothermal temperature
Figure C1. Temperature Profile of CO2 in the Tubing and Annulus
62

VITA
Anamika Gupta earned the degree of Bachelor of Engineering in Chemical Engineering
in May 2003 from Mumbai University Institute of Chemical Technology, India. She
spent the Fall 2003 semester at the University of Missouri, Rolla, before continuing her
Master’s program in the Department of Petroleum Engineering at Louisiana State
University. She is currently doing an internship with Blade Energy Partners, Dallas.
Blade offers engineering expertise in underbalanced drilling, deepwater drilling and
critical well design.
63
Recommended