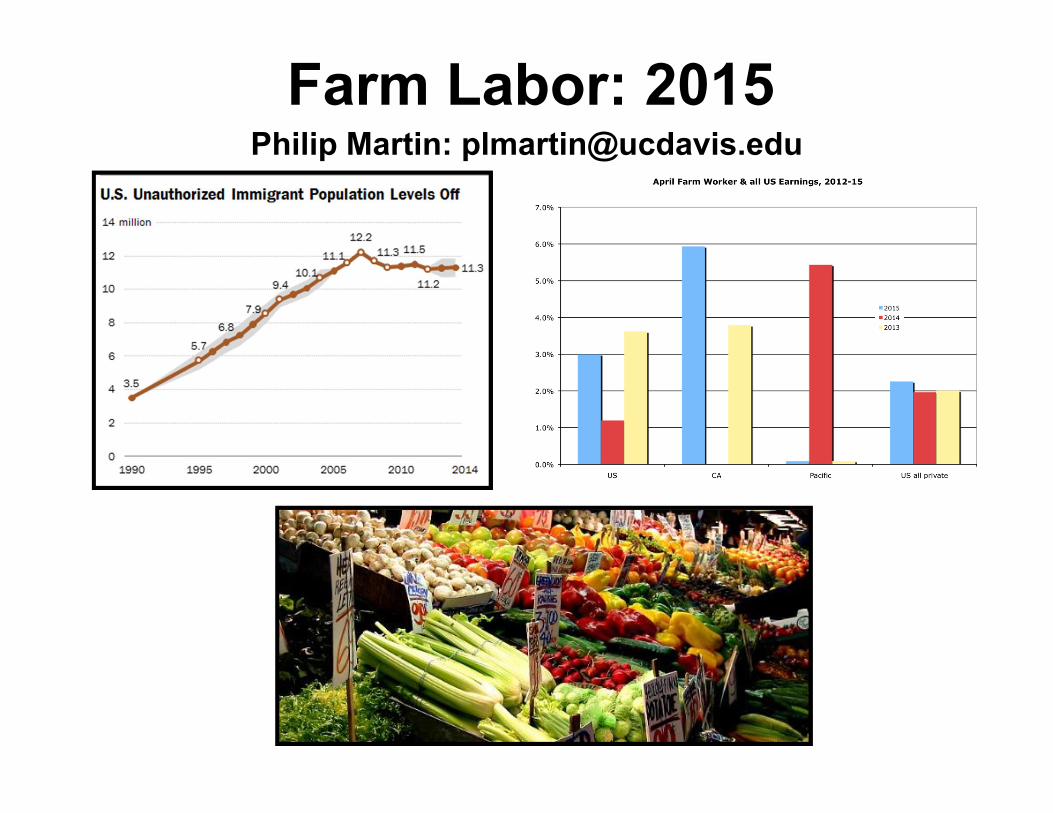
Philip Martin: [email protected] Labor: 2015
Highlights• Average employ, unique workers, peak/trough• Ave ag employ: US 1.2 million; CA 400,000• CA: 2 farm workers for each FTE ag job, so 400,000
FTE jobs = 800,000 California workers. Same 2 workers per FTE job across US?
• Employer 4 S responses to tight labor– Satisfy: wages, super training—growers think not much– Stretch: mechanical aids, change production practices– Substitute: labor-saving mechanization– Supplement: H-2A workers, but housing– Most employers do all 4—no one knows best combination
FVH ag = 3 S’s: Sales, Labor’s Share, Seasonality
• Farm sales = CA $43 bil (2012); IA = $31 bil– CA = 12% of US $395 billion in farm sales
because of FVH commodities– US 54% crops, 46% livestock; CA 70% crops,
30% livestock– CA $26 bil of $30 bil crop sales or 87% =
FVH commodities• FVH: labor’s share = 20-30% of prod costs• Seasonality: Ave emp 414,000 (2014) Peak
471,000 Aug; low 344,000 Jan. Ratio = 1.4
3 C’s of Farm Labor• Concentration: US: < 44,000 farms paid 75% of total
COA farm labor expenses; CA: <7,500 farms paid 90% of farm labor expenses.
• Contractors: intermediaries who recruit & deploy crews. Win-win specialization OR risk-absorbers?
• Conflict: Exit versus voice: easier to exit a “bad” job (ag & fast food) than to organize & voice demands to change wages and conditions– Exits of “best” workers = hard to sustain unions in ag, fast
food & other high turnover industries
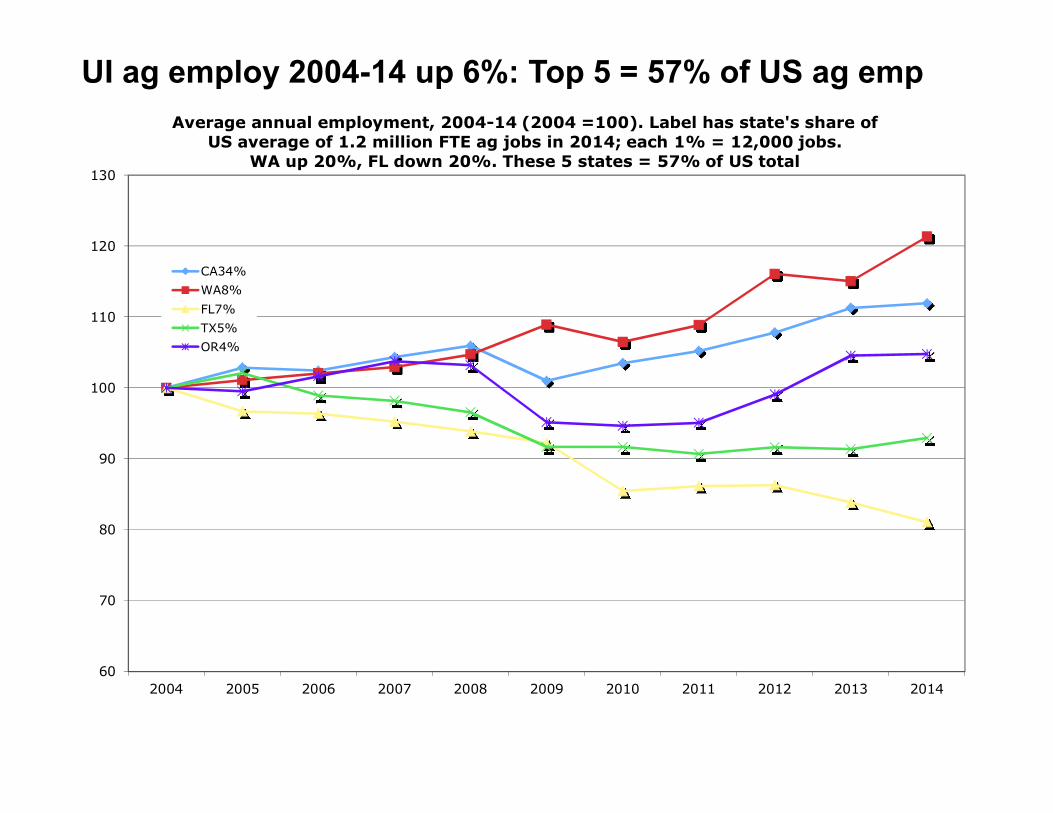
UI ag employ 2004-14 up 6%: Top 5 = 57% of US ag emp
60
70
80
90
100
110
120
130
2004 2005 2006 2007 2008 2009 2010 2011 2012 2013 2014
Average annual employment, 2004-14 (2004 =100). Label has state's share of US average of 1.2 million FTE ag jobs in 2014; each 1% = 12,000 jobs.
WA up 20%, FL down 20%. These 5 states = 57% of US total
CA34%WA8%FL7%TX5%OR4%
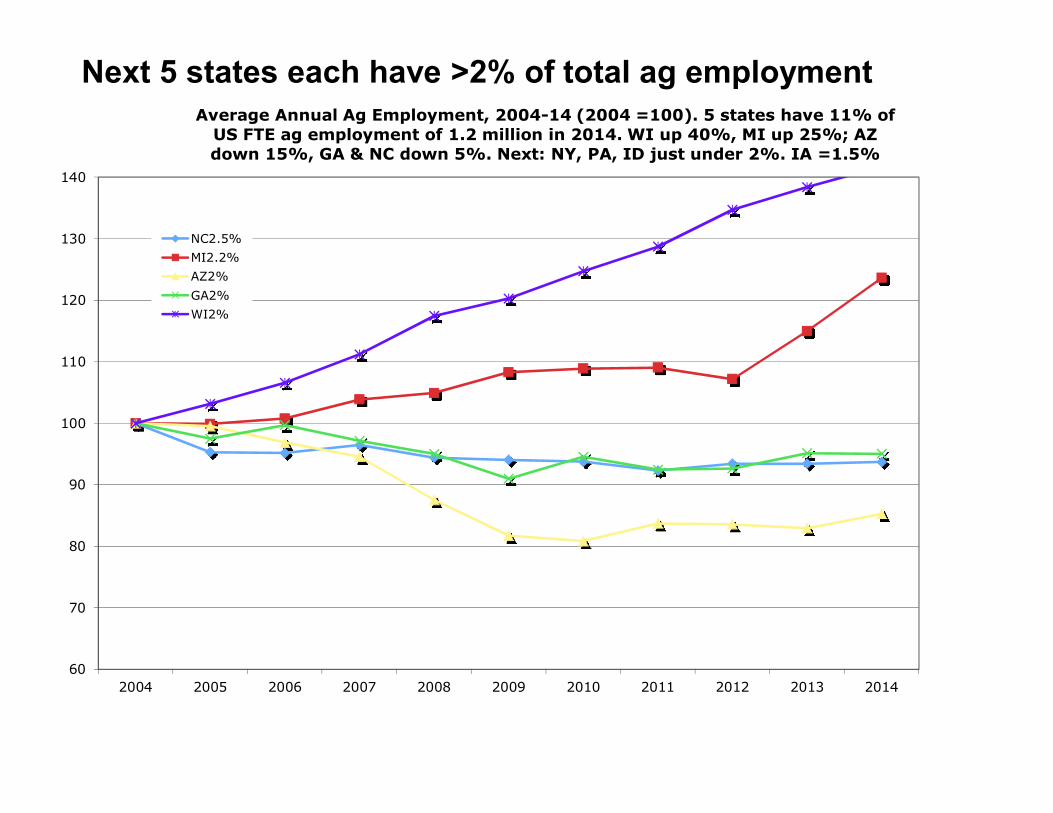
Next 5 states each have >2% of total ag employment
60
70
80
90
100
110
120
130
140
2004 2005 2006 2007 2008 2009 2010 2011 2012 2013 2014
Average Annual Ag Employment, 2004-14 (2004 =100). 5 states have 11% of US FTE ag employment of 1.2 million in 2014. WI up 40%, MI up 25%; AZ down 15%, GA & NC down 5%. Next: NY, PA, ID just under 2%. IA =1.5%
NC2.5%MI2.2%AZ2%GA2%WI2%
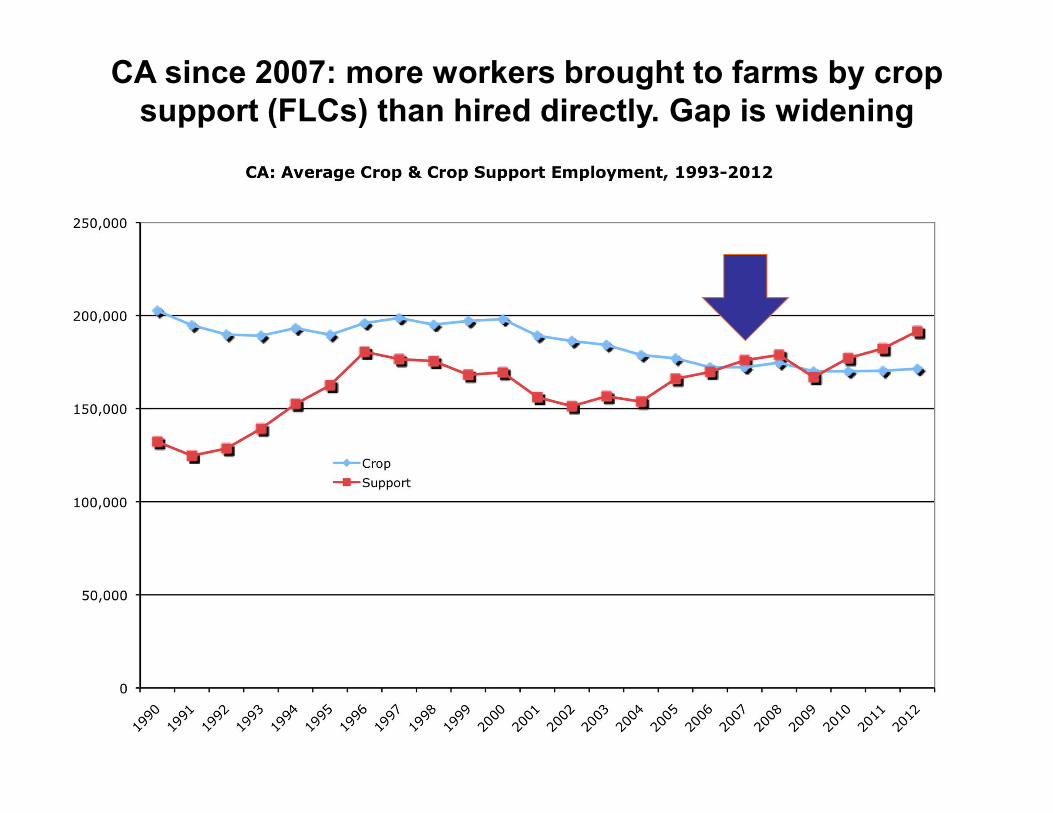
CA since 2007: more workers brought to farms by crop support (FLCs) than hired directly. Gap is widening
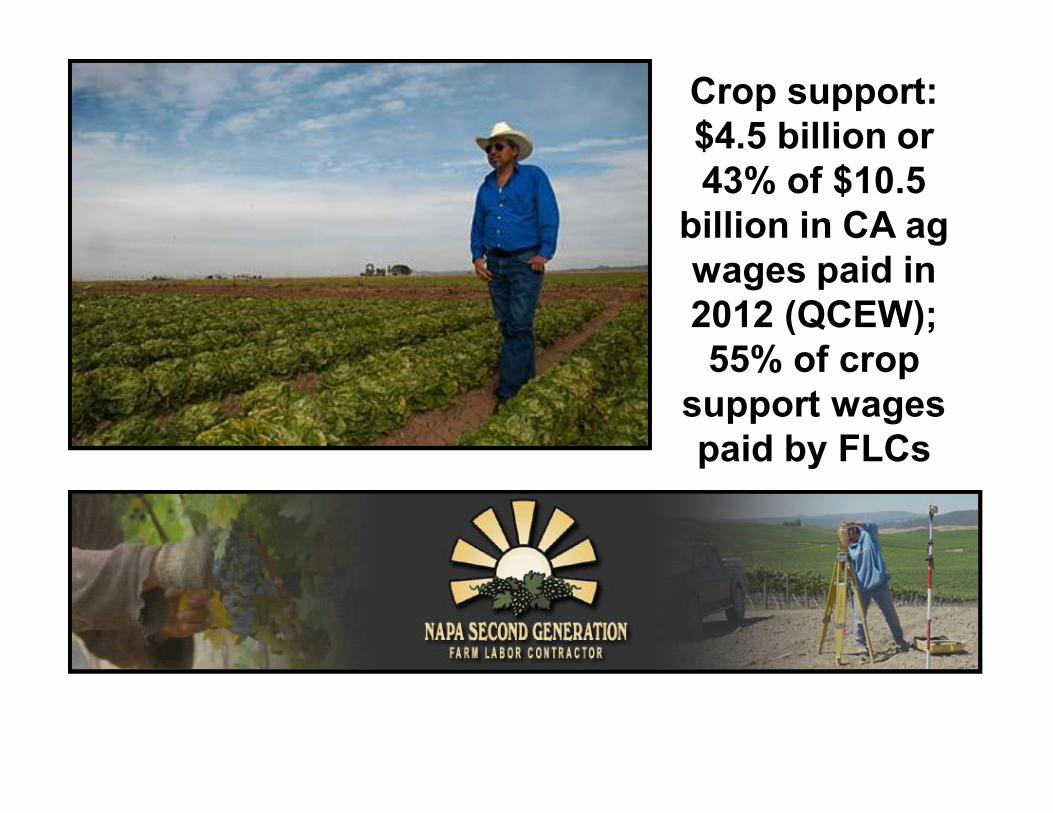
Crop support:$4.5 billion or 43% of $10.5
billion in CA ag wages paid in 2012 (QCEW); 55% of crop
support wages paid by FLCs
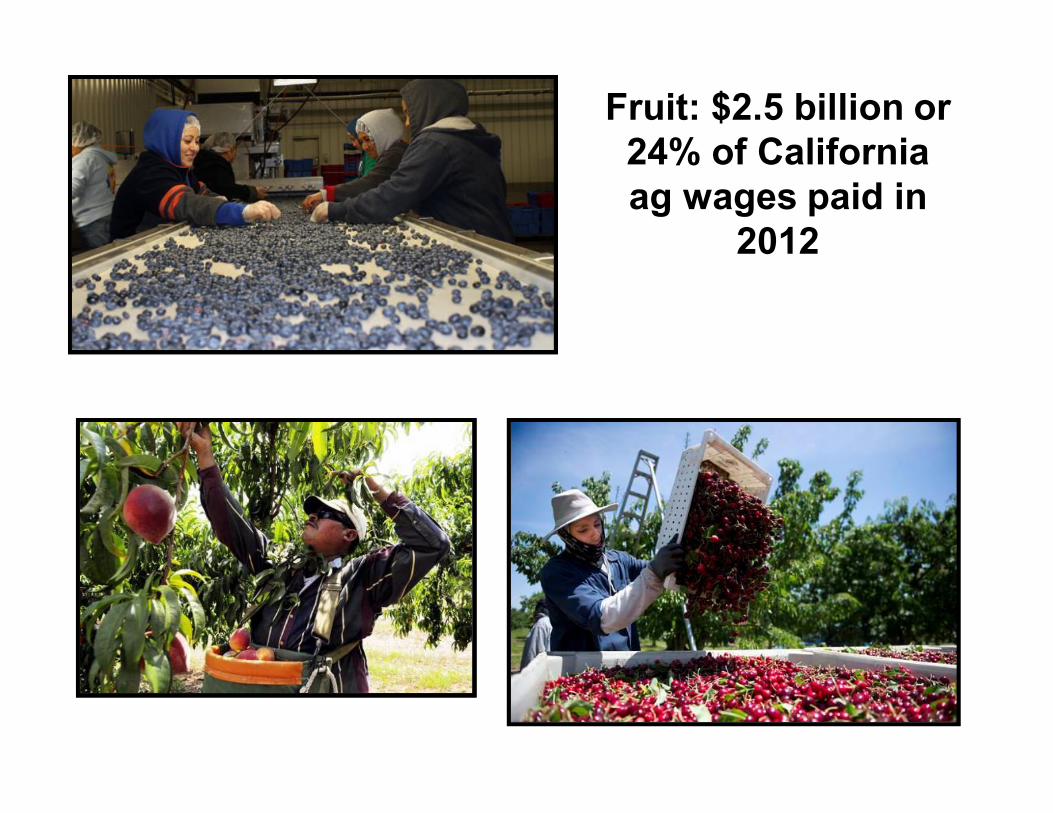
Fruit: $2.5 billion or 24% of California ag wages paid in
2012
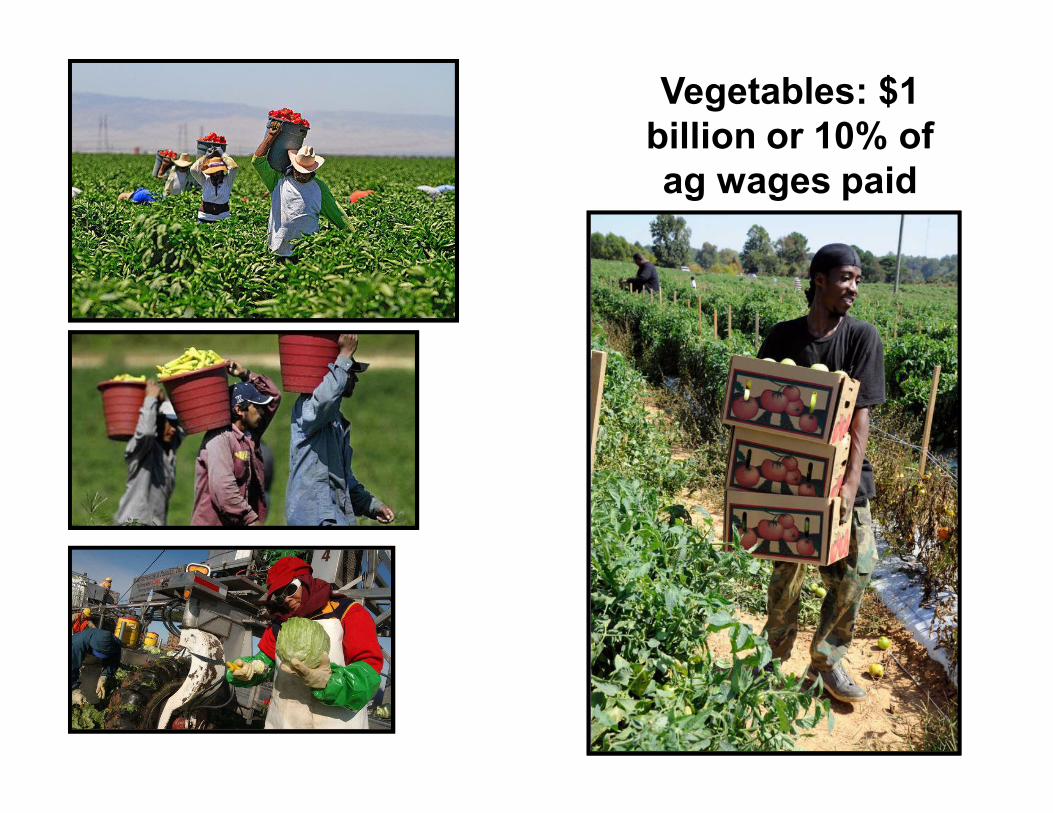
Vegetables: $1 billion or 10% of ag wages paid
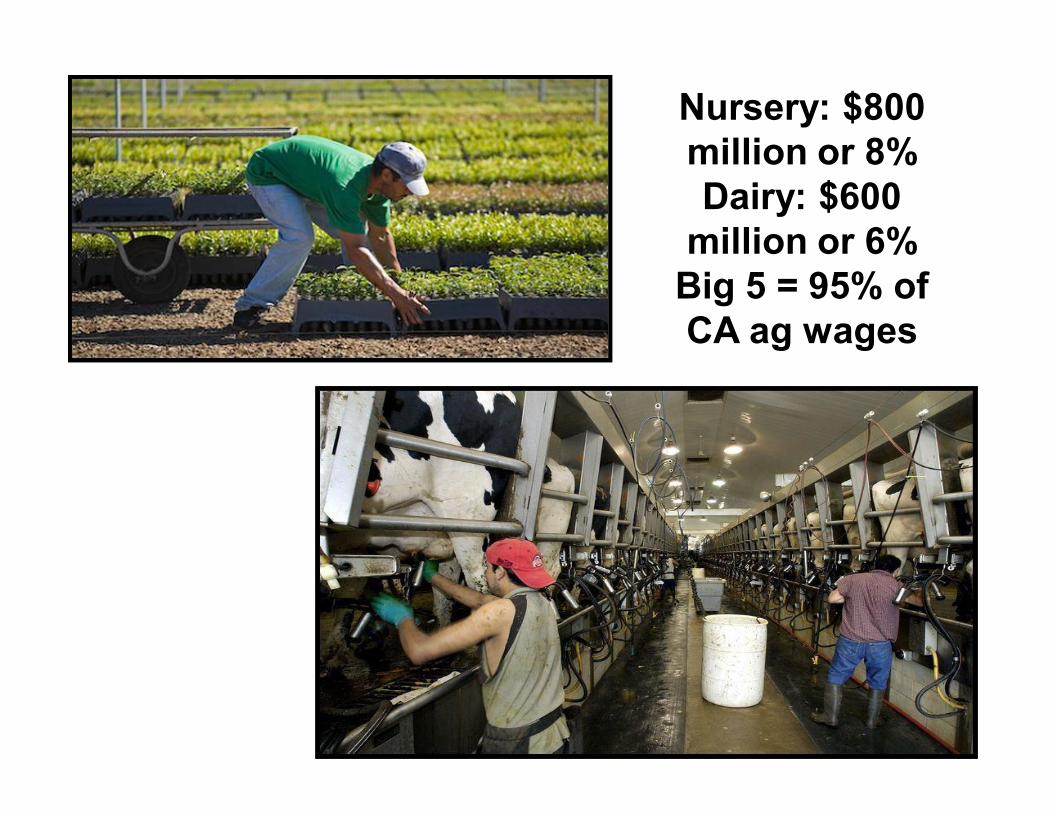
Nursery: $800 million or 8%Dairy: $600
million or 6%Big 5 = 95% of CA ag wages
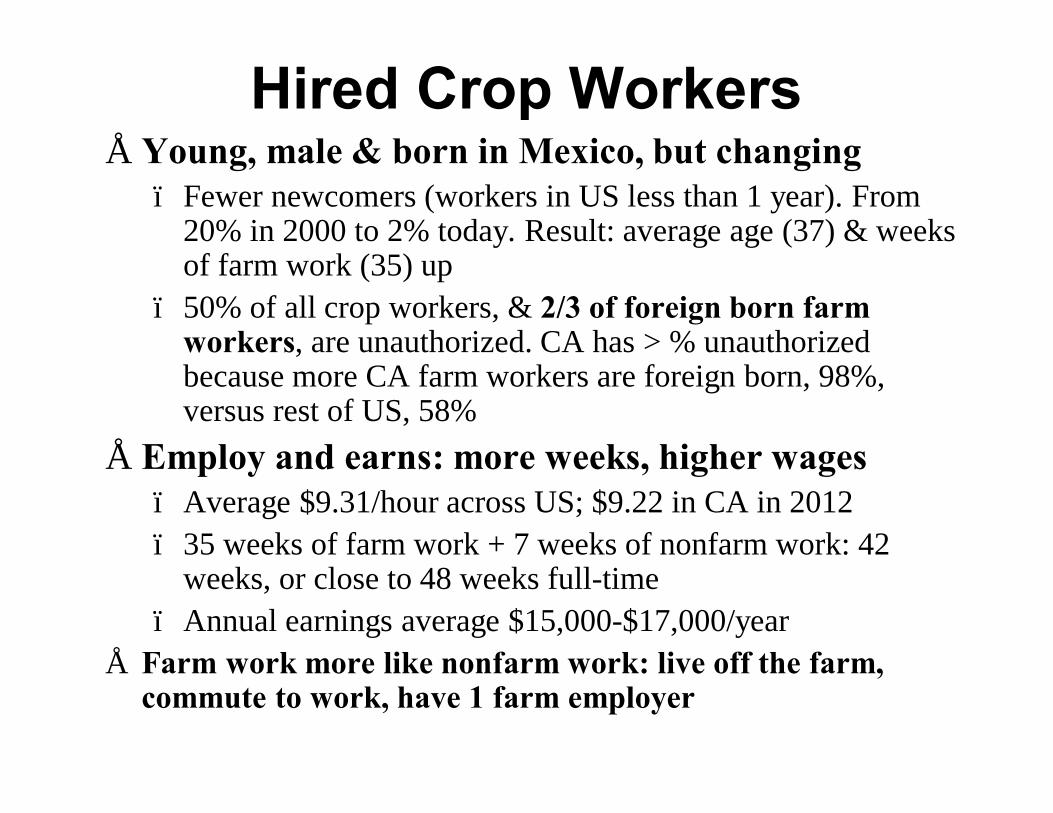
Hired Crop Workers• Young, male & born in Mexico, but changing
– Fewer newcomers (workers in US less than 1 year). From 20% in 2000 to 2% today. Result: average age (37) & weeks of farm work (35) up
– 50% of all crop workers, & 2/3 of foreign born farm workers, are unauthorized. CA has > % unauthorized because more CA farm workers are foreign born, 98%, versus rest of US, 58%
• Employ and earns: more weeks, higher wages– Average $9.31/hour across US; $9.22 in CA in 2012– 35 weeks of farm work + 7 weeks of nonfarm work: 42
weeks, or close to 48 weeks full-time – Annual earnings average $15,000-$17,000/year
• Farm work more like nonfarm work: live off the farm, commute to work, have 1 farm employer
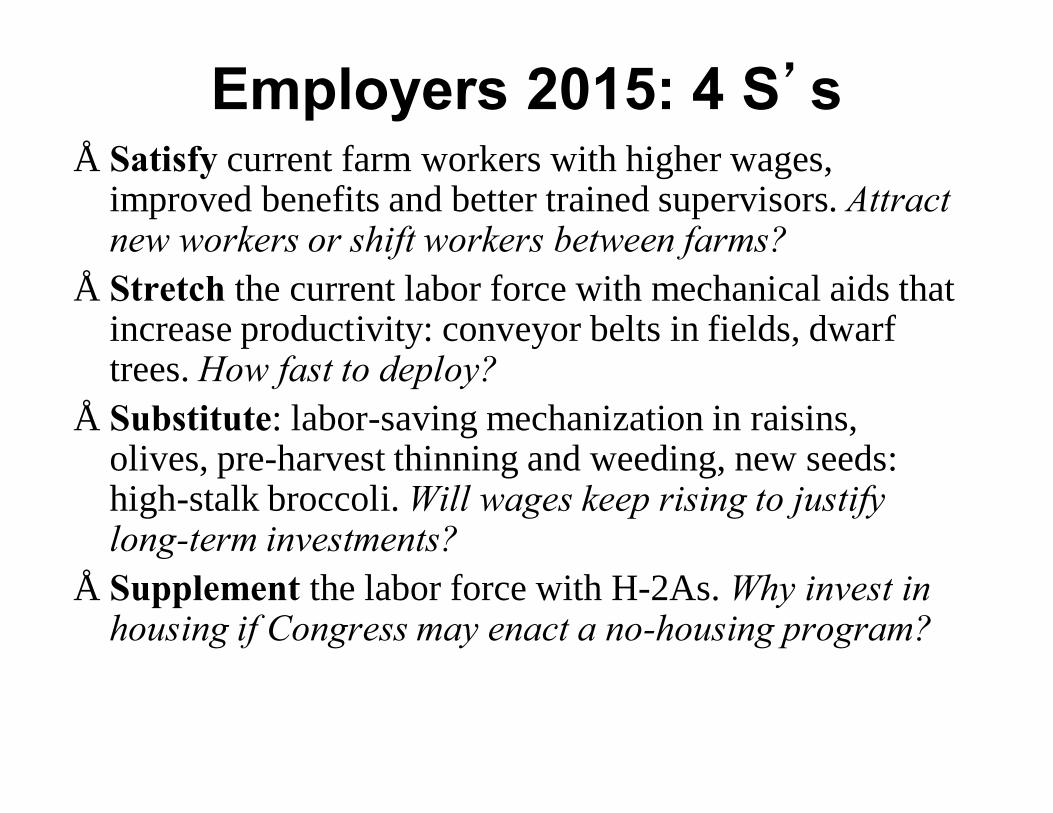
Employers 2015: 4 S’s• Satisfy current farm workers with higher wages,
improved benefits and better trained supervisors. Attract new workers or shift workers between farms?
• Stretch the current labor force with mechanical aids that increase productivity: conveyor belts in fields, dwarf trees. How fast to deploy?
• Substitute: labor-saving mechanization in raisins, olives, pre-harvest thinning and weeding, new seeds: high-stalk broccoli. Will wages keep rising to justify long-term investments?
• Supplement the labor force with H-2As. Why invest in housing if Congress may enact a no-housing program?
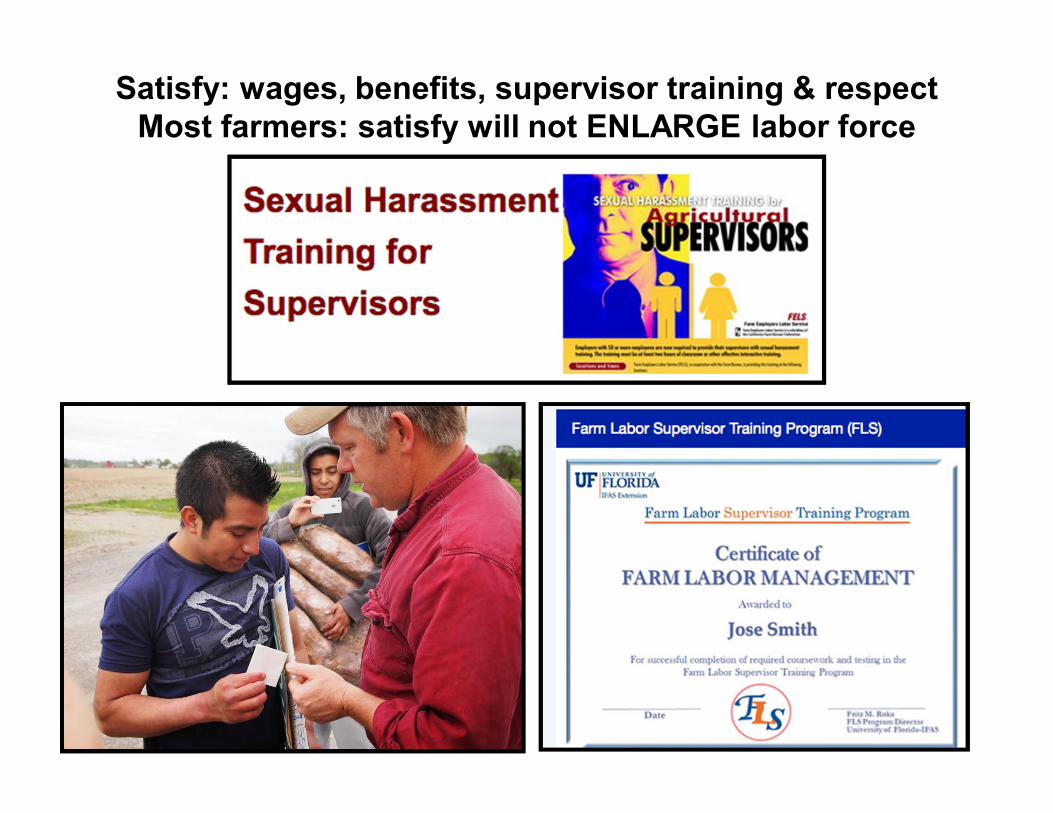
Satisfy: wages, benefits, supervisor training & respectMost farmers: satisfy will not ENLARGE labor force
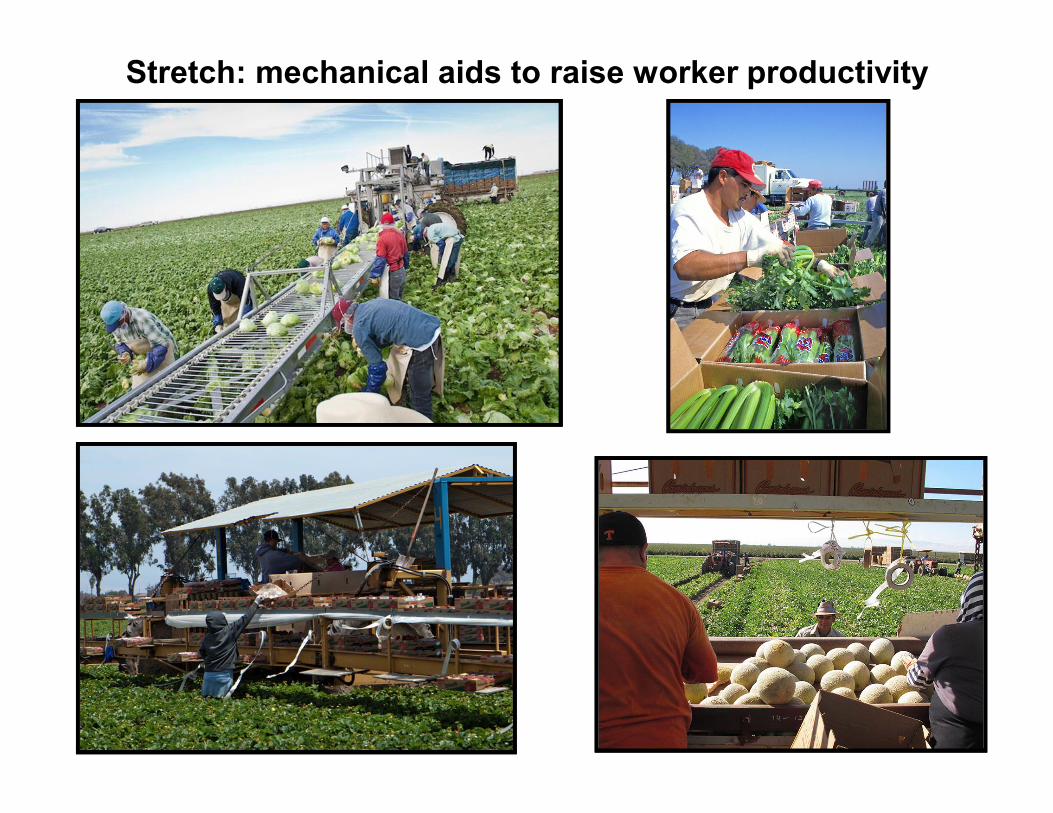
Stretch: mechanical aids to raise worker productivity
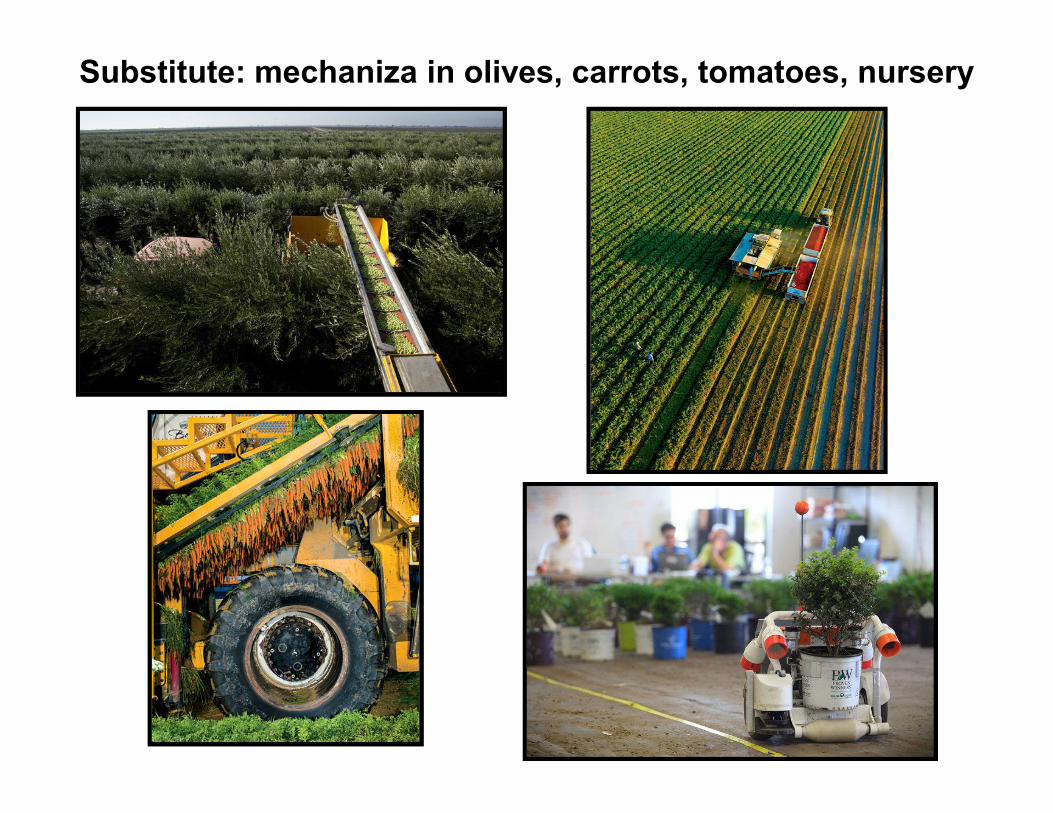
Substitute: mechaniza in olives, carrots, tomatoes, nursery
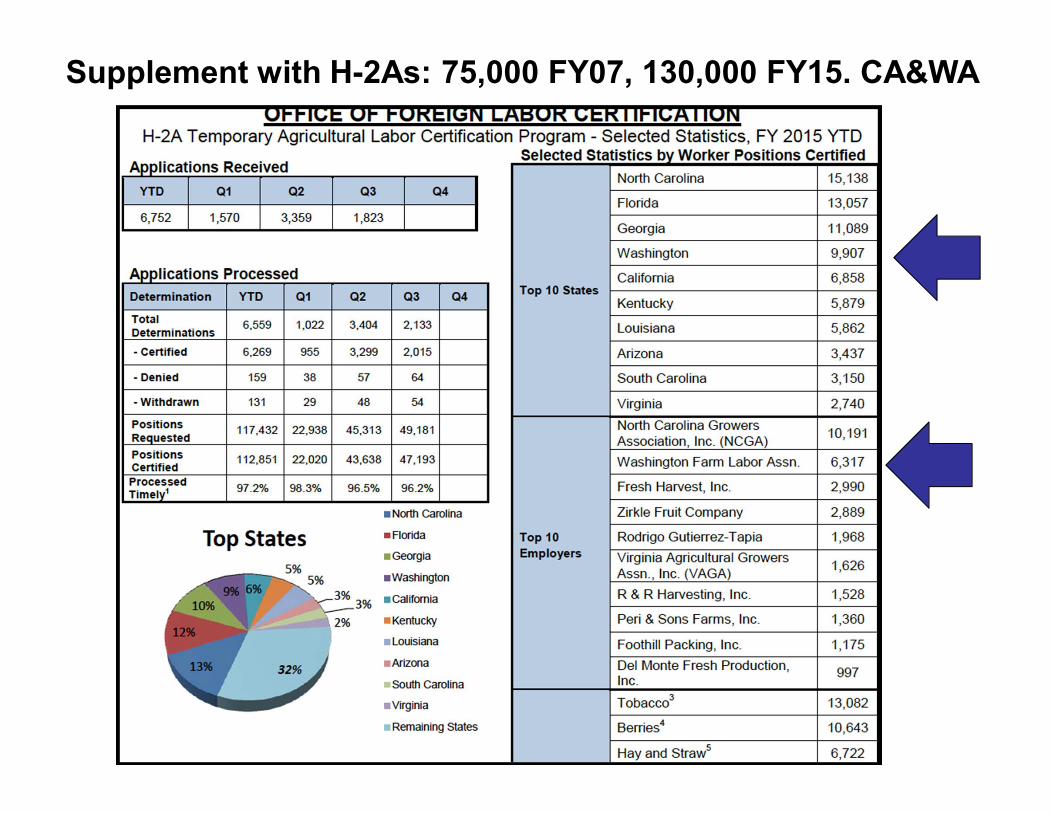
Supplement with H-2As: 75,000 FY07, 130,000 FY15. CA&WA
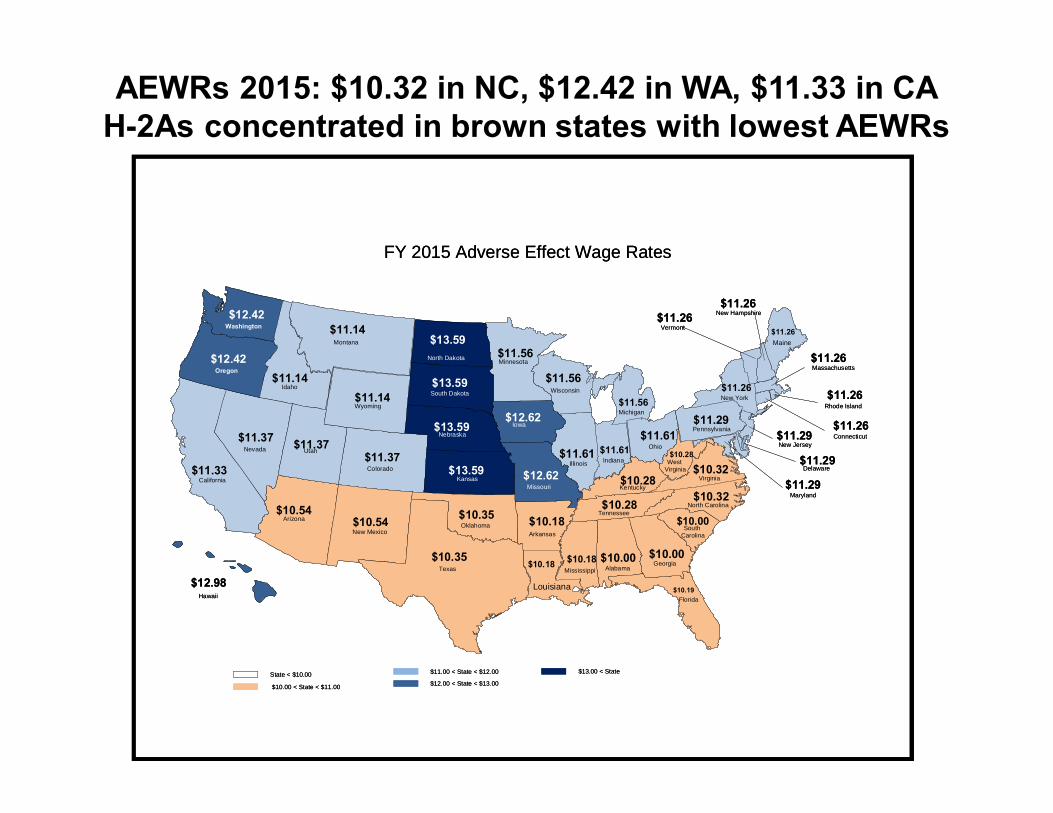
AEWRs 2015: $10.32 in NC, $12.42 in WA, $11.33 in CAH-2As concentrated in brown states with lowest AEWRs
FY 2015 Adverse Effect Wage Rates
!!
$10.28 West
Virginia
$11.26 Rhode Island
$11.29 Delaware
$11.61 Indiana
$12.42 Oregon
$11.56 Wisconsin
$13.59 Nebraska
$12.62 Missouri
$11.29 Pennsylvania
$11.26 New Hampshire
$11.61 Illinois
$12.62 Iowa
$11.56 Minnesota
$10.54 New Mexico
$10.00 Alabama
$11.26 Vermont
$11.29 New Jersey
$11.14 Wyoming
$12.98 Hawaii
$13.59 South Dakota
$11.26 Connecticut
$10.35 Oklahoma
$11.14 Montana
$11.26 Maine $13.59
North Dakota $11.26 Massachusetts
$11.29 Maryland
$13.59 Kansas
$12.42 Washington
$11.37
Utah $11.37 Colorado
$11.61 Ohio
$10.54 Arizona
$11.37 Nevada
$10.00 South
Carolina
$10.35 Texas
$11.14 Idaho
$10.18 Mississippi
$10.28 Tennessee
$10.19 Florida
$11.33 California
$10.18 Arkansas
$11.26 New York
$10.28 Kentucky
$10.18
Louisiana
$10.32 Virginia
$10.00 Georgia
$10.32 North Carolina
$11.56 Michigan
$10.00 < State < $11.00
State < $10.00 $11.00 < State < $12.00
$12.00 < State < $13.00
$13.00 < State
WA H-2As: 4,400 in 2012; 9,000 in 2014• H-2A program: employers must (1) try to recruit US
workers, (2) provide housing, (3) pay AEWR • WFLA: employer association = co-employer of H-2As.
Shift H-2As between employers– WA: direct hires, easier to build & operate housing– Saddle labor demand: June-July peak for cherries & Sept-Oct
apples; average farm employment of 88,000, or ¼ average of California
• 2014 Apples: 140 million 40-lb boxes (130 mil in 2012). Pickers average 6,000 pounds or 150 boxes/day for 65 days. Perhaps 20,000 to 25,000, & H-2A = up to half of apple pickers (not all apple pickers are H-2A, but almost all H-2As pick apples)
• Spring 2015: destroy $100 million worth of apples
CA H-2As: 3,000 in 2012, 6,000 in 2014 • CA: many vegetable firms operate year-round. Leafy
green vegetables in Yuma, SJV, & Salinas– Border labor force is legal– Bring H-2As to Salinas: move from motels to FW housing?
(T&A: $8 million for housing for 800 workers in Spreckels, $10,000 per bed)
– Largest CA H-2A user: Sierra-Cascade strawberry nursery (1,300 H-2As in Tulelake)
• H-2A expansion: led by coastal vegetable growers, not SJV fruit industry. Half of CA farm labor is in SJV, where fruit industry is concentrated, & there is less grower-shipper integration
• Some shippers: increase imports, esp of Mexican berries
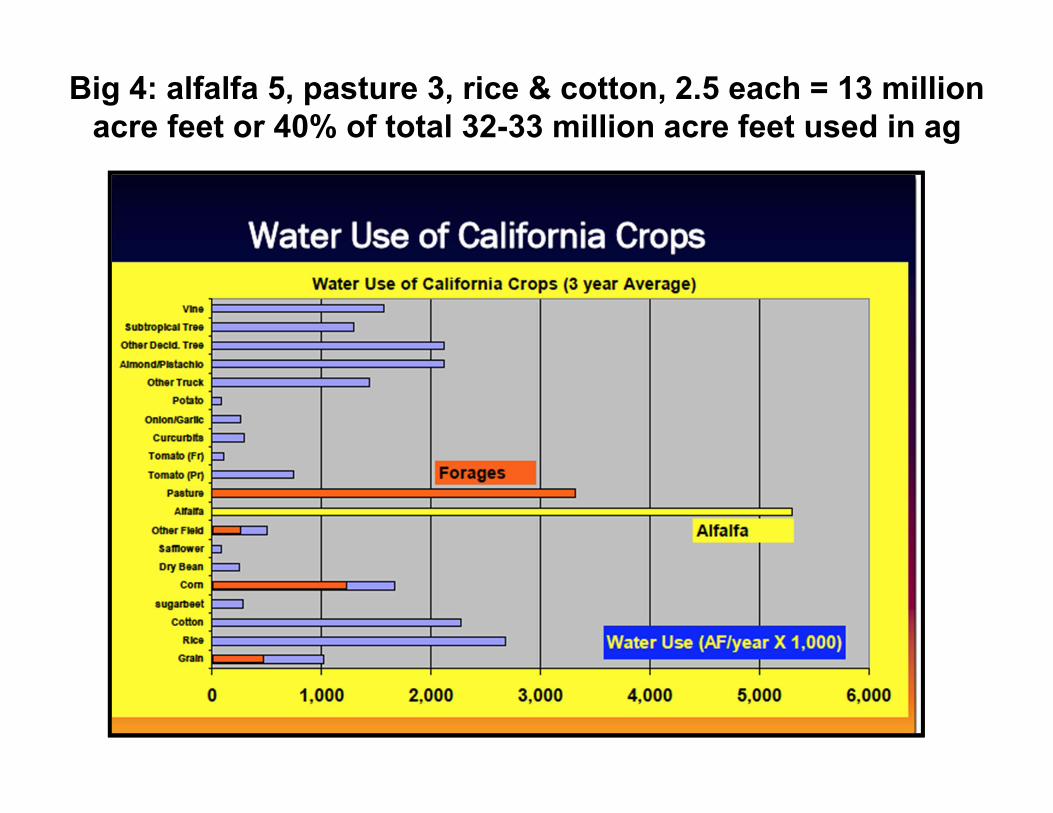
Big 4: alfalfa 5, pasture 3, rice & cotton, 2.5 each = 13 million acre feet or 40% of total 32-33 million acre feet used in ag
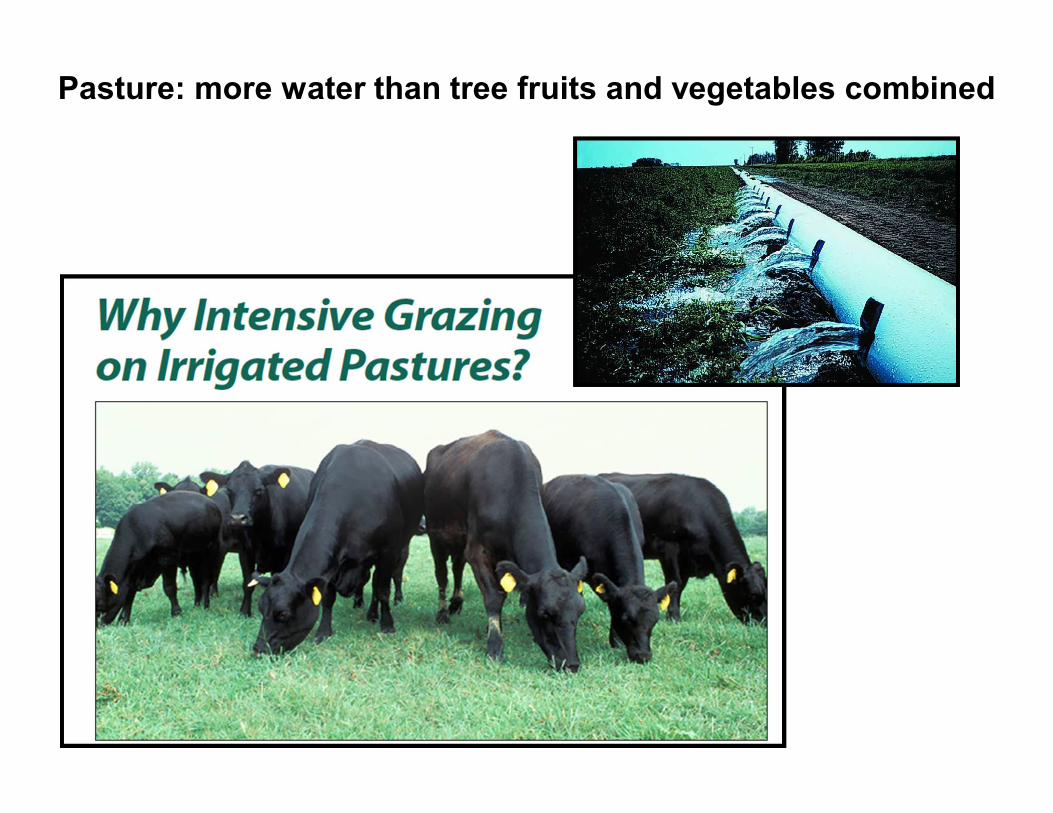
Pasture: more water than tree fruits and vegetables combined
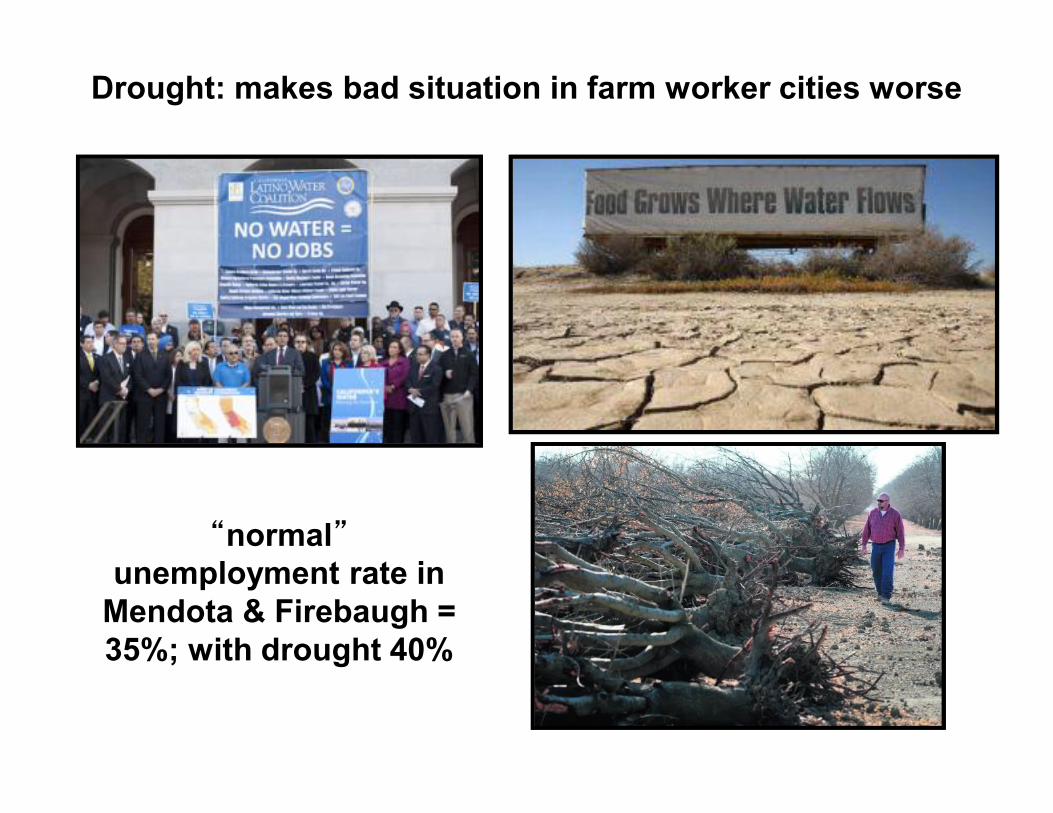
Drought: makes bad situation in farm worker cities worse
“normal”unemployment rate in
Mendota & Firebaugh = 35%; with drought 40%
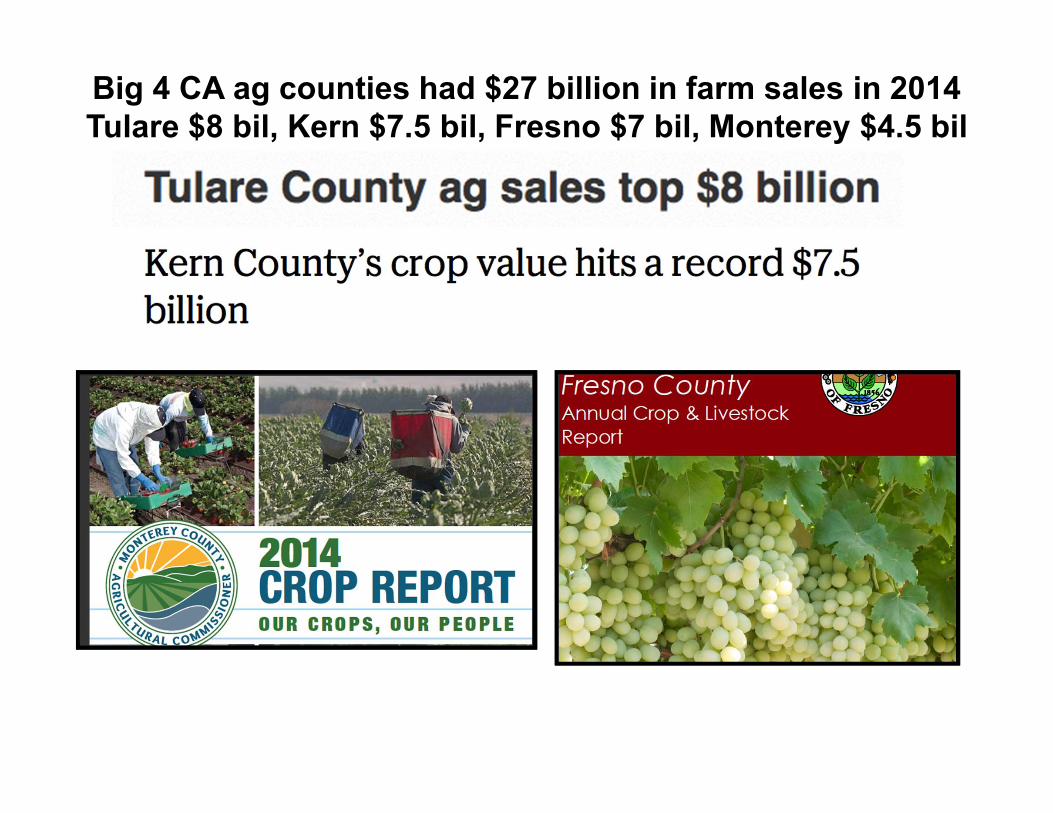
Big 4 CA ag counties had $27 billion in farm sales in 2014Tulare $8 bil, Kern $7.5 bil, Fresno $7 bil, Monterey $4.5 bil
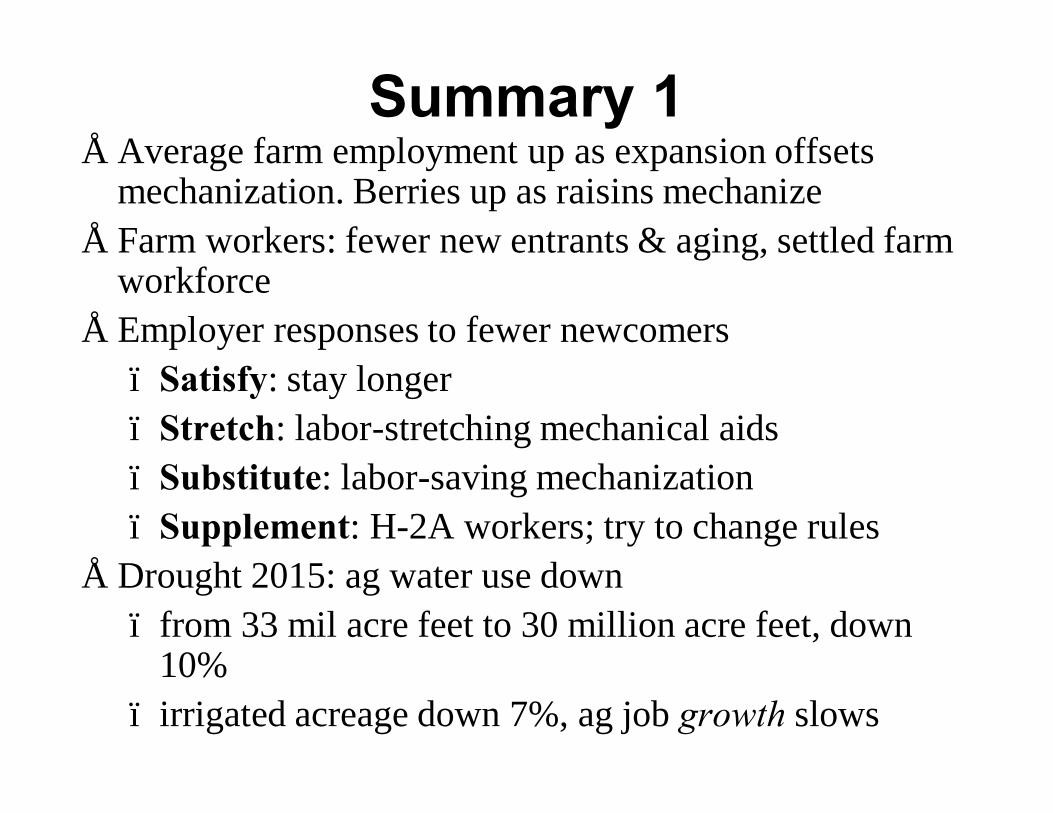
Summary 1• Average farm employment up as expansion offsets
mechanization. Berries up as raisins mechanize• Farm workers: fewer new entrants & aging, settled farm
workforce• Employer responses to fewer newcomers
– Satisfy: stay longer– Stretch: labor-stretching mechanical aids– Substitute: labor-saving mechanization– Supplement: H-2A workers; try to change rules
• Drought 2015: ag water use down – from 33 mil acre feet to 30 million acre feet, down
10%– irrigated acreage down 7%, ag job growth slows
Summary 2• Farming for workers versus farming for yield
– Re-organize work to attract & keep workers versus maximize production & assume seasonal workers will be available
– Change crop characteristics to make farm work easier, talk-stalk broccoli, Frescada lettuce, brilliant White Cauliflower
• H-2A = “loyal workers.” H-2As do not switch employers to earn 5 cents more. E-Z H-2A could “lock-in” labor supply at cost of transport, housing etc
• Which of the 4 S’s takes priority? What variance by commodity and area?
Recommended