Fannie Mae Quarterly Financial SupplementQ2 2018
August 2, 2018
© 2018 Fannie Mae. Trademarks of Fannie Mae.
Some of the terms and other information in this presentation are defined and discussed more fully in Fannie Mae’s Form 10-Qfor the quarter ended June 30, 2018 (“Q2 2018 10-Q”) and Form 10-K for the year ended December 31, 2017 (“2017 Form10-K”). This presentation should be reviewed together with the Q2 2018 10-Q and the 2017 Form 10-K, which are available atwww.fanniemae.com in the “About Us—Investor Relations—SEC Filings” section. Information on or available through thecompany's website is not part of this supplement.
Some of the information in this presentation is based upon information from third-party sources such as sellers and servicers ofmortgage loans. Although we generally consider this information reliable, we do not independently verify all reportedinformation.
Due to rounding, amounts reported in this presentation may not add to totals indicated (or 100%).
Unless otherwise indicated, data labeled as "YTD 2018" is as of June 30, 2018 or for the first six months of 2018. Data for prioryears is as of December 31 or for the full year indicated.
Note references are to endnotes, appearing on pages 22 to 24.
Terms used in presentationCAS: Connecticut Avenue SecuritiesCIRT™: Credit Insurance Risk Transfer™CRT: credit risk transferDTI ratio: Debt-to-income ratioDUS : Fannie Mae’s Delegated Underwriting and Servicing programGDP: U.S. gross domestic productHARP : Home Affordable Refinance Program, which allows eligible Fannie Mae borrowers with high LTV ratio loans torefinance into more sustainable loansLTV ratio: loan-to-value ratioMSA: metropolitan statistical areaMTMLTV ratio: mark-to-market loan-to-value ratioOLTV ratio: origination loan-to-value ratioRefi Plus™: our Refi Plus initiative, which offers refinancing flexibility to eligible Fannie Mae borrowersREO: real estate ownedTCCA: Temporary Payroll Tax Cut Continuation Act of 2011UPB: unpaid principal balance
§
§
§
§
§§
© 2018 Fannie Mae. Trademarks of Fannie Mae. Q2 2018 Financial Supplement 1
®
®
®

Table of Contents
Corporate Financial Highlights
Market Liquidity
Key Market Economic Indicators
Treasury Draws and Dividend Payments 7
6
5
4
Financial Overview
Single-Family Highlights
Certain Credit Characteristics of Single-Family Loan Acquisitions
Certain Credit Characteristics of Single-Family Conventional Guaranty Book of Business
Single-Family Credit Risk Transfer
Single-Family Problem Loan Statistics
Credit Loss Concentration of Single-Family Conventional Guaranty Book of Business
Single-Family Cumulative Default Rates 15
14
13
12
11
10
9
Single-Family Business
Multifamily Highlights
Certain Credit Characteristics of Multifamily Acquisitions
Certain Credit Characteristics of Multifamily Guaranty Book of Business
Multifamily Serious Delinquency Rates and Credit Losses 20
19
18
17
Multifamily Business
Financial Overview Endnotes
Single-Family Business Endnotes
Multifamily Business Endnotes 24
23
22
Endnotes
© 2018 Fannie Mae. Trademarks of Fannie Mae. Q2 2018 Financial Supplement 2

Financial Overview
© 2018 Fannie Mae. Trademarks of Fannie Mae. Q2 2018 Financial Supplement 3

2Q18 1Q18 Variance
Net interest income
Fee and other income
Net revenues
Investment gains, net
Fair value gains, net
Administrative expenses
Credit-related income
Benefit for credit losses
Foreclosed property expense
Total credit-related income
Temporary Payroll Tax Cut Continuation Act of 2011(TCCA) fees
Other expenses, net
Income before federal income taxes
Provision for federal income taxes
Net Income
Other comprehensive income (loss)
Total comprehensive income $521
325
$196
(5)
201
(163)
(8)
1,102
23
1,079
(5)
(816)
27
64
(81)
$145
$3,938
(323)
$4,261
(1,131)
5,392
(203)
(557)
55
(162)
217
(750)
1,045
250
5,552
320
$5,232
$4,459
2
$4,457
(1,136)
5,593
(366)
(565)
1,157
(139)
1,296
(755)
229
277
5,616
239
$5,377
2014 2015 2016 2017 YTD 20180%
20%
40%
60%
80%
100%
% Net Interest Income
$0
$200
$400
$600
$800
$1,000
Retained Mortgage Portfolio ($) Billions
$272.4
$413.3$345.1
$230.8 $225.8
Net interest income from retained mortgage portfolio and other activities
Net interest income from guaranty fees and other consolidated trust income
Retained mortgage portfolio at end of period
Key Highlights
Summary of Q2 2018 Financial Results Sources of Net Interest Income and Retained MortgagePortfolio Balance
Corporate Financial Highlights
© 2018 Fannie Mae. Trademarks of Fannie Mae. Q2 2018 Financial Supplement 4
_______________________________
_______________________________
_______________________________
_______________________________
_______________________________
_______________________________
Net income
Net revenues
(1)
Total comprehensive income
§ Fannie Mae’s net income was $4.5 billion in Q2 2018 compared to net income of $4.3 billion in Q1 2018.
§ The increase in net income was driven primarily by an increase in credit- related income due to the redesignation of loans from held-for-investment to held-for-sale, as well as other factors, including an improvement in home prices during the quarter. The increase in net income was partially offset by lower fair value gains in Q2 2018 compared with Q1 2018.
§ Fannie Mae’s pre-tax income was $5.6 billion for Q2 2018 and $5.4 billion for Q1 2018, reflecting the strength of the company’s underlying business fundamentals.
_______________________________

2014 2015 2016 2017 YTD 20180.0M
0.5M
1.0M
1.5M
2.0M
2.5M
3.0M
0.8M
0.6M
0.9M
0.6M
0.9M
0.4M
0.4M
0.3M
0.7M
1.0M
1.0M
1.4M
1.2M
1.2M
1.1M
Rental Units
Home Purchases (Loans)
Mortgage Refinancings (Loans)
550KHome Purchases
411KRefinancings
342KRental Units
Key Highlights:Liquidity Provided
Fannie Mae provided $249 billion in liquidity to the mortgage market in the first halfof 2018, through its purchases of loans and guarantees of loans and securities, whichenabled the financing of:
Providing Liquidity to the Mortgage Market
Market Liquidity
© 2018 Fannie Mae. Trademarks of Fannie Mae. Q2 2018 Financial Supplement 5

2014 2015 2016 2017 YTD 20180.0%
2.0%
4.0%
Rate (as of period end)
2.83% 3.00%
3.60%
0.90%1.18% 1.45%
2.08%
2.79%2.17%2.41%
2.86%3.13%
2.45%
3.00%
2.27%
2014 2015 2016 2017 YTD 20180.0%
2.0%
4.0%
6.0%
Home Price Growth 4.6%
4.2%
5.7% 5.7%
4.1%
2014 2015 2016 2017 YTD 20180.0%
2.0%
4.0%
6.0%
Rate (as of period end)
5.60%
4.10%
4.00%2.40% 2.30%2.60%
4.70%4.10%
5.00%
1.50%
MN
NM
MO
WA
WV
MAWY
NH
ME
OH
MTND
MS
OR
OK
NV
NE
GA
NC
NY
AR
CO
TN
UT
WI
VAKYCA
TX
MI
SD
PA
LA
NJ
AL
AZ
KS
FL
SC
IN
ID
IA
IL
Benchmark Interest Rates Single-Family Home Price Growth Rate U.S. GDP Growth Rate andUnemployment Rate
One Year Home Price Change as of Q2 2018United States 5.7%
Key Market Economic Indicators
HI
AK
State Home PriceGrowth Rate
Share of FannieMae Single-FamilyConventionalGuaranty Book
CATXFLNYILWANJVACOPA 3.0%
3.0%3.4%3.6%3.7%3.7%5.0%5.7%6.3%19.5%
3.9%7.8%3.5%3.6%11.3%3.2%5.9%7.1%4.3%9.3%
Top 10 States by UPB
© 2018 Fannie Mae. Trademarks of Fannie Mae. Q2 2018 Financial Supplement 6
State Growth Rate0 to 4.9%
5 to 9.9%
10% and above
(2)
(2)
(2)
(3)
10-year Treasury rate
2-year swap rate
30-year Fannie MBS par coupon rate
Change based on Fannie Mae national home price index U.S. GDP Growth Rate, annualized for most recent period
U.S. Unemployment Rate

Draws fromTreasury
Dividend paymentsto Treasury
Draws fromTreasury
Dividend paymentsto Treasury
Draws fromTreasury
Dividend paymentsto Treasury
Draws fromTreasury
Dividend paymentsto Treasury
Draws fromTreasury
Dividend paymentsto Treasury
$0.0
$20.0
$40.0
$60.0
$80.0
$100.0
$120.0
$140.0
$160.0
($) Billions
$144.8
$116.1
$0.0
$9.6$12.0
$3.7$0.0 $0.9
$167.3
$119.8
Draws from Treasury Dividend payments to Treasury
Treasury Draws and Dividend Payments
Treasury Draws and Dividend Payments: 2008 - YTD 2018
2008-2015 2016 2017 YTD 2018 Total
© 2018 Fannie Mae. Trademarks of Fannie Mae. Q2 2018 Financial Supplement 7
(5)
(4)

Single-Family Business
© 2018 Fannie Mae. Trademarks of Fannie Mae. Q2 2018 Financial Supplement 8

Private-label securities5%
Freddie Mac27%
Fannie Mae36%
Ginnie Mae32%
Q2 2017 Q3 2017 Q4 2017 Q1 2018 Q2 2018$0
$50
$100
$150
$200
UPB ($) Billions
0
10
20
30
40
50
Basis Points
$60$84
$50
$69
$39$59
$52$47
$74 $72
47.1
47.148.0
45.4
49.0
$121$134
$128
$112 $110
Q2 2017 Q3 2017 Q4 2017 Q1 2018 Q2 2018$0
$1,000
$2,000
$3,000
$4,000
UPB ($) Billions
0
10
20
30
40
50
Basis Points
$2,850 $2,870$2,823 $2,835 $2,877
42.642.4 42.842.1 43.0
Refinance
Purchase
Average charged guaranty fee on new acquisitions, net of TCCA (bps)
Average charged guaranty fee on conventional guaranty book, net of TCCA (bps)
Average UPB outstanding of Single-Family conventional guaranty book
Key HighlightsQ2 2018 Market Share: New Single-Family Mortgage-Related Securities Issuances
§ Single-Family net income was $4.0 billion in Q2 2018, driven by net interest income derived from the loans underlying Fannie Mae MBS in consolidated trusts, which primarily generate income through guaranty fees.
§ Credit-related income in Q2 2018 was $1.2 billion, due to the redesignation of loans from held-for-investment to held-for- sale, as well as other factors, including an improvement in home prices during the quarter.
§ The single-family guaranty book of business continued to grow in Q2 2018, while the average charged guaranty fee (net of TCCA fees) on the single-family guaranty book remained relatively flat in the second quarter compared to the prior quarter at 43 basis points.
Single-Family Conventional Loan Acquisitions Conventional Guaranty Book of Business
Single-Family HighlightsQ2 2018
$4,723MNet interest income
$278MFair value gains,
net
$252MInvestment gains, net
$3,953MNet income
$1,159MCredit-related income
© 2018 Fannie Mae. Trademarks of Fannie Mae. Q2 2018 Financial Supplement 9
(2)
(2)
(1)(1)

Q2 2017 Q3 2017 Q4 2017 Full Year 2017 Q1 2018 Q2 2018Total Unpaid Principal Balance (UPB) ($B)
Total UPB excluding Refi Plus ($B)Weighted Average Origination LTV (OLTV) RatioOrigination LTV Ratio > 90%
Weighted Average FICO Credit ScoreFICO Credit Score < 660DTI Ratio > 45%
Fixed-rateCondo/Co-op 10%
98%26%6%
74323%77%
$109.1$110.5
9%
98%23%6%
74319%75%
$110.3$112.2
10%
97%10%6%
74518%75%
$487.7$501.8
10%
98%19%6%
74318%76%
$125.2$127.9
10%
97%8%5%
74520%76%
$131.5$134.2
10%
97%7%5%
74519%76%
$117.6$121.2
Loans withOLTV
Ratio > 90%
Loans withFICO CreditScore < 660
Loans withDTI
Ratio > 45%
10%
98%100%7%
73422%77%
$53.7$53.7
7%
99%30%100%
64116%74%
$12.4$13.2
9%
100%26%5%
738100%96%
$45.7$46.1
2014 2015 2016 2017 YTD 20180%
20%
40%
60%
80%
100%
Weighted Average OLTV Ratio
0%
10%
20%
30%
Origination LTV > 90%
76%74%75% 75%77%
18%18%
21%
16% 15%
2014 2015 2016 2017 YTD 20180%
20%
40%
60%
80%
100%
Share of Acquisitions
20%
20%
30%
44%
24%22%
33%
56% 59%45%
52%
16%
16%19% 19%
12%
OLTV > 90%
Weighted Average OLTV Ratio
2014 2015 2016 2017 YTD 20180
200
400
600
800
Weighted Average FICO Credit Score
0%
2%
4%
6%
8%
10%
12%
14%
FICO Credit Score < 660
748 750744 743745
6%5%6%
4%
7%
FICO Credit Score < 660
Weighted Average FICO Credit Score
Certain Credit Characteristics of Single-Family Conventional Loans by Acquisition Period
YTD 2018 AcquisitionCredit Profile by
Certain Product Features
OriginationLoan-to-Value Ratio FICO Credit Score Acquisitions by Loan Purpose
Certain Credit Characteristics of Single-Family Loan Acquisitions
Refi Plus including HARP
Refinance (excluding cash-out & Refi Plus)
Cash-out refinance
Purchase
© 2018 Fannie Mae. Trademarks of Fannie Mae. Q2 2018 Financial Supplement 10
(3)
(3)
(3)
(3)
®
(4)
(4)(1)Categories are not mutually exclusive

OverallBook
2004 &Earlier 2005-2008 2009-2015 2016 2017 2018
Total Unpaid Principal Balance (UPB) ($B)
Average Unpaid Principal Balance
Share of Single-Family Conventional Guaranty Book
Serious Delinquency Rate
Weighted Average Origination LTV Ratio
Origination LTV Ratio > 90%
Weighted Average Mark-to-Market LTV Ratio
Weighted Average FICO Credit Score
Share of Loans with Credit Enhancement
Fixed-rate 98%
38%
742
75%
21%
77%
0.01%
6%
$229,697
$171.0
98%
61%
744
69%
19%
76%
0.19%
16%
$219,637
$453.1
99%
64%
751
61%
16%
74%
0.32%
17%
$216,738
$490.1
98%
37%
752
49%
17%
75%
0.50%
53%
$159,360
$1,516.1
68%
19%
695
64%
15%
76%
5.54%
6%
$130,031
$161.9
79%
7%
700
39%
14%
74%
3.00%
3%
$70,246
$89.2
96%
44%
745
56%
17%
75%
0.97%
100%
$168,532
$2,881.4
Refi PlusIncluding HARP Alt-A
Loans withFICO CreditScore < 660
Origination LTVRatio > 90%
98%
74%
733
76%
100%
101%
1.49%
17%
$176,653
$494.0
91%
33%
628
61%
24%
79%
4.23%
7%
$133,899
$197.4
71%
8%
709
60%
18%
79%
4.21%
2%
$139,123
$65.4
99%
11%
730
54%
38%
86%
0.83%
12%
$136,830
$354.1
2014 2015 2016 2017 YTD 20180%
10%
20%
30%
40%
50%
60%
70%
Weighted Average MTMLTV
0%
2%
4%
6%
8%
10%
% MTMLTV > 100%
60%64%
62%58%
56%
2%
3%
5%
1%1%
2014 2015 2016 2017 YTD 20180
200
400
600
800
Weighted Average FICO Credit Score
0%
5%
10%
15%
20%
% FICO Credit Score < 660
744 744 745 745 745
7%8%
7%8%
7%
Weighted Average Mark-To-MarketLoan-to-Value (MTMLTV) Ratio FICO Credit Score
2014 2015 2016 2017 YTD 20180.0%
2.0%
4.0%
6.0%
8.0%
Serious Delinquency Rate
6.39%
1.20%
6.55%
7.60%
8.39%
5.54%
1.24%1.55%
1.89%
3.06% 3.00%2.82%
0.41%0.53%0.97%
0.36% 0.36%0.35%
3.26% 3.28%
Serious Delinquency Rate by Vintage
Origination Year Certain Product Features
% FICO Credit Score < 660
Weighted Average FICO Credit Score
% MTMLTV > 100%
Weighted Average MTMLTV
Certain Credit Characteristics of Single-Family Conventional Guaranty Book of BusinessCertain Credit Characteristics of Single-Family Conventional Guaranty Book of Business by Origination Year and Product Features
Total single-family conventional guaranty book of business
2004 and Prior
2005-2008
2009-2018
As of June 30, 2018Categories are not mutually exclusive
© 2018 Fannie Mae. Trademarks of Fannie Mae. Q2 2018 Financial Supplement 11
(5)
(6)
(8)
(3)
(10)(3)
(9)
(7)
(7)
(3)(1)

2014 2015 2016 2017 YTD 2018$0
$500
$1,000
$1,500
UPB ($) Billions
0%
10%
20%
30%
40%
% Single-Family Conventional Guaranty Book
$1,026
$628
$250
$429
$92722%
15%
9%
32%
36%
% Single-family conventional guaranty book in a CRT transaction
UPB outstanding of loans in a CRT transaction
Single-Family Loans Included in Credit Risk TransferTransactions, Balance of Covered Loans
Single-Family Credit Risk TransferSingle-Family Loans with Credit Enhancement
Single-Family Credit Risk Transfer Issuance
2016
OutstandingUPB
Percent ofBook
Outstanding
2017
OutstandingUPB
Percent ofBook
Outstanding
YTD 2018
OutstandingUPB
Percent ofBook
Outstanding
Primary mortgage insurance & other
Connecticut Avenue Securities (CAS)
Credit Insurance Risk Transfer™ (CIRT™)
Lender risk-sharing
(Less: loans covered by multiple creditenhancements)
Total UPB of single-family loans with creditenhancement 33%
(8%)
1%
4%
18%
18%
$925B
($211B)
$23B
$101B
$503B
$509B
40%
(12%)
2%
6%
24%
20%
$1,158B
($335B)
$65B
$181B
$681B
$566B
44%
(12%)
3%
7%
26%
20%
$1,256B
($349B)
$86B
$202B
$738B
$580B
2013 2014 2015 2016 2017 YTD 2018$0
$100
$200
$300
$400
UPB ($) Billions
$240
$222
$265
$102
$103
$189
$40
$44
$32
$25
$76$27$32
$233 $239
$331
$410
$160
Lender risk-sharing Connecticut Avenue Securities Credit Insurance Risk Transfer
Credit Enhancement
© 2018 Fannie Mae. Trademarks of Fannie Mae. Q2 2018 Financial Supplement 12
___________________________________________________________________________________________
___________________________________________________________________________________________
(13)
(12)
(11)
(12)
(13)
®
NM NM
MN MN
MD MD
MO MO
WA WA
WV WV
MA MAWY WY
NH NH
ME ME
OH OH
MT MTND ND
MS MS
OR OR
OK OK
NV NV
NE NE
GA GA
NC NC
NY NY
DE DE
AR ARTN TN
CO COUT UT
WI WI
VA VAKY KYCA CA
TX TX
MI MI
SD SD
PA PA
LA LA
NJ NJ
AL AL
AZ AZ
KS KS
FL FL
SC SC
IN IN
ID ID
IA IA
IL IL
Less than 0.50% 0.50% to 0.99% 1.00% to 1.99% 2.00% to 2.99% 3.00% and Above
2014 2015 2016 2017 YTD 2018$0
$10
$20
$30
$40
UPB ($) Billions
0
50
100
150
200Number of Loan Workouts (Thousands)
$16.6 $14.6$14.4
$21.7
$6.6
$4.2
$9.7
$2.1$3.1 64.1K
103.5K 100.6K
122.3K
164.6K
$28.3
$20.7$17.5 $16.7
$10.3
2014 2015 2016 2017 YTD 20180K
20K
40K
60K
80K
100K
REO Ending Inventory
87K
57K
38K
26K22K
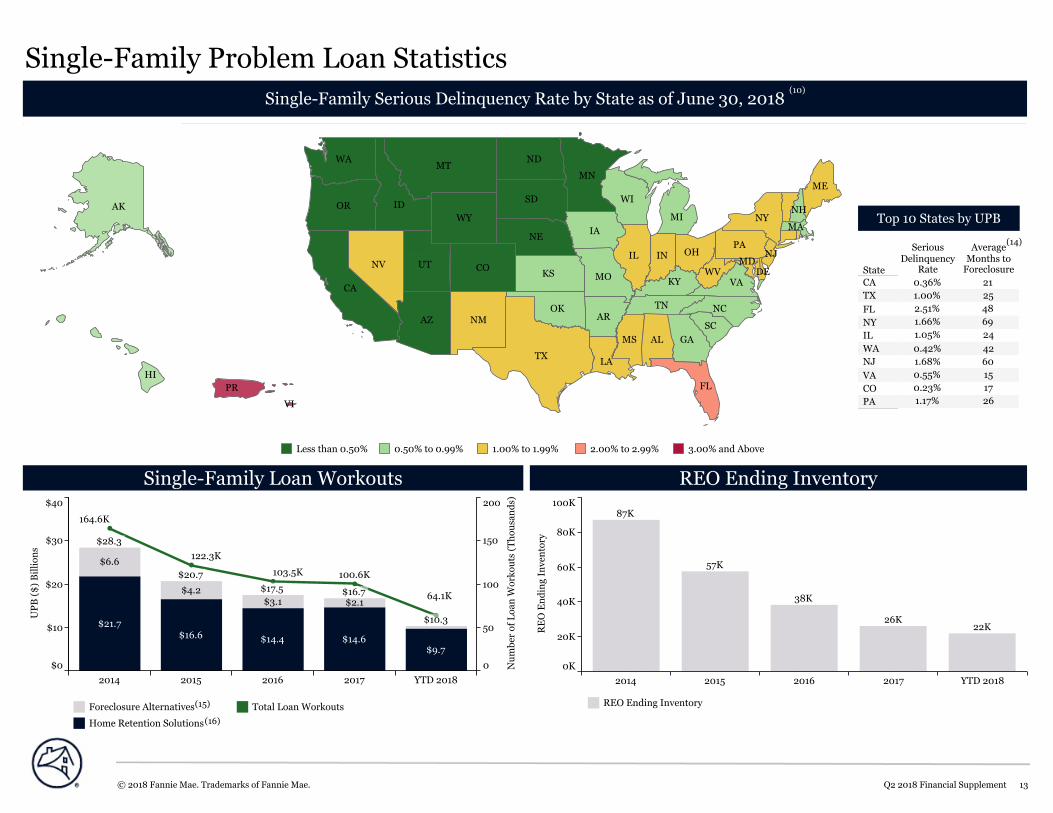
Single-Family Problem Loan StatisticsSingle-Family Serious Delinquency Rate by State as of June 30, 2018
Single-Family Loan Workouts REO Ending Inventory
REO Ending Inventory
AK AK
HI HI
PR
PR PR
VI VI
State
SeriousDelinquencyRate
AverageMonths toForeclosure
CATXFLNYILWANJVACOPA 26
171560422469482521
1.17%0.23%0.55%1.68%0.42%1.05%1.66%2.51%1.00%0.36%
Top 10 States by UPB
Foreclosure Alternatives
Home Retention Solutions
Total Loan Workouts
© 2018 Fannie Mae. Trademarks of Fannie Mae. Q2 2018 Financial Supplement 13
(15)
(16)
(10)
(14)
2014 2015 2016 2017 YTD 2018 2014 2015 2016 2017 YTD 2018
Alt-A
Interest Only
Origination LTV Ratio > 90%
FICO Credit Score < 660 and Origination LTV Ratio > 90%
FICO Credit Score < 660
Refi Plus including HARP 12.3%
6.9%
1.6%
17.1%
1.0%
2.3%
13.2%
7.0%
1.7%
16.7%
1.2%
2.5%
15.4%
7.3%
1.8%
16.4%
1.7%
3.1%
17.6%
7.8%
2.0%
16.3%
2.1%
3.7%
19.1%
8.0%
2.0%
15.9%
2.5%
4.2%
12.3%
32.5%
8.1%
19.8%
16.3%
25.2%
15.9%
33.0%
9.0%
23.9%
15.7%
21.9%
14.0%
35.8%
8.8%
21.9%
12.2%
24.9%
7.8%
29.7%
6.5%
16.4%
18.0%
29.3%
10.4%
29.7%
6.6%
15.3%
10.2%
17.4%
2014 2015 2016 2017 YTD 2018 2014 2015 2016 2017 YTD 2018
2009 - YTD 2018
2005 – 2008
2004 & Prior 3.1%
5.6%
91.3%
3.5%
6.2%
90.3%
4.5%
8.1%
87.4%
5.8%
10.1%
84.1%
7.3%
12.2%
80.5%
13.0%
68.4%
18.6%
12.2%
64.8%
23.1%
16.4%
64.7%
19.0%
12.1%
77.6%
10.3%
12.0%
74.7%
13.3%
62.5%
19.5%
5.0%3.6%
3.7%
5.7%10.0%
47.4%
11.8%
11.7%
9.9%
9.2%
All Other States
California
Florida
Illinois
New Jersey
New York
All Other States
California
Florida
Illinois
New Jersey
New York
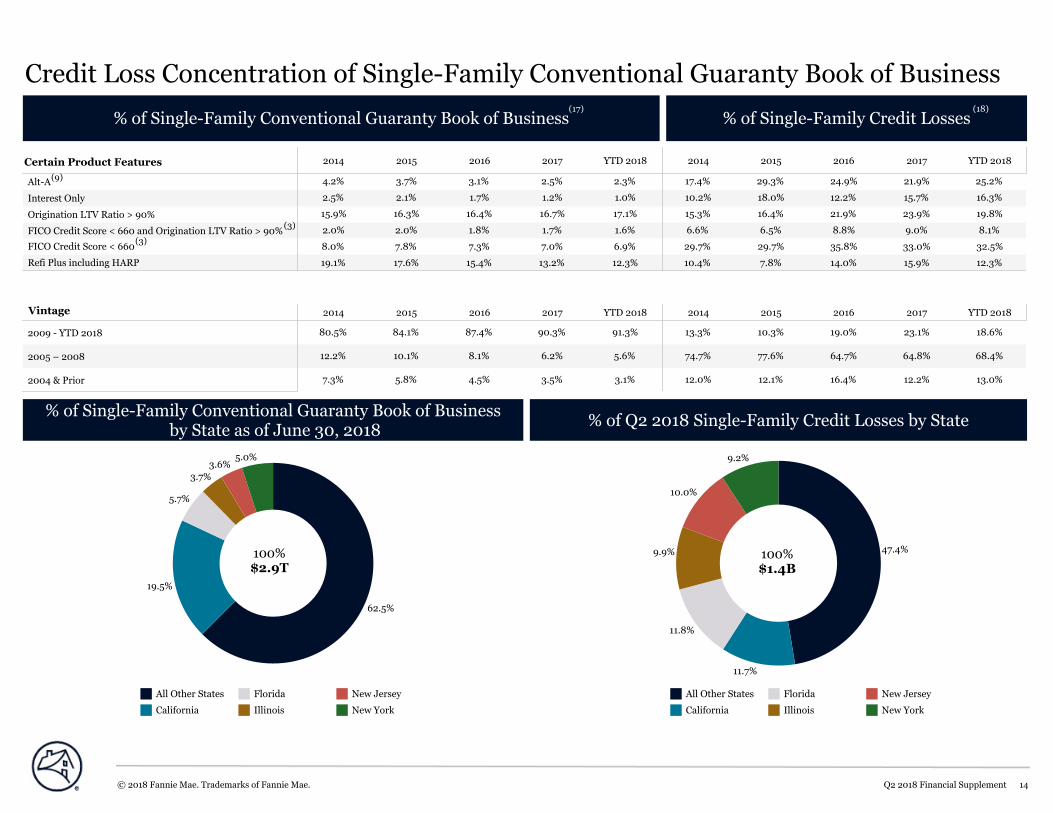
Credit Loss Concentration of Single-Family Conventional Guaranty Book of Business
% of Single-Family Conventional Guaranty Book of Business % of Single-Family Credit Losses
% of Single-Family Conventional Guaranty Book of Business by State as of June 30, 2018 % of Q2 2018 Single-Family Credit Losses by State
© 2018 Fannie Mae. Trademarks of Fannie Mae. Q2 2018 Financial Supplement 14
100%$2.9T
100%$1.4B
(17) (18)
(9)
Certain Product Features
Vintage
(3)
(3)

Yr1-Q1
Yr1-Q2
Yr1-Q3
Yr1-Q4
Yr2-Q1
Yr2-Q2
Yr2-Q3
Yr2-Q4
Yr3-Q1
Yr3-Q2
Yr3-Q3
Yr3-Q4
Yr4-Q1
Yr4-Q2
Yr4-Q3
Yr4-Q4
Yr5-Q1
Yr5-Q2
Yr5-Q3
Yr5-Q4
Yr6-Q1
Yr6-Q2
Yr6-Q3
Yr6-Q4
Yr7-Q1
Yr7-Q2
Yr7-Q3
Yr7-Q4
Yr8-Q1
Yr8-Q2
Yr8-Q3
Yr8-Q4
Yr9-Q1
Yr9-Q2
Yr9-Q3
Yr9-Q4
Yr10-Q1
Yr10-Q2
Yr10-Q3
Yr10-Q4
Yr11-Q1
Yr11-Q2
Yr11-Q3
Yr11-Q4
0.0%
2.0%
4.0%
6.0%
8.0%
10.0%
12.0%
14.0%
Cumulative Default Rate
2007
2008
2002
2009201020112012
20132014201520162017
2006
2005
2004
2003
2018
Single-Family Cumulative Default RatesCumulative Default Rates of Single-Family Conventional Guaranty Book of Business by Origination Year
2002
2003
2004
2005
2006
2007
2008
2009
2010
2011
2012*
2013*
2014*
2015*
2016*
2017*
2018*
Time Since Beginning of Origination Year
© 2018 Fannie Mae. Trademarks of Fannie Mae. Q2 2018 Financial Supplement 15
* As of June 30, 2018, cumulative default rates on the loans originated from 2012-2018 was less than 1%
(19)
Multifamily Business
© 2018 Fannie Mae. Trademarks of Fannie Mae. Q2 2018 Financial Supplement 16
Multifamily HighlightsQ2 2018 Acquisitions Guaranty Book of Business
Q2 2017 Q3 2017 Q4 2017 Q1 2018 Q2 2018$0.0
$5.0
$10.0
$15.0
$20.0
UPB ($) Billions
$20.3
$16.2
$12.3$14.5
$11.3
$13.2
$16.2
$20.3
$11.3
$14.5
Multifamily Guaranty Fee and Credit Loss (Benefit) Ratio
Q2 2017 Q3 2017 Q4 2017 Q1 2018 Q2 2018$0
$100
$200
$300
$400
UPB ($) Billions
0%
20%
40%
60%
80%
100%
Share of Multifamily Guaranty Book with
Lender Risk Sharing
$287.6$265.4$257.2
$281.3$277.3
96%96%95% 97%97%
Share of guaranty book with lender risk-sharing
UPB outstanding of Multifamily guaranty book of business
Key Highlights
Q2 2017 Q3 2017 Q4 2017 Q1 2018 Q2 2018
0
20
40
60
80
100
Basis Points
77.9 79.8 78.7 78.9 78.6
0.3 (2.4) (0.8) 0.6 0.6
Annualized credit loss (benefit) ratio
Average guaranty fee at end of period (bps)
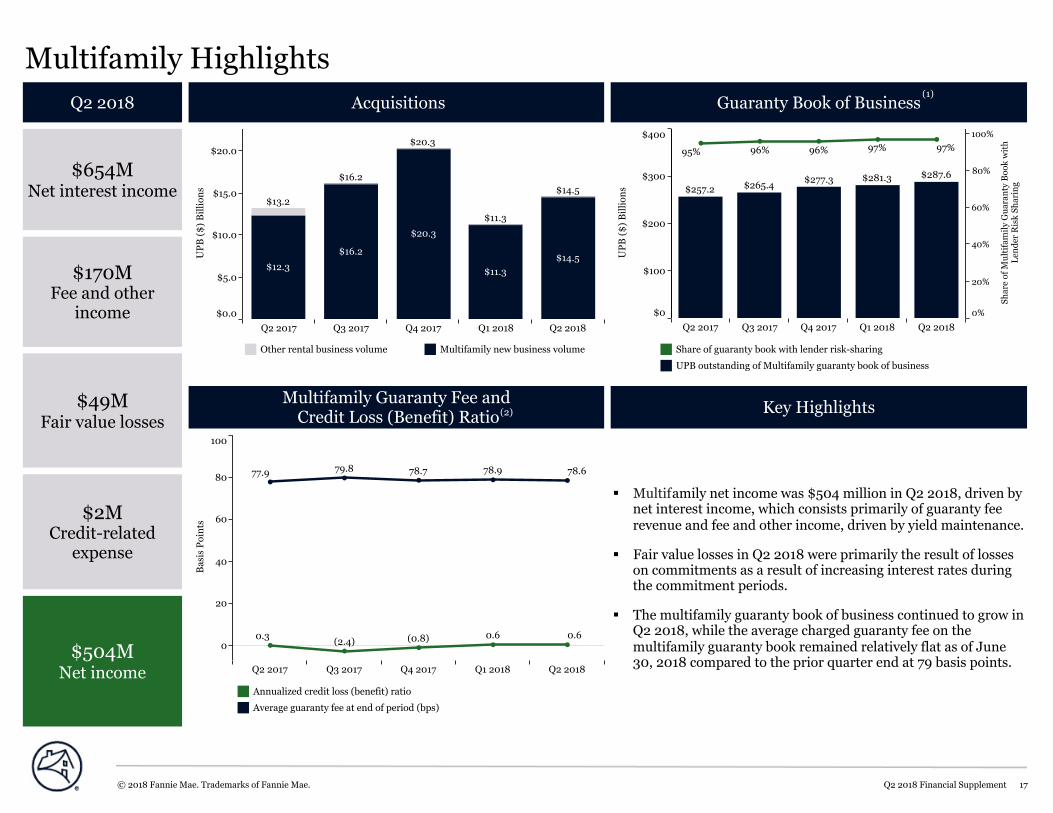
§ Multifamily net income was $504 million in Q2 2018, driven by net interest income, which consists primarily of guaranty fee revenue and fee and other income, driven by yield maintenance.
§ Fair value losses in Q2 2018 were primarily the result of losses on commitments as a result of increasing interest rates during the commitment periods.
§ The multifamily guaranty book of business continued to grow in Q2 2018, while the average charged guaranty fee on the multifamily guaranty book remained relatively flat as of June 30, 2018 compared to the prior quarter end at 79 basis points.
Other rental business volume Multifamily new business volume
$654MNet interest income
$170MFee and otherincome
$2MCredit-relatedexpense
$49MFair value losses
$504MNet income
© 2018 Fannie Mae. Trademarks of Fannie Mae. Q2 2018 Financial Supplement 17
(1)
(2)

Certain Credit Characteristics of Multifamily Acquisitions
2014 2015 2016 2017 YTD 20180%
20%
40%
60%
80%
100%
Share of Acquisitions 48% 48% 50%
49%
63%
43%37%
57%
51% 51%
% Origination LTV less than or equal to 70%
% Origination LTV greater than 70% and less than or equal to 80%
% Origination LTV greater than 80%
2014 2015 2016 2017 YTD 20180%
20%
40%
60%
80%
100%
Share of Acquisitions
80%
20%28% 23%
87%79%
72% 77%
21%13%
$0.8B
$0.8B
$0.6B
$0.9B
$0.6B
$1.0B $1.0B
$1.5B$1.5B
$1.5B
Variable Rate
Fixed Rate
2014 2015 2016 2017 YTD 2018
Total Unpaid Principal Balance (UPB) ($B)
Weighted Average Origination LTV Ratio
Loan Count
% Lender Recourse
% DUS™ 99%
100%
1,645
65%
$25.8
98%
100%
3,861
67%
$67.1
99%
99%
3,335
68%
$55.3
99%
99%
2,869
68%
$42.4
99%
99%
2,361
68%
$28.9
Certain Credit Chacteristics of Multifamily Loans by Acquisition Period
Origination Loan-to-Value Ratio Acquisitions by Note TypeTop 10 MSAs by YTD 2018Acquisition UPB
Atlanta
Dallas
Denver
Houston
Los Angeles
New York
Phoenix
San Francisco
Seattle
Washington, DC
© 2018 Fannie Mae. Trademarks of Fannie Mae. Q2 2018 Financial Supplement 18
(3)
(4)
Share ofAcquistions: 40.1%Total UPB: $10.3B
Categories are not mutually exclusive

Certain Credit Characteristics of Multifamily Guaranty Book of Business
2014 2015 2016 2017 YTD 20180%
20%
40%
60%
80%
100%
Share of Multifamily Book of Business
80% 80%
20% 20%
82% 83%
18%
81%
19% 17%$8.1B
$20.4B$25.5B
$12.2B
$13.6B
$9.0B
$8.6B
$8.4B
$6.6B
$6.6B
Atlanta
Chicago
Dallas
Houston
Los Angeles
New York
Phoenix
San Francisco
Seattle
Washington, DC
OverallBook
2004 &Eariler 2005 - 2008 2009 - 2015 2016 2017 2018
Total Unpaid Principal Balance (UPB) ($B)Average Unpaid Principal Balance ($M)Weighted Average Origination LTV Ratio% Fixed-rateLoan Count% of Book% of Small Balance Loans% Lender Recourse% DUSSerious Delinquency Rate
99%100%19%9%1,64787%65%$15.6$25.7
0.04%97%100%18%23%3,81581%67%$17.4$66.3
0.02%99%100%18%18%3,11780%68%$16.7$51.9
0.16%98%96%39%44%13,39490%66%$9.5$126.8
0.44%87%74%86%4%4,39352%65%$2.4$10.6
0.01%97%95%68%2%1,37920%71%$4.6$6.3
0.10%98%97%41%100%27,74583%67%$10.4$287.6
Conventional/ Co-op Senior Student Manufactured
100%100%28%4%94086%67%$10.7$10.1
100%99%15%4%57680%67%$18.2$10.5
0.10%98%100%2%5%69862%67%$22.1$15.4
0.11%97%97%43%87%25,53184%67%$9.9$251.6
Certain Credit Characteristics of Multifamily Book of Business by Acquisition Year, Asset Class, or Targeted Affordable Segment
UPB by Maturity Year Multifamily Book of Businessby Note TypeTop 10 MSAs by UPB
$1.8B$10.6B
$226.7B
$21.9B
$15.3B$11.3B
2018
2019
2020
2021
2022
Other
Variable Rate
Fixed Rate
Acquisition Year Asset Class or Targeted Affordable Segment
Privately Ownedwith Subsidy
0.23%95%96%41%12%3,83068%70%$9.0$34.3
© 2018 Fannie Mae. Trademarks of Fannie Mae. Q2 2018 Financial Supplement 19
(3)
(8)(4)
(7)
As of June 30, 2018Categories are not mutually exclusive
Share of Bookof Business: 100%Total UPB: $287.6B
Share of Bookof Business: 41.3%Total UPB: $118.9B
(5) (5) (5) (5) (6)
(1)

2003 2004 2005 2006 2007 2008 2009 2010 2011 2012 2013 2014 2015 2016 2017 YTD 2018
0.0%
0.5%
1.0%
1.5%
2.0%
Credit Loss Rate
0.0%
0.2%0.1%
0.0%
0.4%0.3%
0.0%
0.4%0.5%
0.9%
0.2%
0.7%
0.9%
1.2%
1.1%
0.8%0.9%
1.4%
0.3%0.3%
0.1% 0.1%0.0%
0.1%0.0% 0.0% 0.0% 0.0% 0.0% 0.0% 0.0% 0.0%
DUS Credit Loss Rate Total Credit Loss Rate Non-DUS Credit Loss Rate
2007 2008 2009 2010 2011 2012 2013 2014 2015 2016 2017 YTD 20180.00%
0.20%
0.40%
0.60%
0.80%
1.00%
1.20%
1.40%
Serious Delinquency Rate
0.55%
0.34%
0.15%
0.07% 0.05%
0.56%
0.11%
1.36%
0.44%
1.20%
0.24%
0.71%
0.21% 0.21%
0.18%0.24%
0.63%
0.50%
0.10%
0.10%
0.59%
0.11%
0.08% 0.08%0.07%0.05%
0.39%
0.92%
DUS Serious Delinquency Rate
Multifamily Total Serious Delinquency Rate
Non-DUS Serious Delinquency Rate
DUS/Non-DUS Cumulative Credit Loss Rates by Acquisition Year Through YTD 2018
Serious Delinquency Rates
2013 2014 2015 2016 2017 YTD 2018-6.0
-4.0
-2.0
0.0
2.0
4.0
6.0
Basis Points
(0.2) (0.7)
2.5
0.6
(2.7)(2.3)
Credit Loss (Benefit) Ratio
Multifamily Serious Delinquency Rates and Credit Losses
© 2018 Fannie Mae. Trademarks of Fannie Mae. Q2 2018 Financial Supplement 20
(4) (9)
(4) (8) (2) (10)

Endnotes
© 2018 Fannie Mae. Trademarks of Fannie Mae. Q2 2018 Financial Supplement 21

Financial Overview EndnotesGuaranty fee income includes the impact of a 10 basis point guaranty fee increase implemented in 2012 pursuant to the Temporary Payroll Tax Cut Continuation Act of2011, the incremental revenue from which is remitted to Treasury and not retained by the company.Home price estimates are based on purchase transactions in Fannie-Freddie acquisition and public deed data available through the end of June 2018. UPB estimates arebased on data available through the end of June 2018. Including subsequent data may lead to materially different results. Home price change is not seasonally adjusted.Source: Bureau of Economic Analysis. GDP growth rate is calculated using the quarterly annualized growth rate for the most recent period and the annual growth ratefor prior periods.Under the terms of the senior preferred stock purchase agreement, dividend payments we make to Treasury do not offset our prior draws of funds from Treasury, andwe are not permitted to pay down draws we have made under the agreement except in limited circumstances.Treasury draws are shown in the period for which requested, not when the funds were received by us. Draw requests have been funded in the quarter following a networth deficit.
(1)a(2)a(3)a(4)a(5)
© 2018 Fannie Mae. Trademarks of Fannie Mae. Q2 2018 Financial Supplement 22

Single-Family Business EndnotesSingle-family conventional loan population consists of: (a) single-family conventional mortgage loans of Fannie Mae; (b) single-family conventional mortgage loans underlyingFannie Mae MBS; and (c) other credit enhancements that we provide on single-family mortgage assets, such as long-term standby commitments. It excludes non-Fannie Maesingle-family mortgage-related securities held in our retained mortgage portfolio for which we do not provide a guaranty. Conventional refers to mortgage loans andmortgage-related securities that are not guaranteed or insured, in whole or in part, by the U.S. government or one of its agencies.Calculated based on the average guaranty fee rate for our single-family guaranty arrangements during the period plus the recognition of any upfront cash payments over anestimated average life. Excludes the impact of a 10 basis point guaranty fee increase implemented in 2012 pursuant to the TCCA, the incremental revenue from which is remitted toTreasury and not retained by us.FICO credit score is as of loan origination, as reported by the seller of the mortgage loan.Population excludes HARP and other Refi Plus loans acquired under our Refi Plus™ initiative.Calculated based on the aggregate unpaid principal balance of single-family loans for each category divided by the aggregate unpaid principal balance of loans in our single-familyconventional guaranty book of business. Loans with multiple product features are included in all applicable categories.For a description of our Alt-A loan classification criteria, refer to Fannie Mae’s 2017 Form 10-K. We discontinued the purchase of newly originated Alt-A loans in 2009, except forthose that represent the refinancing of a loan we acquired prior to 2009, which has resulted in our acquisitions of Alt-A mortgage loans remaining low and the percentage of thebook of business attributable to Alt-A to continue to decrease over time.“Serious delinquency rate" refers to single-family conventional loans that are 90 days or more past due or in the foreclosure process in the applicable origination year, productfeature, or state, divided by the number of loans in our single-family conventional guaranty book of business in that origination year, product feature, or state.The average estimated mark-to-market LTV ratio is based on the unpaid principal balance of the loan divided by the estimated current value of the property, which we calculateusing an internal valuation model that estimates periodic changes in home value. Excludes loans for which this information is not readily available.Percentage of loans in our single-family conventional guaranty book of business, measured by unpaid principal balance, included in an agreement used to reduce credit risk byrequiring collateral, letters of credit, mortgage insurance, corporate guarantees, inclusion in a credit risk transfer transaction reference pool, or other agreement that provides forour compensation to some degree in the event of a financial loss relating to the loan. Because we include loans in reference pools for our Connecticut Avenue Securities and CreditInsurance Risk Transfer credit risk transfer transactions on a lagged basis (typically about six months to one year after we initially acquire the loans), we expect the percentage ofour 2017 and 2018 single-family loan acquisitions with credit enhancement will increase in the future.The aggregate estimated mark-to-market LTV ratio is based on the unpaid principal balance of the loan as of the end of each period divided by the estimated value of the propertyas of the end of the period.Refers to loans included in an agreement used to reduce credit risk by requiring primary mortgage insurance, collateral, letters of credit, corporate guarantees, or other agreementsto provide an entity with some assurance that it will be compensated to some degree in the event of a financial loss. Excludes loans covered by credit risk transfer transactionsunless such loans are also covered by primary mortgage insurance.Outstanding unpaid principal balance represents the underlying loan balance, which is different from the reference pool balance for CAS and some lender risk-sharingtransactions.Includes mortgage pool insurance transactions covering loans with an unpaid principal balance of approximately $3 billion at issuance and approximately $5 billion outstandingas of June 30, 2018.Measured from the borrowers’ last paid installment on their mortgages to when the related properties were added to our REO inventory for foreclosures completed during the firstsix months of 2018. Home Equity Conversion Mortgages insured by the Department of Housing and Urban Development are excluded from this calculation.Consists of (a) short sales, in which the borrower, working with the servicer and Fannie Mae, sells the home prior to foreclosure for less than the amount owed to pay off the loan,accrued interest and other expenses from the sale proceeds and (b) deeds-in-lieu of foreclosure, which involve the borrower’s voluntarily signing over title to the property.Consists of (a) modifications, which do not include trial modifications, loans to certain borrowers who have received bankruptcy relief that are accounted for as troubled debtrestructurings, or repayment plans or forbearances that have been initiated but not completed; (b) repayment plans, reflects only those plans associated with loans that were 60days or more delinquent; and (c) forbearances, not including forbearances associated with loans that were less than 90 days delinquent when entered.Based on the unpaid principal balance (UPB) of the single-family conventional guaranty book of business as of period end.Credit losses consist of (a) charge-offs net of recoveries and (b) foreclosed property expense (income). Percentages exclude the impact of recoveries that have not been allocated tospecific loans.Defaults include loan foreclosures, short sales, sales to third parties at the time of foreclosure and deeds-in-lieu of foreclosure. Cumulative Default Rate is the total number ofsingle-family conventional loans in the guaranty book of business originated in the identified year that have defaulted, divided by the total number of single-family conventionalloans in the guaranty book of business originated in the identified year. Data as of June 30, 2018 is not necessarily indicative of the ultimate performance of the loans andperformance is likely to change, perhaps materially, in future periods.
(1)aaa(2)aa(3)(4)(5)a(6)aa(7)a(8)a(9)aaaa(10)a(11)aa(12)a(13)a(14)a(15)a(16)aa(17)(18)a(19)a
© 2018 Fannie Mae. Trademarks of Fannie Mae. Q2 2018 Financial Supplement 23

Multifamily Business EndnotesOur multifamily guaranty book of business consists of: (a) multifamily mortgage loans of Fannie Mae; (b) multifamily mortgage loans underlying Fannie Mae MBS;and (c) other credit enhancements that we provide on multifamily mortgage assets. It excludes non-Fannie Mae multifamily mortgage-related securities held in ourretained mortgage portfolio for which we do not provide a guaranty.Credit loss (benefit) ratio represents the credit loss or benefit for the period divided by the average unpaid principal balance of the multifamily guaranty book ofbusiness for the period. Credit benefits are the result of recoveries on previously charged-off amounts.Represents the percentage of loans with lender risk-sharing agreements in place, measured by unpaid principal balance.Under the Delegated Underwriting and Servicing (DUS) program, Fannie Mae acquires individual, newly originated mortgages from specially approved DUS lendersusing DUS underwriting standards and/or DUS loan documents. Because DUS lenders generally share the risk of loss with Fannie Mae, they are able to originate,underwrite, close and service most loans without our pre-review.See https://www.fanniemae.com/multifamily/products for definitions. Loans with multiple product features are included in all applicable categories.The Multifamily Affordable Business Channel focuses on financing properties that are under an agreement that provides long-term affordability, such as propertieswith rent subsidies or income restrictions.Multifamily loans with an original unpaid balance of up to $3 million nationwide or up to $5 million in high cost markets.Multifamily loans are classified as seriously delinquent when payment is 60 days or more past due.Cumulative credit loss rate is the cumulative credit losses (gains) through June 30, 2018 on the multifamily loans that were acquired in the applicable period, as apercentage of the total acquired unpaid principal balance of multifamily loans in the applicable period.Credit loss (benefit) ratio is annualized for the most recent period.
(1)aa(2)a(3)(4)aa(5)(6)a(7)(8)(9)a(10)
© 2018 Fannie Mae. Trademarks of Fannie Mae. Q2 2018 Financial Supplement 24
Recommended