International Journal of Scientific and Research Publications, Volume 7, Issue 2, February 2017 194 ISSN 2250-3153
www.ijsrp.org
Factors Influence Satisfaction and Loyalty towards
Corporate Partner Program Garuda Indonesia
Fajar Ropi*, Idqan Fahmi**, Gendut Suprayitno ***
*)**)Graduate Program of Management and Business, Bogor Agricultural University, Jl. Raya Pajajaran, Bogor 16151
***)Graduate Program of Industrial Engineering, Institute Sains Teknologi Nasional (ISTN), Jl Duren 3, Pasar Minggu, Jakarta – Indonesia
Abstract- This study aimed to analyze the impact of product
quality on satisfaction and user loyalty of Garuda Indonesia
Corporate Partner Program, due to good product will drive user
satisfaction so that loyalty to a product that will finally provide
more benefits to the company and then to analyze competitive
business in airline industry The data analysis techniques were
Descriptive Statistic, Fishbein Model and Structural Equation
Modelling (SEM). The results indicate that the strategic priority
in airline industry for corporate partner. It is a strategy of
providing all the attribute and factor that affect the selection of
corporate partner in airline industry.
Index Terms- Airlines Industry, Model Fishbein, SEM, strategy
corporate partner
I. INTRODUCTION
conomic growth in Indonesia has given impact for the
society in choosing mode of transport. There are more
people who shifted from using ship and land transport to aviation
transport. This behavior changes are a good opportunity for
aviation business such as airline companies. Based on the report
from IATA in 2005, the number of airline passengers increase by
16%-20% each year. It is estimated that the number will continue
to increase in 2021 where there will be 180 million people using
aviation transportation.
Sumber: IATA, tahun 2005
Graph 1 Growth Projection of Aviation Passengers
The growth should have been a good opportunity for
airplane companies to gain lot of profit. However, the profit of
the airplane companies is not as high as the profit from other
sectors such as banking or mining companies. The profit of
airline companies is around 4%-7% each year, while other
sectors could gain up to 25% of profit each year. In addition, the
cost of operational from airplane transport has raised up to 15%.
Little profit and high cost of typical airlines business should
drive airplane companies to work harder and think creative in
order to gain maximum profit.
Garuda Indonesia is one of the biggest airline companies in
Indonesia who operates on domestic and international routes.
Garuda Indonesia always try to improve their performance to
keep its position to compete with other airlines. Garuda
Indonesia try to increase their sales by manage their services and
adjust it with consumer needs. Table 1 showed market share of
airline companies in Indonesia.
Table 1. Market Share Airlines for Domestic and International Routes
Domestic International
Year Rank Top 3 Airlines Share Rank Top 3 Airlines Share
2010
1 Lion Air 39.71% 1 Garuda Indonesia 13.41%
2 Garuda Indonesia 26.18% 2 Air Asia Indonesia 13.08%
3 Batavia Air 7.83% 3 Singapore Airlines 10.07%
2011
1 Lion Air 43.07% 1 Air Asia Indonesia 15.90%
2 Garuda Indonesia 29.04% 2 Garuda Indonesia 14.19%
3 Batavia Air 9.38% 3 Air Asia 9.17%
2012 1 Lion Air 46.66% 1 Air Asia Indonesia 15.56%
2 Garuda Indonesia 25.27% 2 Garuda Indonesia 14.07%
E

International Journal of Scientific and Research Publications, Volume 7, Issue 2, February 2017 195
ISSN 2250-3153
www.ijsrp.org
3 Batavia Air 7.04% 3 Air Asia 9.29%
2013
1 Lion Air 48.57% 1 Air Asia Indonesia 15.32%
2 Garuda Indonesia 21.89% 2 Garuda Indonesia 13.58%
3 Sriwijaya Air 7.72% 3 Air Asia 8.89%
2014
1 Lion Air 40.36% 1 Air Asia Indonesia 14.61%
2 Garuda Indonesia 26.41% 2 Garuda Indonesia 13.13%
3 Sriwijaya Air 8.29% 3 Air Asia 9.06%
Source : Pax-is, 2015
Based on Table 1, market shares of Garuda Indonesia from
2010 to 2014 were not high especially compare to other airlines
who operate shorter in Indonesia than Garuda Indonesia.
Garuda Indonesia as a national full service airline has big
operational cost as a main problem. The biggest sales
contribution is from the travel agent. Travel agent has
contributed up to 70% from the total revenue, followed by
corporate 20% and the rest are from web and ticketing offices.
Garuda Indonesia has a corporate strategy to increase their sales
that is explained from Picture 2.
Source : Garuda Indonesia Yearly Report in 2014
Picture 2. Corporate Strategy from 2015 – 2020
Picture 2 presented corporate strategy of Garuda Indonesia
in order to win the market of airlines business. It is called
Quickwins Program, consist of Revenue Generator, Cost Drivers
Restructuring, Refinancing.
In line with revenue generatorstrategy, one of the
programs to gain revenue from corporate market is corporate
partner program. Corporate partner program is a partnership
program between Garuda Indonesia with corporations, business
to business. Corporate partner program was created in 2012, the
purpose of this program as a revenue generator and loyality
program for corparates. This program is expected to attach
corporations to use Garuda Indonesia services by giving the
benefits for employees and families who work in the
corporations. However the achievement from this program has
not been good. Sales achievement from 2012 to 2015 of
corporate program is showed on Table 2
Table 2. Sales achievement for CorporatePartnerprogram
Year Total Sales Target Ach Rev Cab Jakarta
2012 1,014,850,626,326 1,800,020,200,200 56% 20,199,360,511,000
2013 989,916,461,229 1,380,032,020,000 72% 23,138,506,204,000
2014 1,096,565,557,842 1,523,330,232,232 72% 24,870,852,853,000
2015 949,341,985,540 1,653,751,271,403 57% 26,127,576,079,000
Based on table 2, the number of sales from 2012 to 2014
was fluctuative and has never achived the target. This indicate
that the corporate partner program has not met the corporate
account needs. In order to improve the program, it is important to
analyse the customer satisfication factors and loyality factors
from the corporate partner program of Garuda Indonesia
This study was aimed to examine factors which influence
customer satisfactions and loyalities towards corporate partner
program of Garuda Indonesia. The respondents of this study were
corporate accounts or corporates who have been worked with
Garuda Indonesia in a corporate partner program. Intense
competition in Indonesian airline business has put the curtomers
in strong bargaining position in choosing airlines. Understanding
customer’s needs help airlines to formulate effective strategy and
by understanding factors affecting customers in choosing airlines
so that Garuda Indonesia could developan optimal program.
Problem Formulation
Related to the conditions of airlines industry in Indonesia
mentioned above, to increase of the satisfaction and loyalty.
Therefore, it is important to thoroughly review factors related to
the increase satisfaction and loyalty in airlines industry
Based on the background mentioned earlier, the research
problem formulated is:
1. How does customers satisfaction influence the loyalty of
Garuda Indonesia corporate partner program?
2.What are factorsmost affectingin selecting the program
corporate partner of the airlines?
International Journal of Scientific and Research Publications, Volume 7, Issue 2, February 2017 196
ISSN 2250-3153
www.ijsrp.org
3.What strategies can be recommended to develop
corporate partner program Garuda Indonesia ?
Research Purpose
Based on the problem formulation, this research is done
with the purpose as follows:
1.To analyze the effect of customer satisfaction on
consumer loyalty program corporate partner Garuda Indonesia
2.To identify the factors that most influence in selecting
corporate cooperation partner of the airline
3.To formulate strategy for the program corporate partner
of PT Garuda Indonesia
II. RESEARCH METHODOLOGY
The study was limited to selected corporate accounts of
Garuda Indonesia on Jakarta branch. . Primary data was
collected by quesionaires. The Quesionaires were spread to the
corporate account by visiting them and make an interviews to get
information
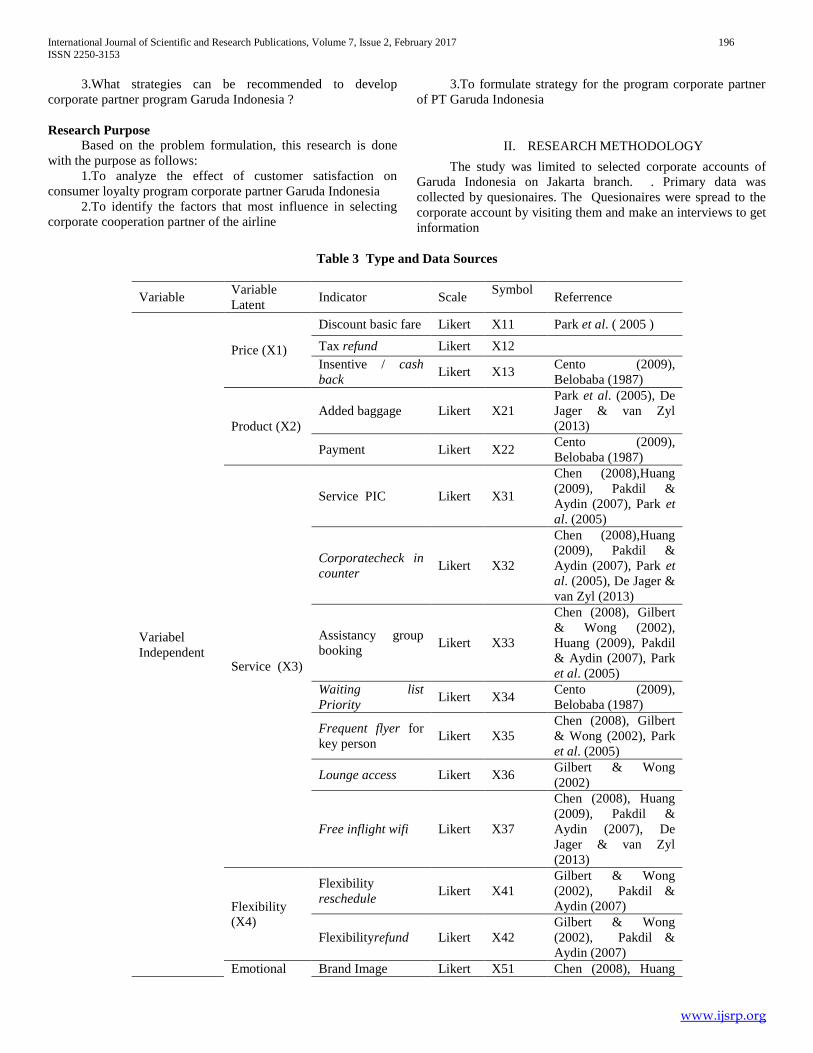
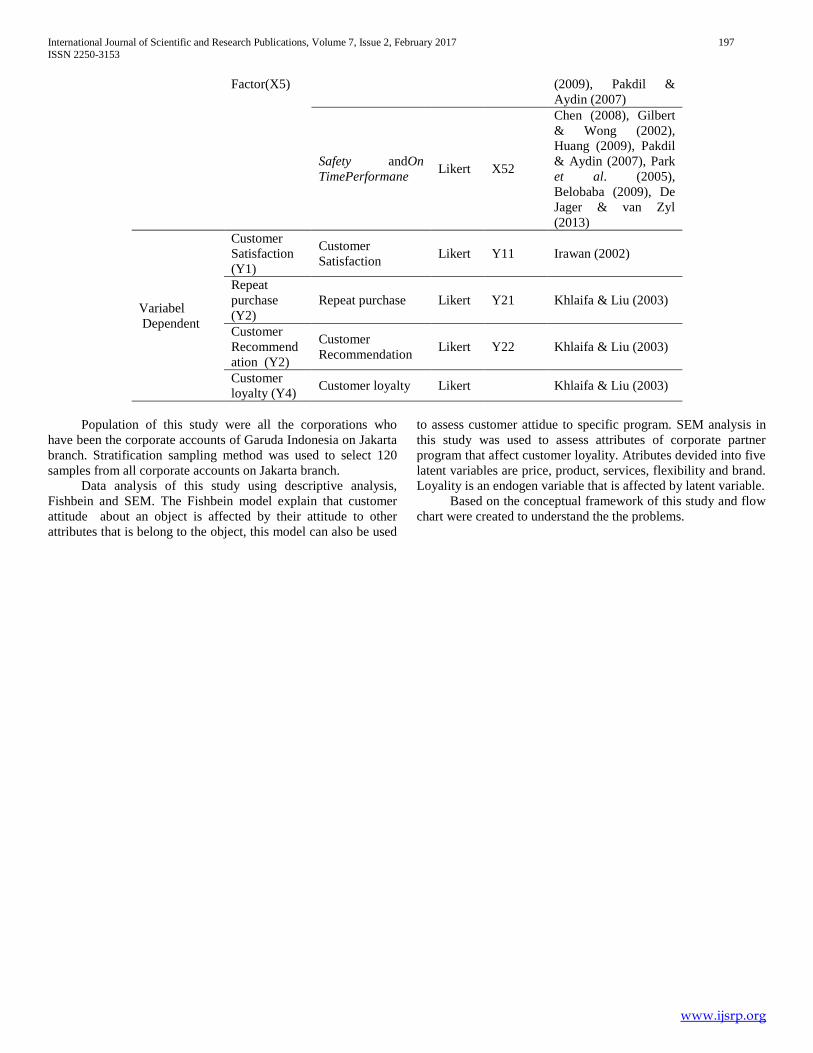
Table 3 Type and Data Sources
Variable Variable
Latent Indicator Scale
Symbol Referrence
Variabel
Independent
Price (X1)
Discount basic fare Likert X11 Park et al. ( 2005 )
Tax refund Likert X12
Insentive / cash
back Likert X13
Cento (2009),
Belobaba (1987)
Product (X2)
Added baggage Likert X21
Park et al. (2005), De
Jager & van Zyl
(2013)
Payment Likert X22 Cento (2009),
Belobaba (1987)
Service (X3)
Service PIC Likert X31
Chen (2008),Huang
(2009), Pakdil &
Aydin (2007), Park et
al. (2005)
Corporatecheck in
counter Likert X32
Chen (2008),Huang
(2009), Pakdil &
Aydin (2007), Park et
al. (2005), De Jager &
van Zyl (2013)
Assistancy group
booking Likert X33
Chen (2008), Gilbert
& Wong (2002),
Huang (2009), Pakdil
& Aydin (2007), Park
et al. (2005)
Waiting list
Priority Likert X34
Cento (2009),
Belobaba (1987)
Frequent flyer for
key person Likert X35
Chen (2008), Gilbert
& Wong (2002), Park
et al. (2005)
Lounge access Likert X36 Gilbert & Wong
(2002)
Free inflight wifi Likert X37
Chen (2008), Huang
(2009), Pakdil &
Aydin (2007), De
Jager & van Zyl
(2013)
Flexibility
(X4)
Flexibility
reschedule Likert X41
Gilbert & Wong
(2002), Pakdil &
Aydin (2007)
Flexibilityrefund Likert X42
Gilbert & Wong
(2002), Pakdil &
Aydin (2007)
Emotional Brand Image Likert X51 Chen (2008), Huang
International Journal of Scientific and Research Publications, Volume 7, Issue 2, February 2017 197
ISSN 2250-3153
www.ijsrp.org
Factor(X5) (2009), Pakdil &
Aydin (2007)
Safety andOn
TimePerformane Likert X52
Chen (2008), Gilbert
& Wong (2002),
Huang (2009), Pakdil
& Aydin (2007), Park
et al. (2005),
Belobaba (2009), De
Jager & van Zyl
(2013)
Variabel
Dependent
Customer
Satisfaction
(Y1)
Customer
Satisfaction Likert Y11 Irawan (2002)
Repeat
purchase
(Y2)
Repeat purchase Likert Y21 Khlaifa & Liu (2003)
Customer
Recommend
ation (Y2)
Customer
Recommendation Likert Y22 Khlaifa & Liu (2003)
Customer
loyalty (Y4) Customer loyalty Likert Khlaifa & Liu (2003)
Population of this study were all the corporations who
have been the corporate accounts of Garuda Indonesia on Jakarta
branch. Stratification sampling method was used to select 120
samples from all corporate accounts on Jakarta branch.
Data analysis of this study using descriptive analysis,
Fishbein and SEM. The Fishbein model explain that customer
attitude about an object is affected by their attitude to other
attributes that is belong to the object, this model can also be used
to assess customer attidue to specific program. SEM analysis in
this study was used to assess attributes of corporate partner
program that affect customer loyality. Atributes devided into five
latent variables are price, product, services, flexibility and brand.
Loyality is an endogen variable that is affected by latent variable.
Based on the conceptual framework of this study and flow
chart were created to understand the the problems.

International Journal of Scientific and Research Publications, Volume 7, Issue 2, February 2017 198
ISSN 2250-3153
www.ijsrp.org
Keterangan:
= Research Scope
= Research flour
Picture 3. Conseptual Framework of Factors Influence Satisfaction and Loyality Towards Corporate Partner Program Garuda
Indonesia
Business competition in airlines industry
Garuda Indonesia strategy
Corporate Partner Program
Recommendation
Price
Product
Service
Flexibility
Emotional
Factors
factorsmost
affecting in
selecting the
program
corporate partner
of the airlines
Customer
Satisfaction
Customer
Loyalty

International Journal of Scientific and Research Publications, Volume 7, Issue 2, February 2017 199
ISSN 2250-3153
www.ijsrp.org
Picture 4. Path Diagram SEM
Tax Refund
Payment
Discount
Basic Fare
Payment
Added
Baggage
Insentive
PIC
CheckIn
Counter
Assistancy
group
Lounge
access
Freq Flyer
Waiting
listPriority
FlexibilityRef
und
Wi-Fi
Brand Image
FlexibilityRes
cheduled
Safety and
Ontime
Performance
Price
Product
Service
Flexibility
Emotional
Faktor
CustSatisfa
ction
Loyalty
Customer
Recommendation
Repeat
Purchase
Overall Cust
Satisfaction
International Journal of Scientific and Research Publications, Volume 7, Issue 2, February 2017 200
ISSN 2250-3153
www.ijsrp.org
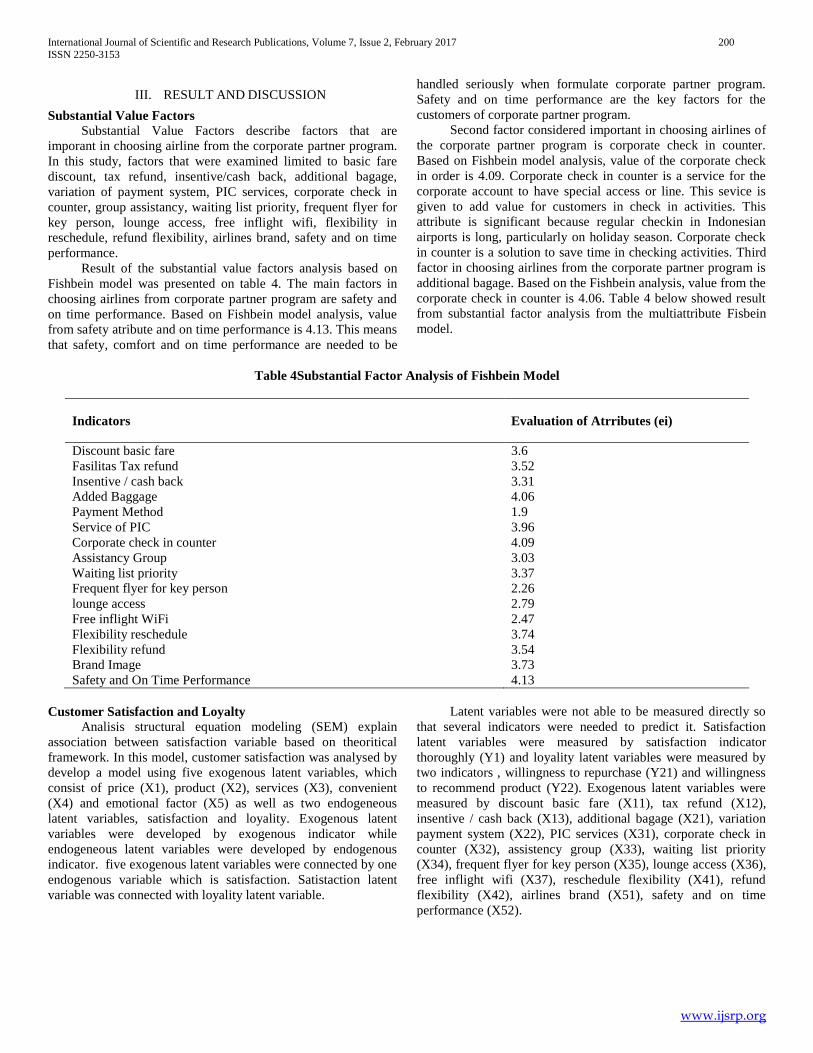
III. RESULT AND DISCUSSION
Substantial Value Factors
Substantial Value Factors describe factors that are
imporant in choosing airline from the corporate partner program.
In this study, factors that were examined limited to basic fare
discount, tax refund, insentive/cash back, additional bagage,
variation of payment system, PIC services, corporate check in
counter, group assistancy, waiting list priority, frequent flyer for
key person, lounge access, free inflight wifi, flexibility in
reschedule, refund flexibility, airlines brand, safety and on time
performance.
Result of the substantial value factors analysis based on
Fishbein model was presented on table 4. The main factors in
choosing airlines from corporate partner program are safety and
on time performance. Based on Fishbein model analysis, value
from safety atribute and on time performance is 4.13. This means
that safety, comfort and on time performance are needed to be
handled seriously when formulate corporate partner program.
Safety and on time performance are the key factors for the
customers of corporate partner program.
Second factor considered important in choosing airlines of
the corporate partner program is corporate check in counter.
Based on Fishbein model analysis, value of the corporate check
in order is 4.09. Corporate check in counter is a service for the
corporate account to have special access or line. This sevice is
given to add value for customers in check in activities. This
attribute is significant because regular checkin in Indonesian
airports is long, particularly on holiday season. Corporate check
in counter is a solution to save time in checking activities. Third
factor in choosing airlines from the corporate partner program is
additional bagage. Based on the Fishbein analysis, value from the
corporate check in counter is 4.06. Table 4 below showed result
from substantial factor analysis from the multiattribute Fisbein
model.
Table 4Substantial Factor Analysis of Fishbein Model
Indicators Evaluation of Atrributes (ei)
Discount basic fare 3.6
Fasilitas Tax refund 3.52
Insentive / cash back 3.31
Added Baggage 4.06
Payment Method 1.9
Service of PIC 3.96
Corporate check in counter 4.09
Assistancy Group 3.03
Waiting list priority 3.37
Frequent flyer for key person 2.26
lounge access 2.79
Free inflight WiFi 2.47
Flexibility reschedule 3.74
Flexibility refund 3.54
Brand Image 3.73
Safety and On Time Performance 4.13
Customer Satisfaction and Loyalty
Analisis structural equation modeling (SEM) explain
association between satisfaction variable based on theoritical
framework. In this model, customer satisfaction was analysed by
develop a model using five exogenous latent variables, which
consist of price (X1), product (X2), services (X3), convenient
(X4) and emotional factor (X5) as well as two endogeneous
latent variables, satisfaction and loyality. Exogenous latent
variables were developed by exogenous indicator while
endogeneous latent variables were developed by endogenous
indicator. five exogenous latent variables were connected by one
endogenous variable which is satisfaction. Satistaction latent
variable was connected with loyality latent variable.
Latent variables were not able to be measured directly so
that several indicators were needed to predict it. Satisfaction
latent variables were measured by satisfaction indicator
thoroughly (Y1) and loyality latent variables were measured by
two indicators , willingness to repurchase (Y21) and willingness
to recommend product (Y22). Exogenous latent variables were
measured by discount basic fare (X11), tax refund (X12),
insentive / cash back (X13), additional bagage (X21), variation
payment system (X22), PIC services (X31), corporate check in
counter (X32), assistency group (X33), waiting list priority
(X34), frequent flyer for key person (X35), lounge access (X36),
free inflight wifi (X37), reschedule flexibility (X41), refund
flexibility (X42), airlines brand (X51), safety and on time
performance (X52).

International Journal of Scientific and Research Publications, Volume 7, Issue 2, February 2017 201
ISSN 2250-3153
www.ijsrp.org
Table 5 Goodness of Fit SEM
Goodness-of-Fit Cutt-off-Value Result conclution
Chi square (p-value) > 0.05 0.000 Not good fit
RMSEA ≤ 0.08 0.078 good fit
GFI ≥ 0.90 0.92 good fit
CFI ≥ 0.90 0.93 good fit
IFI ≥ 0.90 0.93 good fit
Result of Goodness of fit using chi-square testing showed
that p-value 0.000 < 0.05 so that Ho was rejected and Ha was
accepted which means that model has been created was not
goodness of fit. One of the weaknesses of SEM model was
sensitivity with number of samples. Big samples are tend to give
high chi square that result model is not goodness of fit. Therefore
SEM gives alternative of using other goodness of fit. RMSEA
criteria resulted value 0.078 ≤ 0.08 that means the model
resulted was goodnes of fit. Using of the other goodness of fit
criteria were GFI, CFI and IFI resulted > 0.90, which means
model that has been resulted was goodness of fit. Conclussion of
several indicators resulted goodness of fit means that hypothesis
testing could be done.
Table 6 The result of the influence of latent variables
Variable Standardized loading
faktor |t-hit| Conclusion
Price (X1) Satisfaction (Y1) 0.08 0.60 Not Significant
Product (X2) Satisfaction(Y1) 0.17 2.22 Significant
Service (X3) Satisfaction(Y1) 0.41 6.89 Significant
Flexibility (X4)Satisfaction(Y1) 0.25 2.03 Significant
Emotional Factor(X5) Satisfaction(Y1) 0.51 5.03 Significant
Satisfaction (Y1) Loyalty(Y2) 0.57 8.94 Significant
Remark: T Value> 1.96 = significant
Hypothesis testing result showed that X2,X3,X4 and X5
have significantly positive effect on satisfaction with loading
factor values are 0.17, 0.41, 0.25 and 0.51, which means that
increase of X2,X3,X4 and X5 will increase the satiscation value.
Meanwhile X1 has no significant effect on satisfaction because
of value |t-hit| < 1.96. Satisfaction was more affected by X5
compare to X2,X3 and X4 since X5 has higher factor loading
value compare to X2, X3 and X4. Furthermore, satifaction value
has a significantly positive effect to loyality (0.57) with t-hit
8.94 > t-tabel 1.96, which means that the higher satisfaction
value, the higher loyality value.
Path diagram of satisfaction and loyality model of the
corporate account customer Garuda Indonesia with Lisrel 8.51
analysis presented on picture 5 and picture 6. Picture 6 showed
that all exogenous variables give positive effects on endogenous
variables. This showed that all variables have positive effect on
customer’s satisfaction. After the correlation inter model of
Standarized Solution was analysed, there were analysis between
one variable correlation and its significant and not significat
effect on endogenous variable.
International Journal of Scientific and Research Publications, Volume 7, Issue 2, February 2017 202
ISSN 2250-3153
www.ijsrp.org
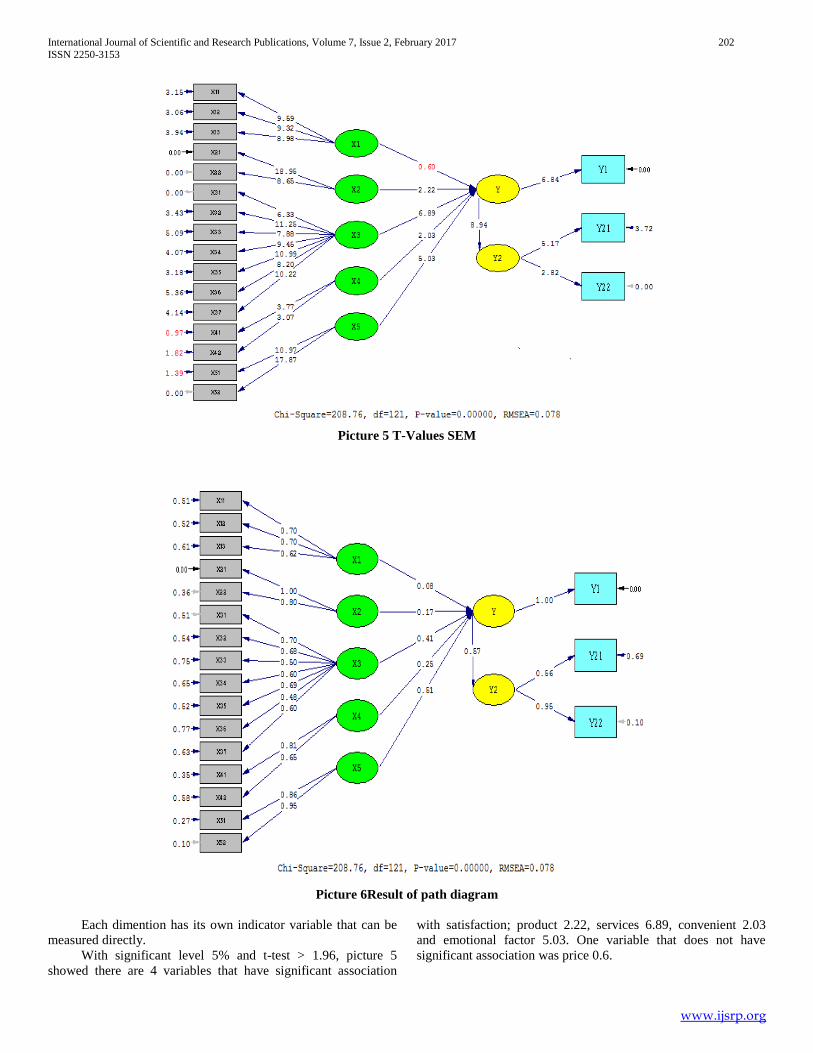
Picture 5 T-Values SEM
Picture 6Result of path diagram
Each dimention has its own indicator variable that can be
measured directly.
With significant level 5% and t-test > 1.96, picture 5
showed there are 4 variables that have significant association
with satisfaction; product 2.22, services 6.89, convenient 2.03
and emotional factor 5.03. One variable that does not have
significant association was price 0.6.

International Journal of Scientific and Research Publications, Volume 7, Issue 2, February 2017 203
ISSN 2250-3153
www.ijsrp.org
Table 6 presented that the highest satisfaction was from
emotional dimention factor (0.51), followed by service variable
(0.41), service variable (0.25), product variable (0.17).
Meanwhile satisfaction was not affected significantly by price
(0.08). Variables that affect customer satisfaction were safety and
on time performance (X52) at 0.4896, then safety and comfort
variable (X51) at 0.4386, service variable from PIC (X31) at
0.2788, frequent flyer variable for key persen (X35) at 0.2829
and corporate check in counter (X31) with contribution value
0.2788.
The extent of satisfaction dimention effect on loyality has
t-count lever 8.94 and estimation value 0.5. It showed that
customer satisfaction will develop loyality customers. Loyal
customers will repeat the order and give recommendation to
other people.
Table 7 SEM Result for variable latent
Sym Atribut Load Coef Contribution Rank
Factor Construct
X11 Discount basic fare 0.7 0.08 0.056 14
X12 Tax refund 0.7 0.08 0.056 14
X13 Insentive / cash back 0.62 0.08 0.0496 16
X21 Added Baggage 1 0.17 0.17 11
X22 Payment Method 0.8 0.17 0.136 13
X31 Service from PIC 0.7 0.41 0.287 3
X32 Corporate check in counter
0.68 0.41 0.2788 5
X33 Assistancy group booking 0.5 0.41 0.205 8
X34 Waiting list priority 0.6 0.41 0.246 7
X35 Frequent flyer for key person 0.69 0.41 0.2829 4
X36 Lounge access 0.48 0.41 0.1968 10
X37 Free inflight WiFi 0.6 0.41 0.246 6
X41 Flexibility reschedule 0.81 0.25 0.2025 9
X42 Flexibility refund 0.65 0.25 0.1625 12
X51 Brand Image
0.86 0.51 0.4386 2
X52 Safety and On Time Performance 0.96 0.51 0.4896 1
Correlation between SEM Analysis and Fishbein
SEM Analysis was used to measure latent variable effect
to construct variable of performance of corporate partner
program Garuda Indonesia. Meanwhile, Fishbein model was
used to analyse attitude and preference effect on decision making
in choosing airlines and if it is compare to other airlines
company. Both of those analysis tools give sustainable result
that can help a study in choosing its managerial implication and
it is not only limited to corporate partner program Garuda
Indonesia, but also comparison with other competitors in airlines
industry.
SEM Analysis showed that satisfaction and loyaity have a
positive value and significant for the performance of corporate
partner program Garuda Indonesia.
If the fact that the performance of the program has not
been giving a good result, therefore a study is needed to compare
the corporate partner program Garuda Indonesia with other
airline’s corporate partner programs by using a Fishbein Model.
It aims to understand strengths and weaknesses of corporate
partner program Garuda Indonesia, particularly compare with
other airlines.
On Fishbein model, corporate partner program was
analysed to recognize main factors in choosing corporate partner
program in airlines industry. The object of Fishbein model are
Lion Group and Singapore Airlines.
Based on the beliefs value (bi) on table 8, Garuda
Indonesia overall point was better than Singapore airlines and
Lion group. Meanwhile, respondents were believe that the main
point from Garuda Indonesia compare to Lion group and
Singapore airlines were on basic fare discount, tax refund
facility, additional bagage for company, PIC services, corporate
check in counter, lounge access facility. Those variables were the
main point that can be used by Garuda Indonesia in promoting
the corporate partner program to the customers.
The main point of Singapore airlines compare to other
airlines based on the respondents were waiting list priority,
frequent flyer for key person, lounge access facility, free inflight
wi-fi, refund flexibility, reschedule flexibility, airlines brand in
terms of safety, comfort and on time performance. Meanwhile
for Lion air, the main point that are better compare to Garuda
Indonesia and Singapore airlines were incentive model or cash
back and variety of payment system. Those strength can be used

International Journal of Scientific and Research Publications, Volume 7, Issue 2, February 2017 204
ISSN 2250-3153
www.ijsrp.org
by company in order to create strategy of corporate partner program.
Table 8Fishbein model result for attitudes
Atrributes Evaluotion of Attributes (ei) Garuda Lion Group SQ
bi ei * bi Bi ei * bi bi ei * bi
Discount basic fare 3.60 3.43 12.33 3.37 12.12 3.88 13.98
Tax refund 3.52 4.23 14.89 1.94 6.83 1.63 5.71
Insentive / cash back 3.31 3.33 11.03 3.99 13.21 3.18 10.53
Added Baggage 4.06 3.65 14.81 3.42 13.87 2.93 11.87
Payment Method 1.90 3.24 6.16 4.17 7.92 2.93 5.57
Service from PIC 3.96 3.28 13.00 2.91 11.51 2.96 11.71
Corporate check in counter 4.09 3.33 13.64 2.81 11.49 2.88 11.80
Assistancy group booking 3.03 3.02 9.13 2.93 8.87 3.22 9.73
Waiting list priority 3.37 3.01 10.13 2.94 9.90 4.54 15.29
Frequent flyer for key person 2.26 3.08 6.94 2.53 5.72 3.19 7.21
Lounge access 2.79 3.18 8.89 2.99 8.35 3.18 8.86
Free inflight WiFi 2.47 3.10 7.65 3.19 7.87 3.18 7.83
Flexibility reschedule 3.74 2.83 10.60 3.04 11.38 3.68 13.78
Flexibility refund 3.54 3.20 11.33 2.93 10.36 3.97 14.05
Brand Image 3.73 3.82 14.22 2.43 9.03 4.06 15.12
Safety and On Time Performance 4.13 3.92 16.19 2.48 10.26 4.09 16.91
Total
180.92
158.70
179.96
Managerial Implication
First priority that should be done by Garuda Indonesia is
having lots of promotion activities by focus on their strengths
which are safety and on time performance. Garuda Indonesia
should create program or some kind of cooperation that could be
adjusted based on the company needs.
IV. CONCLUSION AND SUGGESTION
Conclusion
The increasingly fierce competition is a challenge for
airlines to win the market. Each airline has their own strategy in
order to win the competition.
First priority that should be done by Garuda Indonesia is
having lots of promotion activities by focus on their strengths
which are safety and on time performance. Garuda Indonesia
should create program or some kind of cooperation that could be
adjusted based on the company needs.
Suggestion
Garuda Indonesia performances such as company strategy,
products and human resources should be improved along with
development and transformation of airlines industry.
Management capability to understand industrial movements is
needed to adopt and prioritize company strategy. Further study is
needed to get comprehensive analysis.
REFERENCES
[1] Belobaba P. 1987. Survey paper-airline yield management an overview of seat inventory control.Transportation Science. 21(2):63-73.
[2] Cento A. 2009. The Airline Industry: Challenges in the 21st Century (Contributions to Economics). Heidelberg (DE): Physica Verlag Heidelberg.
[3] Chen C. 2008. Investigating structural relationships between service quality, perceived value, satisfaction, and behavioral intentions of air passengers: Evidence from Taiwan. Transportation Research Part A, 42 (1):709-717
[4] Gilbert D, Wong R. 2002. Passenger expectations and airline services: a Hong Kong based study. Tourism Management. 24:519–532.
[5] Huang Y. 2009. The effect of airline service quality on passengers’ behavioral intentions using SERVQUAL: A Taiwan case study. Journal of the Eastern Asia Society for Transportation Studies. 7(8):1-14.
[6] Irawan H. 2002. Sepuluh Prinsip Kepuasan Pelanggan. Jakarta (ID): PT Elex Media Komputindo.
[7] De Jager JW, Van Zyl D. 2013. Airline service quality in South Africa and Malaysia - An international customer expectations approach.Journal of Air Transportation Management. 5(11):752-761.
[8] Khalifa M, Liu V. 2003. The state of research on information system satisfaction. Journal of Information Technology Theory and Application. 5(4):37-49.
[9] Pakdil F, Aydm O. 2007. Expectations and perceptions in airline service: An analysis using weighted SERVQUAL scores. Journal of Air Transportation Management. 13:229-237.
[10] Park JW, Robertson R, Wu CL. 2004. The effect on airline service on passengers’ behavioral intentions: a Korean case study. Journal of Air Transportation Management. 10:435-439.
[11] Tse DK, Wilton PC. 1998. Models of consumer satisfaction formation : An extension. Journal of Marketing Research. 25:204-212
AUTHORS
First Author – Fajar Ropi, Graduate Program of Management
and Business, Bogor Agricultural University
Jl. Raya Pajajaran, Bogor 16151
Second Author – Idqan Fahmi, Graduate Program of
Management and Business, Bogor Agricultural University
Jl. Raya Pajajaran, Bogor 16151
Third Author – Gendut Suprayitno, Graduate Program of
Industrial Engineering, Institut Sains Teknologi Nasional (ISTN)
Jl Duren 3, Pasar Minggu, Jakarta – Indonesia

International Journal of Scientific and Research Publications, Volume 7, Issue 2, February 2017 205
ISSN 2250-3153
www.ijsrp.org
Recommended